
Variability of the chemical compositions of fatty acids, tocopherols and lipids antioxidant activities, obtained from the leaves of Pistacia lentiscus L. growing in Algeria
Abstract
BACKGROUND:
One of the objectives of food industry is to seek new resources of oil that preferably presents nutritional values. For human health, fats and particularly vegetable oils are considered as an important source of energy when glucose is not available. In addition, the search for effective, natural compounds with antioxidant activity has been intensified in recent years to replace the synthetic products.
OBJECTIVE:
The aim of the present work was to determine the fatty acids profile (and variability) of the lipid fractions extracted from five different populations of the leaves of Pistacia lentiscus L. growing in Algeria. In addition, the antioxidant activities of the lipidic fractions were also determined.
METHODS:
The chemical compositions of tocopherols were also analyzed by HPLC for the first time for this plant part. The chemical percentage variability (presence of two main distinguished clusters) of the fatty acids was discussed using statistical analysis methods (Agglomerative Hierarchical Clustering “AHC” and principal component analysis “PCA”). The antioxidant activity of the dewaxed lipid fractions were investigated in vitro using two different assays: DPPH (1,1-diphenyl, 2-picrylhydrazyl) free radicals scavenging activity and β-carotene bleaching test.
RESULTS:
For the overall samples, the main saturated fatty acids components were capric acid (C10:0 = 2.49–13.88%), myristic acid (C14:0 = 4.71–9.12%) and palmitic acid (C16:0 = 5.31–9.03%). Alternatively, the main unsaturated fatty acids were oleic acid (C18:1w9 = 3.42–4.85%), linoleic acid (C18:2w6 = 10.94–16.99%) and most importantly α-linolenic acid (C18:3w3 = 20.92–48.92%), which is known for its multiple dietary, pharmaceutical and clinical benefits.
CONCLUSION:
The results of fatty acids methyl esters identification using GC and GC-MS showed a clear variability in the composition of fatty acids. The main result of this study illustrate the nutritional potential (richness in MUFA such as C18:1w9, presence of essential fatty acids such as C18:2w6 at all the stages of maturation, richness in omega-3 fatty acids such as C18:3w3. of the oil of P. lentiscus leaves, which can provide opportunities for rational exploitation for medicinal purposes and in the food industries. Regarding tocopherols HPLC analysis, the samples were rich in α-tocopherol (58.51–89.17% of the total tocopherols identified). Finally, and for antioxidant activity measured by β-carotene assay, the obtained values suggested good antioxidant activities when compared with antioxidants of reference.
1Introduction
The genus of Pistacia has garnered pharmaceutical attention in recent times. In this regard, the ethnomedicinal, phytochemistry, biological potencies, and risks of Pistacia genus have been reviewed [1]. Although the phytochemical composition of the genus of Pistacia has been extensively studied, there are still many new recent reports focusing in the health curative effect of their extracts [2–11]. Moreover, their nutritional value (especially for Pistachios “Pistacia vera”) is still of interest [12, 13].
Pistacia lentiscus L. (lentisk) is an evergreen bush (shrub or tree) of the Anacardiaceae family that can reach 3 m in high, belonging to the Anacardiaceae family that consists of more than eleven species. It is largely distributed in “extreme” ecosystems of the Mediterranean countries and has a large geographical and bioclimatical distribution, extending from the humid to the arid areas [14]. In Algeria, the tree is widespread in forest alone or associated with other tree species such as terebinth, olives and carob, in all coastal areas or in seaside stony areas [15]. P. lentiscus (also known in Algeria under the name of “Dharou”) is extensively used in folk medicine by rural populations in Algeria. Algeria is home to at least 3164 species of vascular plant, of which 7.9% are endemic. P. lentiscus is important because of its medicinal value [16].
P. lentiscus is used for various medicinal properties. The extract of the different parts of the plant shows various activities like anti-inflammatory, antimicrobial, antiatherogenic and antimutagenic, antioxidant, antifungal, lipid lowering, hepatoprotective, anticancer, antiasthmatic, anthelmintic, wound healing, hypotensive, antiarthritic, antigout activity and also in the treatment of functional dyspepsia [17]. The essential oil obtained from the gum/resin of P. lentiscus L. is commonly called mastic oil, whereas the oil obtained from the leaves is named lentisk oil. In human medicine, aqueous extracts of leaves and young twigs are prepared as infusions or decoctions. Leaves and young twigs are used “as is” in veterinary medicine. Extracts exhibit a high concentration of phenolics and terpenes of varying composition [18]. The leaves of P. lentiscus are extensively used in folk medicine for the treatment eczema, diarrhoea, and throat infections, and as a potent antiulcer agent [19].
Actually, the food safety concern on human health resulting from excessive employment of synthetic additives have prompted the development of new sanitation methods to decrease the negative impact on human health and environment. One such possibility is the use of essential oils and plants products as antibacterial additives. Fixed oils are also known for their antimicrobial power related to fatty acids and phenol compounds. P. lentiscus L. seed oil is one of edible oils widely used and appreciated, for its special taste, by local population in Algerian and Tunisian forest areas [20].
Previous reports on the chemical composition of the fatty acids of P. lentiscus dealt mainly with fruits part [21–30]. Instead, other reports were focusing on the sterols analysis from the fruits [21, 30, 31]. For the tocopherols previous reports were interested in the fruits part [26, 30]. Regarding the leaves part, a previous report on P. lentiscus var. chia established a colorimetric quantification of α-tocopherol of the leaves by TLC-densitometry and colorimetry [19]. When considering the antioxidant activity of the fatty acids, the studied parts were those of fruits [27].
According to literature, and at best of our knowledge, there are only few reports dealing with the identification of the fatty acids of the leaves of P. lentiscus; beside an old reports published in German language, in which only seven main components were identified (C14, C16 and C18) [32], some recent report dealt with major fatty acid compositions of the oil extracts from different parts of this tree: seeds, fruits, resins, root, leaf and stem [33]. Additionally, some other recent studies from Tunisia dealt with the influence of the harvest date on fatty acids composition of P. lentiscus edible oils [27] and investigated also the effect of the growing area on tocopherols, carotenoids and fatty acid contents obtained from the fruits of P. lentiscus [26]. Nevertheless, no reports were found on the sterols contents of the leaves of P. lentiscus, nor their tocopherols, except a colorimetric quantification of α-tocopherol as mentioned above [19]. The aim of the present work was to determine the fatty acids profile of the lipid fractions extracted from five different populations of the leaves of P. lentiscus L. growing in Algeria. Most importantly and for the first time for this plant part, the composition of tocopherols were determined by HPLC. In addition, the total tocopherols and total sterols were also quantified using colorimetric methods. Furthermore, the quantification of waxes in lipid fraction was also determined; and finally, the antioxidant activity of the lipid fractions were investigated in vitro for the first time, using two different and complementary methods: DPPH (1,1-diphenyl, 2-picrylhydrazyl) free radicals scavenging assay, then β-carotene bleaching test.
2Materials and methods
2.1Chemicals
Petroleum ether, anhydrous sodium sulfate, sodium and ascorbic acid were purchased from AnalaR NORMAPUR Prolab. Chloroform, absolute ethanol, activated charcoal (activated carbon), n-hexane, sulfuric acid, acetic acid, ferric chloride, dichloromethane, α-tocopherol (Vitamin E) and DPPH• (1,1-diphenyl, 2-picrylhydrazyl) were obtained from Sigma-Aldrich (Prochima Sigma, Tlemcen, Algeria). Butylated hydroxyanisole (BHA), was purchased from Fluka chemie (Prochima Sigma, Tlemcen, Algeria). ortho-phenanthroline and acetic anhydride were obtained from Merck (Merck S.A.R.L. Algiers, Algeria) and cholesterol from UCB Pharma (SARL E-SAHTI, Algiers, Algeria). All reagents and chemicals used were of analytical grade.
2.2Collection of plant material
Leaves of Pistacia lentiscus L. (Five different tree samples) were randomly collected in January 2016, from the location of Magtaâ Kheïra (town of Tipaza), located in north of Algeria, at west of the capital Algiers (36°39’34.43”N and 2°48’37.02”E with an altitude of 73 m). The leave samples of the plants were air-dried in the shade at room temperature for 15 days. A voucher specimen (PLL-TMK/01/2016) was deposited in the herbarium of the Fundamental Sciences Research Laboratory at Laghouat University.
2.3Lipid extraction
The air dried leaves of Pistacia lentiscus L. were milled to obtain a fine powder using a coffee grinder. The lipids were extracted using a Soxhlet apparatus with petroleum ether as solvent for a period of 12 hours. The lipid extract was collected in a flask and subsequently dried over anhydrous sodium sulphate Na2SO4. After filtration, the lipid extract was transferred to a rotary vacuum evaporator at 40°C in order to fully dry the extract.
The chlorophyll removal was performed by reflux, using chloroform as solvent in the round-bottomed flask containing lipids and activated carbon for 2 hours. The ratio of activated carbon relative to initially air dried leaves was 1:5 (mass). The extract fraction was cooled to room temperature then filtered. At the end, the chloroform solvent was removed from the filtered solution in Rotavap under reduced pressure at 40°C.
The extracted lipid fraction was weighed to determine the total lipid content per dry weight of the plant, and then stored at +4°C for further analysis.
2.4Fatty acids (FAs) composition
The FAs composition of the oils was determined after having converted the fatty acids FAs into fatty acids methyl esters (FAMEs) then analysed by gas chromatography (GC). The methyl esters were prepared by the following procedure: Lipids (0.5 g) were refluxed for 20 min in 10 mL of 2% sodium methylate (NaOMe), and then 20 mL of water was added. The fatty acid methyl esters (FAMEs) were extracted by n-hexane and washed with distilled water. The combined extracts were dried over anhydrous sodium sulfate Na2SO4 and evaporated under vacuum, then analysed by capillary gas chromatography.
2.5Chromatographic analysis of FAMEs
The analyses of the FAMEs were performed in a gas chromatographic GC apparatus (model CP-Varian 3800). This model was equipped with a FID detector and DB-Wax capillary column (60 m×0.32 mm internal diameter, 0.25 μm film thickness). 2 μL of the sample was injected in the Split injection mode (50:1). Oven temperature was programmed using four different ramps. The temperature started at 40°C, held for 0.5 min, then raised at a rate of 25°C/min to 195°C, then raised at a rate of 3°C/min to 205°C, then raised at a rate of 8°C/min to 230°C, then raised at a rate of 20°C/min to 260°C, and finally kept for 5 min. The injector temperature was set at 250°C and the detector temperature at 260°C, the flow rate of carrier gas (helium) was 1 mL/min. Identification and quantification of FAMEs was accomplished by comparing the retention times of peaks with those of pure standards purchased from Sigma and analysed under the same conditions. The results were expressed as total area percentage of identified individual fatty acids in the lipid fraction.
2.6Gas Chromatography-Mass Spectroscopy (GC-MS) analysis of FAMEs
The GC-MS analysis was performed on an AGILENT 6890 GC/CMSD 5973 equipped with a capillary column UB-Wax (30 m×0.25 mm internal diameter, 0.25 μm film thickness) and a 70 eV EI quadrupole detector. Helium was the carrier gas, at a flow rate of 1 mL/min. Injector and MS transfer line temperatures were set at 250°C and 220°C, respectively. Column temperature was programmed same as the gas chromatography. 1 μL of samples were injected using split mode (50:1).
2.7Dewaxing of lipids
Prior to the subsequent determinations: antioxidant activity, quantification of total sterols and total tocopherols, the lipid fractions were dewaxed by the following procedure. Crude lipids were first dissolved in absolute ethanol, and then kept in refrigerator for a period of 24 hours in order to crystallize the waxes fractions; after that, the solution containing frozen waxes particles was filtered and finally, the solvent extracts were eliminated under vacuum pressure in rotary evaporator at 40°C.
2.8Tocopherols analysis by HPLC
Tocopherols were analyzed by HPLC using an Agilent 1290 Infinity apparatus equipped with a Quaternary Pump Model 1260, an automatic liquid sample and a fluorimetric detector (FLD 1260). The detection was set at 295 nm for excitation wavelength and at 330 nm for emission wavelength. The separation column was a SI60 (250 mm×4.6 mm internal diameter, 5 μm film thickness, Lichrosorb, Merck KGaA Darmstadt, Germany). The mobile phase was n-hexane/isopropanol, (99/1:v/v), in isocratic mode, with a flow rate set at 1 mL/min, during 20 min. Column compartment was set at 25°C. Commercial standard (α-Toc) and a mixture (α-Toc, β-Toc, γ-Toc and δ-Toc) were co-injected with samples for the identification of tocopherol isomers. Prior to HPLC analysis, 35 mg of lipids fraction was diluted with 1 mL n-hexane and 20 μL of the solution was injected.
2.9Determination of the total tocopherols content of P. lentiscus leaves
The total tocopherols content of the lipids was determined by the spectrometric method described in reference [34] with a few modifications. This method is based on the redox reaction between tocopherols and ferric iron (Fe3 +) which is reduced to ferrous iron (Fe2 +). The latter, in the presence of specific reagents such as ortho-phenanthroline (1,10-phenantroline), forms a stable red-orange complex with a very high molar extinction coefficient at 510 nm.
From the standard solution of α-tocopherol in dichloromethane we prepared aliquot solutions with different concentrations. To 2 mL of each solution was added 1 mL of 1,10-phenantroline reagent (0.4% in absolute ethanol), then 1 mL of ferric chloride reagent (0.12% in absolute ethanol) was added and the mixture was shaken for 5 min. The absorbance of the mixture was read at 510 nm. A blank was run, using 2 mL of dichloromethane, 1 mL of 1,10-phenantroline reagent and 1 mL of ferric chloride reagent. The above described procedure was followed by using sample solutions of lipids (dewaxed lipids). The total tocopherols in the dewaxed lipids were calculated from the regression equation of the standard curve.
The results were expressed as α-tocopherol equivalent in mg/(g of lipids).
2.10Determination of the total sterols content of P. lentiscus leaves
This method is based on spectrophotometric absorption according to the Liebermann-Burchard test (or acetic anhydride test) [35, 36], based on a specific coloured reaction of the 3 β-hydroxysteroids having a double bond in position 5-6. The sterols form a stable complex with the β-acetic anhydride in an acid medium which absorbs in the visible at a wavelength of 550 nm (the Liebermann spectral reagent consists of 60 mL of acetic anhydride and 10 mL of concentrated sulfuric acid and 30 mL of acetic acid).
From a chloroformic solution of cholesterol with a concentration of 1 g/L, we have prepared a series of solution dilutions in order to plot a calibration curve linking the optical density to the concentration. 1 mL of each diluted solution was mixed with 2 mL of the Liebermann reagent, then kept for 25 min in order to allow reagent colour to fully develop and stabilize.
The above described procedure was followed by using sample solutions of lipids (dewaxed lipids). The total sterols in the dewaxed lipids were calculated from the regression equation of the standard curve. The results were expressed as cholesterol equivalent in mg/(g of lipids) and in μg/(g leaves “d.w.”).
2.11Antioxidant activity
2.11.1Radical-scavenging activity (DPPH assay)
The antioxidant activity was determined by DPPH method, which is based on the evaluation of the free-radical scavenging capacity. Briefly, 0.5 mL of the sample (dewaxed lipids) diluted in absolute ethanol was mixed with 0.5 mL of 250 μM DPPHepsfboxG :/Tex/IOSPRESS/MNM/18198/IFS1 . eps prepared in absolute ethanol. The reaction mixture was well shaken and incubated in the dark at room temperature for a period time of 30 min. The absorbance of the resulting solution was read at 517 nm against a blank. The antiradical activity was expressed as IC50 (mg/mL): the concentration required to cause 50% initial DPPHepsfboxG :/Tex/IOSPRESS/MNM/18198/IFS1 . eps inhibition. The inhibitory percentage of DPPHepsfboxG :/Tex/IOSPRESS/MNM/18198/IFS1 . eps was calculated according to the following equation:
Where A0 and A are the absorbance values of control and of the tested sample, respectively.
Antioxidants of reference (Vitamin E and ascorbic acid) were used for comparison. All experiments were performed in triplicate.
2.11.2Bleaching ability of β-carotene in linoleic system
The inhibition of β-carotene bleaching by the lipid fractions was determined according to slightly modified method described in literature [37].
A volume of 5 ml of dichloromethane solution of β-carotene at initial concentration of 0.1 mg/mL was added to a round flask containing 20 mg of acid linoleic and 200 mg of Tween 80. Dichloromethane was completely removed at 40°C under vacuum, then 50 mL of distilled water was slowly added and vigorously shaken. Aliquots (40 μL) of different solutions concentrations were added to 1 mL of β-carotene/linoleic acid emulsion. A control preparation was obtained by adding 40 μL of ethanol to 1 mL of β-carotene/linoleic acid emulsion. Absorbance of the preparations was measured at 490 nm before and after 2 h of incubation in a water bath at 50°C. Antioxidative activity (AA%) in percentages was calculated using the following formula:
Where:
Ac0 is the absorbance of the control respectively measured before the incubation.
As120 and Ac120 are the absorbance of the test and the control respectively measured after 2 h of incubation.
Results were expressed in AA% corresponding to solutions concentrations of 2 mg/mL (relative to the 40 μL added). The results were also expressed as AA50, the concentration providing 50% β-carotene bleaching inhibition. Vitamin E was used as positive control. All trials were performed in triplicate.
2.12Cluster analysis
Cluster analysis was performed using Agglomerative Hierarchical Clustering AHC (Ward’s technique) with Euclidean distance measure. The calculus was performed using a set of individuals composed of 5 different fatty acids samples (different plants from the region of Zeralda). The total number of adopted variables was 20 (representing simply the major identified components in all represented individuals, or the most influencing parameters that could make a difference i.e. some minor compounds).
2.13Principal component analysis (PCA)
The principal component analysis was performed using both the same individuals and variables adopted for Agglomerative Hierarchical Clustering method.
3Results and discussion
3.1Lipid contents and fatty acids compositions of P. lentiscus leaves
The lipid contents and the fatty acids FAs composition of the P. lentiscus leaves are summarised in Table 1. The lipid contents were not the same for all studied samples; they were ranging from 1.94 to 4.12% upon dry matter. The content of lipids were very interesting since they are practically representative values when compared with those of other parts rich in oils (fruits) provided by literature. In fact, the maximum obtained yield value 4.12% was only about 3 to 8 times lower than the yields obtained by the fruits of P. lentiscus from Algeria reported by Charef et al. [29] in which they found 11.7% and 32.8% for red and black fruits, respectively. Moreover, the obtained yield was not far different from both of Quercus ilex L. and Quercus suber L. in which they exhibited identical yields values of 9.0% (from the fruits parts), and were reported also by Charef et al. [29].
Table 1
Fatty acid compositions of the lipids fractions obtained from the leaves of Pistacia lentiscus
| Fatty acids | Composition (%) | Identification | ||||
| Z1 | Z2 | Z3 | Z4 | Z5 | ||
| C10:0 | 02.49 | 11.74 | 13.88 | 03.18 | 02.57 | GC, MS |
| C11:0 | 00.80 | 01.64 | 02.86 | tr | tr | GC, MS |
| C12:0 | 00.87 | 02.42 | 02.16 | tr | tr | GC, MS |
| C13:0 | 00.94 | 01.32 | tr | tr | 01.62 | GC, MS |
| C14:0 | 06.43 | 08.19 | 07.38 | 04.71 | 09.12 | GC, MS |
| C14:1w5 | tr | tr | 01.77 | tr | tr | GC, MS |
| C15:0 | 00.73 | 01.32 | 01.54 | tr | 01.35 | GC, MS |
| C16:0 | 07.49 | 08.05 | 06.9 | 05.31 | 09.03 | GC, MS |
| C17:0 | 00.54 | tr | tr | tr | tr | GC, MS |
| C18:0 | 00.88 | 01.53 | 01.79 | tr | tr | GC, MS |
| C18:1w9 | 03.66 | 04.11 | 04.66 | 03.42 | 04.85 | GC, MS |
| C18:2w6 | 14.73 | 11.25 | 10.94 | 12.38 | 16.99 | GC, MS |
| C18:3w3 | 48.92 | 27.71 | 25.07 | 20.92 | 33.94 | GC, MS |
| C20:0 | 00.79 | 01.36 | 02.07 | 07.07 | 01.96 | GC, MS |
| C20:1w9 | tr | 01.35 | 02.19 | 06.56 | tr | GC, MS |
| C20:2 | 00.74 | 01.61 | 01.47 | 04.90 | 01.92 | GC, MS |
| C20:3w6 | tr | tr | 01.52 | 03.27 | 01.72 | GC, MS |
| C20:5w3 | tr | 01.55 | tr | tr | tr | GC, MS |
| C22:2 | 00.88 | 01.30 | 01.56 | 03.34 | 01.46 | GC, MS |
| C23:0 | tr | tr | tr | 02.73 | tr | GC, MS |
| Total identified (%) | 90.89 | 86.45 | 87.76 | 77.79 | 86.53 | |
| ΣSFA (%) | 21.96 | 37.57 | 38.58 | 23.00 | 25.65 | |
| ΣMUFA (%) | 03.66 | 05.46 | 08.62 | 09.98 | 04.85 | |
| ΣPUFA (%) | 65.27 | 43.42 | 40.56 | 44.81 | 56.03 | |
| ΣUSFA (%) | 68.93 | 48.88 | 49.18 | 54.79 | 60.88 | |
| U/S (%) | 03.14 | 01.30 | 01.27 | 02.38 | 02.37 | |
| Lipids yield (%) dw | 02.76 | 01.94 | 02.50 | 04.12 | 03.49 | |
| Waxes in lipids (%) mass. | 54.08 | 59.85 | 59.92 | 52.39 | 66.63 | |
ΣSFA: Sum of saturated fatty acids; ΣMUFA: Sum of mono-unsaturated fatty acids; ΣPUFA: Sum of poly-unsaturated fatty acids; ΣUSFA: Sum of unsaturated fatty acids; U/S: ratio “unsaturated/saturated” fatty acids.
The results of gas chromatography GC and gas chromatography coupled to the mass spectroscopy GC-MS analysis of the fatty acids methyl esters FAMEs of P. lentiscus leaves are given in Table 1. The identification of the FAMEs showed some clear variability of the compositions of the five studied samples. For the overall samples, the main saturated fatty acids SFAs components were capric acid (C10:0 = 2.49–13.88%), myristic acid (C14:0 = 4.71–9.12%) and palmitic acid (C16:0 = 5.31–9.03%). Alternatively, the main unsaturated fatty acids USFAs chemical compounds were oleic acid (C18:1w9 = 3.42–4.85%), linoleic acid (C18:2w6 = 10.94–16.99%) and most importantly α-linolenic acid (C18:3w3 = 20.92–48.92%). The investigated samples presented high percentages of USFAs fractions compositions (48.88–68.93%), which were mostly represented by high amounts of poly unsaturated fatty acids (PUFA) in the range of (40.56–65.27%). In the other hand, the SFAs were varying from 21.96 to 38.58%. The U/S ratio (“USFAs/SFAs”) was not steady once more; it depended also on the studied sample. In general, the amounts of fatty acids were decreasing in the order PUFA>SFA>MUFA “mono unsaturated FAs”. The U/S range variation was very noticeable and shifting from 1.27 to 3.14. The overall values of U/S are suggesting moderate to good values and these values provides to the oils a good prevention of oxidation. Let’s remind that MUFA have great importance because of their nutritional implications and their effect on the oxidative stability of oil. These results suggested that the P. lentiscus leave oils may serve as a potential dietary source of MUFA and PUFA. According to literature, it has been recognized that a diet rich in MUFA may be an alternative choice to low-fat diet, which may lower blood cholesterol levels, modulate immune function decrease susceptibility of oxidation of LDL and improve the fluidity of HDL [38]. The PUFA-enriched diet may also be important for the structure and function of many membrane proteins, including receptors, enzymes, and active transport molecules [39].
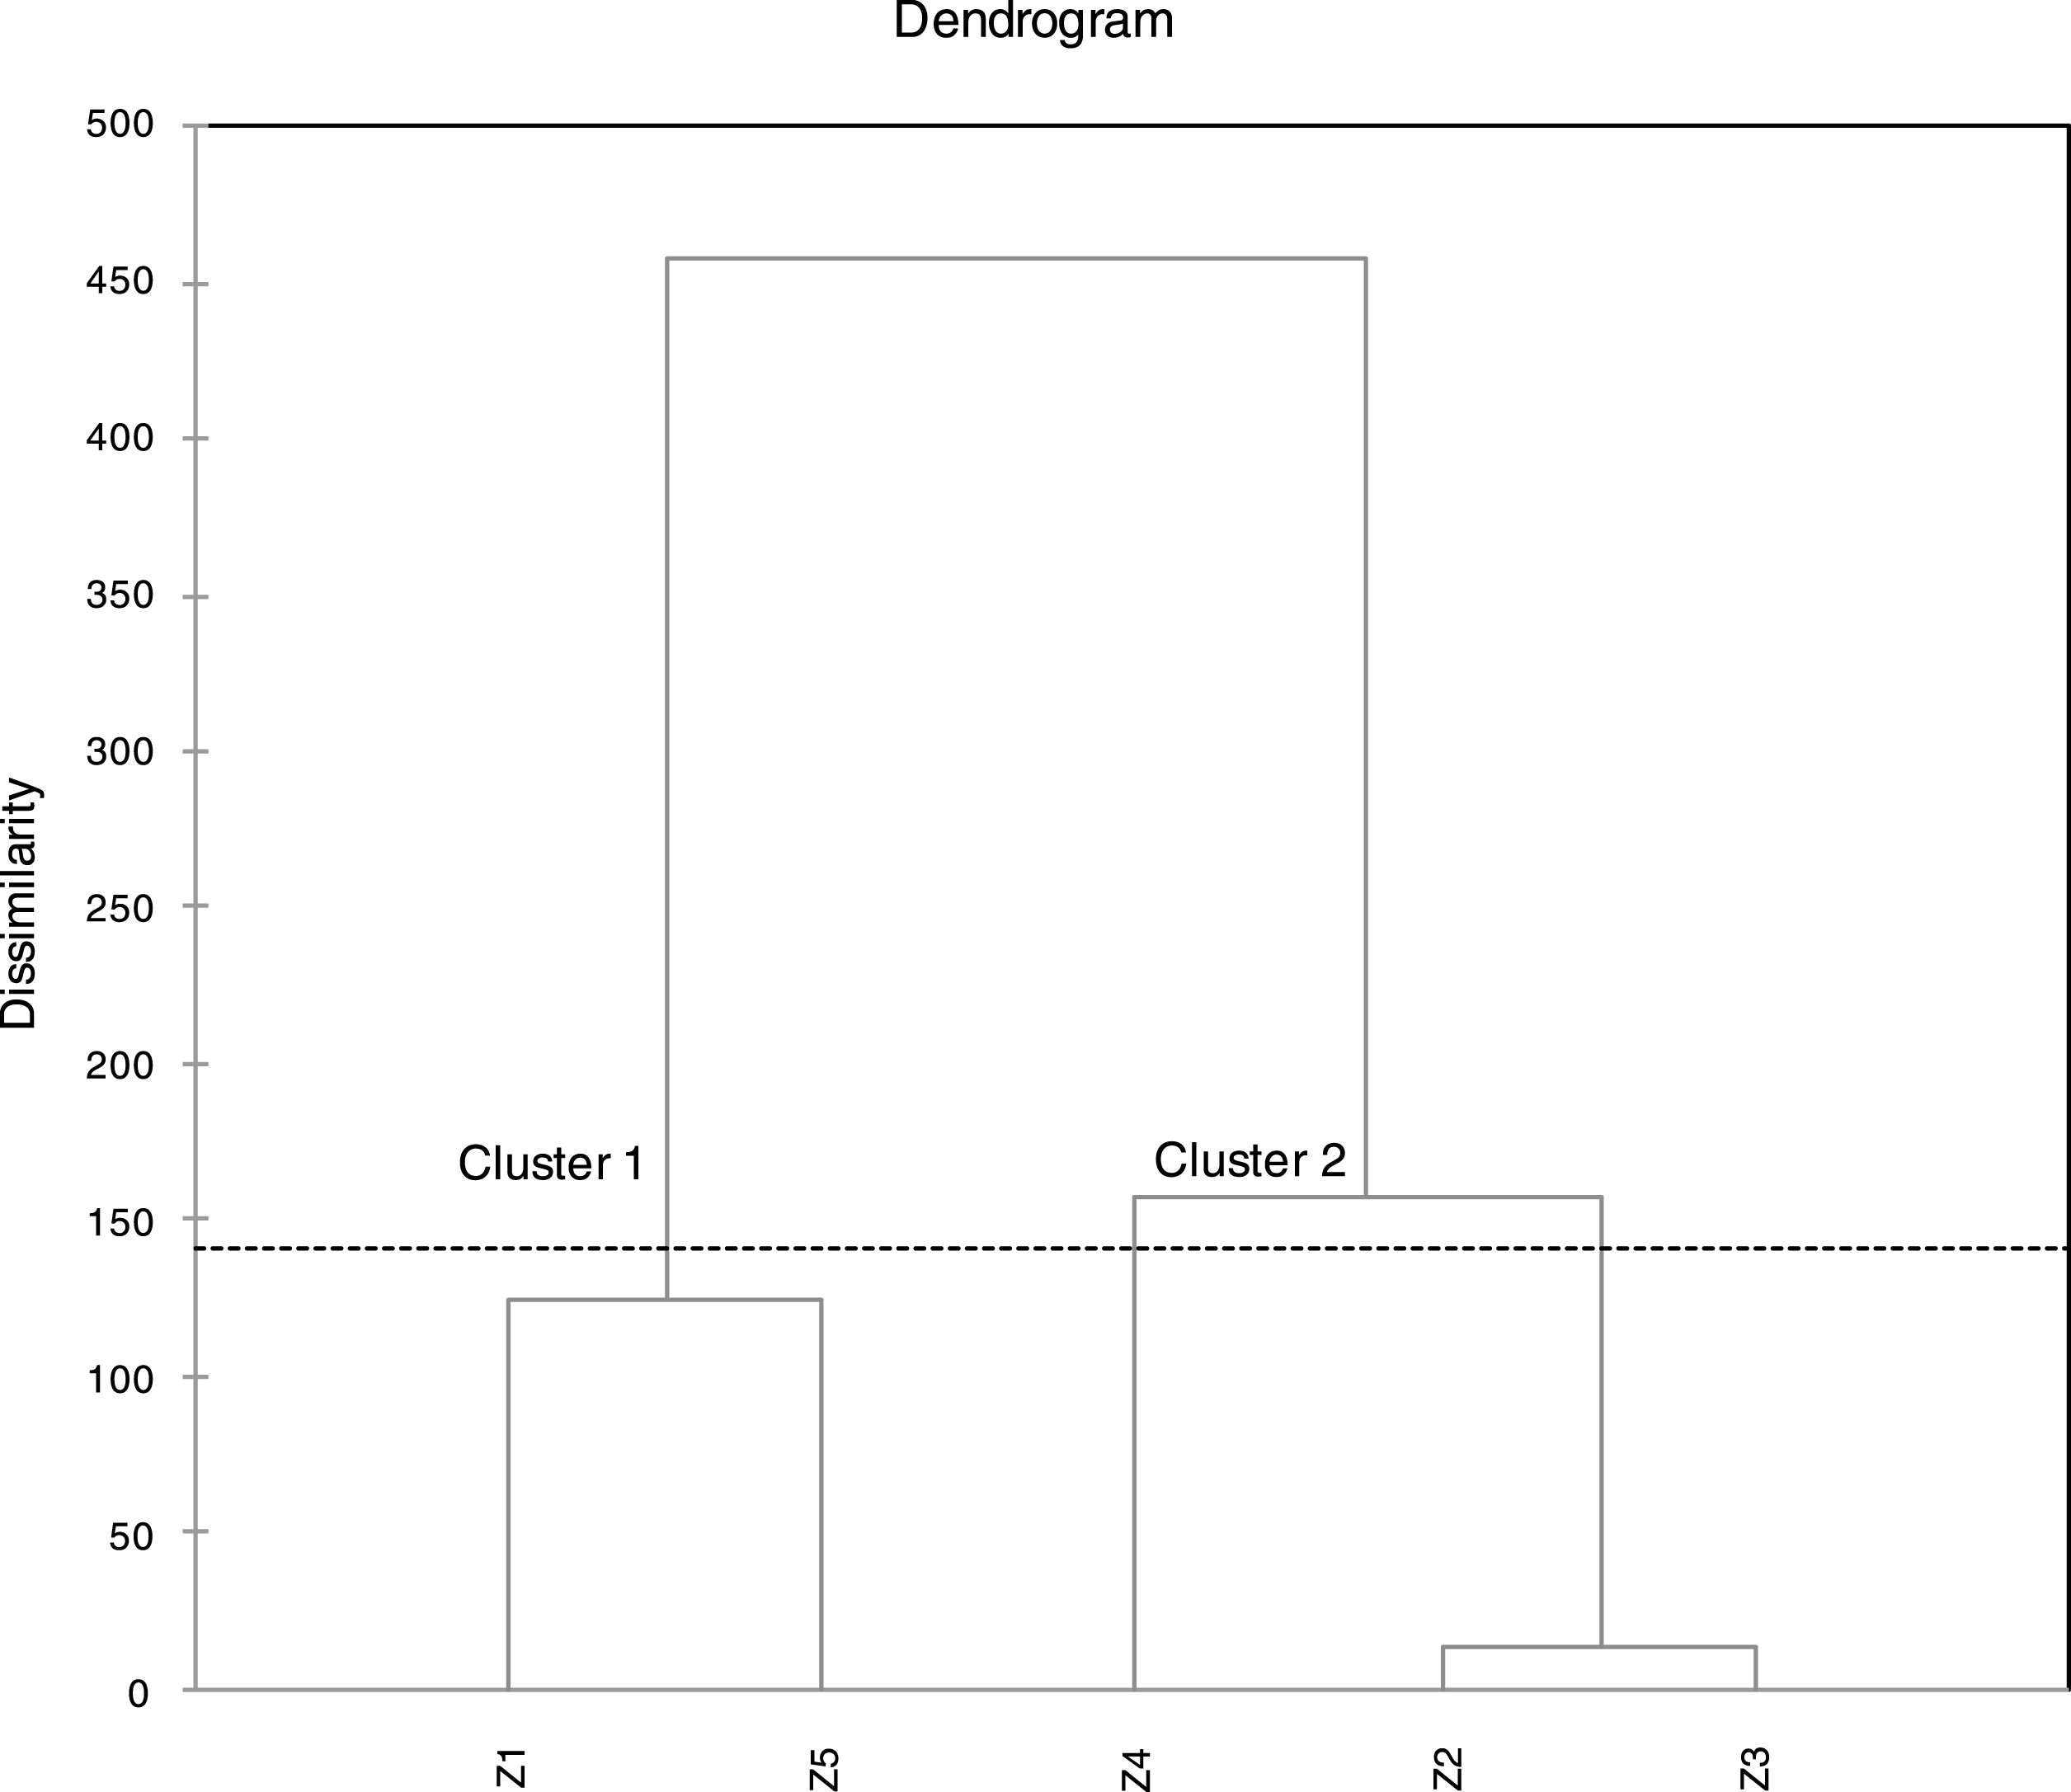
For better understanding of similarities and/or differences between the studied samples in term of FAs compositions, cluster analysis was performed using Agglomerative Hierarchical Clustering AHC. The results of AHC schemed in the dendrogram of the Fig. 1, showed two clearly distinguished clusters “or groups” of samples (cluster 1: Z1, Z5) and (cluster 2: Z2, Z3 and Z4). Which indicated an existing dissimilarity of the studied samples (proves the existence of some variability of the chemical composition). The comparison of the chemical composition of samples Z1 and Z5 indicates roughly close values of the percentages of both major and minor components. For samples Z2 and Z3, the distance between these two samples was very low (Fig. 1), which means a very close values of percentages in both samples, as confirmed by the data of Table 1. Sample Z4 was clustered with Z2 and Z3 but with some existing differences of some components. The most influencing difference is that C10:0 in Z4 was becoming a minor component (3.18%) at the opposite of Z2 and Z3 where it was considered as a major component (11.74%, 13.88%). The most influencing difference between cluster 1 and 2 is, the higher percentages of C18:3w3 (48.92%, 33.94%) in cluster 1 in comparison with cluster 2 where the percentages were important but lower (20.92–27.71%).
Fig.1
Dendrogram obtained from a cluster analysis of five samples of fatty acids of Algerian Pistacia lentiscus leaves. Samples are clustered using Ward’s technique with a Euclidean distance measure.
In order to determine a more detailed similarities or differences between the two cluster and the samples, principal component analysis PCA method was performed to try to identify the most influencing components that can distinguish or regroup the studied samples.
These above observations (occurrence of two clusters) were also confirmed by the results of PCA (Fig. 2), and which allowed us to discuss the similarities and the differences upon the chemical compositions. Loading factors for principal axes F1 and F2 (representing 71.24% of the total information), are given in Fig. 2. The F1 Axis, which represents 48.98% of the total information, is strongly and positively correlated with C23:0 (99.2%), C20:0 (97.8%), C22:2 (95.6%), C20:2 (95.1%), C20:1 (91.4%) and C20:3 (84.7%). This same axis is negatively correlated with C15:0 (– 87.7%), C16:0 (– 81.5%) and C14:0 (– 80.9%).
Fig.2
Two dimensional plot on axes F1 and F2 using PCA of five samples of fatty acids of Algerian Pistacia lentiscus leaves.
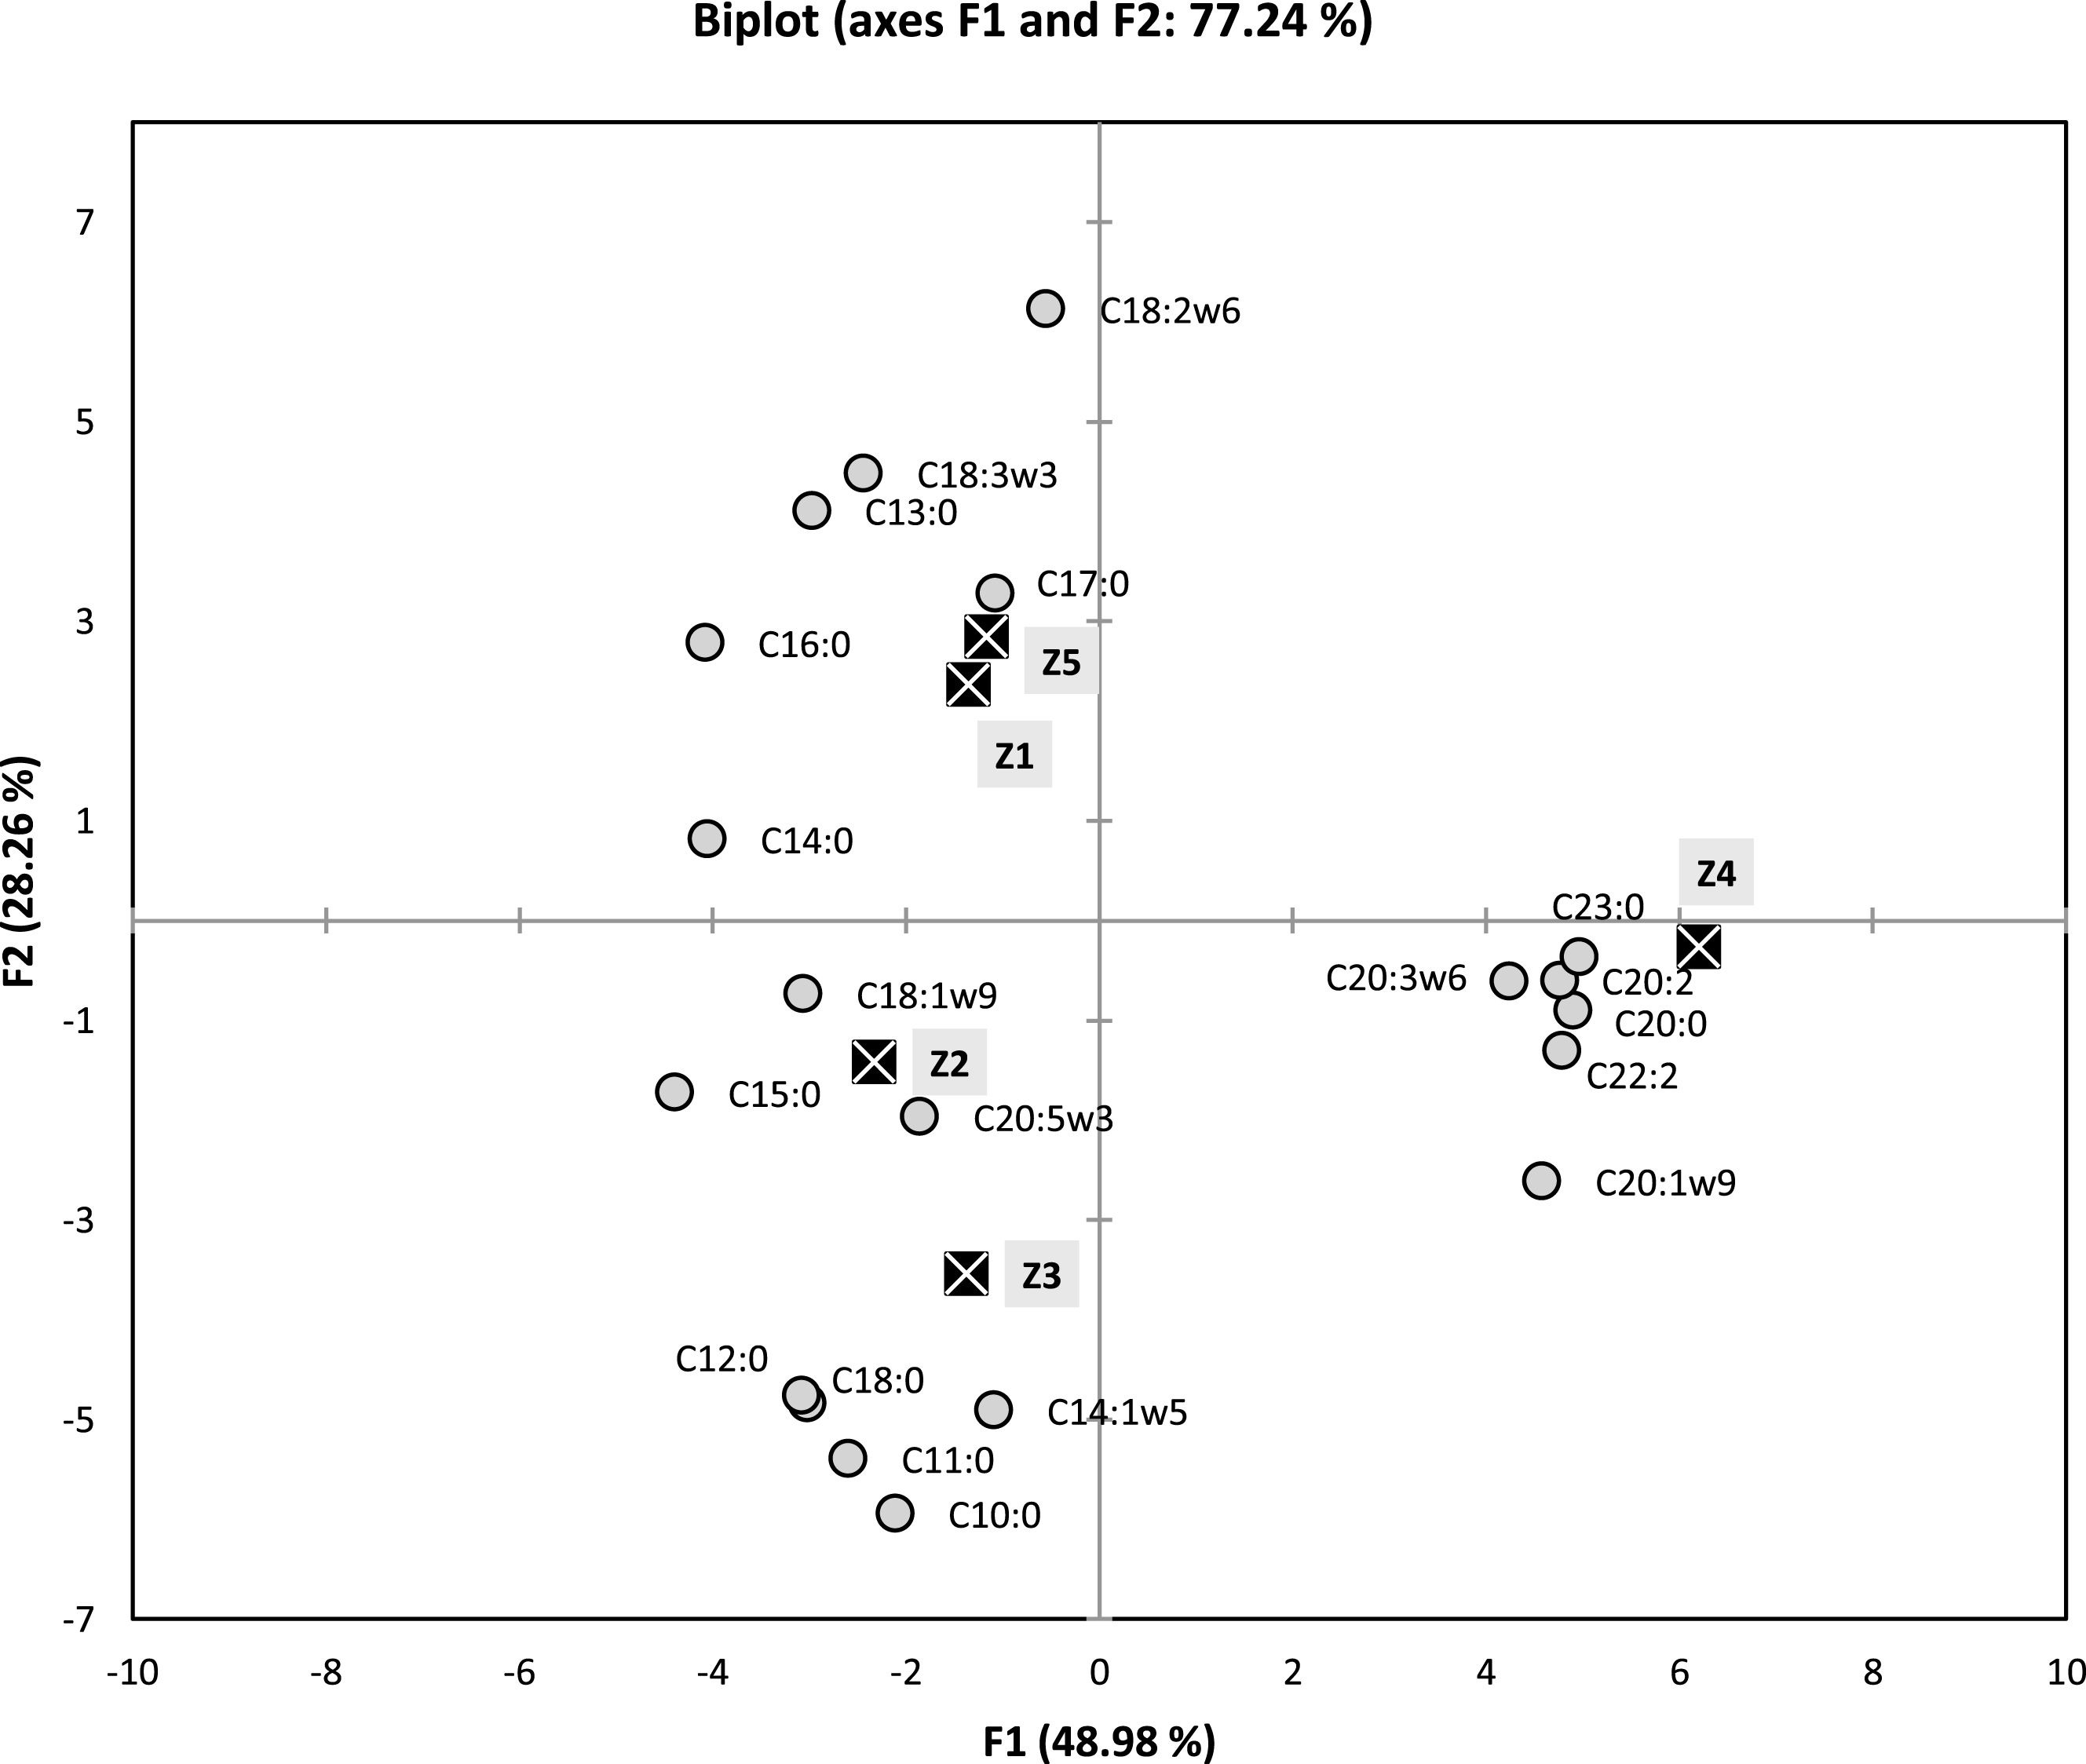
Axis F2, which represents 28.26% of the total information, is highly negatively correlated with C10:0 (– 90.0%), C11:0 (– 81.7%), C14:1 (– 74.4%), C12:0 (– 73.3%) and C18:0 (– 72.2%). This same axis is strongly and positively correlated with only one compound C18:2 (93.1%).
As previously demonstrated with AHC method, there is appearance of the same formerly grouping of (Z1, Z5) and (Z2, Z3: with larger distance) and Z4, in which this time can be clearly distinguished (Fig. 2). The sample Z4 is strongly correlated with relatively higher percentages of C20:0 (7.07% Vs 0.79–2.07%), C20:1 (6.56% Vs tr-2.19%), C20:2 (4.9% Vs 0.74–1.92%).C23:0 (2.73% Vs tr), C22:2 (3.34% Vs 0.8–1.56%) and C20:3 (3.27% Vs tr-1.72%) in comparison with the rest of the samples. The samples Z1 and Z5 are strongly correlated with C18:3 (48.92% and 33.94%, respectively) and C18:2 (14.73% and 16.99%, respectively), since their percentages in these major compounds are the highest ones recorded for this two samples. For the Z2 and Z3 samples which are this time not as close as Z1 and Z5 were. This group is distinguished by high content of major compound C10:0 (11.74% and 13.88%, respectively), in comparison with the rest of the samples (2.49–3.18%). Then again, this group is also distinguished by relatively higher compositions of minor compounds such as C11:0 (1.64% and 2.86%, respectively Vs tr-0.8%), C12:0 (2.42% and 2.16%, respectively Vs tr-0.87) and C18:0 (1.53% and 1.79%, respectively Vs tr-0.88%), when compared with the remaining samples. Finally, when taking in account the two main agglomerations of the studied samples (groups 1 and 2) obtained from dendrogram of the Fig. 1, the results showed clear resemblance of the contents of SFA, MUFA and PUFA for the following pairs of individuals (Z1, Z5 then Z2, Z3, respectively) (Table 1).
The comparison of obtained results here in this investigation with the previous previous reports from Germany [32] and Turkey [33] revealed very few similarities but lot of differences (Table 2). Starting with similarities, the samples of Algeria were presenting comparables ranges with those of Germany and Turkey for the following compounds C14:0, C18:0 and C18:3. When considering differences, there were lot of dissimilarities detected. The compound C16:1 which was not detected in Algerian samples was present as a minor compound in samples of Germany and Turkey. The percentage ranges of C16:0, C18:1 and C18:2, were higher in the samples of Germany and Turkey, in comparison with those of Algeria. A large number of detected minor compounds in Algerian samples (at least fourteen FAs) were not reported (or not identified) in those of Germany and Turkey. Finally, it is very useful to mention that the range variation of C18:3 in the Algerian samples were presenting larger arrays (for min. and max.) in comparison with those of literature samples. This is the first investigation than report the presence of C18:3 with a percentage that can reach 48.92%.
Table 2
Comparison of the determined percentages of the fatty acids of the leaves of P. lentiscus with those of literature
| Fatty acids | Algeria (current investigation) | Germany [32] | Turkey [33] | |||
| Male tree | Female tree | |||||
| In vivo | In vitro | In vivo | ||||
| C14:0 | 4.71–9.12% | 5.0–7.8% | 06.10 | 01.66 | 04.79 | |
| Similarities | C18:0 | tr-1.79% | 1.4–2.5% | 01.11 | 02.12 | 00.87 |
| C18:3 | 20.92–48.92% | 33.7–40.4% | 35.57 | 32.06 | 36.78 | |
| Differences | C16:0 | 5.31–9.03% | 17.2–22.4% | 19.29 | 23.10 | 21.12 |
| C16:1 | Not detected | 0.8–1.9% | 2.2 | 01.00 | 03.61 | |
| C18:1 | 3.42–4.85% | 8.2–22.7% | 06.83 | 08.58 | 08.03 | |
| C18:2 | 10.94–16.99% | 10.3–21.2% | 28.87 | 31.17 | 24.77 | |
| C15:0 | tr-1.54% | Not reported | Not detected | 00.28 | Not detected | |
| C10:0 | 2.57–13.88% | Not reported | Not reported | Not reported | ||
| C11:0 | tr-2.86% | Not reported | Not reported | Not reported | ||
| C12:0 | tr-2.42% | Not reported | Not reported | Not reported | ||
| C13:0 | tr-1.62% | Not reported | Not reported | Not reported | ||
| C14:1 | tr-1.77% | Not reported | Not reported | Not reported | ||
| C15:0 | tr-1.54% | Not reported | Not detected | Not detected | ||
| C17:0 | tr-0.54% | Not reported | Not detected | Not detected | ||
| C20:0 | 0.79–7.07% | Not reported | Not reported | Not reported | ||
| C20:1 | tr-6.56% | Not reported | Not detected | Not detected | ||
| C20:2 | 0.74–4.90% | Not reported | Not reported | Not reported | ||
| C20:3 | tr-3.27% | Not reported | Not reported | Not reported | ||
| C20:5 | tr-1.55% | Not reported | Not reported | Not reported | ||
| C22:2 | 0.88–3.34% | Not reported | Not reported | Not reported | ||
| C23:0 | tr-2.73% | Not reported | Not reported | Not reported | ||
3.2Waxes content in lipid fractions of P. lentiscus leaves
The lipids of P. lentiscus leaves were very rich in wax fractions (Table 1). Indeed, the percentages of waxes were very high, varying from 52.39 to 59.92% “mass”, with mean and standard deviation values of (58.57±5.63)% “mass”.
3.3Tocopherols composition analysis
Tocopherols analysis was performed for the five adopted samples. The results of the tocopherols percentages determined by HPLC analysis was exposed in Table 3. The data revealed that all investigated lipid samples contained a substantial amount of α-tocopherol “most important and requested vitamin”, ranging from 58.51 to 89.17% (with mean-value±sd = 76.14±11.20%). Furthermore, the γ-tocopherol was completely absent in all samples. For most investigated samples, the percentages of β-tocopherol were low (3.24–4.35% “minor compound”), except for Z5, where its percentage was relatively significant (14.02%). For δ-tocopherol, its percentage was moderately significant in the majority of studied samples (7.59–27.47%). The founded percentages values of tocopherols isomers suggested the presence a certain variability of the composition, which should be further clarified using a larger number of populations.
Table 3
Tocopherols and sterols contents in the lipids fractions obtained from the leaves of Pistacia lentiscus
| Lipid samples | Sterols contents | Total tocopherols contents | Percentages (%)* | ||||
| (mg/g lipids) | (μg/g leaves “d.w.”) | (mg/g lipids) | (μg/g leaves “d.w.”) | α-Toc | β-Toc | δ-Toc | |
| Z1 | 149.97±0.01 | 4132.8±0.1 | 4.5±0.3 | 125.0±8.9 | 75.99 | 03.90 | 20.10 |
| Z2 | 175.61±0.01 | 3404.2±0.2 | 4.6±0.2 | 089.4±3.7 | 89.17 | 03.24 | 07.59 |
| Z3 | 171.84±0.01 | 4302.2±0.2 | 3.2±0.2 | 080.1±4.0 | 79.06 | 04.34 | 16.60 |
| Z4 | 167.40±0.01 | 6897.3±0.3 | 3.7±0.1 | 152.4±4.3 | 77.97 | 04.35 | 17.68 |
| Z5 | 143.37±0.01 | 4997.3±0.2 | 3.2±0.1 | 110.0±3.5 | 58.51 | 14.02 | 27.47 |
* Percentages determined by integration of surface area.
3.4Quantification of total sterols of P. lentiscus leaves
Recently, the cosmetic, drug and alimentary/nutraceutical industries have focused attention on low-cost renewable resources, rich in lipid-related compounds such as phytosterols which are an important part of the unsaponifiable matter of vegetable oils. The analysis of the sterols provides rich information about the quality and the identity of the oil investigated, and for the detection of oil and mixtures not recognized by their fatty acids profile [21].
The results of the quantification of the dewaxed lipid fractions obtained from the leaves of P. lentiscus sterols and tocopherols are summarized in Table 3.
The total contents of sterols were much higher than the content of total tocopherols. The range content of sterols was varying from 143.37 to 175.61 mg/“g of lipids”, which were presenting significant variations. The three samples Z2, Z3 and Z4 were presenting close values of sterols contents, and especially for Z3, Z4. The lowest content value was recorded for the sample Z5.
3.5Quantification of total tocopherols of P. lentiscus leaves
Tocopherols (vitamin E isomers) are well known natural antioxidants whose presence in oils is often correlated with a relatively high abundance of USFA.
The results of the quantification of sterols and tocopherols in the dewaxed lipid fractions obtained from the leaves of P. lentiscus are summarized in Table 3. For tocopherols content, the range variation was narrow, revealing close contents in the studied samples (3.2–4.6 mg/“g of lipids”). The two samples Z1 and Z2 were presenting very close contents. In addition, samples Z3, Z4 and Z5 were also presenting practically close contents.
3.6Antioxidant activity
3.6.1DPPH assay (free radical scavenging activity)
The antioxidant activity of the lipid fractions was determined in vitro using DPPH• (1,1-diphenyl, 2-picrylhydrazyl) assay. The results are summarized in Table 4. The obtained values of IC50 suggested low antioxidant activity when compared with antioxidant of reference (vitamins C and E), but the overall values are very interesting in comparison with the majority of common lipid fractions. In addition, and since there was a low variability of the values of IC50 for the different adopted samples, the IC50values range was very tight (3.28–4.51 mg/mL). The minimum value of IC50 recorded for the sample Z2 represented the highest antioxidant activity. In the opposite side, the maximum IC50 value was reflecting the lowest antioxidant power, in which this time was registered for Z5 sample.
Table 4
Antioxidant activity (DPPH assay and β-carotene test) of the lipid fractions obtained from the leaves of Pistacia lentiscus
| Samples | Antioxidant activity | |||
| DPPH assay | β-carotene test | |||
| IC50 (mg/mL) | AA% (2 mg/mL) | AA50 (mg/mL) | ||
| Z1 | 3.76±0.14 | 61.61±0.04 | 1.53±0.04 | |
| Z2 | 3.28±0.13 | 71.72±0.04 | 1.43±0.04 | |
| Lipid extract samples | Z3 | 3.98±0.27 | 37.24±0.07 | 2.59±0.07 |
| Z4 | 3.54±0.27 | 42.43±0.04 | 2.47±0.04 | |
| Z5 | 4.51±0.03 | 046.4±0.02 | 2.21±0.02 | |
| Antioxidants of reference | Vitamin E | 0.0195±0.0075 | 85.14 | – |
| Ascorbic acid | 0.0130±0.0023 | 00.71 | – | |
| BHA | – | 96.00 | – | |
| BHT | – | 96.62 | – | |
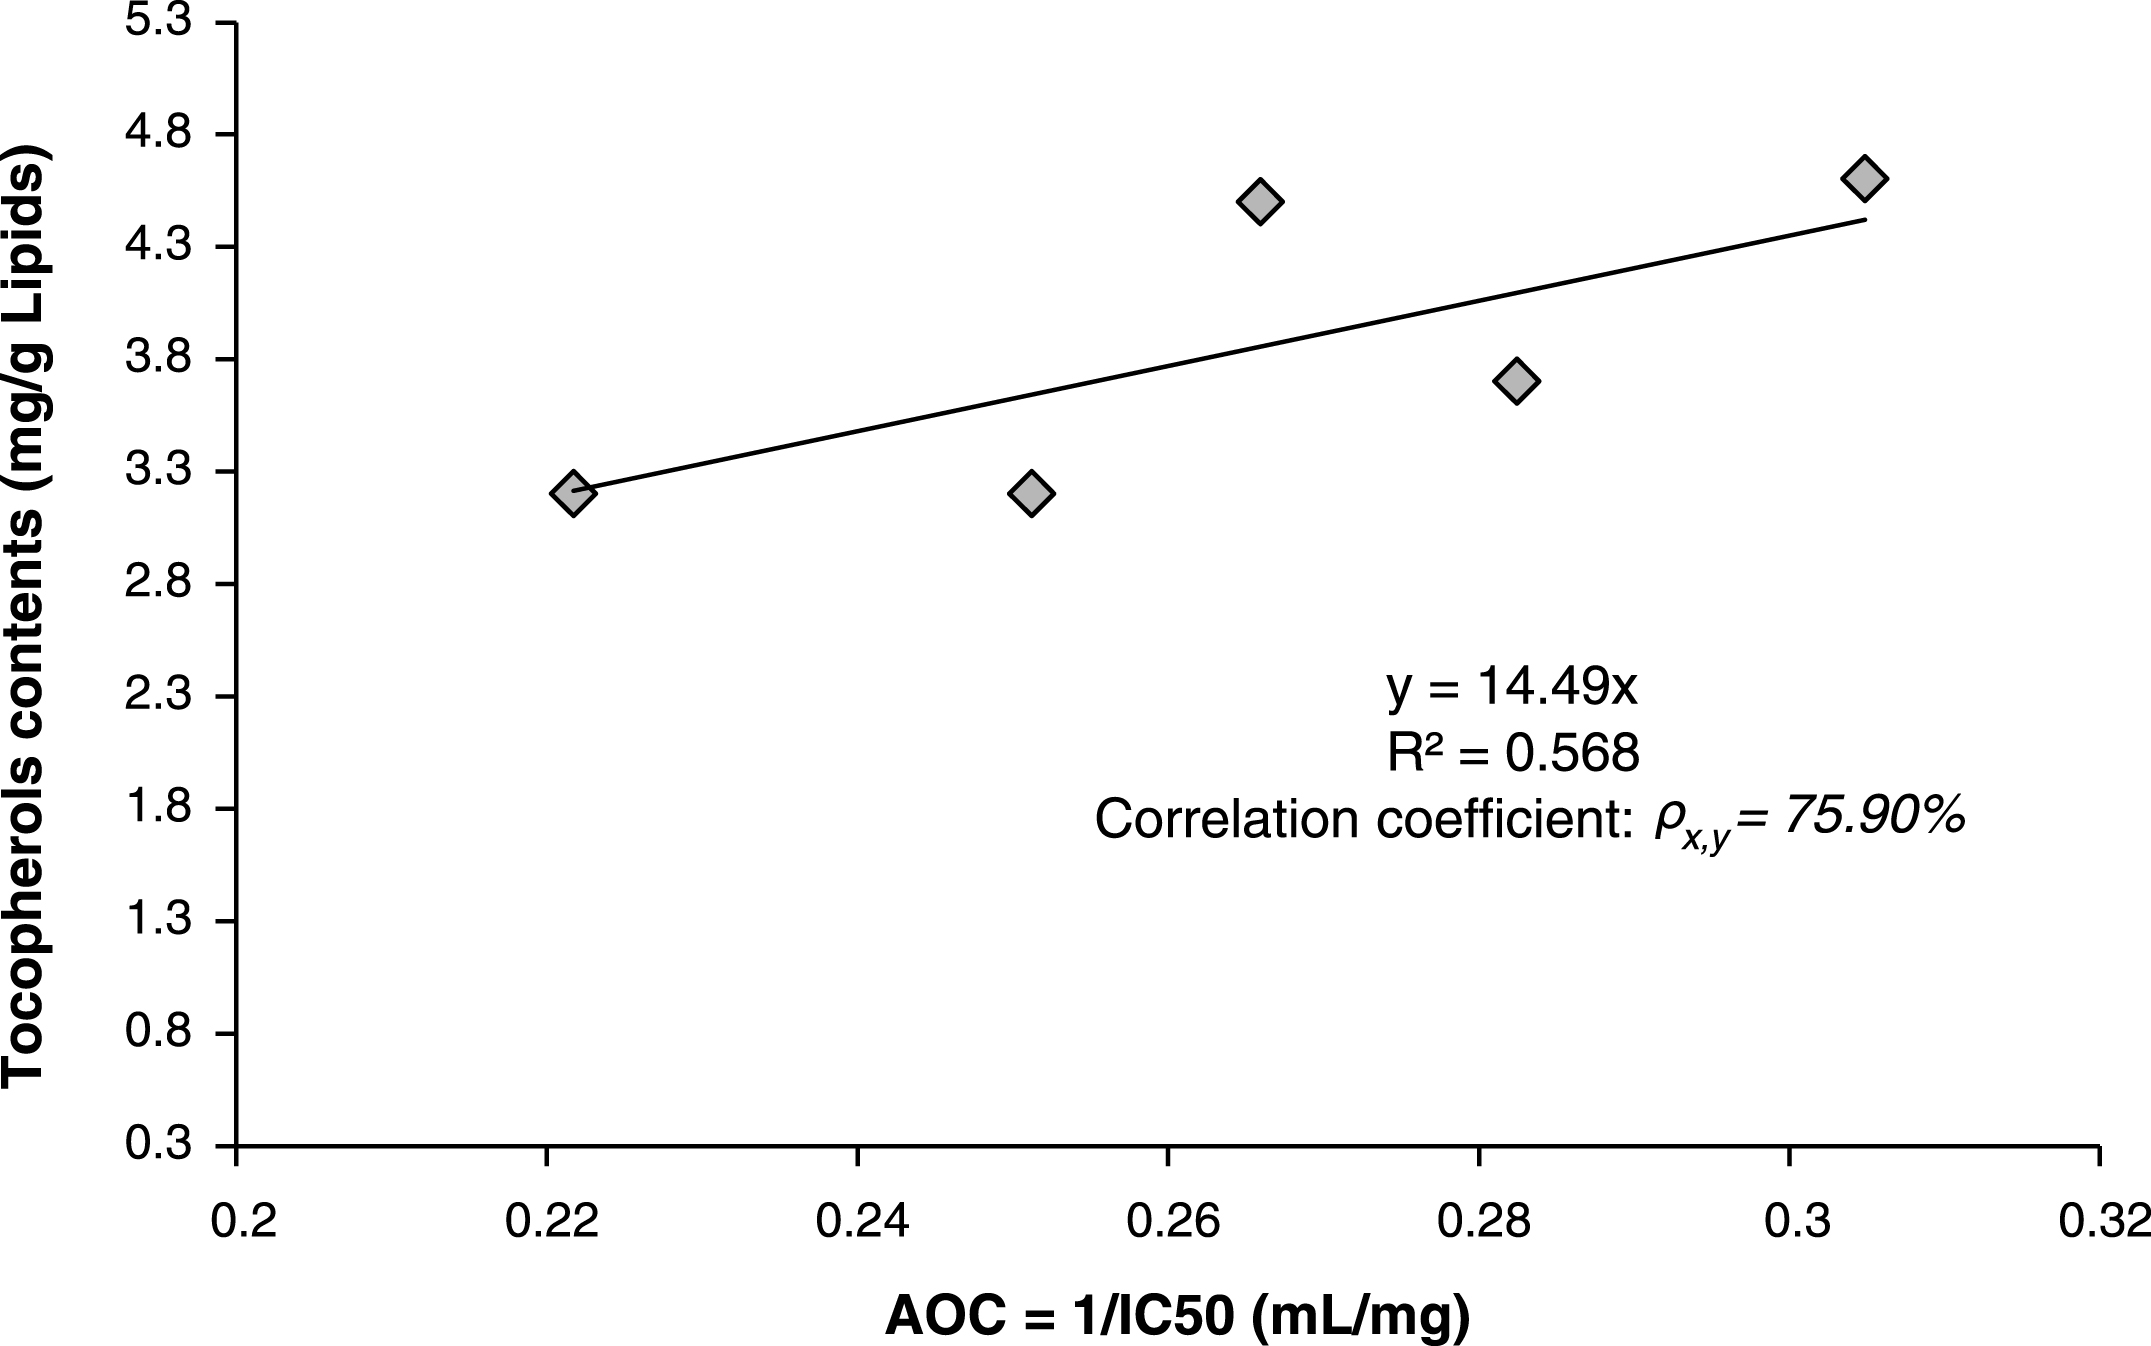
Correlation between antioxidant activity (expressed as Antioxidant Capacity AOC = 1/IC50) and total tocopherols contents were investigated using linear equation model and estimated by minimum least square method. The found model gave a relatively good correlation factor “correlation coefficient ρx,y = 75.90% ” (Fig. 3), which indicated a direct relation between antioxidant capacity AOC of scavenging free DPPH radicals and total contents of tocopherols. This direct correlation supposes that the antioxidant activity is due mainly to the presence of tocopherols in the lipids.
Fig.3
Linear correlation between antioxidant activity (Antioxidant capacity AOC) and total contents of tocopherols in the lipids of Pistacia lentiscus leaves.
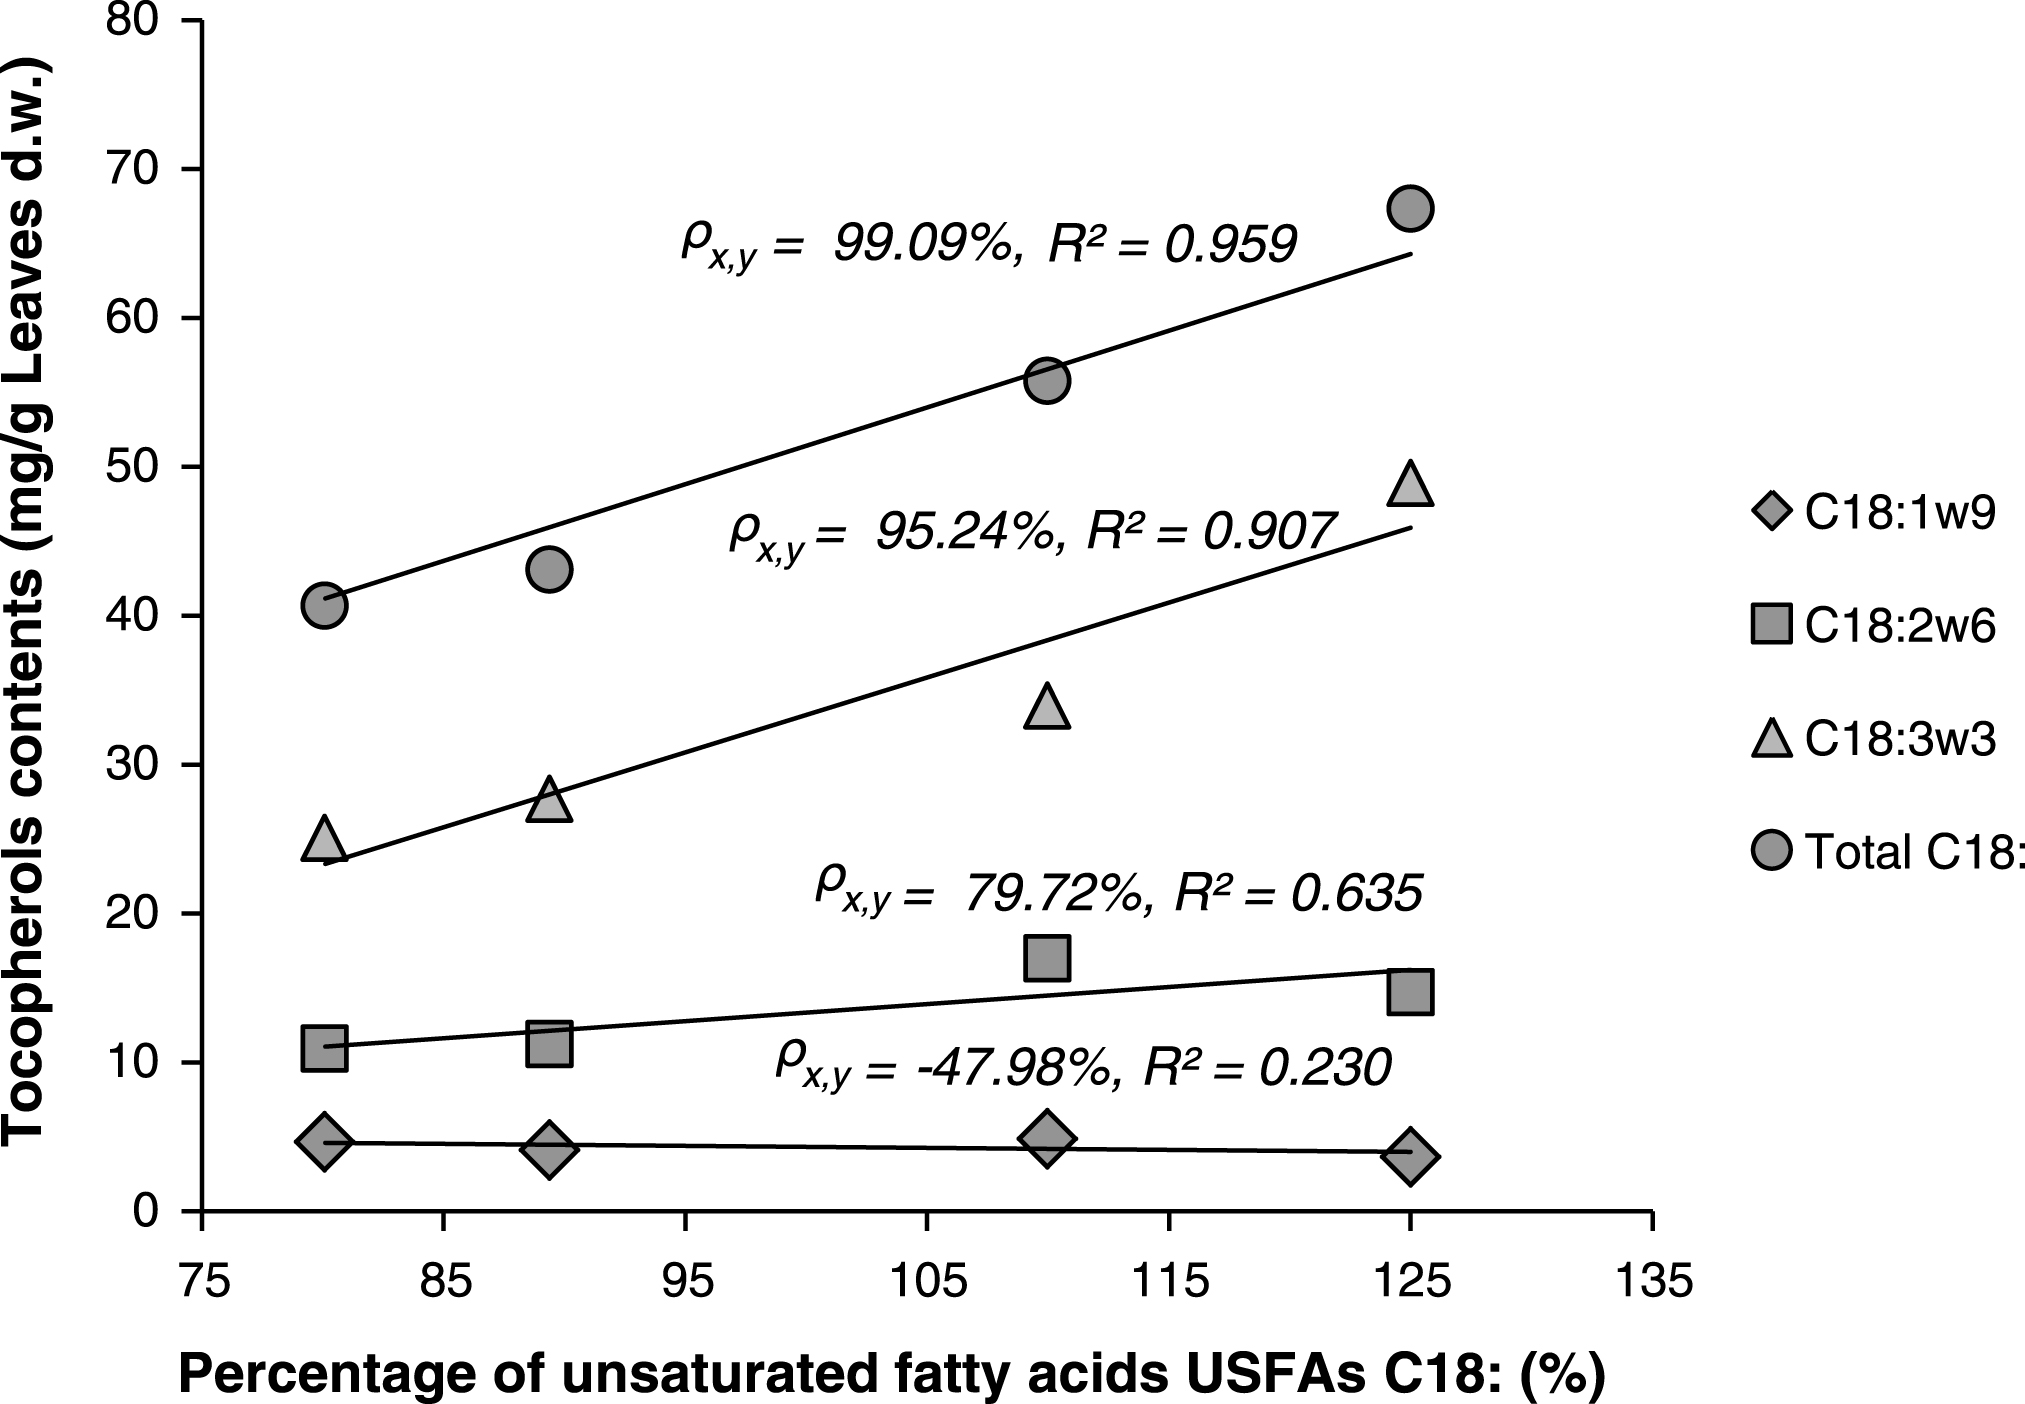
Linear correlations between percentages of unsaturated fatty acids (C18:1, 2 and 3) and total contents of tocopherols were also investigated. When exception was made for the sample Z4 (excluded), Fig. 4, shows strong linear relationship between total tocopherols and the percentages of C18:1 or C18:2 or C18:3, or the sum of these components. Especially for both C18:3 and total C18: it was observed that higher content of tocopherols in the lipids is directly correlated with higher content of C18: (or sum of C18:) “Correlation coefficient ρx,y = 95.24% and 99.09% for C18:3 and C18:, respectively”. The exclusion of sample Z4 may be explained by the fact that this sample belongs to a new different chemotype (as was above justified by statistical analysis: Figs. 1 and 2) that should be studied separately.
Fig.4
Linear correlations between percentages of unsaturated fatty acids (C18:) and total contents of tocopherols in the lipids of Pistacia lentiscus leaves.
3.6.2β-carotene bleaching test
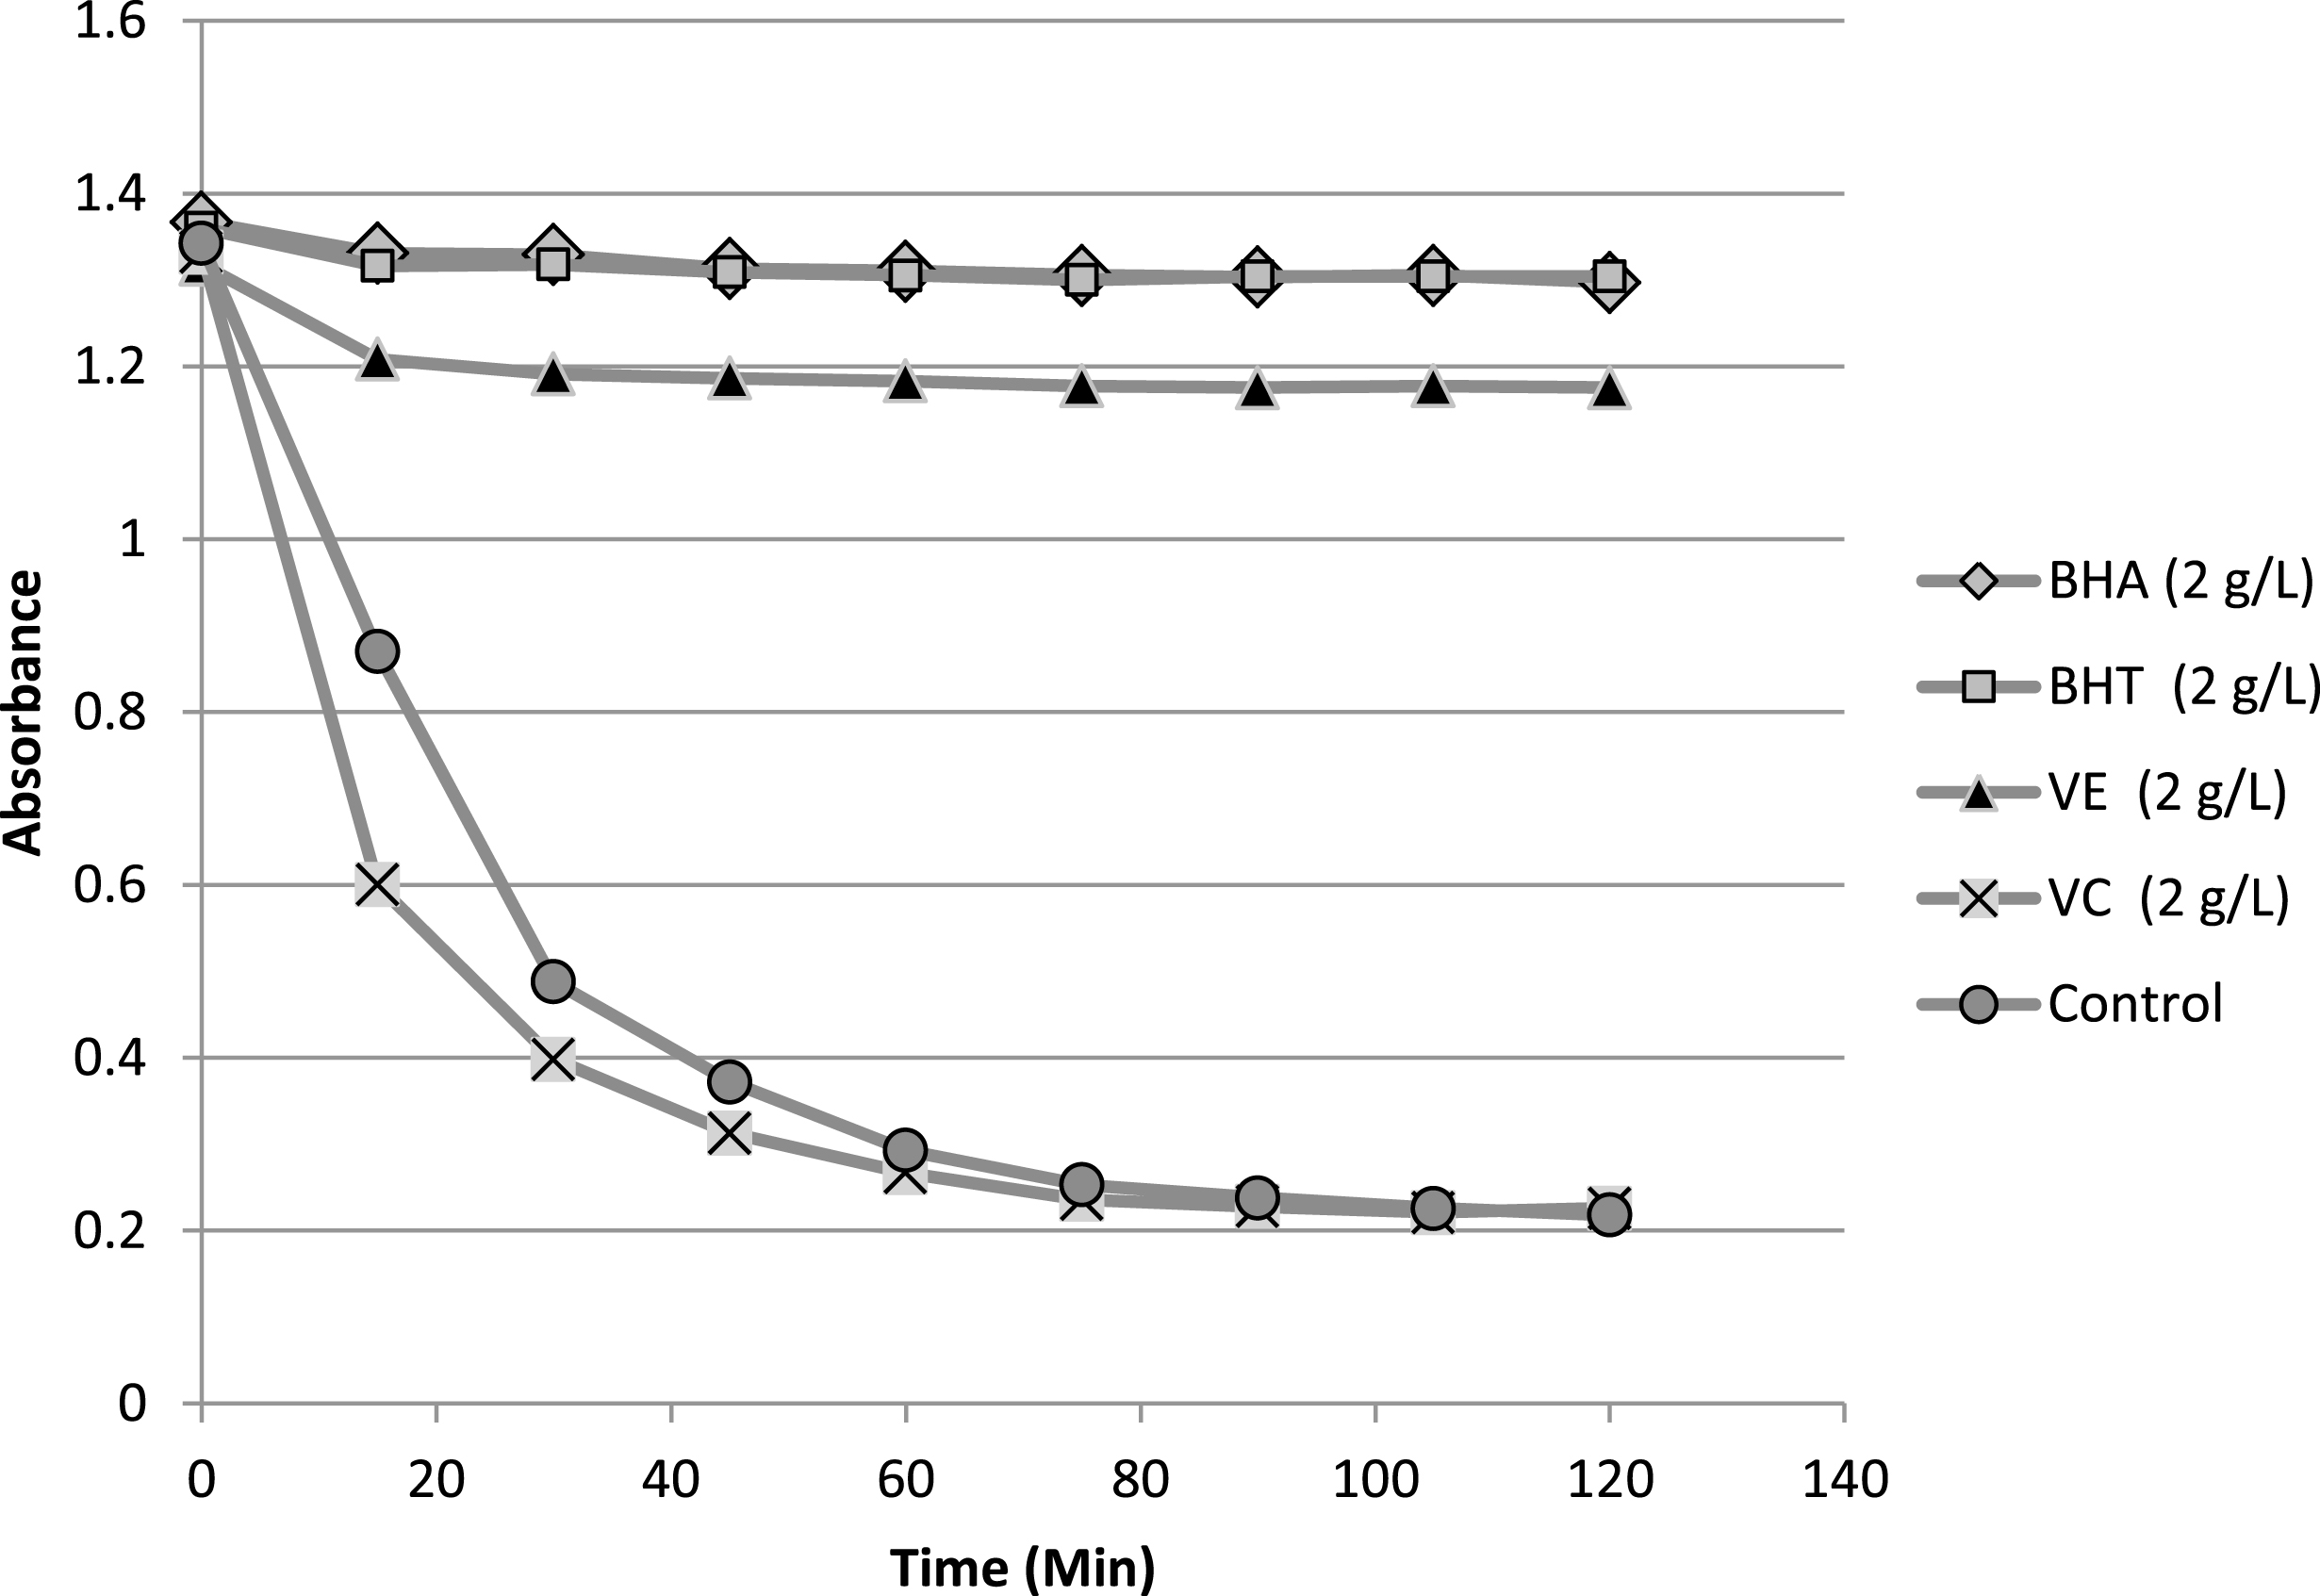
The result of β-carotene bleaching test was summarized in Table 4. In addition, kinetic evolution of antioxidants of reference (BHA, BHT, vitamin C, vitamin E) in β-carotene/linoleic system is presented in Fig. 5. The antioxidants of reference showed different responses in term of their activity at 2 mg/mL. Explicitly, vitamin C presented very weak activity in comparison with the rest of the antioxidants, whereas BHA and BHT were very effective antioxidants. Furthermore, vitamin E was also exhibiting practically lower but close activity to both BHA and BHT. The comparison of the antioxidant activity AA% of the lipid samples with those of antioxidants of reference shows some variability of this activity ranging from 37.24 to 71.72%, the highest value was recorded for sample Z2 (this value was close to recorded for vitamin E) whereas the lowest one was belonging to sample Z3. In terms of AA50, the antioxidant data values revealed the presence of two clusters of activities. The first cluster, which involves Z1 and Z2 samples, showed the highest activities in term of AA50 (1.53 and 1.43 mg/mL). The second cluster (Z3,4,5) exhibited a slightly lower activities compared to the first one with AA50 range variation of 2.21–2.52 mg/mL. As a conclusion the lipid fractions presented good antioxidant activities in comparison with those of antioxidant of reference.
Fig.5
Evolution of the absorbance of antioxidants of reference in β-carotene/linoleic system as function of time.
3.7Correlations between C18:, tocopherols and antioxidant activities
In order to determine possible existing relations between antioxidant activity (two assays) and the main important chemical components of the fatty acids (C18:1,2,3) and tocopherols (α,β,δ-Toc), correlations between these three groups of variables were determined using Excel internal statistical function “COEFFICIENT.CORRELATION”. The results were gathered in Table 5. Strong positive correlation was found between IC50 (DPPH assay) and the two isomers β,δ-Toc. Alternatively, strong negative correlation was obtained between IC50 and α-Toc Moreover, good correlation was also found between IC50 and USFAs C18: except for the case of C18:3 where low correlation value was noticed (15.61%). This means that the higher antiradical power (lower IC50 values) is primarily correlated with high percentages of α-Toc (strong negative correlation), and in the same time with low percentage of C18:1,2 and β,δ-Toc. For β-carotene assay, the results indicated no meaningful correlation between the three investigated variables. Furthermore, correlations between the percentages of the two sets of variables C18:1,2 and α,β,δ-Toc were also determined. First, C18:2 was highly positively correlated with β,δ-Toc, and at the same time highly negatively correlated with α-Toc. Secondly, tocopherols isomers were exhibiting some strong correlations within each others i.e. α-Toc was strongly and negatively correlated with β,δ-Toc isomers, which means that the highest percentages of α-Toc were related to the lowest percentages of both β- and δ-Toc. In the same context, β- and δ-Toc were strongly positively correlated with each others; this result consolidates the previous above statement.
Table 5
Correlations between antioxidant activity (DPPH assay and β-carotene test), C18: and tocopherols
| AA50 β-carontene | IC50 DPPH | 18:1 | 18:2 | 18:3 | α-Toc | β-Toc | δ-Toc | |
| AA50 β-carontene | 1.0000 | 0.4425 | 0.2730 | – 0.0991 | – 0.6081 | – 0.3566 | 00.2578 | 00.3905 |
| IC50 DPPH | 1.0000 | 0.7484 | 00.7139 | 00.1561 | – 0.9267 | 00.9119 | 00.8616 | |
| 18:1 | 1.0000 | 00.2260 | – 0.0831 | – 0.4612 | 00.6362 | 00.3134 | ||
| 18:2 | 01.0000 | 00.5946 | – 0.8840 | 00.8130 | 00.8578 | |||
| 18:3 | 01.0000 | – 0.2746 | 00.1093 | 00.3570 | ||||
| α-Toc | 01.0000 | – 0.9214 | – 0.9693 | |||||
| β-Toc | 01.0000 | 00.7976 | ||||||
| δ-Toc | 01.0000 |
4Conclusion
One of the objectives of food industry is to seek new resources of oil that preferably presents nutritional values. For human health, fats and particularly vegetable oils are considered as an important source of energy when glucose is not available.
The lipids of leaves of P. lentiscus are rich in two very important USFAs: linoleic (up to 16.99%) and linolenic (up to 48.92%) acids, which are known for their multiple dietary, pharmaceutical and clinical benefits. This obtained percentage of linolenic acid is the highest one yet recorded for this plant part. The naturally occurring fatty acid: conjugated linoleic acid (C18:2), presents different proprieties such anti-atherogenic and anti-carcinogenic [40]. In the same context and besides its role in reducing cardiovascular disease risk, α-linolenic acid (C18:3) presents also dietary effects such as anti-inflammatory and antiatherogenic [41].
The main result of this study illustrate the nutritional potential (richness in MUFA such as C18:1w9, presence of essential fatty acids such as C18:2w6 at all the stages of maturation, richness in omega-3 fatty acids such as C18:3w3) of the oil of P. lentiscus leaves, which can provide opportunities for rational exploitation for medicinal purposes and in the food industries. The results of statistical analysis showed else more the occurrence of at least two FAs chemoypes. Further investigations involving larger number of populations are required to identify all possible existing chemotypes. Regarding tocopherols analysis by HPLC, the samples were highly rich in α-tocopherol (up to 89.17%), which could be exploited in both food and pharmaceutical industries.
References
[1] | Rauf A , Patel S , Uddin G , Siddiqui BS , Ahmad B , Muhammad N , Mabkhot YN , Hadda TB . Phytochemical, ethnomedicinal uses and pharmacological profile of genus Pistacia. Biomed Pharmacother. (2017) ;86: : (Supplement C): 393–404. doi:10.1016/j.biopha.2016.12.017 |
[2] | Abidi A , Aissani N , Sebai H , Serairi R , Kourda N , Ben Khamsa S . Protective effect of Pistacia lentiscus oil against bleomycin-induced lung fibrosis and oxidative stress in rat. Nutr Cancer. (2017) ;69: (3):490–7. doi:10.1080/01635581.2017.1283423 |
[3] | Gündoğdu gdu M , Akdeniz F , Özbek FE , Demirci S , Adigüzel V . A promising method for recovery of oil and potent antioxidant extracts from Pistacia khinjuk Stocks seeds. Ind Crops Prod. (2016) ;83: (Supplement C): 515–21. doi:10.1016/j.indcro2015.12.076 |
[4] | Naouar MS , Mekki LZ , Charfi L , Boubaker J , Filali A . Preventive and curative effect of Pistacia lentiscus oil in experimental colitis. Biomed Pharmacother. (2016) ;83: (Supplement C): 577–83. doi:10.1016/j.biopha.2016.07.021 |
[5] | Andreadou I , Mitakou S , Paraschos S , Efentakis P , Magiatis P , Kaklamanis L , Halabalaki M , Skaltsounis L , Iliodromitis EK . “Pistacia lentiscus L. ” reduces the infarct size in normal fed anesthetized rabbits and possess antiatheromatic and hypolipidemic activity in cholesterol fed rabbits. Phytomedicine. (2016) ;23: (11): 1220–6. doi:10.1016/j.phymed.2016.06.002 |
[6] | Costa J , Silva I , Vicente AA , Oliveira MBPP , Mafra I . Pistachio nut allergy: An updated overview. Crit Rev Food Sci Nutr. (2017) ; (In press). doi:10.1080/10408398.2017.1379947 |
[7] | Beghlal D , El Bairi K , Marmouzi I , Haddar L , Mohamed B . Phytochemical, organoleptic and ferric reducing properties of essential oil and ethanolic extract from Pistacia lentiscus (L.). Asian Pacific Journal of Tropical Disease. (2016) ;6: (4):305–10. doi:10.1016/S2222-1808(15)61035-0 |
[8] | Kalogeropoulos N , Chiou A , Ioannou MS , Karathanos VT . Nutritional evaluation and health promoting activities of nuts and seeds cultivated in Greece. Int J Food Sci Nutr. (2013) ;64: (6):757–67. doi:10.3109/09637486.2013.793298 |
[9] | Hacibekiroğlu glu Ii , Yilmaz PK , Ha¸imi N , Kilinç E , Tolan V , Kolak U . In vitro biological activities and fatty acid profiles of Pistacia terebinthus fruits and Pistacia khinjuk seeds. Nat Prod Res. (2015) ;29: (5):444–6. doi:10.1080/14786419.2014.947492 |
[10] | Hadjimbei E , Botsaris G , Goulas V , Gekas V . Health-promoting effects of pistacia resins: Recent advances, challenges, and potential applications in the food industry. Food Rev Int. (2015) ;31: (1):1–12. doi:10.1080/87559129.2014.938350 |
[11] | Yemmen M , Landolsi A , Ben Hamida J , Megraud F , Trabelsi Ayadi M . Antioxidant activities, anticancer activity and polyphenolics profile, of leaf, fruit and stem extracts of Pistacia lentiscus from Tunisia. Cell Mol Biol (Noisy-le-grand). (2017) ;63: (9):87–95. doi:10.14715/cmb/2017.63.9.16 |
[12] | Ojeda-Amador RM , Fregapane G , Salvador MD . Composition and properties of virgin pistachio oils and their by-products from different cultivars. Food Chem. (2018) ;240: (Supplement C):123–30. doi:10.1016/j.foodchem.2017.07.087 |
[13] | Pantano L , Lo Cascio G , Alongi A , Cammilleri G , Vella A , Macaluso A , Cicero N , Migliazzo A , Ferrantelli V . Fatty acids determination in Bronte pistachios by gas chromatographic method. Nat Prod Res. (2016) ;30: (20):2378–82. doi:10.1080/14786419.2016.1180599 |
[14] | Lo-Presti M , Sciarrone D , Crupi ML , Costa R , Ragusa S , Dugo G , Mondello L . Evaluation of the volatile and chiral composition in Pistacia lentiscus L. essential oil. Flavour Fragrance J. (2008) ;23: (4):249–257. doi:10.1002/ffj.1878 |
[15] | Yildirim H . Micropropagation of Pistacia lentiscus L. from axenic seedling-derived explants. Scientia Horticulturae. (2012) ;137: :29–35. doi:10.1016/j.scienta.2012.01.020 |
[16] | Krishnaiah D , Sarbatly R , Nithyanandam R . A review of the antioxidant potential of medicinal plant species. Food Bioprod Process. (2011) ;89: (3):217–33. doi:10.1016/j.fb2010.04.008 |
[17] | Nahida AS , Siddiqui A . Pistacia lentiscus: A review on phytochemistry and pharmacological properties. Int J Pharm Pharm Sci. (2012) ;4: (4):16–20. |
[18] | Landau S , Muklada H , Markovics A , Azaizeh H . Traditional Uses of Pistacia lentiscus in Veterinary and Human Medicine. In: Yaniv Z , Dudai N (eds) Medicinal and Aromatic Plants of the Middle-East. 2: . Springer Netherlands, (2014) , pp. 163–80. doi:10.1007/978-94-017-9276-9_8 |
[19] | Kivçak B , Akay S . Quantitative determination of α-tocopherol in Pistacia lentiscus, Pistacia lentiscus var. chia, and Pistacia terebinthus by TLC-densitometry and colorimetry. Fitoterapia. (2005) ;76: (1):62–6. doi:10.1016/j.fitote.2004.09.021 |
[20] | Mezni F , Aouadhi C , Khouja ML , Khaldi A , Maaroufi A . In vitro antimicrobial activity of Pistacia lentiscus L. edible oil and phenolic extract. Nat Prod Res. (2015) ;29: (6):565–70. doi:10.1080/14786419.2014.952232 |
[21] | Trabelsi H , Sakouhi F , Renaud J , Villeneuve P , Khouja ML , Mayer P , Boukhchina S . Fatty acids, 4-desmethylsterols, and triterpene alcohols from Tunisian lentisc (Pistacia lentiscus) fruits. Eur J Lipid Sci Technol. (2012) ;114: (8):968–73. doi:10.1002/ejlt.201100146 |
[22] | Trabelsi H , Cherif OA , Sakouhi F , Villeneuve P , Renaud J , Barouh N , Boukhchina S , Mayer P . Total lipid content, fatty acids and 4-desmethylsterols accumulation in developing fruit of Pistacia lentiscus L. growing wild in Tunisia. Food Chem. (2012) ;131: (2):434–40. doi:10.1016/j.foodchem.2011.08.083 |
[23] | Mizi A , Djedaia S . Physico-chemical and biochemical properties of oil extracted from Pistacia lentiscus. Asian J Chem. (2010) ;22: (1):646–50. |
[24] | Mekni N . GC/MS chemical analysis of Pistashia lentiscus fatty oil from the north of Tunisia. International Journal of PharmTech Research. (2011) ;3: (4):2245–8. doi:10.13140/rg.2.1.1689.7448 |
[25] | Mezni F , Khaldi A , Maaroufi A , Hamrouni L , Msallem M , Boussaid M , Khouja ML . Fatty acid composition and biological properties of the fixed oil of the fruits of Pistacia lentiscus L. Acta Horticulturae. (2013) ;997: , 219–24. |
[26] | Mezni F , Khouja ML , Gregoire S , Martine L , Khaldi A , Berdeaux O . Effect of growing area on tocopherols, carotenoids and fatty acid composition of Pistacia lentiscus edible oil. Nat Prod Res. (2014) ;28: (16):1225–30. doi:10.1080/14786419.2014.895724 |
[27] | Mezni F , Labidi A , Msallem M , Boussaid M , Khouja M , Khaldi A . Influence of harvest date on fatty acid composition and antioxidant activity of Pistacia lentiscus L. edible oils. J Mater Environ Sci. (2014) ;5: (6):1703–8. |
[28] | Haouli A , Seridi R , Djemli S , Bourdjiba O . Contribution to the analysis of Pistacia lentiscus extracted oil. American-Eurasian Journal of Agricultural and eEnvironmental Sciences. (2015) ;15: (6):1075–81. |
[29] | Charef M , Yousfi M , Saidi M , Stocker P . Determination of the fatty acid composition of acorn (Quercus), Pistacia lentiscus seeds growing in Algeria. Journal of the American Oil Chemists Society. (2008) ;85: (10) 921–4. doi:10.1007/s11746-008-1283-1 |
[30] | Dhifi W , Jelali N , Chaabani E , Beji M , Fatnassi S , Omri S , Mnif W . Chemical composition of Lentisk (Pistacia lentiscus L.) seed oil. African Journal of Agricultural Research. (2013) ;8: (16):1395–400. doi:10.5897/AJAR11.1837 |
[31] | Mezni F , Labidi A , Khouja ML , Martine L , Berdeaux O , Khaldi A . Diversity of sterol composition in tunisian Pistacia lentiscus seed oil. Chem Biodivers. (2016) ;13: (5): 544–8. doi:10.1002/cbdv.201500160 |
[32] | Diamantoglou S , Meletiou-Christou M . Das jahresperiodische Verhalten des Rohfetts und der Fettsäuren in Rinden und Bläuern von Pistacia lentiscus, Pistacia terebinthus und Pistacia vera: The Lipid Content and Fatty Acid Composition of Barks and Leaves of Pistacia lentiscus, Pistacia terebinthus and Pistacia vera During the Course of a Year. Zeitschrift für Pflanzenphysiologie. (1979) ;93: (3):219–28. doi:10.1016/S0044-328X(79)80200-7 |
[33] | Akdemir OF , Tilkat E , Onay A , Keskin C , Bashan M , Kilinç FM , Kizmaz V , Süzerer V . Determination of the fatty acid composition of the fruits and different organs of lentisk (Pistacia lentiscus L.). J Essent Oil-Bear Plants. (2015) ;18: (5):1224–33. doi:10.1080/0972060X.2014.986541 |
[34] | Emmerie A , Engel C . Colorimetric determination of α-tocopherol (vitamin E). Recl Trav Chim Pays-Bas. (1938) ;57: (12):1351–5. doi:10.1002/recl.19380571207 |
[35] | Naudet M , Hautfenne A . Méthode normalisée pour la détermination des stérols totaux dans les huiles et graisses (y compris les résultats d’une étude en collaboration)=Standardized method for the determination of total sterols in oils and fats (including the results from a collaborative study). Revue Française des Corps Gras. (1986) ;33: (4):167–70. |
[36] | Barreto MC . Lipid extraction and cholesterol quantification: A simple protocol. J Chem Educ. (2005) ;82: (1):103. doi:10.1021/ed082p103 |
[37] | Dib I , Fauconnier M-L , Sindic M , Belmekki F , Assaidi A , Berrabah M , Mekhfi H , Aziz M , Legssyer A , Bnouham M . Chemical composition, vasorelaxant, antioxidant and antiplatelet effects of essential oil of Artemisia campestris L. from Oriental Morocco. BMC Complement Altern Med. (2017) ;17: (1): 82. doi:10.1186/s12906-017-1598-2 |
[38] | Villa B , Calabresi L , Chiesa G , Risè P , Galli C , Sirtori CR . Omega-3 fatty acid ethyl esters increase heart rate variability in patients with coronary disease. Pharmacol Res. (2002) ;45: (6):475–8. doi:10.1006/phrs.2002.0989 |
[39] | Yaqoob P . Monounsaturated fatty acids and immune function. Eur J Clin Nutr. (2002) ;56: (Suppl 3) S9–S13. doi:10.1038/sj.ejcn.1601477 |
[40] | Houseknecht KL , Heuvel JPV , Moya-Camarena SY , Portocarrero CP , Peck LW , Nickel KP , Belury MA . Dietary Conjugated Linoleic Acid Normalizes Impaired Glucose Tolerance in the Zucker Diabetic Fattyfa/faRat. Biochem Biophys Res Commun. (1998) ;244: (3):678–82. doi:10.1006/bbrc.1998.8303 |
[41] | Zhao G , Etherton TD , Martin KR , West SG , Gillies PJ , Kris-Etherton PM . Dietary α-linolenic acid reduces inflammatory and lipid cardiovascular risk factors in hypercholesterolemic men and women. The Journal of Nutrition. (2004) ;134: (11):2991–7.doi:10.1093/jn/134.11.2991 |


