
Hydroxycinnamic acids profiling, in vitro evaluation of total phenolic compounds, caffeine and antioxidant properties of coffee imported, roasted and consumed in Algeria
Abstract
BACKGROUD:
Coffee is the most popular beverages consumed worldwide. It is an important source of antioxidants that can inhibit harmful effects of free radicals.
OBJECTIVE:
Comparative analysis of imported, roasted and consumed coffee in Algeria.
METHODS:
Investigation of the hydroxycinnamic acids profile of dark roasted coffee beans UHPLC-DAD-ESI-MSn analysis and in vitro evaluation of total phenolic compounds (TPC), caffeine and antioxidant activity using DPPH, ABTS, reducing power and phosphomolybdum methods in green and roasted Arabica and Robusta coffees beans and in coffee brews (Moka, Turk and Filter) prepared from a blend of Arabica and Robusta 20:80.
RESULTS:
Arabica and Robusta dark roasted beans had similar chromatographic profiles, being rich in caffeoylquinic acid and feruloylquinic acid isomers. Compared to green beans, roasted coffee beans had higher amounts of TPC while caffeine drastically decreased. The antioxidant activity increased after roasting, while the reducing activity was decreased. Filter coffee showed the highest levels of TPC and caffeine (0.69±0.05 g GAE/100 g, 0.96±0.08 mg/g respectively), which exhibits the higher reducing activity for the iron (III) and molybdate with 0.45±0.01 g GAE/100 g, 134.30±2.38 mg GAE/100 g, respectively. However, the Turk coffee exhibited the highest antiradical activity with 73.34% and 83.63% towards DPPH and ABTS, respectively. Significant correlations were recorded between TPC, caffeine and reducing power (r = 0.89) and (r = 0.97) respectively.
CONCLUSION
Despite the high roasting degree applied to green coffee beans, the consumed coffee constitute an important source of chlorogenic acids and its derivatives with high antioxidant potential that are beneficial for human health.
1Introduction
In the last few decades, people are very interested in their diet and its impact on their health. Consumption of fruits and vegetables has been associated with protection against various diseases, including cardiovascular, cerebrovascular disease and cancer [1, 2]. It is not known for certain what active dietary constituents contribute to the beneficial effects, but it is often assumed that antioxidant nutrients contribute to this defense. Results from intervention trials on the protective effect of the supplementation with antioxidants such as β-carotene and vitamin E are not conclusive [3]. Therefore, the beneficial effect of a high intake of fruits and vegetables on the risk of cardiovascular disease and cancer may rely not on the effect of the well-characterized antioxidants, such as vitamin E and C and β-carotene but rather on some other antioxidants or non-antioxidant phytochemicals or by an additive action of different compounds present in foods such as β-linolenic acid, various phenolic compounds and fiber [1, 2, 4]. Coffee is one of the most popular beverages consumed worldwide with over 400 billion cups consumed each year. It is also the most important traded product in the world after fuel. Global output reached 8.2 million tons in 2011. World consumption of coffee increases annually to reach 7.9 million tons in 2011 [5].
Major concern about coffee effects on health has been mainly devoted to its possible harmful effects. Recently, interest is being oriented to many beneficial properties of coffee consumption. Many epidemiological and experimental studies have shown positive effects of regular coffee drinking on various health issues. According to recent investigations, the consumption of moderate amounts of coffee (two to four cups per day) has valuable effects; it reduces the risk of liver cancer and colon cancer, gallstones, cirrhosis of the liver, diabetes, coronary heart disease, depression, Alzheimer’s and Parkinson’s diseases [6–10].
One of the most important properties of coffee is its antioxidant activity [11, 12]. In fact, roasted coffee and brews are rich sources of antioxidant compounds, namely polyphenols [13–16], melanoidins [15, 17], caffeine [15, 18] and chlorogenic acid [19, 20].
Coffea arabica (known as Arabica coffee) and Coffea canephora var. Robusta (known as Robusta coffee) represent the two main species of coffee with greatest commercial significance [21]. These two species show great differences in the agronomical characteristics, chemical composition and organoleptic properties [22–25].
Blend of these two species and its brewing process are important factors which may influence coffee’s antioxidant capacities. Moka, Turk and Filter coffees are the most popular brews consumed in Algeria, prepared with a coffee blend 20:80 of Arabica and Robusta respectively. This mix was selected by coffee manufacturers and consumers to minimize the cost of coffee due to the high price of Arabica compared to Robusta [12, 26, 27].
In order to evaluate total antioxidant capacity of coffee, several methods based on the measurement of the redox potential of extracts were previously used including DPPH and ABTS [11, 28, 29]. Therefore, the purpose of this study was to identify the hydroxycinnamic acids in Arabica and Robusta coffee beans after dark roasting (Algerian favorite roasting degree, 240°C/25 min) and to quantify total phenolic compounds and caffeine in green and dark roasted coffee beans and in coffee brews (Moka, Turk and Filter) prepared from a blend of Arabica:Robusta 20:80. Moreover, their total antioxidant activity was also evaluated by using different tests.
2Material and methods
2.1Chemicals and reagents
All chemicals used throughout the study were purchased from Sigma Algerian Chemical Society, Setif, Algeria.
2.2Preparation of coffee
2.2.1Coffee powders preparation
Arabica (Coffea arabica) and Robusta (Coffea canephora) [21] green coffee beans, imported from Brazil and Ivory Cost respectively, as well as dark roasted coffee beans (240°C/25 min) were provided from the local market (Bejaia, Algeria). Fifty grams of green and roasted coffee beans were ground with an electronic grinder (IKA A11 basic, Germany) and sieved by an electronic sieve (Retsch AS 200, Haan. Germany) in order to obtain an homogenous powder (pore sieve: 500 μm in diameter).
2.2.2Coffee phenolic extracts preparation
Total phenolic compounds were extracted from green and dark coffee powders. One gram of ground coffee powder sample was extracted with 40 mL methanol/water (50:50). The pH was adjusted to pH = 2.0. Samples were thoroughly shaken at room temperature for 1 h then centrifuged at 2500 g for 10 min. The supernatant was recovered and 40 mL of acetone/water (70:30) were added to the residue. After shake and centrifugation, both extracts (15:15 mL) were mixed [27].
2.2.3Coffee brew preparations
Three kinds of preparations commonly consumed by the Algerian people were assessed: Moka, Turk and Filter Coffees. The coffee powder milled at 20:80 (m:m) of Arabica: Robusta, according to the roasted coffee habitually commercialized in Algeria. The brews were prepared in triplicate.
2.2.3.1Moka coffee (press).
In this preparation a coffee pot known as “Moka” or “press” was used. The coffee pot consists of three different parts. The first part is a classic boiler with a capacity of approximately 50 mL. The second part is a metallic filter which is located at the top of the boiler and approximately contains 10 g of the coffee powder, not pressed. The third part is a classic cylindrical cooler where the coffee drink is quickly cooled and then collected before use. The hot water distills from the boiler and, due to a slight overpressure existing in the device, extracts the coffee powder cooling itself in the upper part of the coffee pot [27, 30].
2.2.3.2Turk coffee (traditional).
Turk coffee preparation required a traditional metallic vessel known as “ibrik”. In a kettle contained 100 mL of water heated to 100 °C very slowly, 10 g of coffee powder were added. After boiling, 5 mL of cold water were added and the mixture was re-heated again to 100 °C. This process was repeated twice more times to facilitate the precipitation of coffee insoluble compounds. After this procedure, the upper part of the obtained suspension was collected [30].
2.2.3.3Filter coffee.
Filter coffee brew was prepared using an electric drip filter coffee maker equipped with a filter KRUPS (KRUPS®, BRAZIL). The beverage is collected in the below jug. Extraction takes 7-8 min, at 90°C [27].
2.3pH measurement and browned compounds in coffee brew preparations
The pH measurements of coffee brews were performed in triplicate for each preparation, with an HANNA 211 pH-meter (HANNA Instrument®, FRANCE).
For assessment of browned compounds, 50 microliters of coffee brews were diluted up to 2 mL. After 2 min, browned compounds were quantified by measuring the absorbance of the sample at 420 nm [31].
2.4Identification and quantification of antioxidants
2.4.1Identification of hydroxycinnamic acids in roasted beans
Arabica and Robusta dark roasted coffee beans infusions prepared, were analyzed by UPLC-DAD -ESI/ MSn for identification of hydroxycinnamic acids [30]. As known, this class of compounds comprise the main phenolics in coffee matrix. UPLC-DAD/MSn analysis was performed on an Ultimate 3000 (Dionex Co., USA) apparatus equipped with an ultimate 3000 Diode Array Detector (Dionex Co., USA) and coupled to a mass spectrometer. The chromatographic system consisted of a quaternary pump, an autosampler, a photodiode-array detector and an automatic thermostatic column compartment. Analysis was run on a Hypersil Gold (Thermo Scientific, USA) C18 column (100 mm length; 2.1 mm i.d.; 1.9 μm particle diameter, end-capped) and its temperature was maintained at 30°C. The mobile phase was composed of (A) 0.1% of formic acid (v/v) and acetonitrile (B). The solvent gradient started with 5% of solvent (B), reaching 40% at 14 min and 100% at 16 min, followed by the return to the initial conditions. The flow rate was 0.1 mL.min–1 and UV–Vis spectral data for all peaks were accumulated in the range 200–500 nm while the chromatographic profiles were recorded at 280 and 320 nm.
The mass spectrometer used was a Thermo LTQ XL (Thermo Scientific, USA) ion trap MS equipped with an ESI source. Control and data acquisition were carried out with the Thermo X caliber Qual Browser data system (Thermo Scientific, USA). Nitrogen above 99% purity was used and the gas pressure was 520 kPa (75 psi). The instrument was operated in negative-ion mode with ESI needle voltage set at 5.00 kV and an ESI capillary temperature of 275°C. The full scan covered the mass range from m/z 100 to 2000. CID and MSn experiments were simultaneously acquired for precursor ions using helium as the collision gas with collision energy of 25–35 arbitrary units.
2.4.2Quantification of total phenolic compounds
Total phenolic compounds of green and roasted coffee beans extracts and coffee brews were determined photometrically (UV-VIS spectrophotometer, Shimadzu) according to the Folin–Ciocalteu procedure using gallic acid as standard and expressing the results as gram equivalent gallic acid (GAE) per 100 grams of dry coffee [15].
2.4.3Quantification of Caffeine
The micro-method for determination of caffeine content in coffee beans extracts or coffee brews was used. Briefly, the pH of the coffee samples was adjusted to 8–9. Ten milliliters of benzene, 100 μL of sample and 0.5 g of NaCl were mixed, shaken (1 min), and centrifuged (10 min, 3500 rpm). Five mL of benzene layer was combined with 5 mL of 5 N H2SO4, mixed and centrifuged (5 min, 3500 rpm). The bottom (H2SO4) layer was pipetted into a quartz cuve and the absorbance was read at λ= 273 nm against a blank (H2SO4) [32]. Results obtained from triplicates analyses, were calculated using a standard curve and expressed as mg caffeine per grams of dry coffee.
2.5Antioxidant activity
2.5.1Reducing power method
An aliquot of 0.1 mL of the samples (coffee extracts and brews) was added to 2.5 mL of phosphate buffer (0.2 mol/L, pH 6.6) and 2.5 mL of aqueous potassium ferricyanide solution (10%, w:v). After stirring, the mixture was incubated at 50°C for 20 min. Then, 2.5 mL of aqueous trichloroacetic acid solution (10%, w:v) were added. An aliquot of 1.25 mL of distilled water and 0.25 mL of aqueous ferric chloride solution (0.1 g/100 mL) were added to 1.25 mL of the mixture. The absorbance was determined at λ= 700 nm. The results were expressed as g gallic acid equivalent per 100 grams of dry coffee [33–35].
2.5.2Phosphomolybdenum method
An aliquot of 0.1 mL of sample solution was combined with 1 mL of reagent solution (0.6 M sulfuric acid, 28 mM sodium phosphate and 4 mM ammonium molybdate). The tubes were capped and incubated in a boiling water-bath at 95°C for 90 min. After cooling at room temperature, the absorbance was measured at λ= 695 nm against a blank. The results were expressed as equivalents of mg quercetin per 100 grams of dry coffee [34].
2.5.3DPPH test
Methanolic DPPH solution 6.1×10⁵ M of DPPH was prepared and adjusted with methanol to an absorbance of 0.7 (±0.02) at 515 nm. DPPH solution was added to 100 μL of coffee bean extracts or 100 μL of coffee brews. After mixing, the absorbance was read at λ= 517 nm. The percentage of reduction of radical DPPH was calculated as follows: Radical-scavenging activity % = [(Ac - Ae)/Ac] *100, where Ac is the absorbance of the control (DPPH radical + methanol) and Ae is the absorbance of the extracts (DPPH radical + extract of coffee beans and brews) [29, 36].
2.5.4ABTS test
The ABTS radical cation (ABTS+) was produced by reacting 7 mM ABTS stock solution with 2.45 mM potassium persulphate and the mixture was incubated in the dark at room temperature for 12–16 h before use. The ABTS+ solution (stable for 2 days) was diluted with 5 mM phosphate buffered saline (pH 7.4) to an absorbance of 0.70±0.02 at λ= 730 nm. After addition of diluted ABTS+ to solution sample (100 μL), absorbance readings were measured after 6 min. The percentage of reduction of radical ABTS was calculated as follows: Radical-scavenging activity % = [(Ac - Ae)/Ac] *100, where Ac is the absorbance of the control (ABTS radical + methanol) and Ae is the absorbance of the extracts (ABTS radical + extract of coffee beans and brews) [27].
2.6Statistical analysis
All experiments were carried out in triplicate. Results were expressed as means±standard deviation. One-way analysis of variance (ANOVA) was applied to compare data using software STATISTICA 5.5. Fisher LSD (Least Significant Difference) was used to compare means of the estimated antioxidants contents and antioxidants activities. For all tests p < 0.05 was considered significant.
The correlations between the measured parameters were calculated with basic statistic using the correlation matrix.
3Results and discussion
3.1pH and browned compounds in coffee brew preparations typically consumed by the Algerian people
The pH values and absorbance of browned compounds of coffee brews prepared by different techniques (i.e. Moka, Turk and filter) from blend of Arabica and Robusta 20:80 are shown in Table 1. For the three preparations, the recorded pH values were relatively high, ranging from 6.22 to 6.43 induced by the high degree of roasting as previously described [26]. Indeed, it has been shown that this process changes the profile of various coffee beans constituents. The changes of macroconstituents, i.e. saccharides and proteins are particularly significant since their thermally driven reactions lead to Maillard reactions and the formation of melanoidins [37, 38].
Table 1
pH and melanoidins (420 nm) in coffee brews
| pH | Melanoidins (420 nm) | |
| Coffee drink | ||
| Moka (A/R: 20/80) | 6.43a±0.02 | 0.750a±0.017 |
| Turk (A/R: 20/80) | 6.22b±0.03 | 0.530b±0.013 |
| Filter (A/R: 20/80) | 6.35a±0.02 | 0.282c±0.009 |
Values are mean SD±standard deviation (n = 3). Means followed by the same letter are not different according to ANOVA (Analysis of Variance).
The analysis of melanoidins in prepared coffee could provide valuable information about the roast degree. The 420 nm wavelength has been widely used for assessing the color intensity of browning reaction mixtures as it relates to the palatability of heat-processed foods and beverages [19]. In this work, the Moka coffee brews showed the higher browning index at 0.750±0.017 followed by the Turk and Filter coffees with 0.530±0.013 and 0.280±0.009 respectively. Browning compounds, mainly melanoidins, contribute to the antioxidant and other functional properties of coffee because of the presence of phenols in their skeleton [39].
3.2Identification and quantification of antioxidants in coffee beans extracts and coffee brews
3.2.1Identification of hydroxycinnamic acids in roasted coffee beans
The identification of hydroxycinnamic acids in Arabica and Robusta roasted coffee beans was achieved by UPLC-DAD-ESI-MSn, based on their retention time, UV-Vis spectra, full MS, MS2 and MS3data, together with previously reported literature data. The representative chromatographic profile of the two samples is shown in Fig. 1 and the LC-MSn data of the major detected compounds is summarized in Table 2.
Fig.1
Representative UPLC chromatographic profile at 320 nm of Arabica and Robusta coffee extracts.
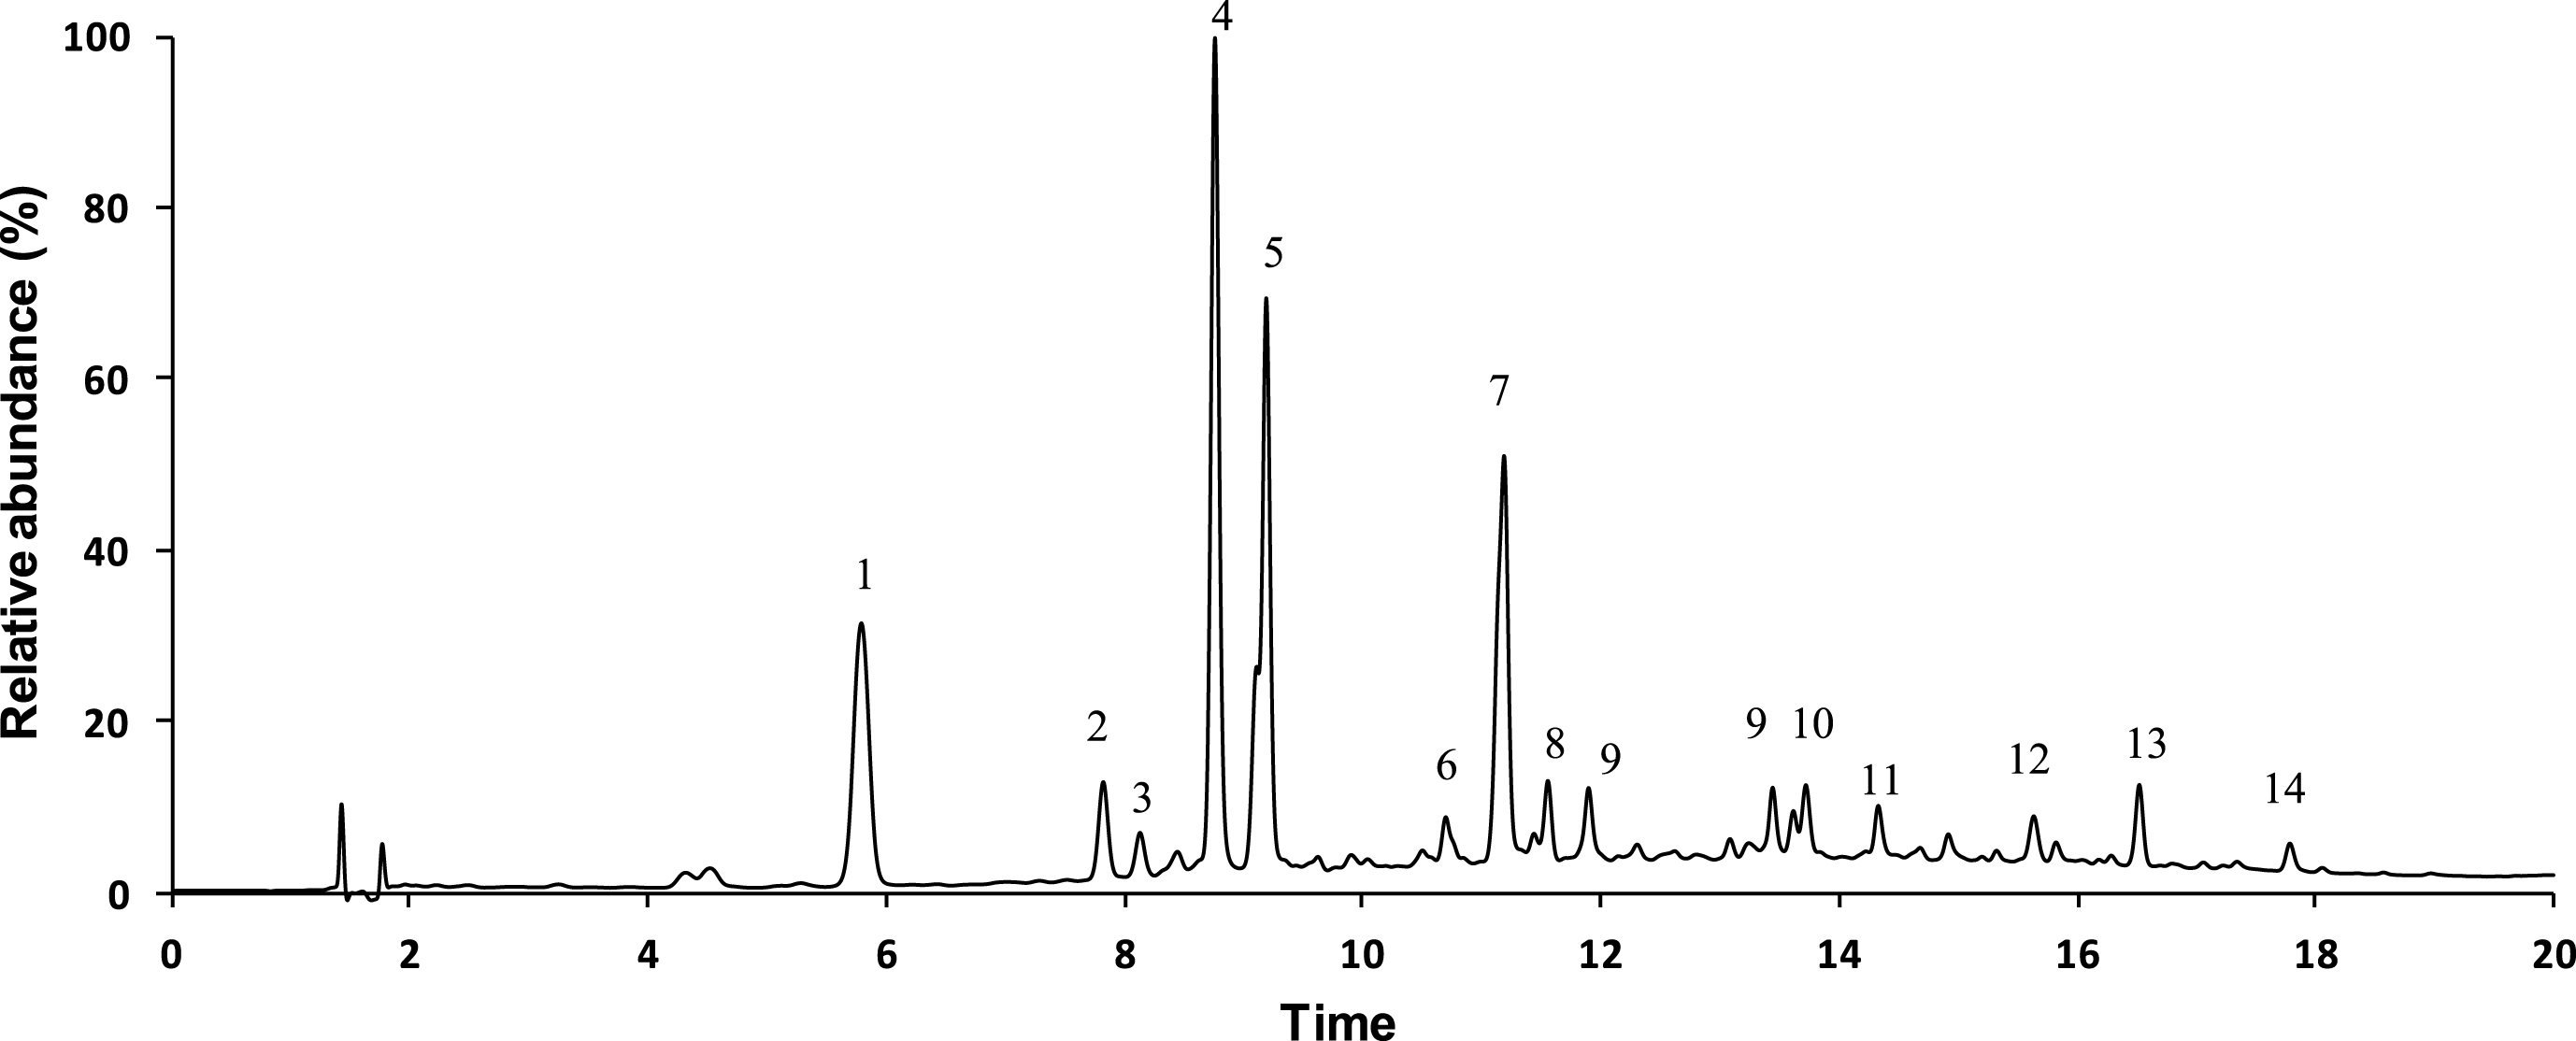
Table 2
LC-DAD-ESI/MSn data of dark roasted coffee beans (Arabica and Robusta)
| Peak | tR (min) | λ max (nm) | [M-H]- | Fragment ions, m/z (%) MS2 | Fragment ions, m/z (%) MS3 | Probable compound |
| 1 | 5.7 | 290sh, 324 | 353 | 191 (100), 179 (40), 135 (7) | [191] 193 (100) | 3-O-caffeoylquinic acid |
| 2 | 7.8 | 290sh, 324 | 353 | 191 (100) | [191] 85 (100), 127 (70) | cis 5-O-caffeoylquinic acid |
| 3 | 8.1 | 294sh, 324 | 353 | 179 (100), 191 (90), 173 (10), 135 (10) | [179] 127 (100); 173 (80), 85 (30) | caffeoylquinic acid isomer |
| 4 | 8.7 | 290sh, 325 | 353 | 191 (100), 179 (7) | [191]: 173 (100), 127 (90), 85 (65), 93 (42), 111 (30) | trans 5-O-caffeoylquinic acid |
| 5 | 9.2 | 295sh, 325 | 353 | 173 (100), 179 (50), 191 (20) | [173]: 111 (100), 93 (90) | 4-O-caffeoylquinic acid |
| 6 | 10.7 | 293sh, 324 | 367 | 191 (100), 173 (8) | [191]: 127 (100), 173 (90), 85 (30), 109 (30), 145 (20) | cis 5-O-feruloylquinic acid |
| 7 | 11.1 | 295sh, 324 | 367 | 173 (100), 193 (10) | [173]: 93 (100), 111 (60) | 4-O-feruloylquinic acid |
| 367 | 191 (100), 173 (20) | [191]: 127 (100), 173 (90), 85 (90), 109 (25), 145 (15) | trans 5-O-feruloylquinic acid | |||
| 8 | 11.5 | 290sh, 325 | 335 | 161(100), 135 (80), 179 (20) | [161]: 133 (100) | 3-O-caffeoyl-1,5-lactone |
| 9 | 11.9 | 293sh, 325 | 335 | 161 (100), 179 (20), 135 (20) | [161]: 133 (100) | 4-O-caffeoyl-1,5-lactone |
| 10 | 13.5 | 296sh, 323 | 515 | 353 (100), 335 (20), 173 (10) | [353]: 173 (100), 179 (60), 191 (55) | 3,4-di-O-caffeoylquinic acid |
| 11 | 13.7 | 292sh, 325 | 515 | 353 (100) | [353]: 191 (100), 179 (50), 173 (10), 135 (10) | 3,5-di-O-caffeoylquinic acid |
| 12 | 14.3 | 295sh, 325 | 515 | 353 (100) | [353]: 173 (100), 179 (60), 191 (30), 135 (10) | 1,4-di-O-caffeoylquinic acid |
| 13 | 16.5 | 290, 320sh | 365 | 229 (100), 135 (5) | [229]: 185 (100), 100 (12) | Caffeoyltryptophan |
| 14 | 17.8 | 290, 310sh | 349 | 229 (100) | [229]: 185 (100), 100 (17) | p-Coumaroyltryptophan |
Overall, the roasted Coffea arabica and Coffea robusta samples showed similar phenolic profiles that were rich in coffeoyl quinic acids and feruloylquinic acid, along with their derivatives. Indeed, major LC-eluting peaks in the two samples (at 5.7, 7.8 and 9.2 min) showed the same deprotonated molecule [M-H]- at m/z 353 and a typical UV-visible spectrum (shoulder at 290–295 andλ max at 324–325 nm) and MS2 and MS3 fragmentation profiles corresponding to those of caffeolyquinic acid (CQA) isomers [40, 41].
As reported, the MS2 fragment ion at m/z 191 in caffeoylquinic acids corresponds to [quinic acid – H]-, as a result of the ester bond cleavage. In turn, the C-O bond adjacent to the ester yields the [caffeic acid-H]- ion m/z 179 and the [quinic acid – H2O - H]- ion at m/z 173. The 4-caffeoylquinic acid isomer is typically characterized by this last fragment ion in MS2 spectrum (peaks 5), while the 3-caffeoylquinic acid (peaks 1) and 5-caffeoylquinic acid (peak 2, 4) showing the same MS2 base peak at m/z 191 ([quinic acid-H]-) can be distinguished by comparing the relative intensity of secondary ion form caffeoyl moiety ([caffeic acid-H]-) at m/z 179 or by fragmentation pattern in MS3, as previously described [42–44].
Along with the caffeoylquinic acid isomers, 4-O-feruloylquinic and trans 5-O-feruloylquinic acids were also major phenolic constituents of Arabica and Robusta coffee beans. These isomers were co-eluted in Peak 7 (UV max at 295sh, 325 nm, [M-H]- at m/z 367) and were assigned according to their respective MS2 fragmentation patterns ([M-H]- at m/z 367⟶173, 193 and [M-H]- at m/z 367⟶191, 173 for 4-O-feruloylquinic acid and trans 5-O-feruloylquinic acid, respectively) [44].
Besides the previous compounds, the UHPLC-DAD-ESI-MSn analysis of Arabica and Robusta coffee beans allowed to identify several minor phenolic compounds, including cis 5-O-feruloylquinic acid (peak 6), 3-O-caffeoyl-1,5-lactone and 4-O-caffeoyl-1,5-lactone (peaks 8 and 9, [M-H]- at m/z 335⟶191, 173 and m/z 335⟶191, 173, 193, respectively) [45] and the three di-caffeoylquinic acids isomers3,4-di-O-caffeoylquinic acid, 3,5-di-O-caffeoylquinic acid and 1,4-di-O-caffeoylquinic acid (peaks 10-12, [M-H]- at m/z 515) [43]. Moreover, Peaks 13 and 14 showing respectively the deprotonated molecular ions at m/z 365 and 349 and the base peak ion at m/z 229 in MS2 spectrum were tentatively identified as caffeoyl tryptophan and p-coumaroyl tryptophan [41].
In contrast, the deprotonated molecule corresponding to caffeic acid (m/z 179) which has been previously described in roasted coffee [41] was not here identified in the MS spectrum of both roasted coffees.
3.2.2Quantification of antioxidants in coffee beans extracts and coffee brews
Besides the identification of the main hydroxycinnamic acids in roasted Arabica and Robusta dark roasted beans, the present study intended to determine the content of total phenolic compounds (TPC) and caffeine of green and roasted coffee beans and of three coffee brews commonly consumed by Algerian people (Moka, Turk and filter) prepared by a blend of Arabica and Robusta 20:80.
The statistical analysis revealed significant differences p < 0.05 in antioxidant contents between green and roasted coffee (Table 3). Overall, the roasted coffee beans showed high content in TPC than green coffee beans as already found [37, 46], while the level of caffeine decreased significantly after roasting.
Table 3
Total phenolic compounds (TPC) and caffeine content in green and roasted coffee bean extracts and coffee brews
| TPC (g GAE/100 g DM) | Caffeine (mg /g DM) | |
| Green coffee | ||
| Arabica (GA) | 4.59±0.03a | 10.53±0.01a |
| Robusta (GR) | 3.88±0.15b | 15.46±0.05b |
| Roasted coffee | ||
| Arabica (RA) | 5.68±0.04a | 1.01±0.1b |
| Robusta (RR) | 5.43±0.09a | 1.53±0.1a |
| Coffee brews | ||
| Moka | 0.70±0.04a | 0.50±0.06b |
| Turk | 0.47±0.01b | 0.33±0.08c |
| Filter | 0.69±0.05a | 0.96±0.08a |
Values are mean SD±standard deviation (n = 3). Means followed by the same letter are not different according to ANOVA (Analysis of Variance). GA: green Arabica, GR: green Robusta, RA: roasted Arabica, RR: roasted Robusta, DM; dry matter.
The Arabica green coffee beans showed the high level in TPC (4.59±0.03 g GAE/100 g) than Robusta (3.88±0.15 g GAE/100 g). After roasting, the level of TPC increase for the both coffees but no significant different has recorded between the two varieties of coffees Arabica and Robusta (5.68±0.04 g GAE/100 g, 5.43±0.09 g GAE/100 g, respectively).
The concentration of caffeine present in Robusta was higher after (15.46±0.01 mg/g) and before (1.53±0.01 mg/g) roasting than Arabica. These results are in accordance with those of Hečimović et al. [18].
Many studies reported that caffeine contents are highly dependent on species (Robusta coffee has higher levels than Arabica) and just slight losses are observed during the roasting process due to its thermal stability [47]. Conversely, our results showed a significant decrease in caffeine in both coffee beans probably caused by the high degree of roasting [18].
As can be observed in Table 3, Filter and Moka coffees presented higher phenolic content than Turk coffee (0.69 g GAE/100 g, 0.70 g GAE/100 g, 0.47 g GAE/100 g respectively). These results are inferior to those of coffee beans. Several studies reported that polyphenolic compounds are highly thermolabile compounds that are easily decomposed under the effect of high temperature during coffee preparation [18, 47].
The caffeine concentration reached 0.33 mg/g in Turk coffee, followed by 0.50 mg/g in Moka coffee, whereas the most important level was assigned for Filter coffee with 0.96 mg/g.
The results recorded in this study are different from some previous reports regarding green and roasted coffee beans [15, 27, 48] and brews [15, 28]. These differences could be attributed to the tested species, the storage conditions of coffee beans, the roasting process, the methods of analysis and standards. Moreover, the blend ratio used for the preparation of the coffee brews as well as the ratio water: ground coffee may be critical parameters.
The amount of caffeine in the tested brews is mainly dependent on the volume and temperature of water and on the time of brewing [49]. The minor contribution of caffeine to beverage bitterness led authors to conclude that this alkaloid is not responsible for any change in beverage sensory quality [34].
Typical brew characteristics of the blend 20:80 of Arabica: Robusta combine the bitterness and the fullness of taste for Robusta and the acidity of Arabica while the sensory properties of coffee beans were attributed to the volatile substances developed during roasting and brewing [22, 25].
4Antioxidant activities
The antioxidant activity of green and roasted beans and coffee brews was tested using different model system. In particular, two different stable radicals (ABTS•+ and DPPH•) were chosen to assess the radical scavenging activity. Moreover, coffee extracts from green and roasted beans along with coffee brews were further analyzed for their reducing power, first by the reduction of the ferricyanide (Fe3 +) complex to the ferrous (Fe2 +), and second by the evaluation of the antioxidant capacity by phosphomolybdenum method, which is based on the reduction of molybdate to Mo (V) by the sample analyte and the subsequent formation of green phosphate of Mo (V) compounds.
The antioxidant activity evaluated by these different methods were significantly different p < 0.05 between green and roasted coffee extracts (Table 4 and Fig. 2). The green Robusta coffee beans extract was found to exhibit higher antioxidant activity using the phosphomolybdate (502±17.53 mg QE/100 g) followed by the green Arabica one which presented an activity lower (430.69±19.94 mg QE/100 g). Roasted Robusta extract showed a high reducing power and a weak reduction of iron (III) was noted for Arabica. This result can be explained by the important concentration of caffeine in Robusta extract.
Table 4
Antioxidant activities of green, roasted coffee bean extracts and coffee brews prepared with roasted Arabica:Robusta (20:80)
| Phosphomolybdenum method (mg EQ/100 g DM) | Reducing power (g EAG/100 g DM) | |
| Green coffee | ||
| Arabica (GA) | 430.69±19.94b | 8.46±0.23b |
| Robusta (GR) | 502.21±17.53a | 11.54±0.16a |
| Roasted coffee | ||
| Arabica (RA) | 321.35±28.26b | 1.38±0.17b |
| Robusta (RR) | 428.98±24.80a | 2.10±0.16a |
| Coffee brews | ||
| Moka | 27.22±2.29b | 0.38±0.01b |
| Turk | 16.73±2.55c | 0.23±0.01c |
| Filter | 134.30±2.38a | 0.45±0.01a |
Values are mean±SD standard deviation (n = 3). Means followed by the same letter are not different according to ANOVA (Analysis of Variance). GA: green Arabica, GR: green Robusta, RA: roasted Arabica, RR: roasted Robusta, DM; dry matter.
Fig.2
Inhibition percentage of DPPH and ABTS radicals of: a) green and roasted coffee extracts. b) Coffee brews.GA: green Arabica, GR: green Robusta, A: roasted Arabica, R: roasted Robusta.
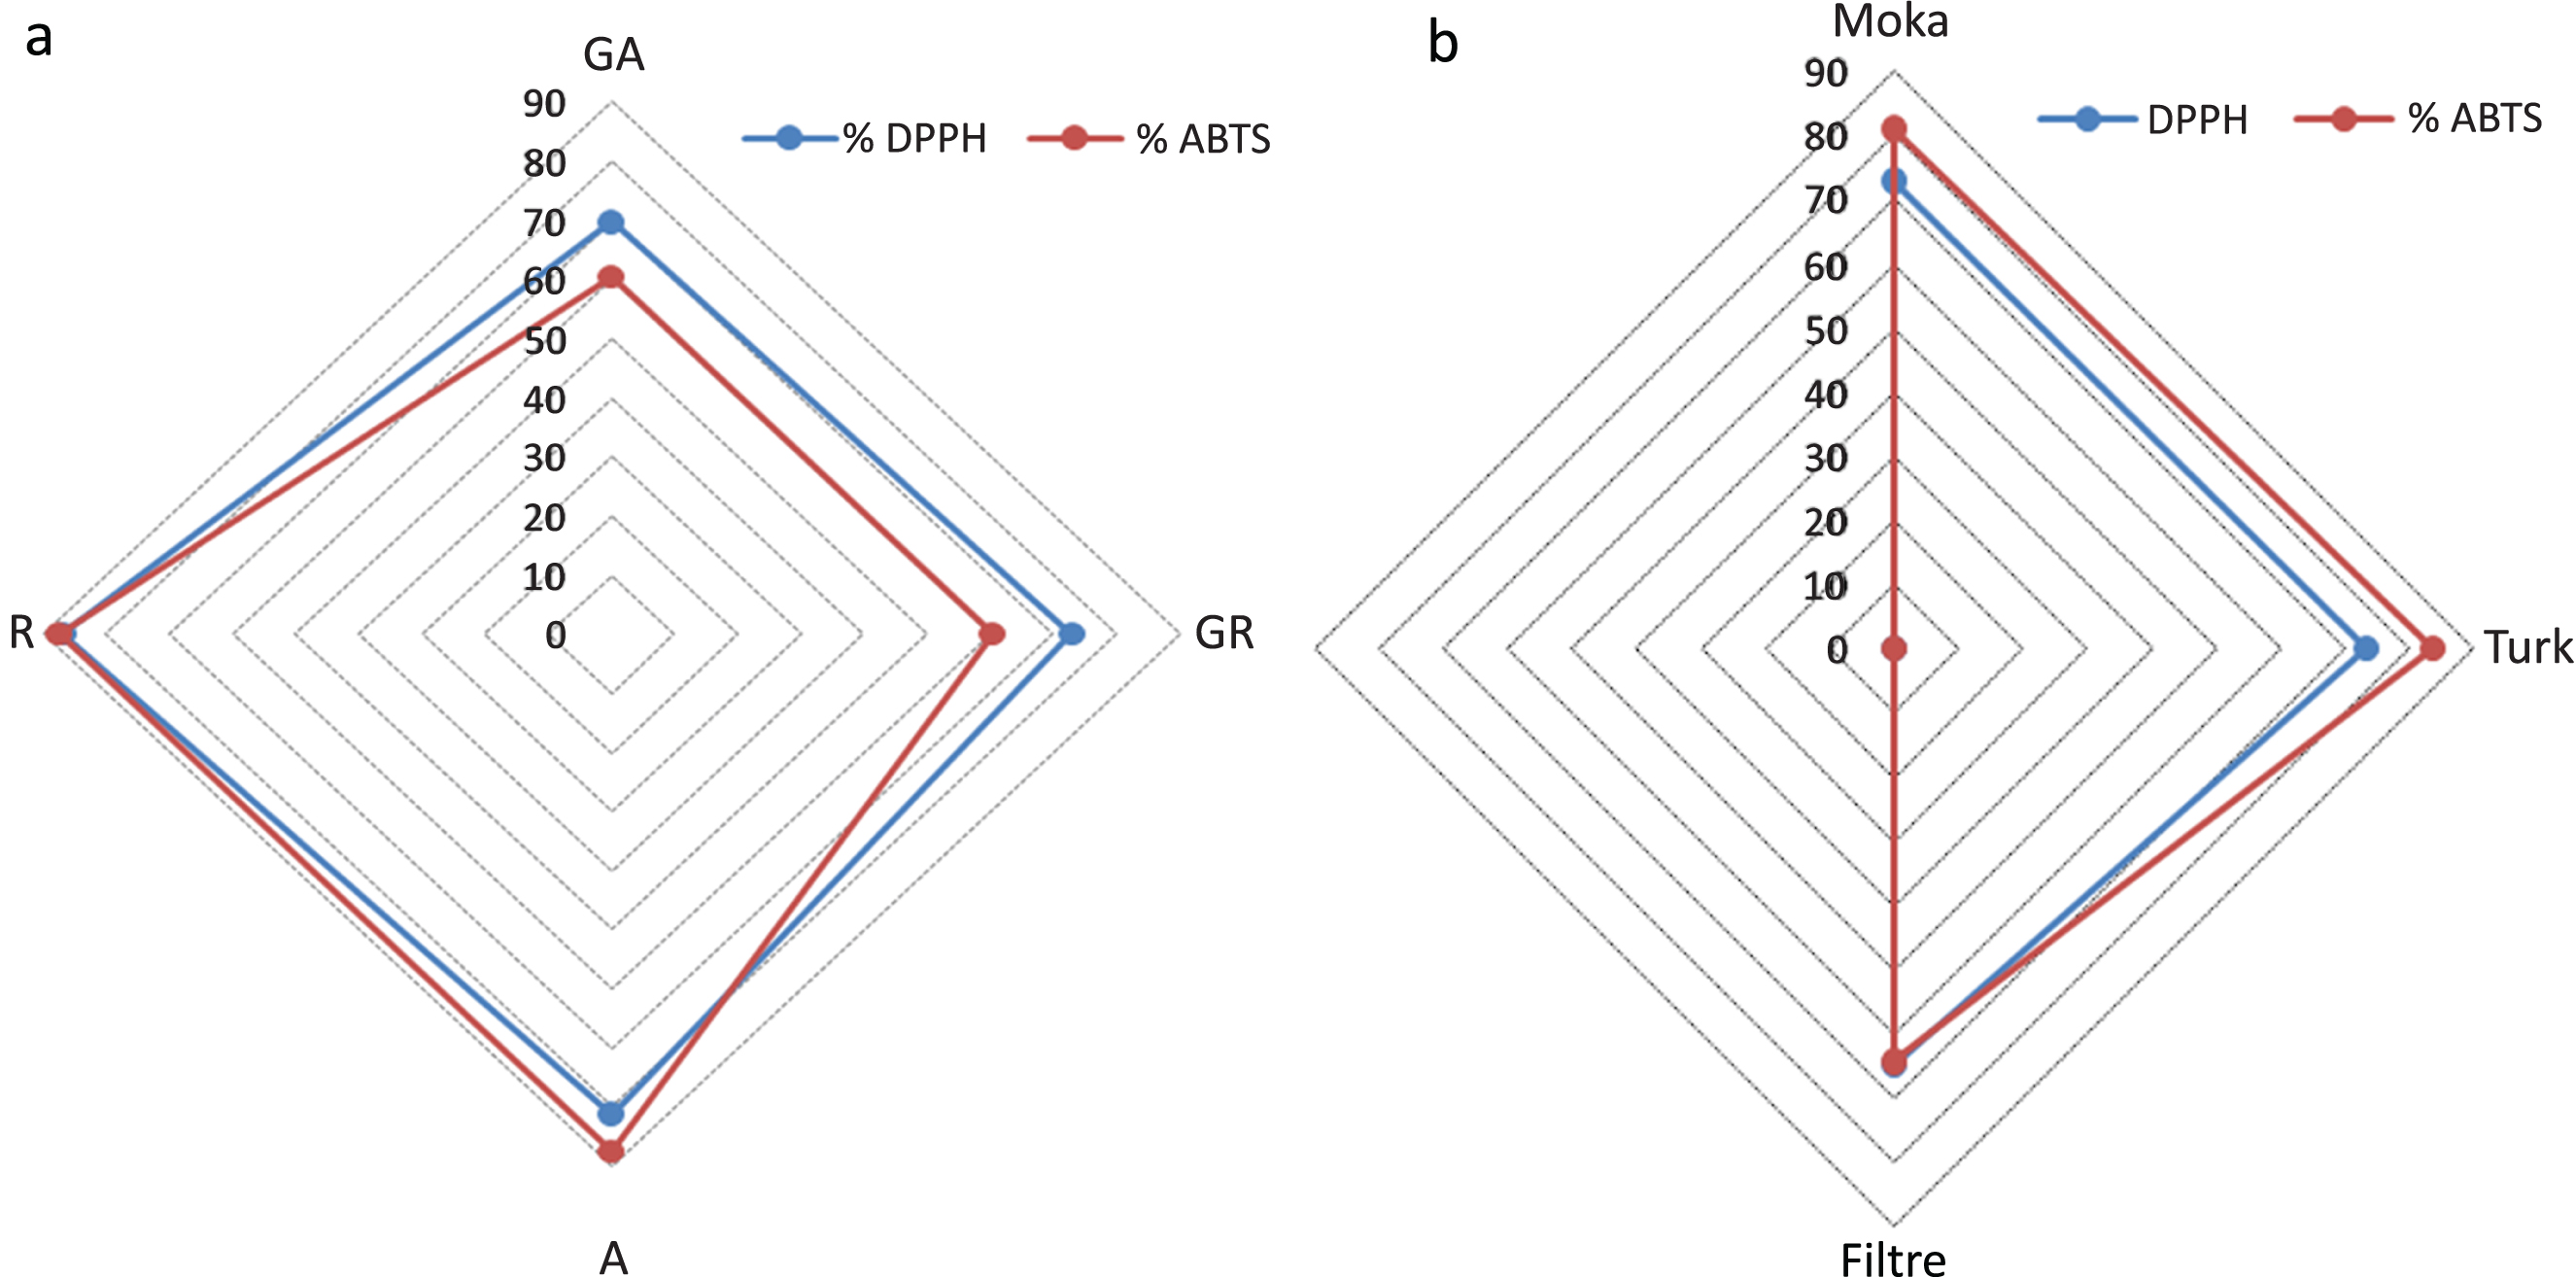
The ABTS•+ and DPPH•+ methods results, showed no significant difference between roasted coffee extracts (Arabica and Robusta) (Fig. 2a); this result is in accordance with the TPC results. It is well known, that DPPH and ABTS radicals react energetically with hydrogen-donors, such as phenolic compounds and the ABTS radical also reacts with any hydroxylated aromatic compound, based on electron transfer redox reaction, and for this reason one cannot distinguish an antioxidant activity due to phenolic and non-phenolic compounds [31, 50].
The variety of coffee influences the antioxidant capacity of coffee due to the level of phenolic compounds. The presence of certain levels of phenolic acid in roasted coffee is also important because of their antioxidant properties [46]. However the antioxidant capacity of roasted coffee is mainly due to the MRPs formed during roasting process [51, 52]. Several studies concluded that antioxidant activities measured by ABTS•+ and DPPH+ methods; increase after roasting because of melanoidins [11].
Concerning coffee brews prepared (Arabica:Robusta 80:20), the antioxidant activity evaluated by the different methods was significantly different p < 0.05 between Moka, Turk and Filter coffee (Table 4) and (Fig. 2).
The Filter coffee exhibited the higher reducing activity for the iron (III) and molybdtade 0.45±0.01 g GAE/100 g and 134.30±2.38 mg QE/100 g respectively than Turk and Moka coffees; which is in accordance with the TPC and caffeine contents. Whereas the Turk coffee gave the higher antioxidant activity with 84.86% for ABTS method and 77.79% for DPPH method. The Filter coffee presented a lower activity for the ABTS and DPPH•+ method with 68.75% and 72.29% respectively.
Generally, results of antioxidant activity reflected those obtained for TPC. But melanoidins, produced among Mallaird Reaction Products (MRPs), are one of the major components of coffee beverages, which greatly contribute to the whole coffee antiradical activity through different mechanisms; e.g., chain breaking; oxygen scavenging or metal chelating [12].
Coffee brews possess strong antioxidant activity at all degree of roasting. Reported data demonstrated the importance of coffee MRPs as antioxidant compounds in dark coffee extracts by several in vitro methods including those with human lipoproteins [53]. The mechanisms of the antioxidant action associated with coffee MRPs involve the hydrogen atom transfer (HAT) mechanism and single electron transfer (SET) mechanism. Using different antioxidant assay procedures, Liu and Kitts [17] showed that MRPs derived from different molecular weights fractions exhibit different antioxidant mechanisms. High molecular weight of polymerized melanoidins in coffee brews contributes on the antioxidants activity proportionally less than the presence of low molecular weight MRPs.
The correlation study (Table 5) suggests that the components mainly involved in the antioxidant activity are TPC and caffeine which are expressed by the reducing power method. The strongest correlation was found between the caffeine and reducing power capacity (r = 0.97). A significant correlation was also obtained between TPC and reducing power method (r = 0.89).
Table 5
Correlation TPC and caffeine with antioxidants activties
| TPC | Caffeine | DPPH | ABTS | Molybdate test | RP | |
| TPC | 1.00 | |||||
| Caffeine | 0.94 | 1.00 | ||||
| DPPH | 0.53 | 0.43 | 1.00 | |||
| ABTS | 0.65 | 0.63 | 0.77 | 1.00 | ||
| Molybdate test | 0.77 | 0.59 | 0.45 | 0.50 | 1.00 | |
| RP | 0.89 | 0.97 | 0.36 | 0.57 | 0.50 | 1.00 |
The antioxidant activity of phenolic constituents may be related to their redox properties, which allow them to act as reducing agents or hydrogen-atom donors, their ability to chelate metals and scavenge free radicals.
Coffee varieties, degree of roasting and coffee blends could be the main factors which influence antioxidant content of coffee and its antioxidant activity [18, 54]. Moreover; the method and conditions of coffee brew preparation (time and temperature) may have an important effect on the ultimate antioxidant content [31].
5Conclusion
Despite the high degree of roasting applied in Algerian coffee beans, the dark roasted coffee evaluated in this study represented an important source of chlorogenic acid and derivatives. The UPLC-DAD-ESI-MS analysis has allowed the identification of 14 compounds including CQA derivatives and feruloylquinic acids and dicaffeoylquinic acids.
This study has also demonstrated that after roasting process of Arabica and Robusta green coffee beans, the levels of TPC decreased significantly which is reflected by the slight decreasing in the antioxidant activity measured by the ABTS and DPPH radicals, while the decrease of caffeine content is reflected by the decrease in the reducing power.
The concentrations of TPC and caffeine in coffee brews differed according to the method of their preparation. The data reported in this study, demonstrate the importance of coffee preparation with the blend of Arabica: Robusta at 20:80% by the different procedures, which possessed strong antioxidant activities despite the low content recorded in TPC and caffeine in the different coffee brews.
Overall, we can conclude that the different coffee brews prepared by the blend Arabica: Robusta at 20:80 % have no bearing on the antioxidants capacity, which are a point worth considering toward the Algerian consumer.
Acknowledgments
The authors gratefully acknowledge the Algerian Ministry of Higher Education and Scientific Research for funding the study.
REFERENCES
[1] | Giampieri F , Forbes-Hernandez TY , Gasparrini M , Alvarez-Suarez JM , Afrin S , Bompadre S , Quiles JL , Mezzetti B , Battino M . Strawberry as a health promoter: An evidence based review. Food & Function. (2015) ;6: :1386–98. |
[2] | Zhao C-N , Meng X , Li Y , Li S , Liu Q , Tang G-Y , Li H-B . Fruits for Prevention and Treatment of Cardiovascular Diseases. Nutrients. (2017) ;9: :598. |
[3] | Barzi F , Woodward M , Marfisi R , Tavazzi L , Valagussa F , Marchioli R . Mediterranean diet and all-causes mortality after myocardial infarction: Results from the GISSI-Prevenzione trial. European Journal of Clinical Nutrition. (2003) ;57: :604–11. |
[4] | Zeghichi-Hamri S , Kallithraka S . Mediterranean diet in the Maghreb: An update. In More on Mediterranean Diets. Volume 97: : Karger Publishers; (2007) :139–161. |
[5] | STAT F . FAOSTAT-Statistical Database, (2012) . |
[6] | Palm PE , Arnold EP , Nick MS , Valentine JR , Doerfler TE . Two-year toxicity/carcinogenicity study of fresh-brewed coffee in rats initially exposed in utero. Toxicology and Applied Pharmacology. (1984) ;74: :364–82. |
[7] | Bonita JS , Mandarano M , Shuta D , Vinson J . Coffee and cardiovascular disease: In vitro, cellular, animal, and human studies. Pharmacol Res. (2007) ;55: :187–98. |
[8] | Nkondjock A . Coffee consumption and the risk of cancer: An overview. Cancer Lett. (2009) ;277: :121–25. |
[9] | Muriel P , Arauz J . Coffee and liver diseases. Fitoterapia. (2010) ;81: :297–305. |
[10] | Lin W-Y , Xaiver Pi-Sunyer F , Chen C-C , Davidson LE , Liu C-S , Li T-C , Wu M-F , Li C-I , Chen W , Lin C-C . Coffee consumption is inversely associated with type 2 diabetes in Chinese. European Journal of Clinical Investigation. (2011) ;41: :659–66. |
[11] | Nicoli M , Anese M , Manzocco L , Lerici C . Antioxidant properties of coffee brews in relation to the roasting degree. LWT-Food Science and Technology. (1997) ;30: :292–97. |
[12] | Parras P , Martínez-Tomé M , Jiménez AM , Murcia MA . Antioxidant capacity of coffees of several origins brewedfollowing three different procedures. Food Chemistry. (2007) ;102: :582–92. |
[13] | Farah A , Monteiro MC , Calado V , Franca AS , Trugo LC . Correlation between cup quality and chemical attributes of Brazilian coffee. Food Chemistry. (2006) ;98: :373–80. |
[14] | Brezová Vlasta , Šlebodová Anna , Andrej S . Coffee as a source of antioxidants: An EPR study. Food Chemistry. (2009) ;114: :859–68. |
[15] | Vignoli JA , Bassoli DG , Benassi MT . Antioxidant activity, polyphenols, caffeine and melanoidins in soluble coffee: The influence of processing conditions and raw material. Food Chemistry. (2011) ;124: :863–8. |
[16] | Esquivel P , Jiménez VM . Functional properties of coffee and coffee by-products. Food Research International. (2012) ;46: :488–95. |
[17] | Liu Y , Kitts DD . Confirmation that the Maillard reaction is the principle contributor to the antioxidant capacity of coffee brews. Food Research International. (2011) ;44: :2418–24. |
[18] | Hečimović I , Belščak-Cvitanović A , Horžić D , Komes D . Comparative study of polyphenols and caffeine in different coffee varieties affected by the degree of roasting. Food Chemistry. (2011) ;129: :991–1000. |
[19] | Fujioka K , Shibamoto T . Chlorogenic acid and caffeine contents in various commercial brewed coffees. Food Chemistry. (2008) ;106: :217–21. |
[20] | Upadhyay R , Ramalakshmi K , Jagan Mohan Rao L . Microwave-assisted extraction of chlorogenic acids from green coffee beans. Food Chemistry. (2012) ;130: :184–188. |
[21] | Debry G . Le café et la santé. John Libbey Eurotext; (1993) . |
[22] | Feria Morales AM . Effect of holding-time on sensory quality of brewed coffee. Food Quality and Preference. (1989) ;1: :87–89. |
[23] | Nebesny E , Budryn G . Evaluation of sensory attributes of coffee brews from robusta coffee roasted under different conditions. European Food Research and Technology. (2006) ;224: :159–165. |
[24] | Chin S-T , Eyres GT , Marriott PJ . Identification of potent odourants in wine and brewed coffee using gas chromatography-olfactometry and comprehensive two-dimensional gas chromatography. Journal of Chromatography A. (2011) ;1218: :7487–98. |
[25] | Bhumiratana N , Adhikari K , Chambers IVE . Evolution of sensory aroma attributes from coffee beans to brewed coffee. LWT - Food Science and Technology. (2011) ;44: :2185–92. |
[26] | Duarte SMdS , Abreu CMPd , Menezes HCd , Santos MHd , Gouvêa CMCP . Effect of processing and roasting on the antioxidant activity of coffee brews. Food Science and Technology (Campinas). (2005) ;25: :387–93. |
[27] | Sánchez-González I , Jiménez-Escrig A , Saura-Calixto F . In vitro antioxidant activity of coffees brewed using different procedures (Italian, espresso and filter). Food Chemistry. (2005) ;90: :133–39. |
[28] | Caporaso N , Genovese A , Canela MD , Civitella A , Sacchi R . Neapolitan coffee brew chemical analysis in comparison to espresso, moka and American brews. Food Research International. (2014) ;61: :152–60. |
[29] | Morita M , Naito Y , Yoshikawa T , Niki E . Antioxidant capacity of blueberry extracts: Peroxyl radical scavenging and inhibition of plasma lipid oxidation induced by multiple oxidants. Journal of Berry Research. (2017) :1–9. |
[30] | Santini A , Ferracane R , Mikušová P , Eged Š , Šrobárová A , Meca G , Mañes J , Ritieni A . Influence of different coffee drink preparations on ochratoxin A content and evaluation of the antioxidant activity and caffeine variations. Food Control. (2011) ;22: :1240–45. |
[31] | Ludwig IA , Sanchez L , Caemmerer B , Kroh LW , De Peña MP , Cid C . Extraction of coffee antioxidants: Impact of brewing time and method. Food Research International. (2012) ;48: :57–64. |
[32] | Groisser DS . A study of caffeine in tea. I. A new spectrophotometric micro-method. II. Concentration of caffeine in various strengths, brands, blends, and types of teas. Am J Clin Nutr. (1978) ;31: :1727–31. |
[33] | Taniwaki M , Pitt J , Teixeira A , Iamanaka B . The source of ochratoxin A in Brazilian coffee and its formation in relation to processing methods. International Journal of Food Microbiology. (2003) ;82: :173–9. |
[34] | Ramalakshmi K , Rahath Kubra I , Jagan Mohan Rao L . Antioxidant potential of low-grade coffee beans. Food Research International. (2008) ;41: :96–103. |
[35] | Di Castelnuovo A , di Giuseppe R , Iacoviello L , de Gaetano G . Consumption of cocoa, tea and coffee and risk of cardiovascular disease. Eur J Intern Med. (2012) ;23: :15–25. |
[36] | López-Galilea I , Andueza S , Leonardo Id , Paz de Peña M , Cid C . Influence of torrefacto roast on antioxidant and pro-oxidant activity of coffee. Food Chemistry. (2006) ;94: :75–80. |
[37] | Perrone D , Farah A , Donangelo CM . Influence of coffee roasting on the incorporation of phenolic compounds into melanoidins and their relationship with antioxidant activity of the brew. Journal of Agricultural and Food Chemistry. (2012) ;60: :4265–75. |
[38] | Pilipczuk T , Kusznierewicz B , Zielińska D , Bartoszek A . The influence of roasting and additional processing on the content of bioactive components in special purpose coffees. Journal of Food Science and Technology. (2015) ;52: :5736–44. |
[39] | Echavarría A , Pagán J , Ibarz A . Melanoidins formed by Maillard reaction in food and their biological activity. Food Engineering Reviews. (2012) ;4: :203–23. |
[40] | Zheng C , Hao H , Wang X , Wu X , Wang G , Sang G , Liang Y , Xie L , Xia C , Yao X . Diagnostic fragment-ion-based extension strategy for rapid screening and identification of serial components of homologous families contained in traditional Chinese medicine prescription using high-resolution LC-ESI-IT-TOF/MS: Shengmai injection as an example. Journal of Mass Spectrometry. (2009) ;44: :230–44. |
[41] | Rodrigues NP , Bragagnolo N . Identification and quantification of bioactive compounds in coffee brews by HPLC–DAD–MS n. Journal of Food Composition and Analysis. (2013) ;32: :105–115. |
[42] | Clifford MN , Johnston KL , Knight S , Kuhnert N . Hierarchical scheme for LC-MS n identification of chlorogenic acids. Journal of Agricultural and Food Chemistry. (2003) ;51: :2900–11. |
[43] | Clifford MN , Knight S , Kuhnert N . Discriminating between the six isomers of dicaffeoylquinic acid by LC-MS n. Journal of Agricultural and Food Chemistry. (2005) ;53: :3821–32. |
[44] | Kuhnert N , Jaiswal R , Matei MF , Sovdat T , Deshpande S . How to distinguish between feruloyl quinic acids and isoferuloyl quinic acids by liquid chromatography/tandem mass spectrometry. Rapid Communications in Mass Spectrometry. (2010) ;24: :1575–82. |
[45] | Parveen I , Threadgill MD , Hauck B , Donnison I , Winters A . Isolation, identification and quantitation of hydroxycinnamic acid conjugates, potential platform chemicals, in the leaves and stems of Miscanthus×giganteus using LC–ESI-MSn. Phytochemistry. (2011) ;72: :2376–84. |
[46] | Somporn C , Kamtuo A , Theerakulpisut P , Siriamornpun S . Effects of roasting degree on radical scavenging activity, phenolics and volatile compounds of Arabica coffee beans (Coffea arabica L.cv. Catimor). International Journal of Food Science & Technology. (2011) ;46: :2287–96. |
[47] | Farah A . 2 Coffee Constituents. Coffee: Emerging Health Effects and Disease Prevention. (2012) , 59. |
[48] | Yashin YI , Nemzer BV , Ryzhnev VY , Yashin AY , Chernousova NI , Fedina PA . Creation of a databank for content of antioxidants in food products by an amperometric method. Molecules. (2010) ;15: :7450–7466. |
[49] | Phan TTD , Kuban V , Kráčmar S . Determination of caffeine contents of coffee brands in the Vietnamese market. Journal of Microbiology, Biotechnology and Food Sciences. (2012) , 1. |
[50] | Nenadis N , Wang L-F , Tsimidou M , Zhang H-Y . Estimation of scavenging activity of phenolic compounds using the ABTS•+assay. Journal of Agricultural and Food Chemistry. (2004) ;52: :4669–74. |
[51] | Andueza S , Cid C , Cristina Nicoli M . Comparison of antioxidant and pro-oxidant activity in coffee beverages prepared with conventional and “Torrefacto” coffee. LWT - Food Science and Technology. (2004) ;37: :893–7. |
[52] | Yashin A , Yashin Y , Wang JY , Nemzer B . Antioxidant and Antiradical Activity of Coffee. Antioxidants. (2013) ;2: :230–45. |
[53] | Gómez-Ruiz JÁ , Ames JM , Leake DS . Antioxidant activity and protective effects of green and dark coffee components against human low density lipoprotein oxidation. European Food Research and Technology. (2008) ;227: :1017–24. |
[54] | del Castillo MD , Ames JM , Gordon MH . Effect of roasting on the antioxidant activity of coffee brews. Journal of Agricultural and Food Chemistry. (2002) ;50: :3698–03. |


