
Leptin, appetite and weight rebound in overweight/obesity individuals undertook weight loss program using a low calorie diet with or without exercise
Abstract
BACKGROUND:
It has been suggested that leptin plays an important role in regulating in energy expenditure and appetite.
OBJECTIVE:
The aim of this study was to evaluate the effect of a low calorie diet with or without combined exercises on leptin, appetite, and weight rebound.
METHODS:
This is an experimental study and 63 subjects were divided into two groups: a low calorie diet group (LCD) and a low calorie diet with training group (LCD+training). Appetite, anthropometric measures, dietary intake and plasma leptin level were measured before and after the intervention (8 weeks). Body weight was measured 4 weeks after the intervention was ended.
RESULTS:
The appetite ratings including sensation of hunger, satiety, fullness, and desire to eat were unchanged in both groups (P > 0.05). Energy and carbohydrate intake were correlated with hunger, satiety and fullness before the intervention (P < 0.05). Plasma leptin was significantly reduced in LCD+training group (P = 0.001) but not in LCD group (P = 0.285). Changes in plasma leptin level were associated with body weight changes during 8 weeks of intervention (r = 0.56, P = 0.0003).
CONCLUSION:
A combination of a low calorie diet with combined training was able to reduce plasma leptin and the change of leptin was associated with body weight changes.
1Introduction
The global burden of obesity is increasing tremendously in recent decades and is now a major health problem because of its significant contribution to diseases such as hypertension, cardiovascular disease (CVD) and type 2 diabetes [1]. Obesity has been associated with increased energy intake and reduced physical activity [2]. Those two factors lead to overconsumption, positive energy balance and fat storage. There are some reports regarding factors that are associated with increased dietary intake including built environments, increased food availability and commercialization [3, 4]. Besides those social and environmental factors, it also important to consider internal drive for dietary intake such as individual’s appetite. Several observational studies showed that obesity has been associated with disturbance of appetite signals. Therefore, treatments targeting appetite could be an effective weight loss alternatives [5].
Appetite is an important key on the successfulness on a weight loss program since it defines individual compliance towards the prescribed diet. Although several investigations described the role of weight loss on appetite but the results were conflicting [6]. A previous study showed that individuals who routinely exercised has ability to control food intake as well as lower feeling of hunger compared to those who were not routinely exercise [7]. Exercise has been an integral part of lifestyle intervention for obesity treatment and some study showed this has beneficial effect on the regulation of appetite during a low calorie diet. However, there are controversies on whether exercise can help individual to better control their appetite [8, 9].
Changes in energy expenditure and appetite after weight loss have been suggested as the important factors mediating weight loss. Literature reviews have shown that total daily energy expenditure and thus daily energy requirements decreased by 15% below expected level after subjects achieved a lower body weight [10–13]. This effect was accompanied by increased appetite after weight lost which increases resistance to weight maintenance [14]. Studies have suggested that changes in hormones and neuropeptides play an important role in the process. As a person loses weight, adipose tissue loses fat (triglyceride) stores, thus leading to a reduction of leptin production. The lower circulating leptin levels then contribute to an increase in appetite [15]. Additionally, decreased leptin production reduces T3 (Triiodothyronine) and T4 (thyroxine) secretion, hormones that regulate human energy expenditure [16]. The reduction of those hormones is accompanied by lower production of nor-ephrinephrine, which together contribute to decreased energy expenditure [17]. These changes are a resistance mechanism against an environment of energy deficit and are a major obstacle for a weight loss intervention in obese individuals.
However, there are a limited number of results showing the importance of weight loss using low calorie diet and exercise with consideration on dietary composition during the weight loss program. The aim of this study was to evaluate the effect of a low calorie diet with or without combined exercise on leptin, appetite, and weight rebound. We also evaluate the importance of leptin and appetite on weight changes during the intervention and weight rebound after the program was ended. Additionally, the role of dietary composition during the intervention on leptin and appetite was also evaluated in this study.
2Methods
2.1Subjects
In order to recruit overweight/obese individuals, application was offered via flyers, website and Facebook page. A total of 332 overweight and obese individuals applied only 63 of them were selected to become subjects in this study. The selection process was done by a simple random sampling method using an online tool (random.org). The inclusion criteria of this study as adults with body mass index more than 25 kg/m2. The exclusion criteria were pregnant, smoking, and diagnosed with chronic diseases by medical doctor. This study has been approved by Medical and Health Research Ethics Committee (MHREC) Faculty of Medicine Universitas Gadjah Mada-Dr. Sardjito General Hospital (KE/FK/826/EC/2015).
2.2The interventions
Subjects were asked to follow the regime including low calorie diet and exercise for 8 weeks. In this study, the dietary intervention was a low calorie diet with total energy of 1,200 kcal a day. This is instructed by a trained nutritionist employed in this study. The nutritionist is not a part of research member and no differences in nutrition counseling given between groups. In order to measure the compliance toward the diet, during the intervention period subjects had two-weekly meeting with the nutritionist. Within the meeting, subjects were asked regarding their difficulty for their new diet, 24 hours dietary recall and body weight measurement. The 24 hours dietary recall was aimed to objectively evaluate their dietary intake towards the low calorie diet.
The physical training was given as a combination of aerobic and resistance exercises. This training was done 3 times a day with combination of aerobic training in the first and third day while resistance training was done in the second day. The training was done in a group at the same time and guided by professional trainers. The resistance training was done using dumbbell and subject’s body. Each session was done in 60 minutes and the average steps for this exercise is 6.375 steps or equal with ∼300 calories (calculated from the average age and body weight of whole subject group).
2.3Measurements
The anthropometric measurements in this study include height and body weight. Height was measured using microtoise with 0.1 cm precision. Body weight was measured using digital weight scale (Omron) with 0.1 kg precision. BMI was calculated by dividing body weight with squared height. Overweight and obesity was defined when BMI is higher than 25 kg/m2. Anthropometric measurements were done 3 times, before the interventions (week 0), at the end of interventions (week 8) and 4 weeks at the maintenance diet (week 12). Dietary intake was measured using a semi-quantitative food frequency questionnaire before and after the intervention. The dietary components were analysed using Nutrisurvey software. All these measurements were done before and after the intervention.
Appetite rating was measured using visual analogue scale with these 4 questions: 1.“How hungry do you feel?” 2.“How satisfied do you feel?” 3.“How full do you feel?” 4.“How much do you feel you can eat?” Subjects were asked to fill the line between 0 and 100 cm to express quantify the degree of appetite. This measurement was done 7 times which are at 0, and 30 minutes followed by the next 3 hours. The initial appetite rating question at 0 hour was done while subjects were 8 hours fasting. Following the first measurement, subjects were given the breakfast with the same portion and dietary composition. After appetite rating measurement were done 3 hours after the breakfast was given. Subjects were not allowed to eat and drink (in exception to water) during this measurement.
Blood collection was done after at least 8 hours of fasting. Subjects were asked to stop eating and drinking (in exception to drinking water) from 22.00 pm, and the blood collection was done between 07.00–09.00 am. Blood plasma was separated right after the blood collection. Leptin analysis was done using enzyme linked immunosorbent assay (ELISA) DRG (USA).
2.4Statistical analysis
Statistical analysis was done using GraphPad Prism version 5.00 for Windows (GraphPad Software, San Diego California USA). A paired t-test was used to analyze the changes on anthropometric measures, dietary intake and appetite ratings before and after the intervention. Appetite ratings were analyzed using 2 methods: individual timely changes and area under the curve. A correlation between appetite ratings, body weight and dietary intake were analyzed using Pearson correlation test. The comparison and analysis was significant when P < 0.05.
3Results
This is a randomized controlled trial in overweight and obese individuals. Subjects were randomly selected from 332 applicants. In this study, we recruited 63 overweight and obesity individuals to undertake a weight loss program composed by counseling for a low calorie diet and exercises with combination on aerobic and resistance training. From those who followed the program, only 39 subjects who were finished the study for (24 subjects in the LCD+training group and 15 subjects in the LCD group). The changes on dietary intake and body weight are shown in Table 1. We showed that both male and female subjects had significant weight loss (P < 0.05). In addition to weight changes, we also showed that there were reductions in dietary intake after the interventions.
Table 1
Body weight and dietary changes during the intervention
| LCD + Training Group (n = 24) | LCD Group (n = 15) | |||||
| Pre | Post | P-value1) | Pre | Post | P-value1) | |
| Age (yrs) | 27.3±7.2 | 27.0±6.1 | ||||
| Anthropometric measures | ||||||
| Height (cm) | 160.5±8.8 | 158.4±8.7 | ||||
| Body weight (kg) | 75.4±10.7 | 72.7±10.3 | <0.0001* | 80.4±13.1 | 79.3±13.2 | 0.01 |
| Body Mass Index (kg/m2) | 29.2±3.1 | 28.2±3.3 | <0.0001* | 32.0±4.0 | 31.8±4.1 | 0.42 |
| Dietary intake | ||||||
| Energy Intake (kcal) | 1,418.0±528.7 | 1,069.0±415.0 | 0.01* | 1,671.0±425.8 | 1,201.0±443.8 | <0.001* |
| Protein Intake (g) | 41.0±15.7 | 36.0±9.9 | 0.08 | 57.2±18.0 | 40.5±9.9 | 0.003 |
| Fat Intake (g) | 52.6±30.4 | 35.1±17.6 | 0.03* | 60.2±34.3 | 45.3±24.5 | 0.19 |
| Carbohydrate Intake (g) | 207.4±87.3 | 154.6±67.3 | 0.01* | 230.5±67.0 | 167.9±77.1 | <0.001* |
| Fiber Intake (g) | 7.7±3.7 | 6.9±4.9 | 0.65 | 7.9±4.5 | 5.9±2.6 | 0.15 |
| Protein:Carbohydrate Ratio | 0.2±0.1 | 0.3±0.1 | 0.09 | 0.3±0.1 | 0.3±0.1 | 0.59 |
| % Fat to Total Energy Intake | 36.0±31.5 | 29.2±7.7 | 0.54 | 31.4±12.2 | 33.6±11.9 | 0.61 |
| Appetite ratings (AUC) | ||||||
| Hunger | 5304±3626 | 5135±3346 | 0.803 | 6578±3742 | 7683±3586 | 0.393 |
| Satiety | 12293±2767 | 12312±3097 | 0.977 | 12409±2794 | 12550±2182 | 0.816 |
| Fullness | 12262±2848 | 12990±2472 | 0.166 | 12421±2645 | 11929±2359 | 0.546 |
| Desire to eat | 7698±4855 | 6440±3446 | 0.154 | 7471±3968 | 7373±2995 | 0.893 |
| Leptin (ng/mL) | 23.2±13.2 | 18.1±10.5 | 0.001 | 19.8±7.2 | 21.8±9.9 | 0.285 |
Values are presented as the mean±SD. 1) P-value is calculated from paired t-test between the changes on anthropometric measures, dietary intake and appetite ratings before and after the intervention.
3.1The effect of interventions on appetite
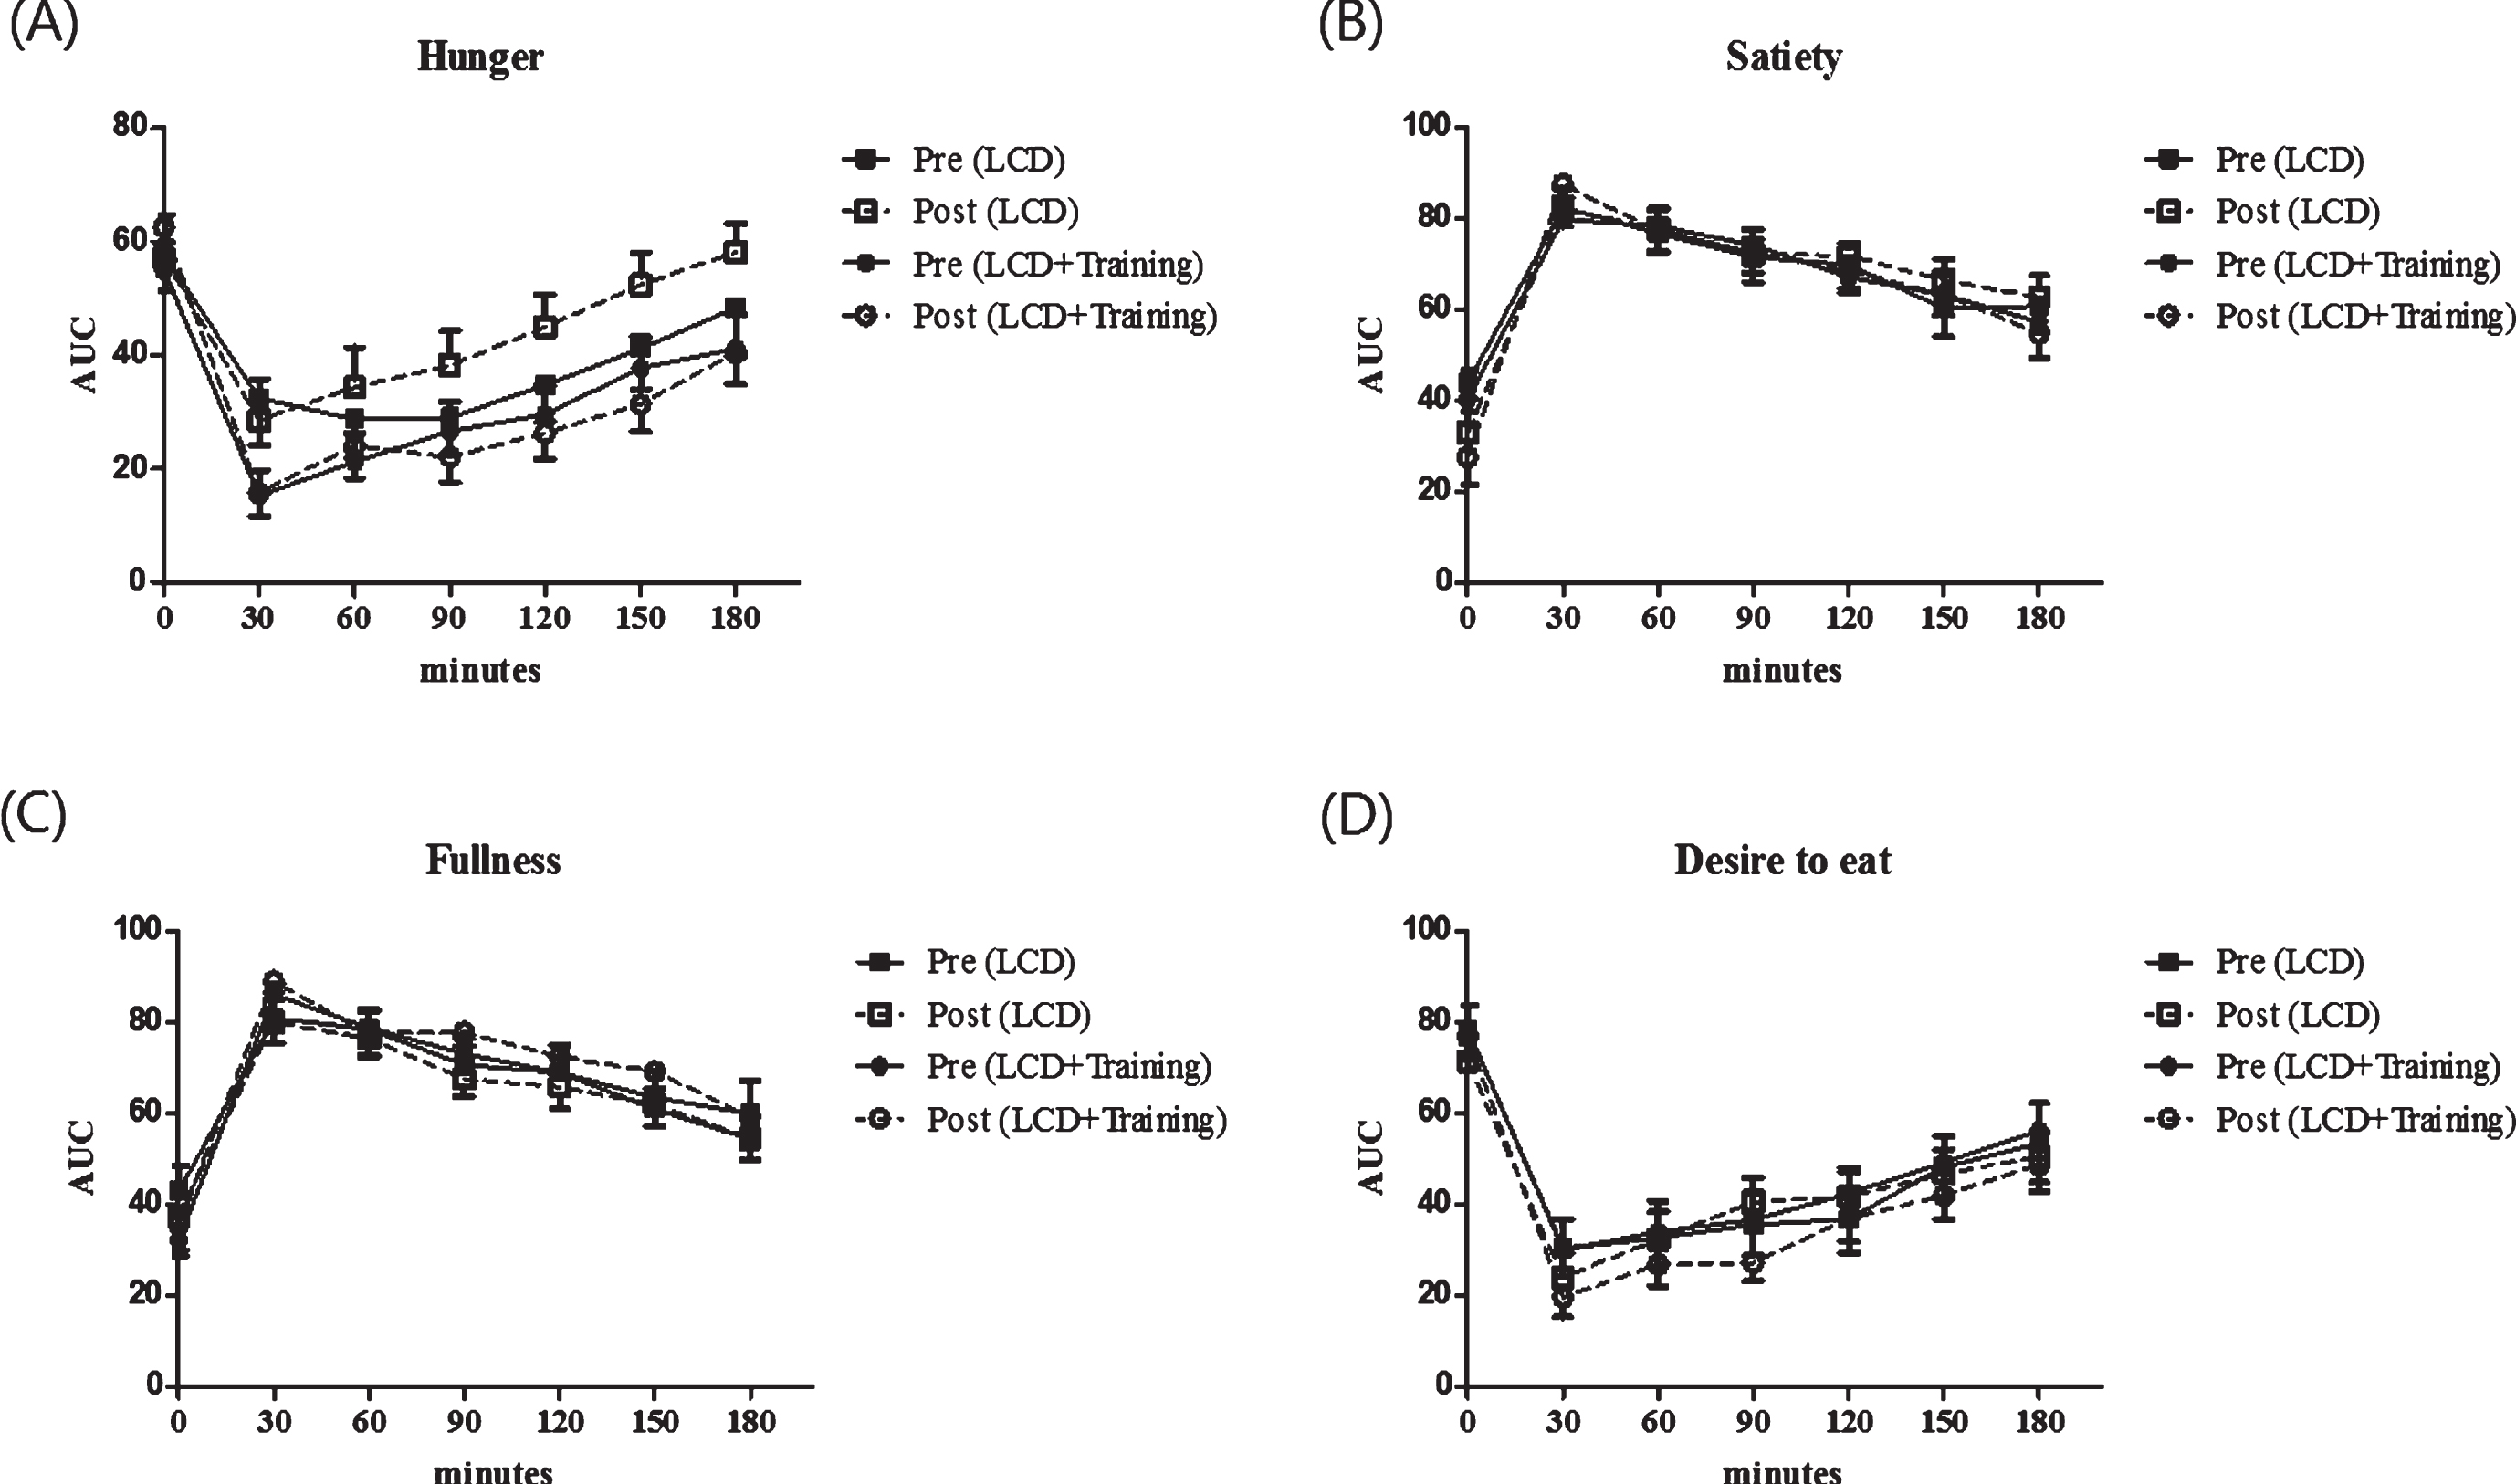
The effect of combined exercise and low calorie diet on appetite ratings are shown in Fig. 1. In this study we showed that there is no significant changes in the appetite ratings including feeling of hunger, satiety, fullness and desire to eat after the intervention (P > 0.05). In order to confirm this analysis, we further analyzed by calculating the area under the curve for appetite ratings. Furthermore, we analyzed the differences in the area under the curve (AUC) and found that there were no changes in AUC of appetite rating after the intervention in both groups (P > 0.05) (Table 1). As seen in Table 1, fasting leptin concentration was significantly reduced in LCD+training group (P = 0.001) while the changes were not seen in LCD group (P = 0.285).
Fig.1
Appetite ratings of the subjects before and after the intervention. These figures show time point differences on appetite between groups (square for LCD group and circle for LCD+training group), before intervention (black) and after intervention (white). Appetite was measured using a visual analogue scale on 4 different perceived measures including hunger (A), satiety (B), fullness (C) and desire to eat (D). Visual analogue scale was performed in 7 time points including 0 minutes (fasting state) and every 30 minutes after breakfast until 180 minutes.
The relationship between appetite on body weight before and after the intervention was analyzed. As seen in Fig. 2, satiety and fullness were significantly correlated with body weight before and after the intervention. We did not show the correlation between hunger and desire to eat on body weight (P > 0.05). In order to understand the role of appetite in this study, we further evaluate the correlation between appetite ratings and dietary intake before and after the intervention period (Table 2). Hunger, satiety and fullness were correlated with energy intake before the intervention, and this correlation was not seen after the intervention. Interestingly, carbohydrate intake was positively correlated with the feeling of hunger, satiety and fullness. Protein to carbohydrate ratio has been beneficial to reduce hunger as in this study we showed the negative correlation between protein: carbohydrate ratio and hunger (P = 0.006).
Fig.2
The correlation between appetite ratings and body weight before and after the intervention. These figures show a Pearson correlation test between body weight before (full line) and after (dashed line) interventions in all groups with appetite ratings including hunger (A), satiety (B), fullness (C), desire to eat (D). Appetite rating is showed as area under the curve (AUC) value of visual analog score.
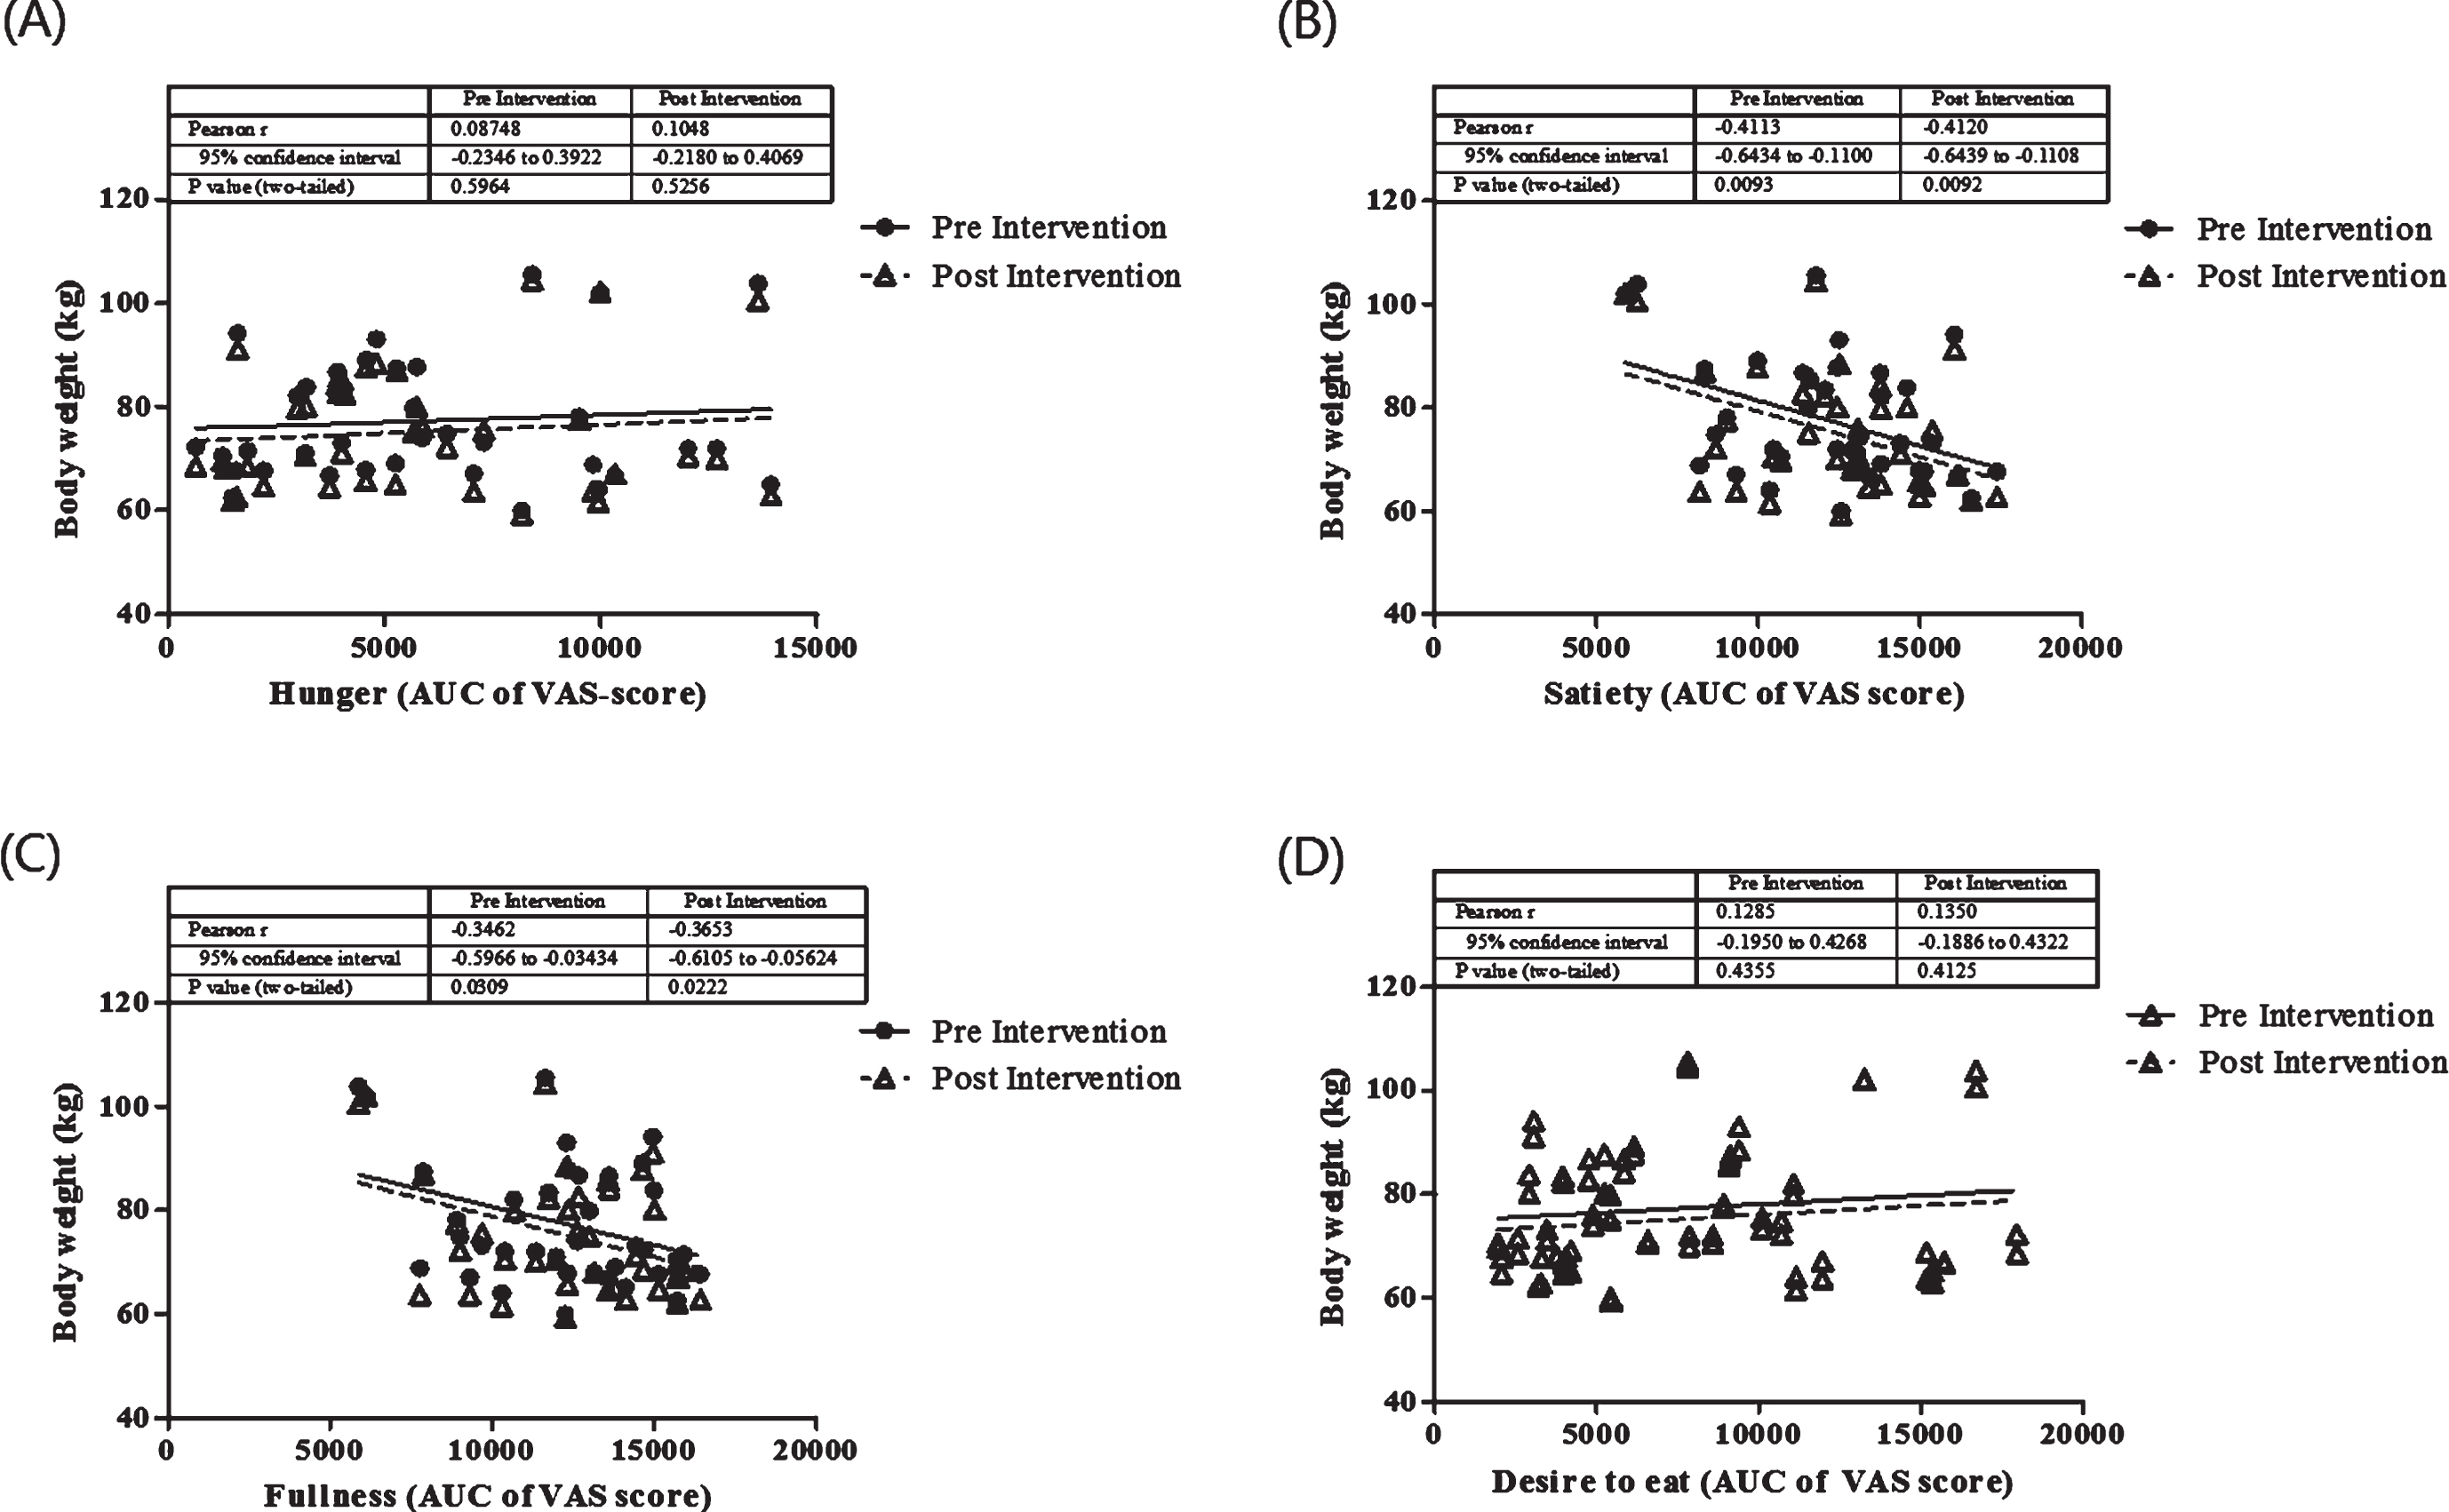
Table 2
The relationship between dietary composition on appetite ratings (AUC)
| Hunger | Satiety | Fullness | Desire to Eat | |||||
| Dietary intakes | r | P1) | r | P1) | r | P1) | r | P1) |
| Pre Intervention | ||||||||
| Energy | 0.41 | 0.009* | –0.39 | 0.014* | –0.36 | 0.026* | 0.31 | 0.058 |
| Protein | 0.03 | 0.868 | –0.17 | 0.303 | –0.11 | 0.518 | 0.02 | 0.888 |
| Fat | –0.07 | 0.663 | –0.06 | 0.695 | –0.09 | 0.586 | 0.20 | 0.233 |
| Carbohydrate | 0.52 | <0.001* | –0.44 | 0.005* | –0.46 | 0.003* | 0.31 | 0.059 |
| Fiber | 0.05 | 0.780 | 0.12 | 0.467 | 0.20 | 0.221 | 0.07 | 0.688 |
| Protein/Carbohydrate Ratio | –0.43 | 0.006* | 0.16 | 0.337 | 0.17 | 0.300 | –0.19 | 0.239 |
| % Fat to Total Energy | –0.26 | 0.116 | 0.04 | 0.786 | 0.09 | 0.591 | 0.07 | 0.666 |
| Post Intervention | ||||||||
| Energy | 0.32 | 0.051 | –0.01 | 0.962 | –0.11 | 0.489 | 0.17 | 0.311 |
| Protein | 0.26 | 0.109 | –0.03 | 0.875 | –0.04 | 0.808 | 0.12 | 0.460 |
| Fat | 0.26 | 0.111 | –0.22 | 0.169 | –0.27 | 0.096 | 0.17 | 0.308 |
| Carbohydrate | 0.28 | 0.089 | 0.10 | 0.560 | –0.03 | 0.858 | 0.11 | 0.518 |
| Fiber | 0.27 | 0.103 | –0.03 | 0.842 | –0.03 | 0.872 | 0.20 | 0.226 |
| Protein/Carbohydrate Ratio | –0.08 | 0.611 | –0.11 | 0.844 | 0.50 | 0.743 | –0.05 | 0.779 |
| % Fat to Total Energy | 0.05 | 0.759 | –0.33 | 0.038* | –0.30 | 0.065 | 0.11 | 0.492 |
1) P-value is calculated from Pearson correlation test between dietary composition before and after intervention and appetite rating. *significant correlation when P < 0.05.
3.2Leptin, dietary compositions and appetite
Changes in leptin was significantly correlated with body weight changes during the weight loss interventions (r = 0.56, P = 0.0003) (Fig. 3). In this study correlation between changes in leptin with dietary composition and appetite were evaluated. With all dietary component, protein intake before and after the intervention was positively correlated with changes in leptin level (r = 0.36, P = 0.027 and r = 0.34, P = 0.037, respectively) (Fig. 3). The other dietary components such as total energy intake, fat, carbohydrate and fiber were not correlated with changes in leptin. We also found that there were no significant correlation between changes in leptin and appetite (data are not shown).
Fig.3
Correlation between changes in leptin, body weight (A) and protein intake (B) before and after the intervention. The analysis was done using a Pearson correlation test.
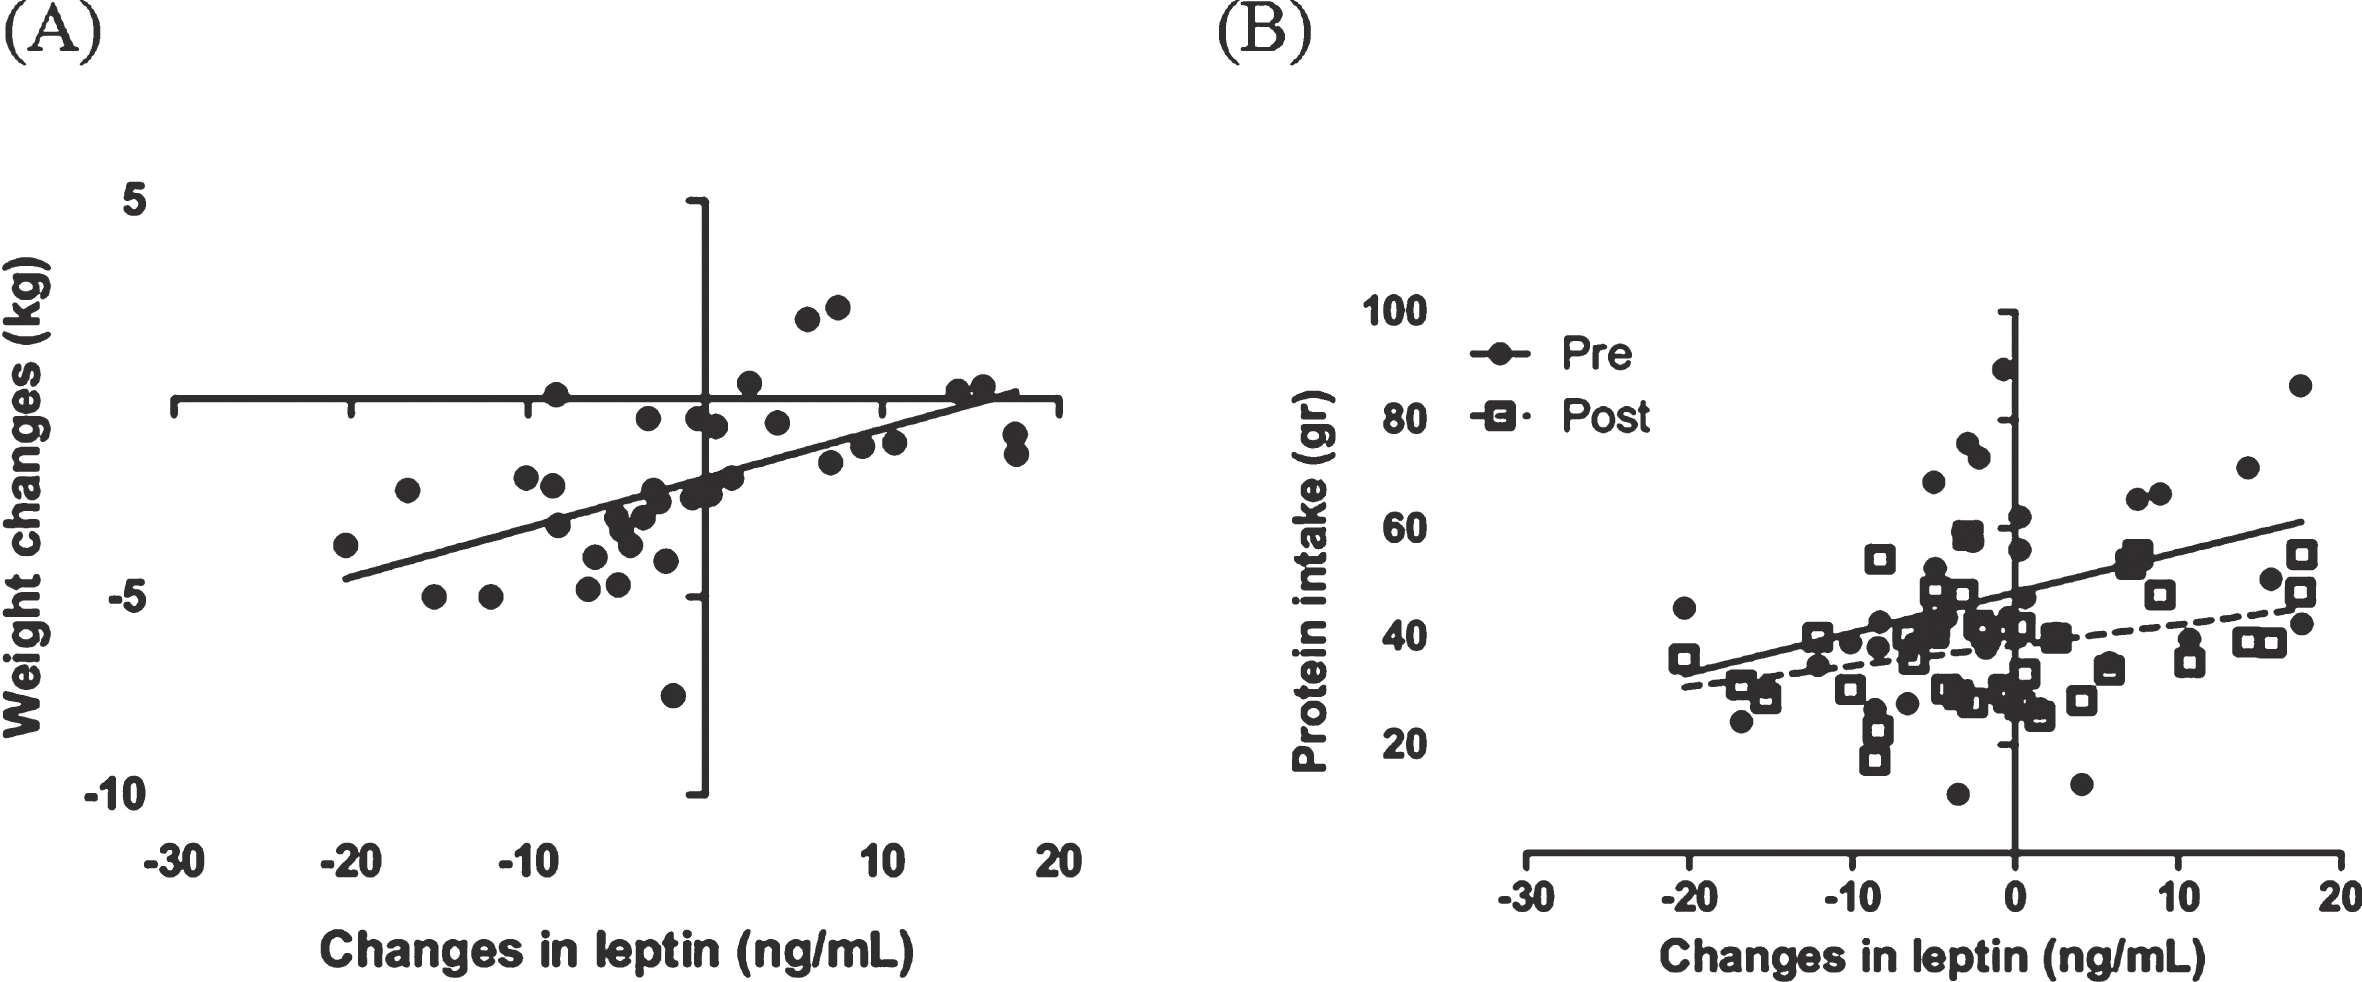
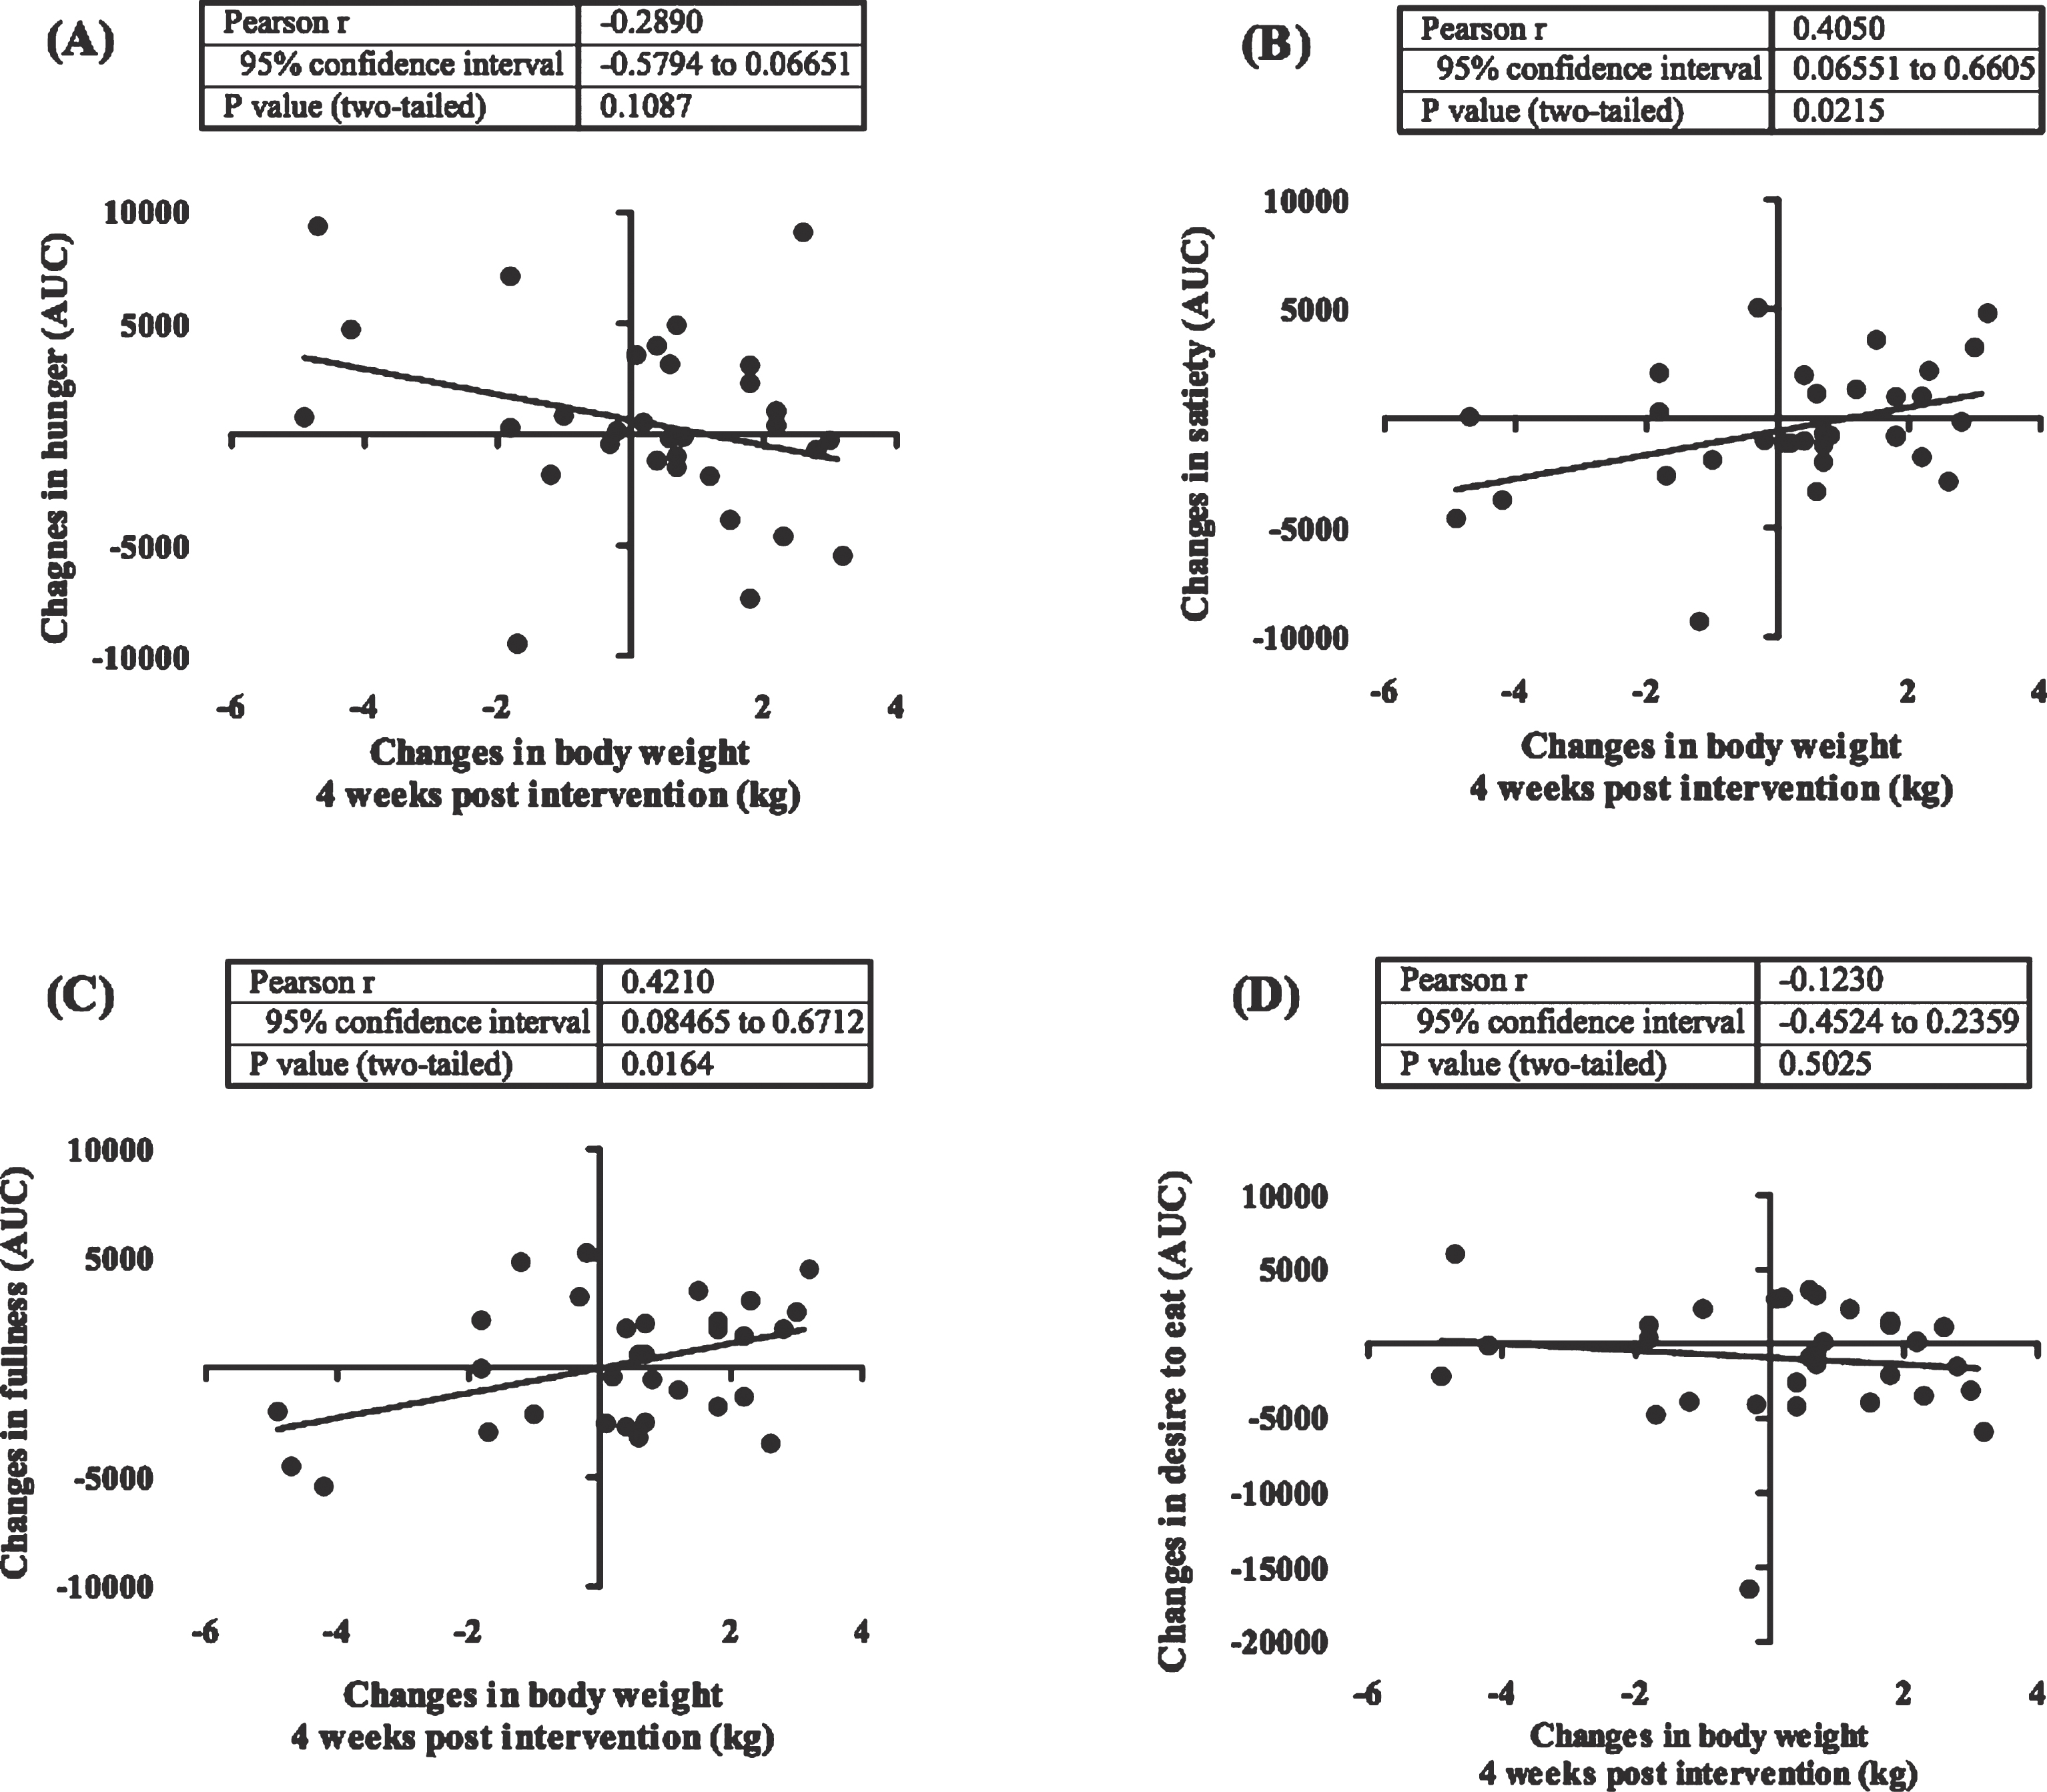
Figure 4 shows the dynamic of weight changes at the end of the study (week 0–8) and following 4 weeks (week 9–12). Weight rebound was calculated by reducing the latest weight with the previous weight. In this study we showed that in a group having a low calorie diet and exercise had a significant increment in body weight after the program was stopped (week 8) (P < 0.0001). This difference was not seen in subjects who only undertook a low calorie diet. Additionally, we also revealed that changes in feeling of fullness and satiety before and after the intervention were significantly correlated with a weight changes 4 weeks after the interventions were ended (Fig. 5). The weight changes 4 weeks after the interventions were not correlated with changes in plasma leptin.
Fig.4
Weight rebound in LCD+training and LCD groups. This figure shows weight rebound after the interventions has stopped. Week 0–8 is the intervention period while week 9–12 is the weight maintenance period (the intervention was stopped). The white bars show the weight changes in LCD+training group and black bar show weight changes in LCD only group. In this study we showed that there was a significant weight rebound in LCD+training group 4 weeks after the intervention has stopped (P < 0.0001).
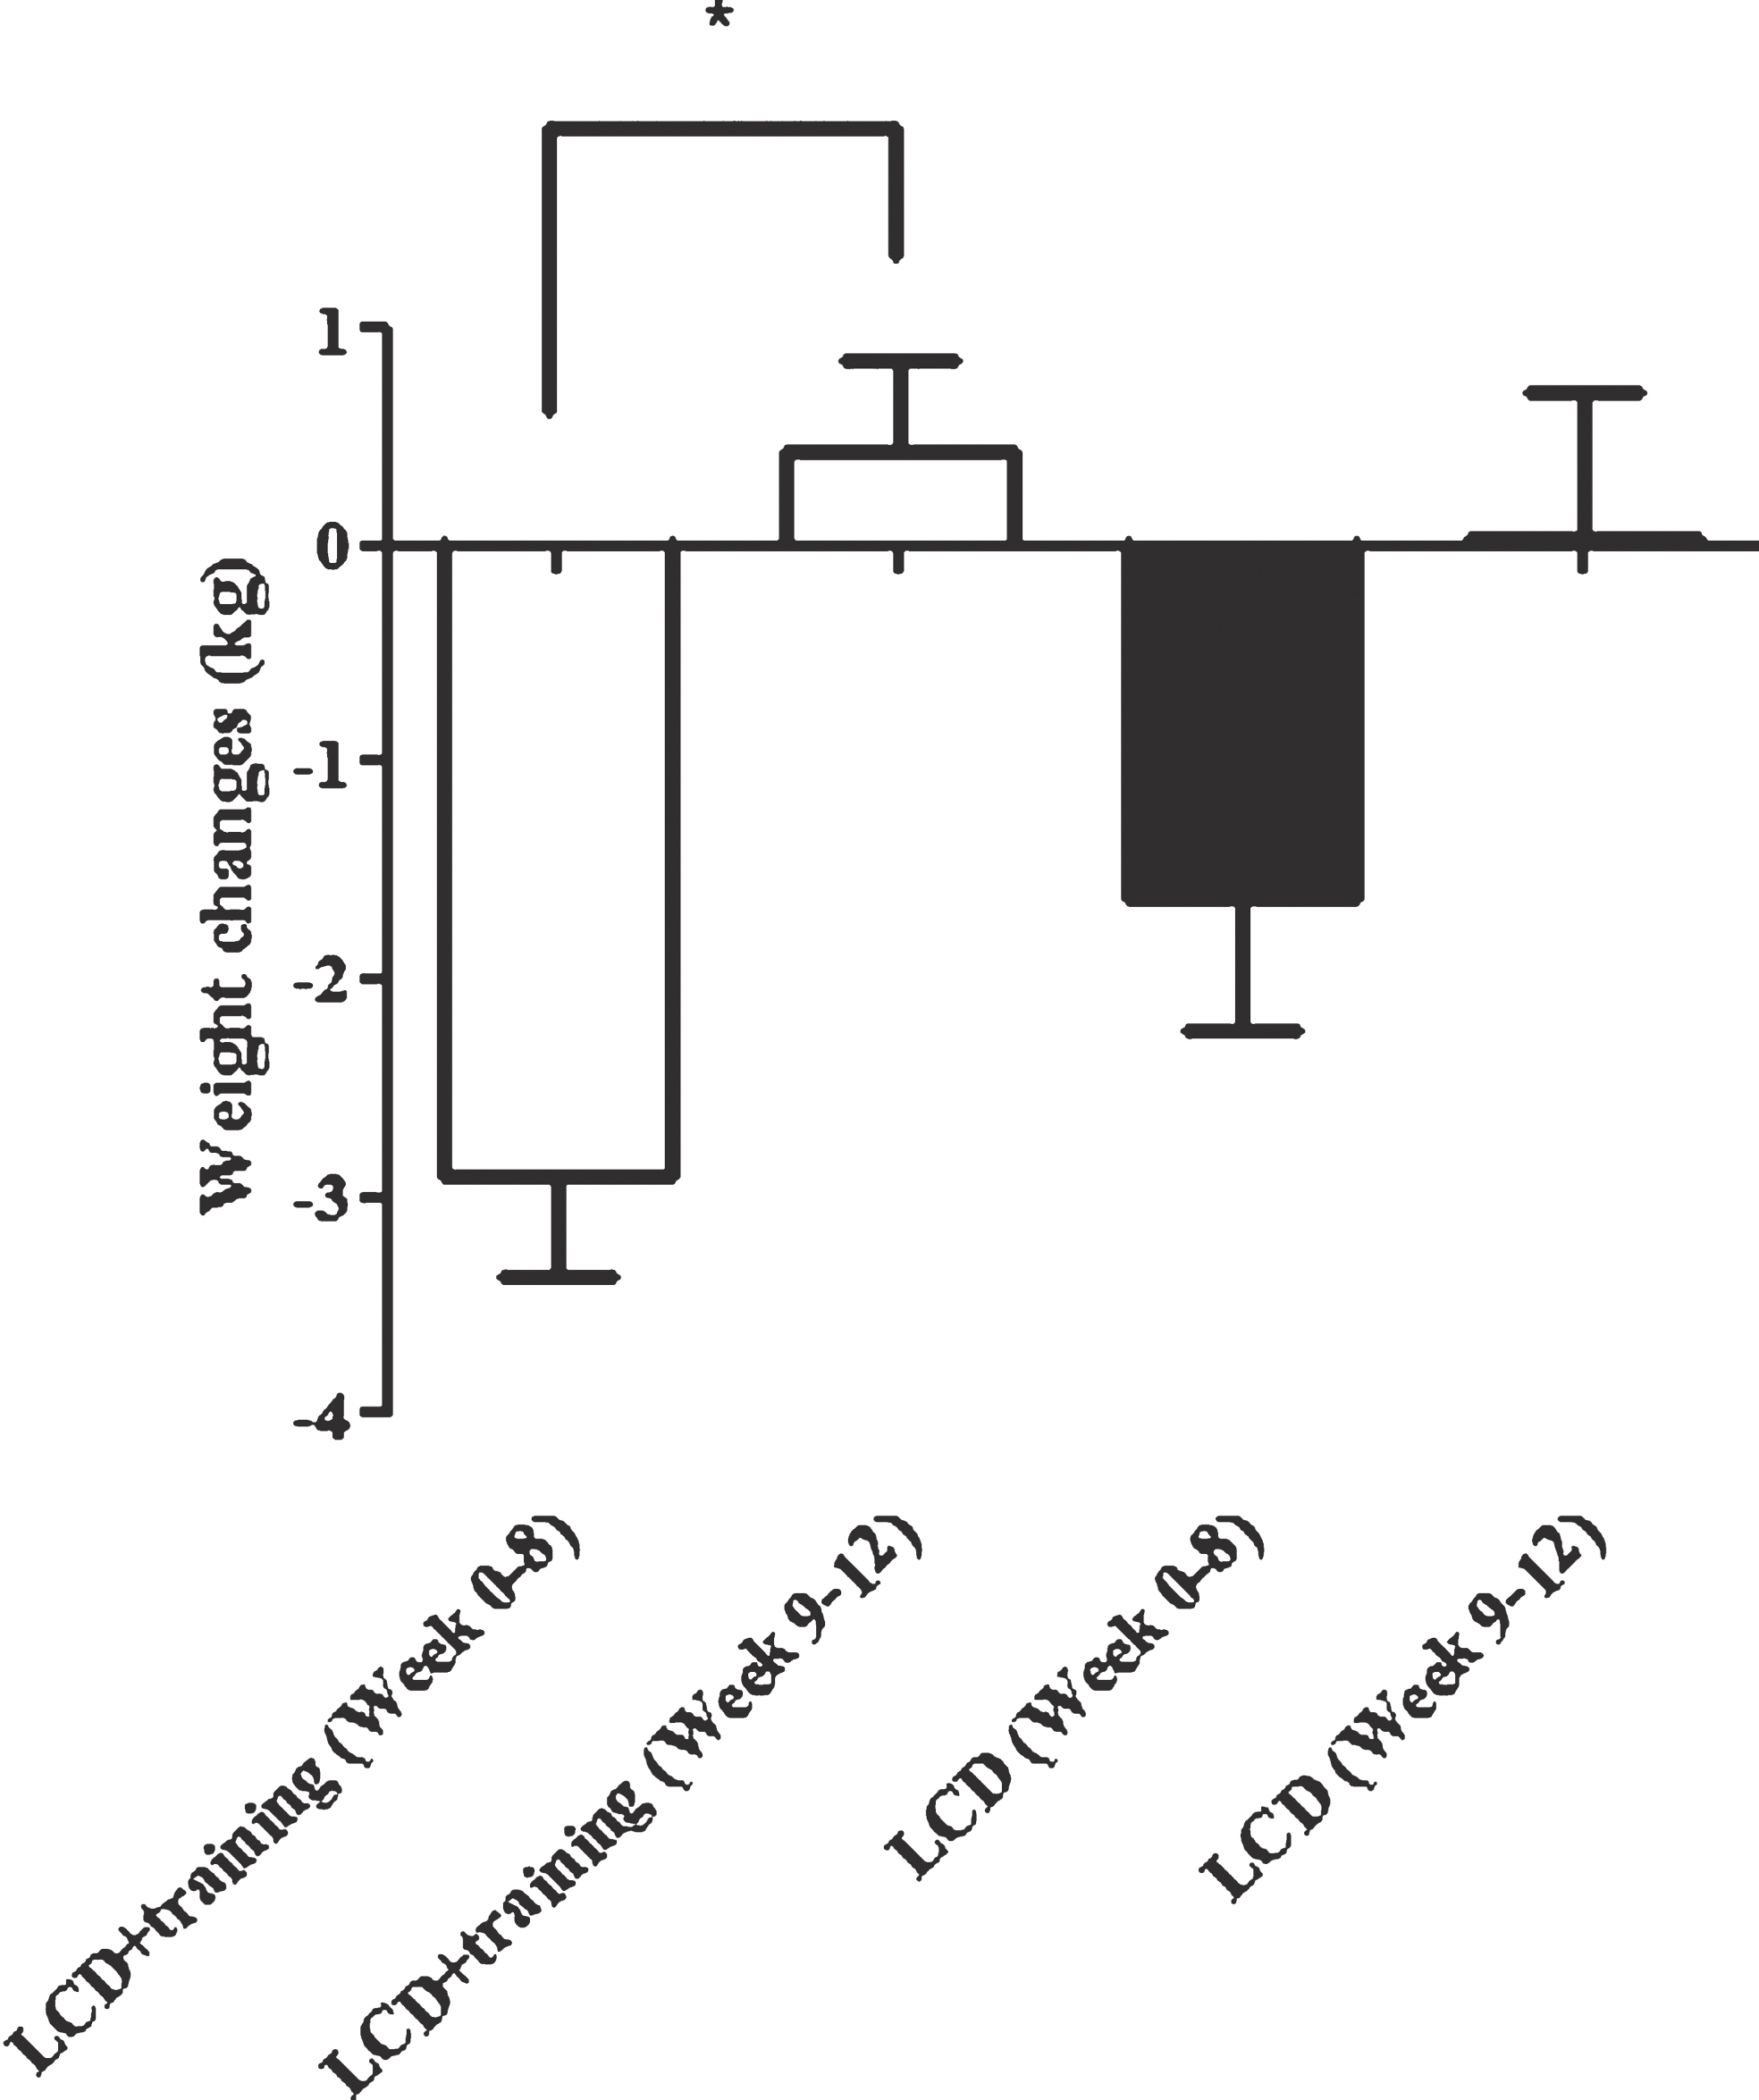
Fig.5
Correlation between post intervention body weight rebound and appetite. These figures show the correlation between body weight changes 4 weeks after the intervention has stopped (week 9–12) with changes in appetite ratings including hunger (A), satiety (B), fullness (C), desire to eat (D). In this study we showed that changes in satiety and fullness were positively correlated with weight changes after the intervention was stopped. Appetite rating is showed in area under the curve (AUC) value of visual analogue score measurements.
4Discussion
Appetite is an important factor during a weight loss program, therefore to develop a weight loss program that did not alter appetite rating is important. In both In this study we showed that after 8 weeks of intervention, the appetite ratings including sensation of hunger, satiety, fullness, and desire to eat were unchanged in a group receiving a low calorie diet. However we also showed that there were also no changes in the appetite in a group receiving a low calorie diet groups were significantly reduced. We also showed the reduction in dietary intake, especially total energy and carbohydrate intake. Dietary composition was correlated with appetite during the weight loss program. Energy and carbohydrate intake were correlated with hunger, satiety and fullness before the intervention.
We showed that there were no differences in appetite ratings between subjects with a low calorie diet only and a low calorie diet in combination with exercise. Therefore we suggested that exercise did not affect appetite rating in overweight/obese individuals who undertook a low calorie diet. To our knowledge, there was only limited number of studies investigating the long term effect of a combination of a low calorie diet and exercise on appetite. A report done by King et al. [18] showed that 6-week of dietary restriction and physical activity has been successfully lower body weight. Interestingly they showed that the hunger rating was increased and fullness was decreased after the intervention.
It was previously showed that weight loss was associated with changes on appetite in obese individuals [6]. Additionally, Drapeau et al. [19] showed that changes in appetite during a weight loss program such as hunger and desire to eat was a good predictor of weight loss. Compared to those studies, we showed that there were no changes in appetite at the end of the study and changes in hunger and desire to eat were not correlated with weight loss. In comparison to a study done by Drapeau et al. [19], we used AUC of appetite ratings in 180 minutes postprandial with measurements done every 30 minutes, while they used 60 minutes postprandial. Additionally we used different approach in this study compared to those done by Drapeau. Instead of combining data from a combination of diet, drugs, and supplement, this study solely on a lifestyle intervention including diet and physical activity. Interestingly, in this study we showed that the AUC of satiety and fullness as negatively correlated with body weight before and after the intervention. Although the correlations were not seen in the weight changes, these results could indicated that the persistence of body weight pattern was due to their initial satiety and fullness measures. Interestingly, we showed that satiety and fullness were positively correlated with weight changes 4 weeks after the interventions were ended. This lead to assumption that those who had reduction on satiety and fullness were also tend to keep on reducing weight 4 weeks after the interventions were ended.
Appetite, especially hunger has an important role in the successfulness of weight loss because it was associated with compliance towards a dietary regime [20]. Therefore, we evaluated the role of dietary composition on appetite before and at the end of a weight loss program. The measurement at the end of a weight loss program hopefully could give an insight on dietary composition during a low calorie diet. The data in both groups were merged because there was no difference in dietary treatments between groups. This is also helping us increase the number of subjects for data analysis.
As the result, we showed that hunger was positively correlated with energy and carbohydrate intake before the intervention. Energy and carbohydrate intake were also negatively correlated with satiety and fullness. Interestingly, we revealed that protein: carbohydrate ratio was negatively correlated with hunger. These result showed that considering dietary composition instead of only low calorie is necessary in order to optimize the appetite during weight loss program. Keeping up the protein intake while reducing carbohydrate intake might be beneficial for reducing hunger during a weight loss program. However, the effect of dietary composition on appetite rating was not seen at the end of the intervention.
An experimental study showed the beneficial impact of increasing protein and decreasing carbohydrate intake on weight loss and appetite. Johnstone et al. [21] did a 4 weeks crossover intervention study that compared the effect of low carbohydrate diet (4% of carbohydrate to total energy) and medium carbohydrate diet (35% of carbohydrate to total energy) in obese men. At the end of the study they showed that subject in a low carbohydrate diet had lower hunger rate and higher weight loss compared to those with medium carbohydrate diet. It was predicted that the effect of carbohydrate on appetite is based on increased circulating level of ketone bodies and 3-hydroxybutyrate as well as reduction of insulin level [21–24].
Although we did not show the effect of the intervention to appetite ratings, we revealed that satiety and fullness were associated with body weight. Interestingly we showed that energy and carbohydrate were important factors in regulating appetite before the low calorie diet was given. The correlation between dietary composition and appetite were not seen after the intervention. For future study we suggested studies that compare the effect of aerobic, resistance and the combination of both on appetite. Several hormonal factors are also need to be considered to be measured.
Leptin has been associated with regulation of energy metabolism and appetite. In this study we showed that leptin was significantly reduced in subjects with a low calorie diet and combined training and this was not seen in subjects with a low calorie diet only. Interestingly we also showed that weight changes during the intervention (week 0–8) were correlated with changes of leptin level. This correlation become not significant in 4 weeks period after the intervention stopped (week 9–12). This suggested that changes in leptin can explain the variation on weight loss during a weight loss program but not for the short term weight rebound.
The effect of diet and exercise on leptin has been observed before [25–27]. Abbenhardt et al. [25] analyzed the changes in leptin and adiponectin level on overweight/obese women after various weight loss programs including diet, exercise and the combination of both. In the report, they showed that leptin was reduced significantly in all groups but the highest effect was seen in a group with combination of diet and exercise. They also reported that there was an inverse association between leptin and weight loss. There is still a controversy regarding the possible mechanism on how weight loss and leptin were interact. A weight loss study in a small group showed that leptin level was reduced after 12 weeks of weight loss program but the soluble leptin receptor was unchanged. Sahin-efe et al. [27] also showed that the expression of leptin receptor mRNA at the peripheral blood mononuclear cell was unchanged after the intervention.
In conclusion we showed that a combination of a low calorie diet with combined training was able to reduce plasma leptin. Leptin was associated with weight loss during 8 weeks of intervention but not with 4 weeks of weight rebound. Although appetite was not associated with leptin, we showed that changes in satiety and fullness at the end of the intervention were correlated with weight rebound 4 weeks after the intervention was stopped. Further study is needed to explore the biological pathway related to leptin changes during weight loss intervention.
Grants
Hibah Dana Masyarakat, Fakultas Kedokteran, Universitas Gadjah Mada, Indonesia
Conflict of interest
There was no conflict of interest in the process of conducting this study.
Funding/support statement
This study was supported by Hibah Dana Masyarakat, Faculty of Medicine, Universitas Gadjah Mada, Indonesia (UPPM/69/M/05/04/04.15).
Acknowledgments
We thank to Mrs. Weni Kurdanti and Mrs. Windi Indah who help us in the development of training program and nutritional counseling during the intervention.
References
[1] | Poirier P , Giles TD , Bray GA , et al. Obesity and cardiovascular disease: Pathophysiology, evaluation, and effect of weight loss. Arteriosclerosis, Thrombosis, and Vascular Biology. (2006) ;968–76. |
[2] | WHO. Global Strategy on Diet, Physical Activity and Health Obesity and Overweight. (2003) . p. http://www.who.int/hpr/NPH/docs/gs_obesity.pdf.200. |
[3] | British Nutrition Foundation. 1999 Obesity. Oxford: Blackwell Science. |
[4] | Varo JJ , Martinez-Gonzalez MA , de Irala-Estevez J , et al. Distribution and determinants of sedentary lifestyles in the European Union. Int J Epidemiol. (2003) ;32: (1):138–46. |
[5] | Suzuki K , Jayasena CN , Bloom SR . Obesity and appetite control. Experimental Diabetes Research. (2012) . |
[6] | Doucet E , Imbeault P , St-Pierre S , et al. Appetite after weight loss by energy restriction and a low-fat diet-exercise follow-up. Int J Obes Relat Metab Disord. (2000) ;24: :906–14. |
[7] | Tsofliou F , Pitsiladis YP , Malkova D , et al. Moderate physical activity permits acute coupling between serum leptin and appetite-satiety measures in obese women. Int J Obes Relat Metab Disord. (2003) ;27: (11):1332–9. |
[8] | Unick JL , Otto AD , Goodpaster BH , et al. Acute effect of walking on energy intake in overweight/obese women. Appetite. (2010) ;55: (3):413–9. |
[9] | Ueda SY , Yoshikawa T , Katsura Y , et al. Changes in gut hormone levels and negative energy balance during aerobic exercise in obese young males. J Endocrinol. (2009) ;201: (1):151–9. |
[10] | Weigle DS , Sande KJ , Iverius PH , et al. Weight loss leads to a marked decrease in nonresting energy expenditure in ambulatory human subjects. Metabolism. (1988) ;37: (10):930–6. |
[11] | Leibel RL , Rosenbaum M , Hirsch J . Changes in energy expenditure resulting from altered body weight. N Engl J Med. (1995) ;332: (10):621–8. |
[12] | Doucet E , Imbeault P , St-Pierre S , et al. Greater than predicted decrease in energy expenditure during exercise after body weight loss in obese men. Clin Sci (Lond). (2003) ;105: (1):89–95. |
[13] | Mariman ECM . Human biology of weight maintenance after weight loss. Journal of Nutrigenetics and Nutrigenomics. (2012) ;13–25. |
[14] | Sumithran P , Prendergast LA , Delbridge E , et al. Long-Term Persistence of Hormonal Adaptations to Weight Loss. Obstetrical & Gynecological Survey. (2012) ;91–2. |
[15] | Rosenbaum M , Goldsmith R , Bloomfield D , et al. Low-dose leptin reverses skeletal muscle, autonomic, and neuroendocrine adaptations to maintenance of reduced weight. J Clin Invest. (2005) ;115: (12):3579–86. |
[16] | Rosenbaum M , Murphy EM , Heymsfield SB , et al. Low dose leptin administration reverses effects of sustained weight-reduction on energy expenditure and circulating concentrations of thyroid hormones. J Clin Endocrinol Metab. (2002) ;87: (5):2391–4. |
[17] | Sweeney ME , Hill JO , Heller PA , et al. Severe vs moderate energy restriction with and without exercise in the treatment of obesity: Efficiency of weight loss. Am J Clin Nutr. (1993) ;57: (2):127–34. |
[18] | King NA , Hester J , Gately PJ . The effect of a medium-term activity- and diet-induced energy deficit on subjective appetite sensations in obese children. Int J Obes (Lond). (2007) ;31: (2):334–9. |
[19] | Drapeau V , King N , Hetherington M , et al. Appetite sensations and satiety quotient: Predictors of energy intake and weight loss. Appetite. (2007) ;48: (2):159–66. |
[20] | Vogels N , Westerterp-Plantenga MS . Categorical strategies based on subject characteristics of dietary restraint and physical activity, for weight maintenance. Int J Obes (Lond). (2005) ;29: :849–57. |
[21] | Johnstone AM , Horgan GW , Murison SD , et al. Effects of a high-protein ketogenic diet on hunger, appetite, and weight loss in obese men feeding ad libitum. Am J Clin Nutr. (2008) ;87: (1):44–55. |
[22] | Bray GA , Davidson MB , Drenick EJ . Obesity: A serious symptom. Annals of Internal Medicine. (1972) 779–95. |
[23] | Arase K , Fisler JS , Shargill NS , et al. Intracerebroventricular infusions of 3-OHB and insulin in a rat model of dietary obesity. Am J Physiol - Regul Integr Comp Physiol. (1988) ;255: (6):R974–81. |
[24] | Robinson AM , Williamson DH . Physiological roles of ketone bodies as substrates and signals in mammalian tissues. Physiol Rev. (1980) ;60: (1):143–87. |
[25] | Abbenhardt C , Mctiernan A , Alfano CM , et al. Effects of individual and combined dietary weight loss and exercise interventions in postmenopausal women on adiponectin and leptin levels. J Intern Med. (2013) ;274: (2):163–75. |
[26] | Miller GD , Isom S , Morgan TM , et al. Effects of a community-based weight loss intervention on adipose tissue circulating factors. Diabetes Metab Syndr Clin Res Rev. (2014) ;8: (4):205–11. |
[27] | Sahin-Efe A , Polyzos SA , Dincer F , et al. Intracellular leptin signaling following effective weight loss. Metabolism. (2015) ;64: (8):888–95. |


