
Type 2 diabetes mellitus treatment habits in a specialized care setting: the START-DIAB study
Abstract
BACKGROUND:
Early optimized lifestyle and medication treatment can reduce the burden of type 2 diabetes mellitus (T2DM). Although Diabetologists take care of most Italian people with T2DM and are the only allowed to prescribe innovative drugs, still half T2DM patients are poorly controlled.
AIMS:
To verify specialists’ propensity to reach individualized glycemic goals by treating to target newly referred people with T2DM having HbA1c levels >7% (>53 mmol/mol).
MATERIALS AND METHODS:
2536 poorly controlled, orally treated T2DM from all over Italy were evaluated and followed up for 6 months for appropriate nutritional and pharmacologic treatment in a specialized setting and diabetologists filled in a questionnaire on supposed reasons behind patients’ poor metabolic control and on their own therapeutic choices.
RESULTS:
At the first visit only 71.8% people underwent slight treatment adaptations (through a slight reduction of secretagogue utilization accompanied, to a lesser extent, by some increase in incretin prescription (from 13.4% to 33.5%; p < 001) and by de novo insulin administration (3.8%). Specialists stated three major reasons for poor control as observed at referral. Two of them, i.e. disease per se (secondary failure) and patients’ attitude (poor adherence), were high-rated, while the other one, addressing clinicians’ responsibility, was only marginally accounted for despite most diabetes specialists still going on with secretagogues all the time. Detailed results are provided within the text.
CONCLUSIONS:
In spite of their well-recognized professional competence and their consistent reasoned diet and exercise advice, Italian diabetologists seldom complied with guidelines suggesting to move on to safer innovative drugs or insulin when needed. Their prescription behavior showed un underestimation of hypoglycemic and beta-cell functional exhaustion risk associated with secretatogues, and a low propensity to try and reach individualized glycemic goals through an early and strict treat-to-target approach.
1Introduction
Personalized treatment of type 2 diabetes mellitus (T2DM) [1] has now become part of healthcare professional daily practice. It marks a turning point after years of strict, almost mechanical implementation of Evidence Based Medicine (EBM) principles, suggesting the adoption of standardized therapeutic behaviors in line with statistically significant results obtained in quite large, yet selected, populations [2].
Nowadays indeed, in the absence of a single EBM-supported therapeutic gold standard for all diabetic patients, EBM is intended as the most effective integration of best clinical trial outcomes with physician’s experience/skills and patient’s values/expectations. This makes doctors behave explicitly, consciously, and judiciously by sharing their considered therapeutic decisions with their patients [3, 4].
Personalized treatment is strongly required for T2DM because of both inner disease heterogeneity and individually identified goals [5, 6]. Moreover, being individual genetic variability still wide and ill-defined, physicians have to choose drugs based on a series of phenotype-related variables rather than on precision medicine principles [7–9]. To cope with such a difficult task, Italian specialists can rely on specific phenotype- related algorithms stemming from the analysis of the Annals of the Italian Diabetologist Association (AMD), a high quality nation-wide clinical care database of T2DM patients followed up within specialized settings since 2004 [10].
According to those Annals, over 50% Italian people with T2DM fail to meet expected metabolic targets, and some 30% of their newly diagnosed mates display HbA1c levels >8.0% (64 mmol/mol) which is not in line with the best way to avoid/delay complications and related risk factors [10, 11]. This holds true however for many European countries as well, despite the availability of increasingly safe and effective drugs and the rather frequent issue of detailed recommendations by diabetes-related scientific societies [12–14].
Whatever the country or the care setting, both physicians and patients prefer to wait longer that expected for oral treatment intensification [15–17] and, even more, for insulin therapy initiation [18, 19]. In Italy this phenomenon is exacerbated by national legislation stating that every sixth month general practitioners (GPs) have to be allowed by public diabetes care units to prescribe innovative, effective and safe drugs to their individual patients. Italian GPs, in turn, tend to treat freshly diagnosed or low-complexity cases on their own until specialists’ help can no longer be postponed [19–22].
We thus performed this real life six month investigation: its primary outcome was to verify specialists’ treatment attitude towards their freshly referred patients with HbA1c levels >7% (>53 mmol/mol). Secondary outcomes were to i) evaluate the metabolic target attainment rate and ii) identify reasons behind metabolic control failure and iii) six-month follow up changes in blood pressure, BMI, creatinine, and the rate of cardiovascular events, adverse effects and unscheduled diabetes care consultations.
2Subjects, materials and methods
START DIAB was designed as an observational, multicenter study involving 48 public Diabetes Care Units (DCU) having the protocol approved by their own Ethics Committees and the informed consent signed by participating patients. All DCUs had been certified for clinical research and, as members of the AMD Research Network Initiative [23], were highly experienced in randomized clinical trials [11]. Specialists involved in data collection were randomly chosen within them in order to prevent any selection bias. The period under study was September 2014 to May 2015.
2.1Diagnostic criteria
The diagnosis of T2DM was made/confirmed according to ADA Standards of Medical Care in Diabetes 2014 [24]. The International Classification of Diseases, Clinical Modification (ICD-9-CM, V82.9 2014) was used to define T2DM diagnosis and comorbidities and/or complications [25]. Creatinine clearance rate was calculated using the CKD-EPI (Chronic Kidney Disease Epidemiology Collaboration) formula [26]. During the enrollment phase diabetologists used an electronic database to record individual blood parameters, microvascular complications, cardiovascular events and scheduled/unscheduled medical care interventions. They also filled in a questionnaire as reported below.
2.2Enrollment criteria
All T2DM patients referring for the first time were enrolled over three months in case of: age ≥18 years, HbA1c>7% (>53 mmol/mol), previous or current treatment based on lifestyle and hypoglycemic agents other than insulin (HAOI). Enrollment criteria also included mild complications/comorbidities as previously described [27]. Patients with previous cardiovascular events diagnosed longer than 6 months before [29] were considered as clinically stable and included too. The HbA1c cutoff was chosen also for aged patients, according to both the algorithm by Ceriello et al. [28] and ADA’s “Standards of Medical Care in Diabetes”, recommending a 7.0% (53 mmol/mol) HbA1c to be attained in most patients in order to reduce the incidence of microvascular disease [24]. Less stringent HbA1c targets [2, 29], which would have been appropriate for specific populations were not taken into account, because, as stated above, critically-ill people or those with recent cardiovascular events or with severe/rapidly progressing clinical conditions were not involved.
2.3Exclusion criteria
Were: type 1 or gestational DM, diet only, insulin treatment, severe or fast progressing disease complications (eGFR < 30, proliferating retinopathy, class 2–4 NYHA heart failure, diabetic foot with an active ulcer and/or previous amputation, permanent immobilization), recent or acute cardiovascular complications as previously defined [30], anamnestic or on-treatment malignancies, diseases markedly reducing life expectation and any clinical, mental and/or logistic conditions severely hampering appropriate disease management.
2.4Other criteria taken into account
Drugs were explicitly given as an add-on to the optimal lifestyle defined by current standards of care for diabetes mellitus, which was in fact taken as the first line prescription [24, 29, 31–34]. Nutritional advice was especially addressed as part of any doctor’s appointment at the DCU. In greater detail, according to 2014 ADA dietary guidelines a balanced diet was adopted all the time with low-glycemic load foods substituting for higher-glycemic load foods or sugar-sweetened beverages and macronutrient distribution as follows: 55–60% carbohydrates, 10–15% protein, 15–20% SFA+PUFA and 10–15% MUFA [24]. An increased amount of fibers and whole grains was recommended to all patients and those who were found to be overweight/obese were also strongly suggested to reduce energy intake by at least 500 Kcal/day consistently [33].
The overall picture of the selected population is reported in Table 1.
Table 1
Descriptive features of the enrolled population. Data are expressed as mean+SD or as n. and percent rate in case of categorical variables: *309 subjects (12,2%) had more than a single complication. CV = Cardio- Vascular; TIA = Transient Ischemic Attack; AMI = Acute Myocardial Infarction
| Variable | Subjects (n. 2536) | |
| n. | (%) | |
| Clinical parameters (M ± SD) | ||
| Male | 1359 | (53.6) |
| Female | 1177 | (46.4) |
| Age (years) M ± SD (Range) | 64.6±10.3 | (27–80) |
| BMI (kg/m2) M ± SD (Range) | 29.8±5.3 | (15.8–64.1) |
| normal weight | 388 | (15.3) |
| underweight | 3 | (0.1) |
| overweight | 1059 | (41.8) |
| obese | 1081 | (42.7) |
| Diabetes duration (years) M ± SD (Range) | 10.0±7.6 | (<1–30) |
| New diagnosis (≤1 year) | 173 | (7.3) |
| Previous Diagnosis | 2363 | (93.2) |
| Systolic Blood Pressure (M±SD, mmHg) | 135±16.4 | |
| Diastolic Blood Pressure (M±SD, mmHg) | 79±8.2 | |
| Biochemical parameters (M±SD) | ||
| Glycated Haemoglobin –HbA1c (%) | 8.0±1.0 | |
| Total Cholesterol (mg/dl) | 183.2±38.3 | |
| HDL Cholesterol (mg/dl) | 48.3±12.0 | |
| LDL Cholesterol (mg/dl) | 105.0±34.7 | |
| Triglycerides (mg/dl) | 147.7±73.3 | |
| Creatinine (mg/dl) | 0.9±0.6 | |
| Comorbidities/Diabetes-related Complications* (n. 1118 –44%) | ||
| No CV Diabetes complications | 771 | (30.4) |
| Retinopathy | 377 | (14.8) |
| Nephropathy | 332 | (13.1) |
| Neuropathy | 271 | (10.7) |
| Cardiovascular complicatons | 347 | (13.7) |
| TIA | 81 | (3.2) |
| Angina | 66 | (2.6) |
| AMI/revascularization | 145 | (5.7) |
| Peripheral revascularization | 23 | (0.9) |
| Other | 34 | (7.6) |
Treatment changes accepted at enrollment included: medication dosage and drug combination/withdrawal. All HAOIs available at the time of the study (2014) were considered for treatment at the first visit, including metformin, sulphonylureas (SU), repaglinide, pioglitazone, (TZD), acarbose, di-peptidyl peptidase-4 inhibitors (DPP-4is; only sitagliptin, vildagliptin, and saxagliptin were available at the time of the study) and glucagon-like peptide-1 receptor agonists (GLP1-RAs; only exenatide and liraglutide were available at the time of the study), as well as, basal and/or bolus insulin.
In line with the Italian standards of care, blood pressure levels were defined as “poorly controlled” when exceeding 149/89 mmHg in uncomplicated and 139/79 in complicated T2DM [34].
A questionnaire was set up and tested for validation on 25 patients with T2DM before the study by four board members informed on current hypoglycemic, anti-dyslipidemic, anti-hypertensive, anti-aggregating and/or anticlotting therapy. They filled in the questionnaire according to the “closed answer” lists reported below for each of the two following sections: a) “diagnostic section” including clinical examination, and hypothesized reasons behind single patient’s poor glycemic control; b) “therapeutic attitude section” concerning reasons behind their own eventually occurring choice to make no changes to current therapy. Possible answers (one or more were accepted) to the “Diagnostic section” and to the “Therapeutic attitude section” were as follows. For the former: secondary failure; reduction; unexpected drug discontinuation; GP-handled treatment changes; poor lifestyle; poor compliance; concurrent treatment hyperglycemic effects; no explanation; other; for the other: better to wait longer for good results; adequate results for this particular patient; fear of hypoglycemia; fear of weight gain; too many drugs already prescribed; unreliable subject; too low drug dosage inadvertently taken; history of drug discontinuation; better lifestyle expected; concurrent interfering treatment withdrawal; improving glucose trend; other.
A registered-access web site was prepared providing all interested specialists with an online database including all items specified in the dedicated case report form (CRF) where data from people involved in the study were regularly recorded.
2.5Follow-up phase
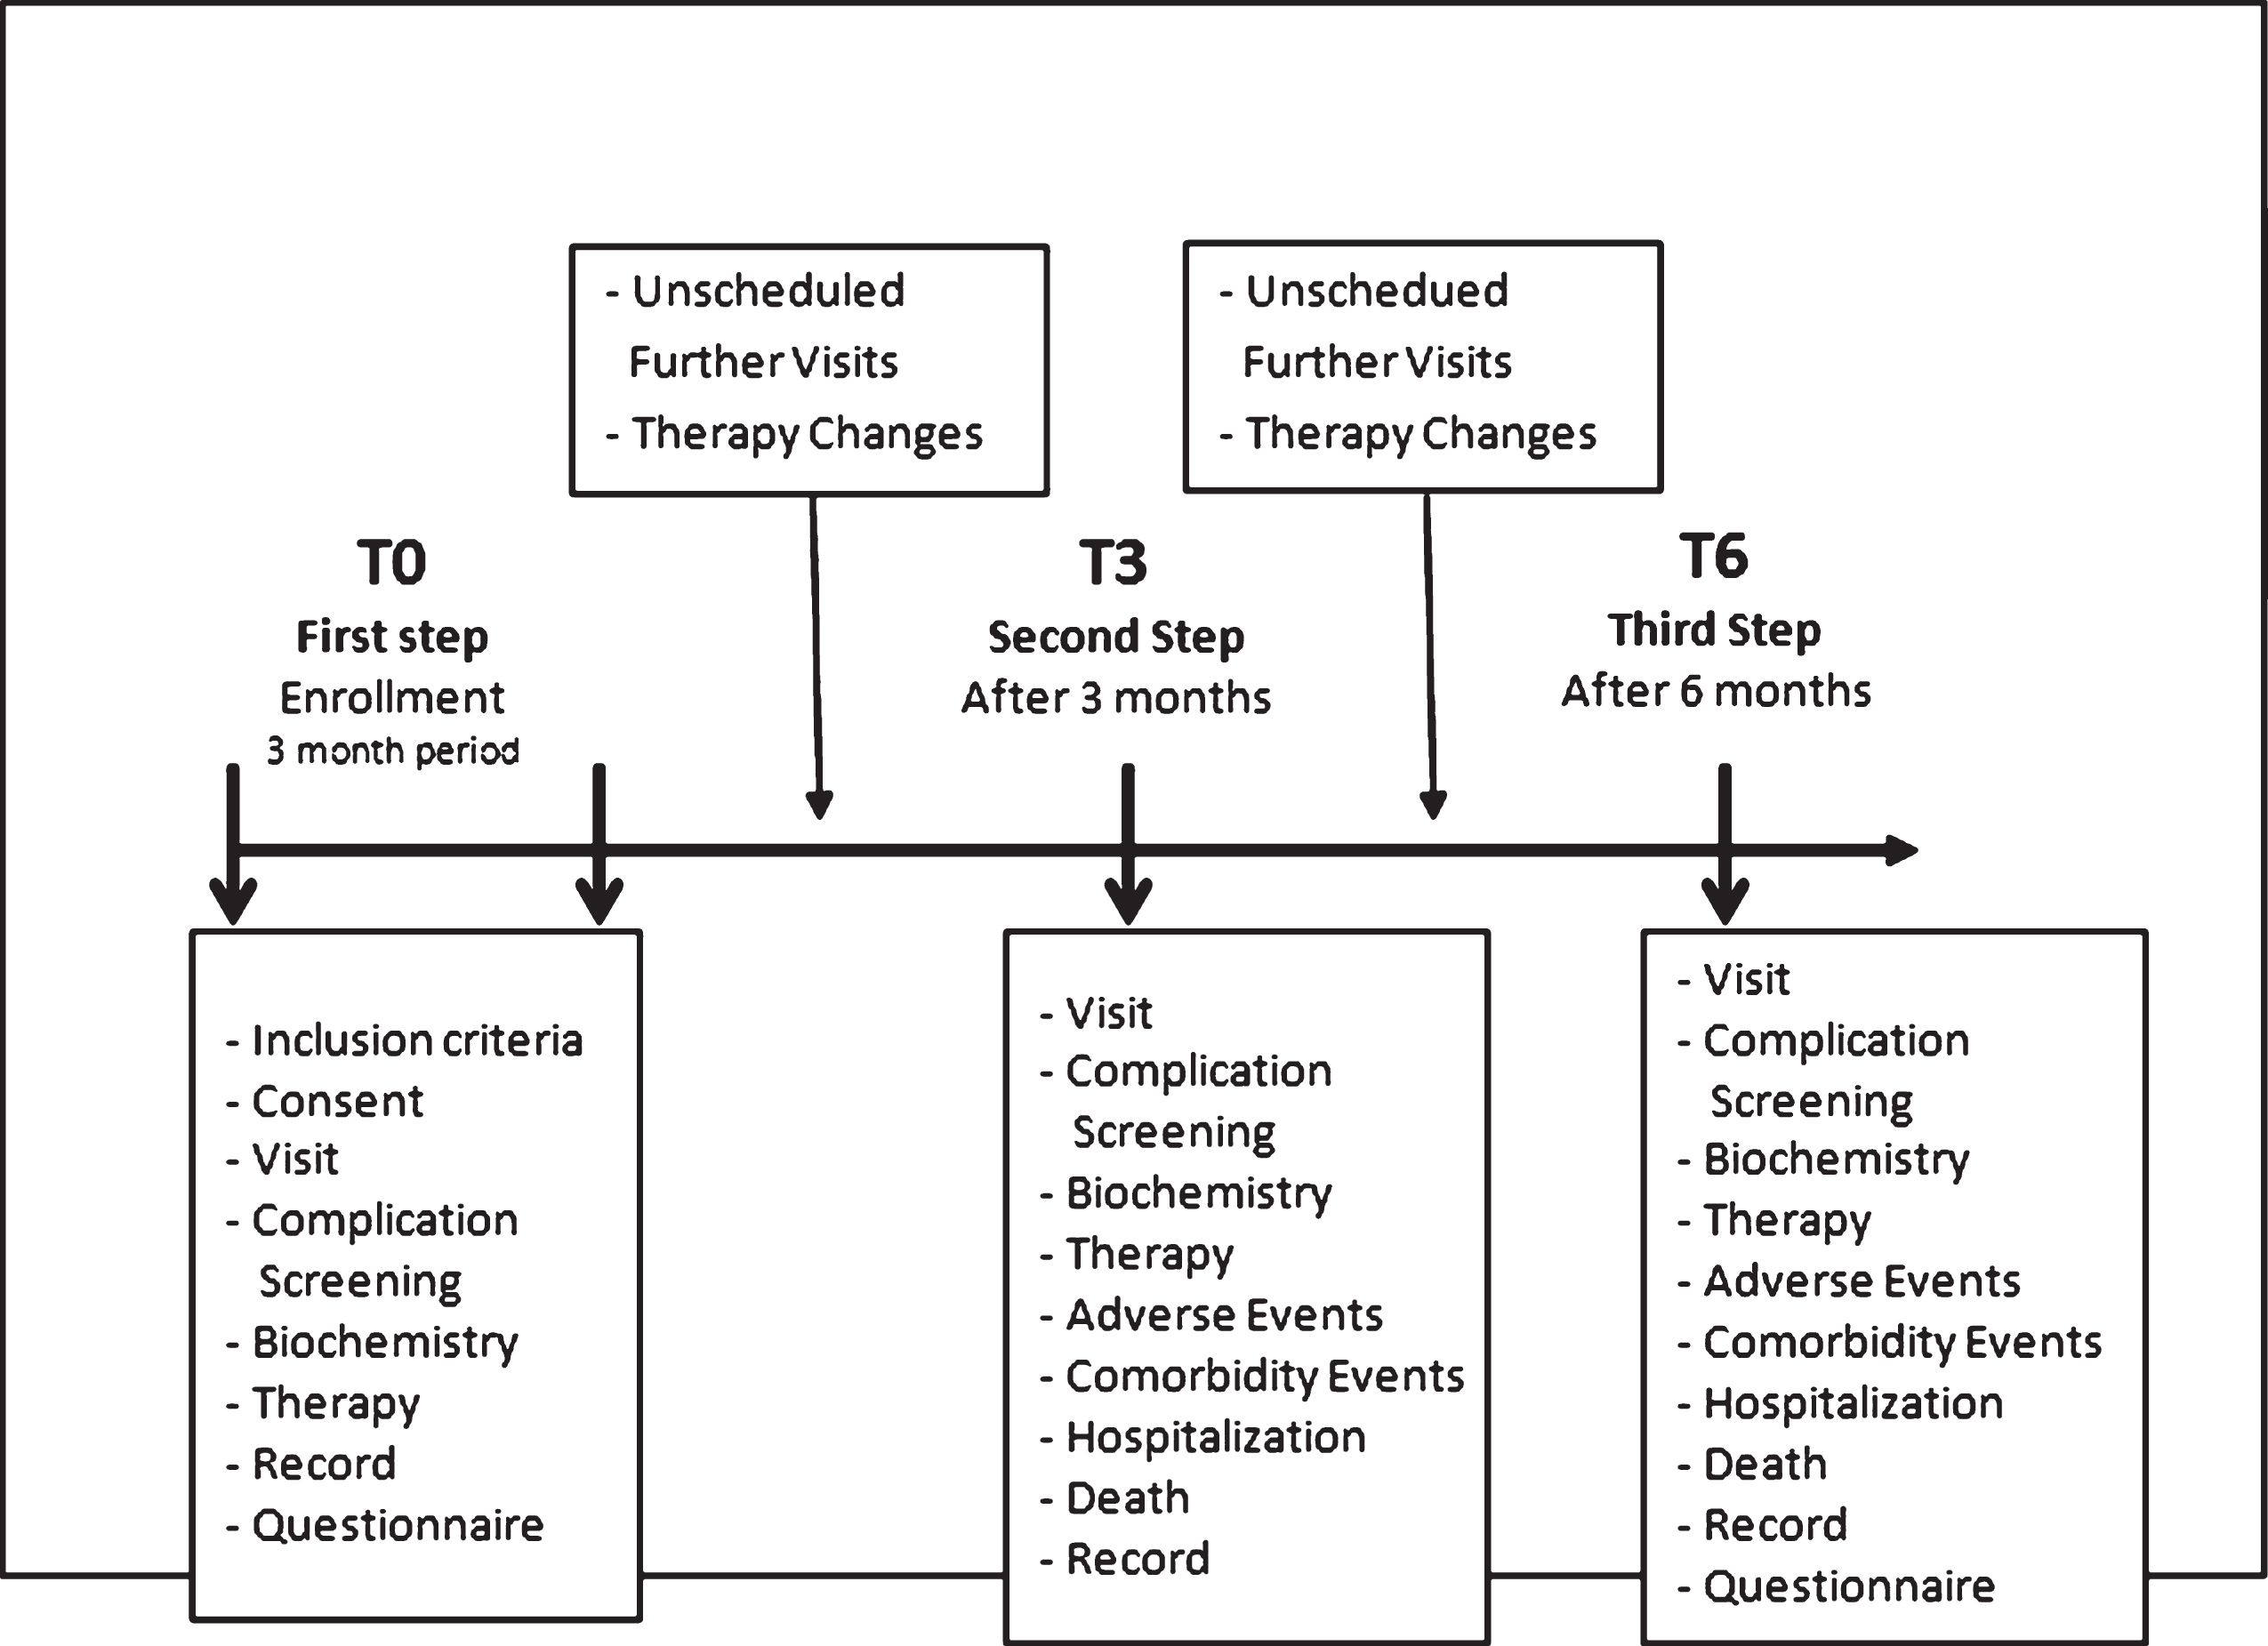
Three and six months after their first referral (coded as T3 and T6, respectively), all people were seen at their own DCUs (see Fig. 1).
At those selected time points the following data were recorded:
i) new laboratory test results,
ii) new clinical events and/or diabetes complications and eventually experienced side effects,
iii) treatment changes,
iv) unscheduled visits required to improve diabetes control and/or stop complications,
v) doctor’s answers to the above mentioned questionnaire (at 6 months only).
Fig.1
Schematic representation of the study protocol.
2.6Statistical analysis
Statistics made use of SPSS/SP software (Norusis Inc., IL, USA, 2004). For continuous variables (e.g. age, BMI, blood parameters, blood pressure, etc.) means, standard deviations (SD), least and top values, medians and quartiles were calculated; means±SDs were reported within the Results section. Qualitative and categorical parameters generated frequency tables (n, %) where percentages were calculated and missing data were excluded. Results were stratified by geographical areas and either the χ2 test or the one-way ANOVA and repeated measures ANOVA (rM-ANOVA) were used as deemed appropriate.
Before undergoing statistics, single records were verified for consistency to clean the database: specific queries were sent out to the originators and, in case of unsatisfactory replies, data were considered as “missing”. Out of the originally enrolled 2597 people, only 2536 (98.7%) were thus accepted for subsequent analysis and, further on, 2489 were accepted at T3 and 2430 at T6. The significance threshold was set at p = 0.05.
3Results
Baseline characteristics of the population under study have been already described in Table 1.
Moreover, as shown in Table 2, 976 people were taking a single drug at enrollment – either traditional (n = 969) (i.e. metformin, SUs, repaglinide, TZD and acarbose) or innovative (i.e. incretins; n = 12 only because of to the above mentioned strict Italian prescription policy).
Table 2
Comparison among drugs taken at referral and those prescribed by the diabetologists at the first visit (T –0) and after 6 moonths (T –6). Data available from all people (on both mono- and polytherapy) at different times are presented (p refers to the difference between T6 and T0)
| Drug | At referral | DCU –T0 | DCU –T6 | p |
| (n. 2536) | (n. 2489) | (n. 2430) | ||
| % | % | % | ||
| Metformin | 86.2 | 88.2 | 84.4 | 0.0358 |
| Glibenclamide | 20.9 | 17.0 | 15.0 | <0.05 |
| Glipizide | 0.4 | 0.4 | 0.4 | – |
| Gliclazide | 8.7 | 8.5 | 8.5 | 0.0296 |
| Glimepiride | 14.6 | 16.7 | 16.7 | <0.05 |
| Other SUs | 0.1 | 0.1 | 0.1 | – |
| Repaglinide | 11.0 | 13.4 | 13.6 | <0.0001 |
| Pioglitazone | 12.1 | 23.2 | 23.2 | <0.0001 |
| Acarbose | 3.2 | 4.5 | 5.3 | <0.001 |
| Exenatide | 1.3 | 2.9 | 2.9 | <0.0001 |
| Sitagliptin | 5.8 | 16.1 | 16.5 | <0.0001 |
| Vildagliptin | 3.1 | 6.9 | 7.1 | <0.0001 |
| Liraglutide | 2.1 | 4.1 | 4.1 | <0.0001 |
| Saxagliptin | 1.0 | 3.6 | 3.8 | <0.0001 |
| Other incretins | 0.1 | 0.1 | 0.1 | – |
| Insulin | – | 3.8 | 7.8 | – |
| DRUGS AGGREGATED IN MACRO-CLASSES | ||||
| Drug Class | At referral | DCU –T 0 | DCU –T6 | p |
| (n. 2536) | (n. 2489) | (n. 2430) | ||
| % | % | % | ||
| Metformin | 86.2 | 88.2 | 84.4 | 0.0382 |
| Sulfonylureas | 44.4 | 42.5 | 42.9 | <0.05 |
| Repaglinide | 11.0 | 13.4 | 13.6 | <0.0001 |
| Pioglitazone | 12.1 | 23.2 | 24.4 | <0.0001 |
| Acarbose | 3.2 | 4.5 | 5.3 | 0.0229 |
| Incretins | 13.4 | 33.5 | 36.3 | <0.0001 |
| Insulin | – | 3.8 | 7.8 | <0.01* |
Out of the 1513 people on multiple HAOIs, 10.1% (n = 153) were on innovative drugs combined to traditional ones, the others were on traditional drugs only. However, people recently diagnosed as having T2DM (n = 173) received their first HAOI prescription directly by the diabetologist: 87 were on metformin, the rest on a combination of metformin and incretins.
Tables 2 and 3 clearly show that in 71.8% people with HbA1c >7% diabetologists mostly changed treatment by slightly reducing secretagogues and, to a lesser extent, by increasing incretin utilization (from 13.4% to 33.5%; p < 0.001) and starting insulin (3.8%).
Table 3
Percentage of poorly controlled people undergoing treatment changes at baseline and within the end of the follow-up period
| Baseline | At the end of follow-up | |||
| (T 0 – 6 months) | ||||
| Unchanged | Changed | Unchanged | Changed | |
| Treatment | Treatment | Treatment | Treatment | |
| HbA1c >7% 100% people | 28.2% | 71.8% | ||
| HbA1c >7% 51.7% people | 56.7% | 43.3% | ||
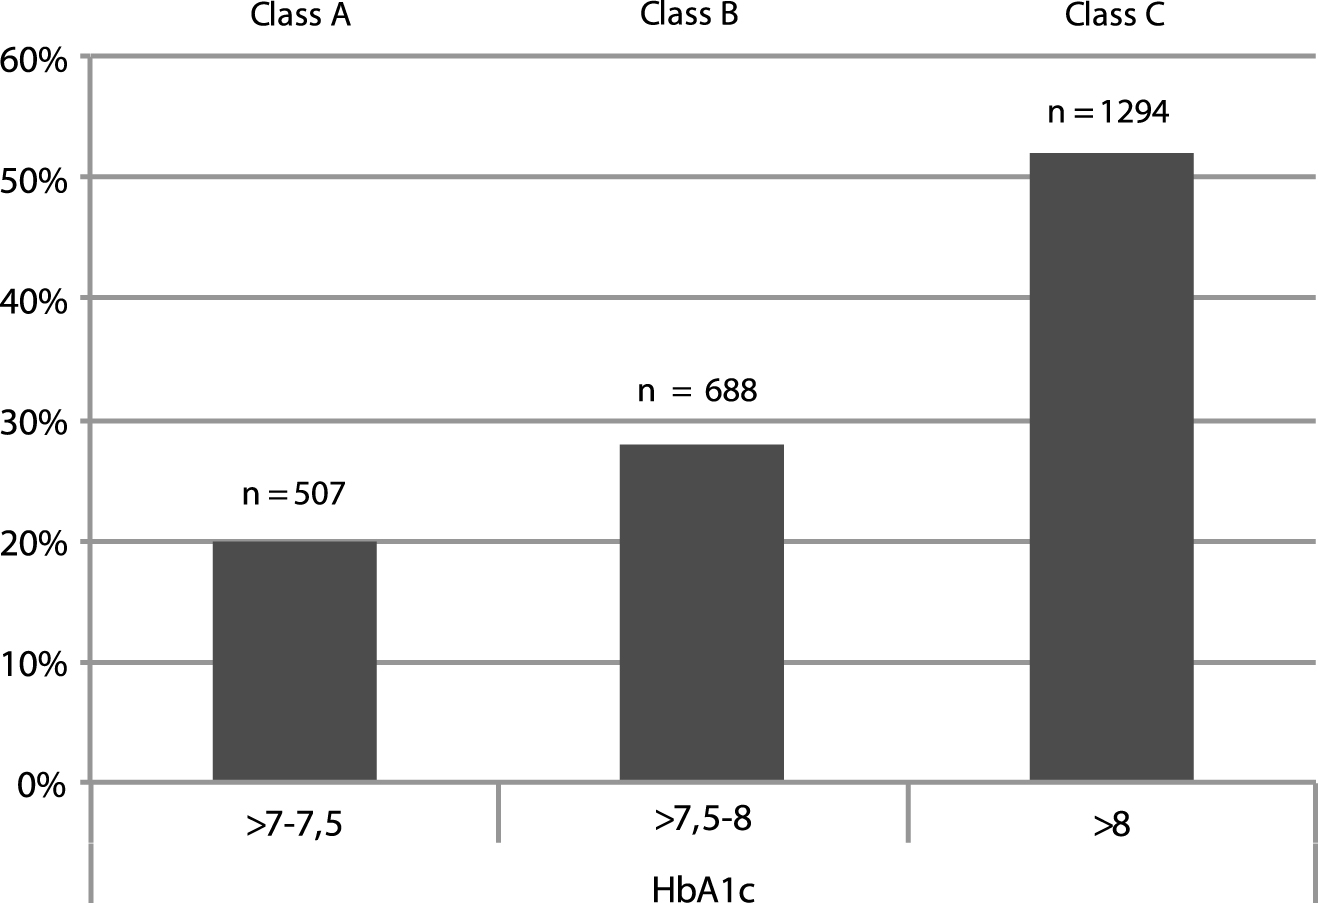
Figure 2 describes the distribution of people with T2DM at T0, according to three arbitrarily chosen ranges of HbA1c (Class A: >7–7.5%; Class B > 7.5–8%; Class C > 8%): the highest rate of CV and other diabetes related complications was found in class C.
Fig.2
Distribution of the absolute number (n) and percentage (%) of people with diabetes complications according to three arbitrarily chosen HbA1c ranges as observed at T0 (A, B, C). The highest rate of CV and other diabetes related complications was found in class C. See text for further details.
As shown in Table 4, however, class C was characteried by a high prescription rate of drugs known for their inner hypoglycemic or cardiotoxic risk (secretagogues) and for renal contraindications (secretagogues, metformin), as opposed to a rather low utilization of notoriously less hazardous incretins. Percent people undergoing no treatment changes increased with increasing HbA1c value.
Table 4
Distribution of the percentage (%) of people with DM complications, their age (mean+SD and range), diabetes duration (mean+SD and range), drug utilization (%), and diabetologist choice to refrain from changing treatment (%) according to three arbitrarily chosen baseline HbA1c ranges (A, B, C). Secreta-gogues were always the most prescribed drugs. See text for details. DR = Diabetic Retinopathy; DKD = Diabetic Kidney Disease; DN = Diabetic Neuropathy; DD = Diabetes duration; CV-C = Cardio-Vascular Complications
| HbA1c Class | Class A | Class B | Class C |
| CV-C % | 6 | 28 | 66 |
| RD % | 8 | 36 | 56 |
| DKD % | 0 | 47 | 53 |
| DN % | 8 | 32 | 60 |
| Age (years) | 50±8 (27–59) | 57±9 (44–65) | 66±8 (58–80) |
| DD (years) | 2.8±3 (1–6) | 4.2±4 (3–7) | 5.5±4 (5–9) |
| Metformin % | 89 | 83 | 78 |
| Sulfonilureas % | 48 | 44 | 40 |
| Repaglinide % | 4 | 12 | 11 |
| Glitazones % | 5 | 14 | 9 |
| Acarbose % | 2 | 4 | 3 |
| Incretins % | 7 | 15 | 11 |
| Insulin % | 0 | 13 | 87 |
| Unchanged treatment % | 37 | 46 | 61 |
3.1End of follow-up
Out of the 2489 people wit T2DM enrolled in the study, 2323 (93.3%) were available for analysis after 6 months. 180 unscheduled diabetologist visits and 480 visits by other specialists were recorded.
At the last visit (T6, Table 2) incretin and pioglitazone utilization significantly increased as compared to referral (36.3% vs 13.4% and 24.4% vs 12.1%, respectively, p < 0,0001), and SU utilization significantly, yet slightly decreased (42.9% vs 44.4%, p < 0.05). Metformin was prescribed at about the same rate all the time. 941 people were on one only drug, 1489 on more than one (n = 2 : 900 people; n = 3 : 570 people and n > 3 : 16 people). Still the most frequent association was metformin + glibenclamide (67%). A significant increase in insulin utilization was also observed at T6 as compared to T0 (7.8% vs 3.8%; p < 0.01).
At the 3-month follow-up time point no treatment changes occurred in 43.3% people with HbA1c >7% : 25% among them had cardio-vascular complications and their eGFR ranged 50 to 65 ml/min/1.73m2.
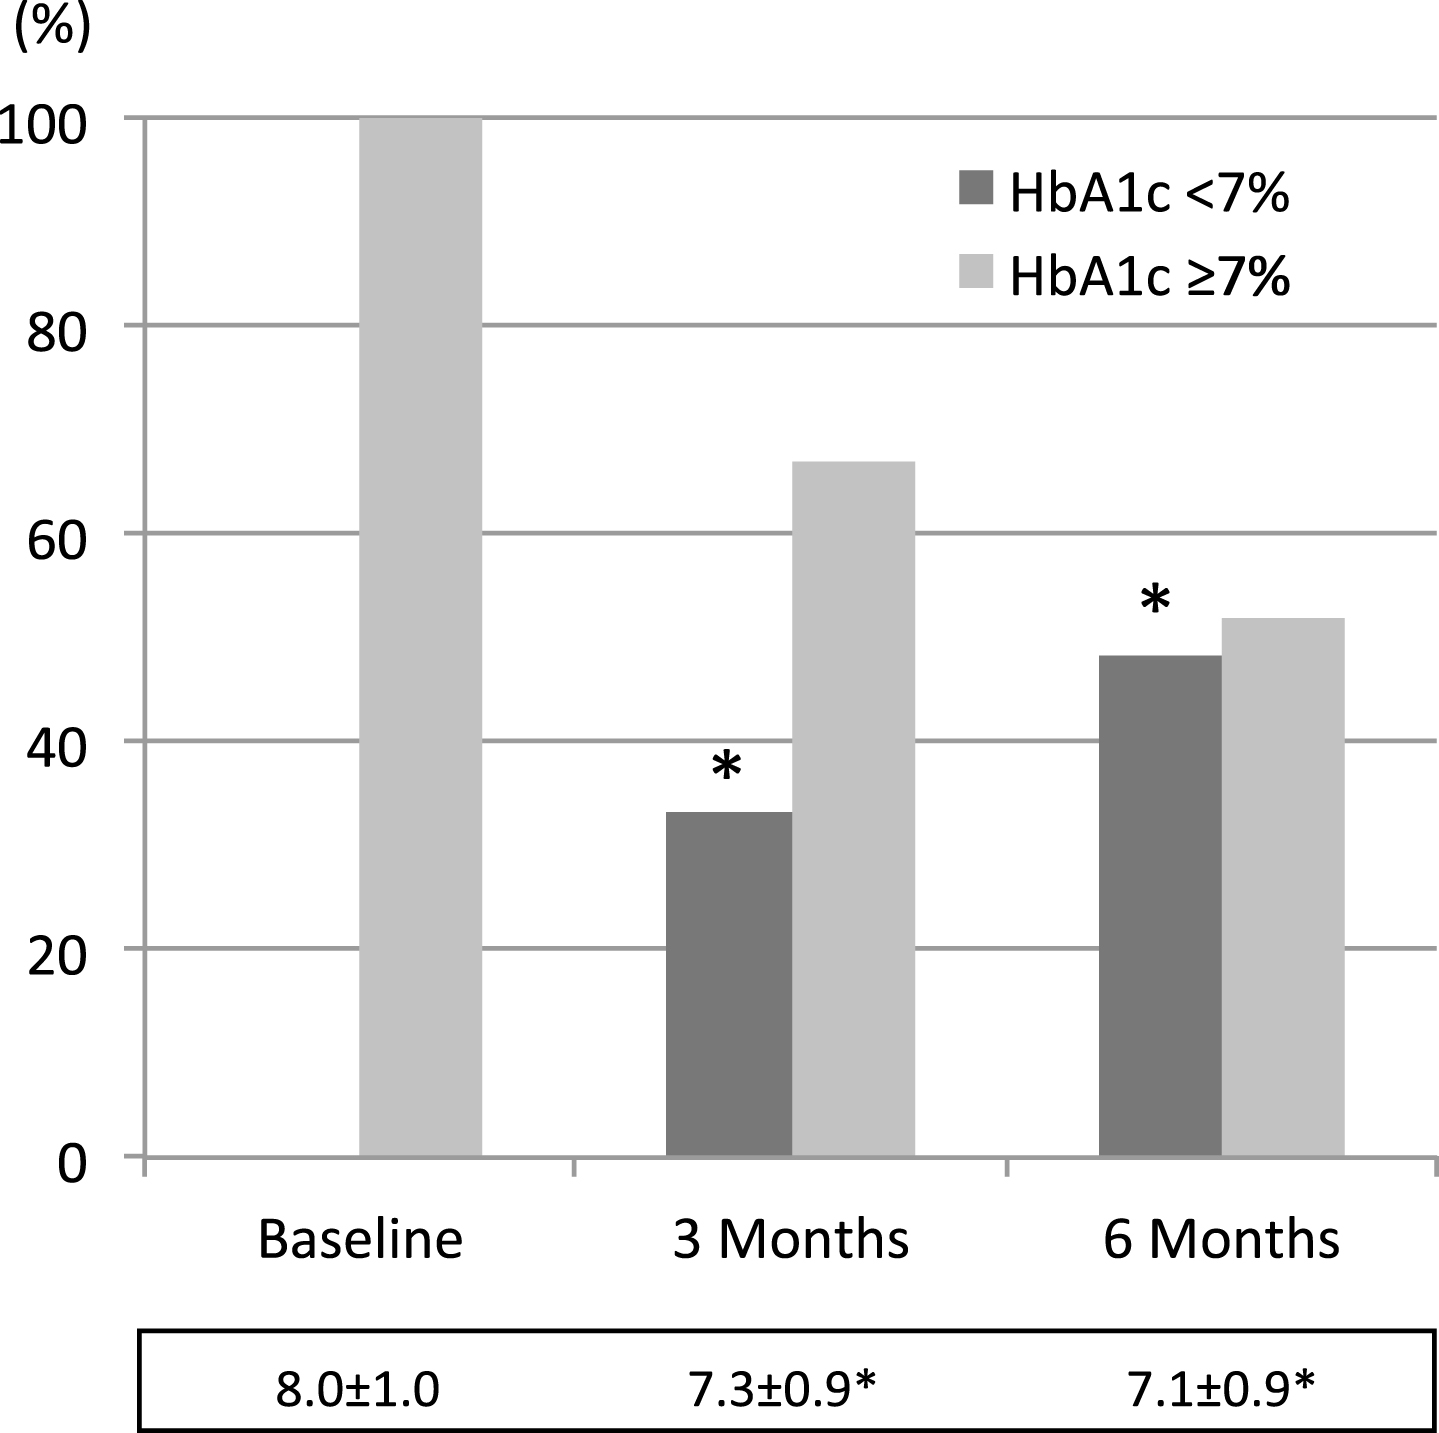
Then, as shown in Fig. 3, HbA1c levels went down to 7.3±0.9% and 7.1±0.9% (at 3 and 6 months, respectively p < 0.001) from baseline 8.0±1.0% levels, and reach lower than 7% in 33.1% people at 3 months and in 48.2% people at 6 months (p < 0.001).
Fig.3
Percent variation of the amount of people with HbA1c values above or below 7. Average values±SD at the different time points during follow-up are reported below each colums. * = <0.001 vs baseline (Mantel Haenszel test χ square for columns, and rM-ANOVA plus paired t test for M±SD).
83% people had their hypoglycemic treatment modified at least once during the 6-month period under investigation: 71.8% at T0, 5.7%, between T0 and T3, 27.3% at T3, 4.3% between T3 and T6 and 24.2% at T6, respectively.
Moreover, 91% treatment changes occurring during the study involved the same people already undergoing changes at T0.
3.2Diabetologists’ interpretation of poor glucose control
As clearly shown by Tables 5 and 6, clinicians most often explained high HbA1c levels by patients’ faults (careless lifestyle, poor compliance or drug discontinuation summing up to 72%) and, only to a lesser extent, to clinically relevant factors like secondary failure (32.2%), adverse events or other hyperglycemic drugs being associated (7.5%).
Table 5
Diabetologists’ subjective identification of reasons behind high HbA1c leves (pooled T0 –T6 data). (Multiple responses accepted for each person)
| Questionnaire: Areas of interest | Overall patients (N = 2418) | |
| N | % | |
| secondary failure | 779 | 32.2 |
| dosage reduction after adverse events | 106 | 4.4 |
| GP-handled treatment changes | 132 | 5.5 |
| careless lifestyle | 1269 | 52.5 |
| poor compliance | 371 | 15.3 |
| unexpected drug discontinuation | 104 | 4.3 |
| concurrent treatment hyperglycemic effects | 76 | 3.1 |
| no explanation | 107 | 4.4 |
| Other | 65 | 2.7 |
Table 6
Reasons put forward by diabetologists to explain why they kept therapy unchanged in 71.8% poorly controlled people at T0 and in 43.3% at T6. Data are expressed in % (more than one reason quoted per subject)
| Questionnaire: Therapeutic attitude section | Overall patients (N = 2323) | |
| N | % | |
| better to wait longer for good results | 1059 | 43.8 |
| adequate results for this particular patient | 336 | 13.9 |
| fear of hypoglycemia | 380 | 15.7 |
| fear of weight gain | 215 | 8.9 |
| subject on too many drugs already | 111 | 4.6 |
| unreliable subject | 464 | 19.2 |
| too low drug dosage inadvertently taken | 426 | 17.6 |
| previous unexpected drug discontinuation | 97 | 4.0 |
| better lifestyle expected | 1081 | 44.7 |
| concurrent interfering treatment withdrawal | 128 | 5.3 |
| improving glucose trend | 12 | 0.5 |
| Other | 138 | 5.7 |
Adverse events were observed in 15 people only during the entire study, all rated as mild to moderate, except for a single severe diarrhea attack experienced after acarbose administration. 13 people were hospitalized, however, among whom 7 for hypoglycemia and 6 for gastrointestinal disorders (see Table 7).
Table 7
Adverse events related to drug treatment as reported in 15 people
| DRUG | SYMPTOMS |
| Acarbose | flatulence, loss of appetite, diarrhea |
| Gliclazide | hypoglycemia |
| Glimepiride | hypoglycemia |
| Liraglutide | nausea |
| Pioglitazone | dyspepsia |
| Sitagliptin | gut discomfort, sweating, general discomfort, asthenia (1 mild) |
| Saxagliptin | itchy dermatitis |
Severe complications were also observed in 42 people (1.8%) during follow up, including hyperglycemic coma (n = 6), cardiovascular events [i.e. acute coronary syndrome (n = 5), TIA (n = 5), AMI (n = 3), heart failure (n = 3)], revascularization (n = 7) and foot ulcers (n = 4). Accidental traumas (n = 7) and infectious diseases (n = 5), also reported on, were not rated as related to treatment.
4Discussion
As stated by international [24, 32, 33] and national [31, 34] guidelines, T2DM should be addressed according to the “treat to target” principle after suitable lifestyle changes have been strongly and consistently suggested. In fact all DCUS participating in the study knew how difficult it was for T2DM patients to refrain from relying on medications only and spontaneously increasing drug dosage instead of sticking to the appropriate diet all the time. Therefore they used to monitor patient adherence to nutritional recommendations at all referrals and were very active in reinforcing the nutritional message along with trying to make their patientsexercise.
When coming to the medication issue, however, achieving adequate glycemic target is not easy for various reasons, including the complexity of patients and of care itself, hardly attainable targets, therapeutic inertia, poor adherence, and progressive beta-cell functional exhaustion [29, 35]. Therefore intensive and aggressive therapy meant at achieving more stringent glycemic targets is not indicated in all patients and cost-benefit balance has to take into consideration individual life expectancy, disease duration, hypoglycemic risk, chronic complications, as well as, comorbidity severity [32].
The first step is metformin, typically prescribed to all people with T2DM unless contraindicated [24, 31]. However, after a median of 45 months (with some variability) metformin alone is no longer enough [35].
The choice of the second therapeutic step depends on major pathophysiological mechanisms involved in a specific patient. In addition to beta-cell defects and insulin resistance, incretin defects and the increased kidney glucose handling threshold have been identified so far. The latter can be modified by glycosuria-enhancing sodium-glucose co-transporter inhibitors (SGLT2is), which, unfortunately, were not available in Italy at the time of the present study. The former, instead, could be easily treated at that time with incretin mimetic drugs (DPP4is and GLP1-RAs) which are very effective in modulating beta-cell secretion and inhibiting inappropriately high glucagon synthesis and release [36].
Incretins entail virtually no hypoglycemic risk per se, are accepted for use even in case of kidney disease and approved for CV safety Therefore they are more and more often used by diabetologists because of [37–40], as well as, being either neutral (DPP4is) or helpful (GLP1RAs) as for body weight [1]. However, despite providing an interpretation in line with that when dealing with reasons behind their own treatment choices, diabetologists contradicted themselves in everyday practice by going on with secretagogues at a relatively high rate during the 6-month follow-up in people failing to reach the target. The results of our study are in line with what reported in the literature, however, according to which failure to intensify treatment when expected is observed in 50–60% patients, which means in fact that only the 40–50% patients change their medication regimen and some 50% only among them have a chance to reach the target afterthat [41].
Secretagogues were always the most prescribed drugs. Indeed, around 50% of our patients undergoing one or more treatment changes reached the 7% HbA1c target. However, despite attaining unsatisfactory HbA1c levels, some 25% patients had no treatment changes made after their first DCU referral and were characterized by the highest HbA1c values and the highest frequency of complications (see Fig. 2 and Tables 3 and 4). In fact, poorly compensated patients involved in our study displayed the greatest insulin utilization rate – which kept low per se anyway (only 7.8%) – and the highest recourse to incretins, but quite surprisingly, as seen in Table 4, were still mostly prescribed secretagogues (sulfonylureas and repaglinide).
Of course insulin secretagogues, mainly SUs, representing the oldest class of oral diabetes medications, are highly effective in triggering insulin release and controlling glucose levels especially during the first years from diagnosis. However, they have been reported to carry along a much higher rate of secondary failure than other drugs mostly due to long-term exacerbation of islet dysfunction [42, 43]. In addition to that, their use is known to be associated with a slight, yet consistent, weight gain and puts patients at risk for serious hypoglycemic episodes [11, 44, 45]. The rather low cardiovascular safety profile, due to their inner mechanism involving the closure of cell membrane K-ATP channels, is another major aspect to consider with respect to this class of drugs and especially of SUs [46].
Anyway, the finding that 91% treatment changes occurring during the study involved the same people already undergoing changes at T0 somehow brings out how difficult it is for specialists to select the best possible treatment choices in certain cases.
Actually, when interpreting poor metabolic control, diabetologists were satisfied with an HbA1c higher than 7% in 13.9% cases based on individual considerations, but in all the others they identified three main areas of responsibility. One was mostly represented by naturally occurring secondary failure (32.2% cases), another depended on people with T2DM themselves (76.5% cases), mostly including either careless or temporarily worsened lifestyle (52.5% and 44.7%, respectively), unreliability (19.2%), poor compliance (15.3%), self- adjusted dosage after spontaneously occurring adverse effects (4.4%), and, finally, unexpected drug discontinuation (4.3%). The least represented area was clinician’s responsibility (10.6% cases), including mostly treatment changes autonomously decided by GPs (5.5%) and the inability to share multiple drug choices with T2DM patients(4.6%).
Overall all the above suggests that specialists tend to charge their “counterpart” with most of the responsibility for poor treatment results.
Fortunately enough, the rate of side effects and serious complications was quite low and similar to that recorded in our country’s general population [11, 35, 38].
Our study has some limitations. One is the relatively small number of people participating in the study. This can be overcome only by repeating it on a very large diabetic population. The other is given by possible differences among involved diabetologists in terms of clinical experience, which was in fact rather unlikely as (i) the results obtained were consistent with the overall data of AMD Annals Initiative [10, 11] and (ii) all diabetes specialists had been randomly assigned to our study but, having been collecting data for the AMD Annals Initiative for years, constituted a homogeneous group and were fully familiar with the present research task. Another limitation consisted of the expected influence of individual factors on drug choices, including care setting, doctor-patient relationship and economic constraints. With respect to the latter, anyway, all those factors per se cannot be standardized in any studies carried out in real life.
In conclusion, throughout the 6-month follow-up period involved diabetologists monitored their patients and gave them reasoned advice on required lifestyle adherence. In addition, they prescribed a significantly larger amount of safe and innovative drugs than before the first visit at their DCUs, but still displayed a conservative attitude towards diabetes treatment. In fact, traditional and well-consolidated therapies were mostly prescribed despite being endowed with a high risk for hypoglycemia, weight gain and adverse cardiovascular effects. Insulin prescription was less than expected too, in fact, and seemed to be mostly driven by HbA1c values higher than 8% (64 nmol/mol) rather than to a fully convinced adoption of the treat-to-target method.
According to our results, then, a series of mainly cultural barriers have to be highlighted eventually hampering metabolic control in several patients. Specific actions have to be devised and readily taken against too conservative treatment attitudes to improve diabetes outcomes in the upcoming years.
Better tools and greater resources allowing safer intensive glucose lowering strategies may also help specialists implement best practices [47].
Conflict of interest
None to report.
Financial disclosure
No financial support was received for this study. No Authors had any personal, academic or financial relationships that could influence their actions or financial involvement with an organization or entity with a financial interest in or financial conflict with the subject matter or materials discussed in the manuscript.
Acknowledgments
Authors are extremely grateful to participants with T2DM and health professionals who contributed to the study on a fully voluntary basis. This paper was prepared with the fundamental contribution of the members of the AMD START-DIAB Study Group.
FS and SG wrote the paper under AC’s supervision and all the components of the START-DIAB Study Group equally contributed to the revision and approved the final version of the manuscript.
References
[1] | Inzucchi SE , Bergenstal RM , Buse JB , et al. Management of hyperglycemia in type 2 diabetes, 2015: A patient-centered approach: Update to a position statement of the American Diabetes Association and the European Association for the Study of Diabetes. Diabetes Care. (2015) ;38: :140–9. |
[2] | Nathan DM , Buse JB , Davidson MB , et al. American Diabetes Association; European Association for Study of Diabetes. Medicalmanagement of hyperglycemia in type 2 diabetes: A consensusalgorithm for the initiation and adjustment of therapy: Aconsensus statement of the American Diabetes Association and the European Association for the Study of Diabetes. Diabetes Care. (2009) ;32: :193–203. |
[3] | Sackett D , Straus SE , Ricardson WS , et al. Evidence-Based Medicine. How to Practice and Teach EBM, Churchill Livingstone. (2000) . |
[4] | Palmer SC , Mavridis D , Nicolucci A , et al. Comparison of clinical outcomes and adverse events associated with glucose-lowering drugs in patients with type 2 diabetes: A meta-analysis. JAMA. (2016) ;316: :313–24. |
[5] | Cahn A , Raz I , Kleinman Y , Balicer R , et al. Clinical assessment of individualized glycemic goals in patients with type 2 diabetes: Formulation of an algorithm based on a survey among leading worldwide diabetologists. Diabetes Care. (2015) ;38: :2293–300. |
[6] | Zoungas S , Arima H , Gerstein HC , et al. Collaborators on Trials of Lowering Glucose (CONTROL) group. Effects of intensive glucose control on microvascular outcomes in patients with type 2 diabetes: A meta-analysis of individual participant data from randomised controlled trials. Lancet Diabetes Endocrinol. (2017) :pii: S2213-8587(17)30104-3. doi: 10.1016/S2213-8587(17)30104-3 |
[7] | Florez JC . Precision medicine in diabetes: Is it time? Diabetes Care (2016) ;39: :1085–8. |
[8] | President Barack Obama. State of the Union Address. (2015) . |
[9] | Rich SS , Cefalu WT . The impact of precision medicine in diabetes: A multidimensional perspective. Diabetes Care. (2016) ;39: :1854–7. |
[10] | Rossi MC , Candido R , Ceriello A , at al. Trends over 8 years in quality of diabetes care: Results of the AMD Annals continuous quality improvement initiative. Acta Diabetol. (2015) ;52: :557–71. |
[11] | Rossi MC , Lucisano G , Comaschi M , et al. AMD-QUASAR study group. Quality of diabetes care predicts the development of cardiovascular events: Results of the AMD-QUASAR study. Diabetes Care. (2011) ;34: :347–52. |
[12] | de Pablos-Velasco P , Parhofer KG , Bradley C , et al. Current level of glycaemic control and its associated factors in patients with type 2 diabetes across Europe: Data from the PANORAMA study. Clin Endocrinol (Oxf). (2014) ;80: :47–56. |
[13] | Alvarez Guisasola F , Mavros P , Nocea G , et al. Glycaemic control among patients with type 2 diabetes mellitus in seven European countries: Findings from the Real-Life Effectiveness and Care Patterns of Diabetes Management (RECAP-DM) study. Diabetes Obes Metab. (2008) ;10: (Suppl 1):8–15. |
[14] | Stone MA , Charpentier G , Doggen K , et al. GUIDANCE study group. Quality of care of people with type 2 diabetes in eight European countries: Findings from the Guideline Adherence to Enhance Care (GUIDANCE) study. Diabetes Care. (2013) ;36: :2628–38. |
[15] | Paul SK , Klein K , Thorsted BL , et al. Delay in treatment intensification increases the risks of cardiovascular events in patients with type 2 diabetes. Cardiovasc Diabetol. (2015) ;14: :100. doi: 10.1186/s12933-015-0260-x |
[16] | Watson L , Das R , Farquhar R , et al. Consequences of delaying treatment intensification in type 2 diabetes: Evidence from a UK database. Curr Med Res Opin. (2016) ;32: :1465–75. |
[17] | Khunti K , Wolden ML , Thorsted BL , et al. Clinical inertia in people with type 2 diabetes: A retrospective cohort study of more than 80,000 people. Diabetes Care. (2013) ;36: :3411–7. |
[18] | Ratanawongsa N , Crosson JC , Schillinger D , et al. Getting under the skin of clinical inertia in insulin initiation: The Translating Research Into Action for Diabetes (TRIAD) insulin starts project. Diabetes Educ. (2012) ;38: :94–100. |
[19] | Binrsheed A , Chenoweth I . Barriers that practitioners face when initiating insulin therapy in general practice settings and how they can be overcome. World J Diabetes. (2017) ;8: :28–39. Published online 2017 Jan 15. doi: 10.4239/wjd.v8.i1.28 |
[20] | Appropriatezza clinica, strutturale, tecnologica e operative per la prevenzione, diagnosi e terapia dell’obesitá e del diabete mellito. Quaderni del Ministero della Salute n. 10. Poligrafico dello Stato, Roma 2011. Accessed on January 31, 2017: http://www.quadernidellasalute.it/archivio-quaderni/10-luglio-agosto-2011.php |
[21] | Giorda C , Picariello R , Nada E , et al. The impact of adherence to screening guidelines and of diabetes clinics referral on morbidity and mortality in diabetes. PLoS One. (2012) ;7: :e33839. doi: 10.1371/journal.pone.0033839 |
[22] | Strollo F , Guarino G , Marino G , et al. Different prevalence of metabolic control and chronic complication rate according to the time of referral to a diabetes care unit in the elderly. Acta Diabetol. (2014) ;51: :447–53. |
[23] | I Progetti della Rete di Ricerca AMD. http://www.aemmedi.it/pages/informazioni/i_progetti:_rete_di_ricerca/ |
[24] | American Diabetes Association. Standards of medical care indiabetes. Diabetes Care. (2014) ;37: (Suppl1):S11–S63. |
[25] | International Classification of Diseases, Ninth Revision, Clinical Modification (ICD-9-CM). National Center for Health Statistics. http://www.cdc.gov/nchs/icd/icd9cm.htm |
[26] | Levey AS , Stevens LA , Schmid CH , et al. CKD-EPI (Chronic Kidney Disease Epidemiology Collaboration). A new equation to estimate glomerular filtration rate. Ann Intern Med. (2009) ;150: :604–12. |
[27] | Gentile S , Ceriello A , Strollo F , On behalf of the AMD START DIAB Study Group. A multicenter italian survey on diabetes care units reveals a somewhat slow attitude in treatment guideline implementation: Are we dealing with therapeutic inertia? Diabetes Res Open J. (2016) ;2: :33–44. |
[28] | Ceriello A , Gallo M , Candido R , et al. Personalized therapy algorithms for type 2 diabetes: A phenotype-based approach. Pharmgenomics Pers Med. (2014) ;7: :129–36. |
[29] | Akalin S , Berntorp K , Ceriello A , et al. Global Task Force on Glycaemic Control. Intensive glucose therapy and clinical implications of recent data: A consensus statement from the Global Task Force on Glycaemic Control. Int J Clin Pract. (2009) ;63: :1421–5. |
[30] | ACC/AHA guidelines for the management of patients with acute myocardial infarction: A report of the American College of cardiology/American Heart Association Task Force on Practice Guidelines (Committee on Management of Acute Myocardial Infarction). J Am Coll Cardiol. (1996) ;28: :1328–419. |
[31] | Bruno G , De Micheli A , Frontoni S , Monge L . Società Italianadi Diabetologia-Associazione Medici Diabetologi (SID-AMD) Working group on the standards of care for diabetes. Highlights from“Italian standards of care for diabetes mellitus 2009-2010”. Nutr Metab Cardiovasc Dis. (2011) ;21: :302–14. |
[32] | Nathan DM , Buse JB , Davidson MB , et al. American Diabetes Association; European Association for the Study of Diabetes. Medical management of hyperglycaemia in type 2 diabetes mellitus: A consensus algorithm for the initiation and adjustment of therapy: A consensus statement from the American Diabetes Association and the European Association for the Study of Diabetes.. Diabetologia. (2009) ;52: :17–30. |
[33] | American Association of Clinical Endocrinologists/the American College of Endocrinology and the Obesity Society. Clinical practice guidelines for healthy eating for the prevention and treatment of metabolic and endocrine diseases in adults: Cosponsored by the American Association of Clinical Endocrinologists/the American College of Endocrinology and the Obesity Society: Executive summary. Endocr Pract. (2013) ;19: :875–87. |
[34] | AMD-SID. Standard italiani per la cura del diabete, (2011) . http://www.aemmedi.it/files/Lineeguida_Raccomandazioni/2011/AMD_SID_SIMMG_2011.pdf |
[35] | Russo TG , Giorda CB , Cercone S , et al. BetaDecline Study Group. Factors associated with beta-cell dysfunction in type 2 diabetes:The BETADECLINE study. PLoS One. (2014) ;9: :e109702. |
[36] | Holst JJ . Treatment of type 2 diabetes mellitus with agonists of the GLP-1 receptor or DPP-IV inhibitors. Expert Opin Emerg Drugs. (2004) ;9: :155–66. |
[37] | Gallo M , Mannucci E , De Cosmo S , et al. Algorithms forpersonalized therapy of type 2 diabetes: Results of a web-basedinternational survey. BMJ Open Diabetes Res Care. (2015) ;3: (1):e000109. doi: 10.1136/bmjdrc-2015-000109. eCollection 2015. |
[38] | De Cosmo S , Viazzi F , Pacilli A , et al. AMD-Annals Study Group. Achievement of therapeutic targets in patients with diabetes andchronic kidney disease: Insights from the Associazione MediciDiabetologi Annals initiative. Nephrol Dial Transplant. (2015) ;30: :1526–33. |
[39] | Scirica BM , Bhatt DL , Braunwald E , et al. SAVOR-TIMI 53 Steering Committee and Investigators. Saxagliptin and cardiovascular outcomes in patients with type 2 diabetes mellitus. N Engl J Med. (2013) ;369: :1317–26. |
[40] | Green JB , Bethel MA , Armstrong PW , et al. TECOS Study Group. Effect of sitagliptin on cardiovascular outcomes in type 2 diabetes. N Engl J Med. (2015) ;373: :232–42. |
[41] | Del Prato S , Felton AM , Munro N , et al. Global Partnership for Effective Diabetes Managemen. Improving glucose management: Ten steps to get more patients with type 2 diabetes to glycaemic goal. Int J Clin Pract. (2005) ;59: :1345–55. |
[42] | Takahashi A , Nagashima K , Hamasaki A , et al. Sulfonylurea and glinide reduce insulin content, functional expression of K(ATP) channels, and accelerate apoptotic beta-cell death in the chronic phase. Diabetes Res Clin Pract. (2007) ;77: :343–50. |
[43] | Kahn SE , Haffner SM , Heise MA , et al. ADOPT Study Group. Glycemic durability of rosiglitazone, metformin, or glyburide monotherapy. N Engl J Med. (2006) ;355: :2427–43. |
[44] | Giorda CB , Ozzello A , Gentile S , et al. HYPOS-1 Study Group of AMD. Incidence and risk factors for severe and symptomatic hypoglycemia in type 1 diabetes. Results of the HYPOS-1 study. Acta Diabetol. (2015) ;52: :845–53. |
[45] | DeFronzo RA . From the triumvirate to the ominous octet: A new paradigm for the treatment of type 2 diabetes mellitus. Diabetes. (2009) ;58: :773–95. |
[46] | Thulé PM , Umpierrez G . Sulfonylureas: A new look at old therapy. Curr Diab Rep. (2014) ;14: (4):473. doi: 10.1007/s11892-014-0473-5 |
[47] | Ceriello A , Gallo M , Armentano V , et al. Associazione Medici Diabetologi. Personalizing treatment in type 2 diabetes: A self-monitoring of blood glucose inclusive innovative approach. Diabetes Technol Ther. (2012) ;14: :373–8. |


