
How different is the country of Georgia in developing obesity? An international comparison from the OBEY-AD database
Abstract
BACKGROUND:
Childhood obesity represents a severe public health burden in both developed and newly industrialized countries.
OBJECTIVE:
The aim of our study was to analyze obesity predictors in Georgian children and to compare them between Georgia and Europe using a unique method replicated in every country involved in the study.
METHODS:
Three hundred and sixty children, 3–11 years, balanced by gender were enrolled. Each child was evaluated on the following parameters: anthropometrics, brand awareness, socio-economic status, food habits, and physical activity frequency.
RESULTS:
Lifestyle of Georgian children was significantly different from that of European ones: they watched much more TV and did less physical activity (p-value < 0.001, for both). Moreover, in Georgia, higher BMI was associated with higher IBAI score (p-value 0.05). Similarly, in Europe, we could observe a positive relationship (p-value 0.003) between BMI and IBAI score. However, no relationship was found between BMI and TV hours per day in Georgia (p-value 0.94), while longer time spent watching TV was related with higher BMI in European children (p-value < 0.001).
CONCLUSIONS:
It is crucial to better analyze the obesity predictors in the country of Georgia, presenting with peculiarities related to its own history, culture, and tradition.
1Introduction
Overweight and obesity represent a severe public health burden, since they are associated with increased morbidity and mortality [1]. The measure most often employed to identify overweight/obese subjects is Body Mass Index (BMI), which is generally considered a good predictor of overall adiposity. According with WHO standards, cut-offs for overweight and obesity are represented by BMI values (for adults) greater than, or equal to, 25 and 30, respectively [1]. However, fat distribution varies between populations, and this may affect BMI accuracy. For this reason, for certain populations (e.g. Asian), it has been identified lower cut-offs for overweight and obesity to account for different body composition [2].
Despite such differences in cut-offs employed, it is well-known that an increased BMI results in an higher risk of developing non-communicable diseases (e.g., cardiovascular and metabolic diseases) [3], as well as psychosocial problems [4]. One of the most important factors predicting weight gain (and, consequently, increase of BMI) is represented by a shift in energy balance [5], characterized by the adoption of sedentary behaviors together with an increased energy intake. Such increase in energy intake is mainly due to the great availability of energy-dense, nutrient-poor, food products. This shift in energy balance is the result of a “nutrition transition” [6] which is nowadays affecting newly industrialized countries. Undisputedly, such nutrition transition have improved eating habits (e.g. food safety) of population living in these countries, but it has had also a negative adverse effect: a dramatic increase of obesity prevalence (due to lifestyle Westernization that leads to sedentary behaviors and makes calorically-dense food, such as fast food, widely available) [7].
Such increased obesity prevalence involves both adults and children. Together with adulthood obesity, also childhood obesity have become a severe public health problem, with more than 40 million of overweight children under the age of 5, in 2010 [1]. Childhood obesity is concerning because studies agree in stating that obese children are more likely to be obese adults and to develop early metabolic and cardiovascular impairments [8]. Pediatric obesity rates slightly differ according with geographic area, and the Western countries are the most severely affected by such epidemic [9].
Obesity rates in children living in Georgian Republic are similar to that reported from other countries worldwide [10]. Moreover, a study on Georgian schoolchildren has highlighted a poor knowledge about healthy eating habits, and level of physical activity below to that recommended from WHO [11]. Considering the worryingly prevalence of overweight and obesity among children in Georgia, the socio-cultural specificities of this country, and the lack of studies on children living in such geographical area, the aim of our study was to analyze predictors of obesity and overweight in Georgian children, and to compare these predictors between Georgia and Europe, using a unique method replicated in every country involved in the study. Furthermore, we aimed to identify the primary targets for prevention policies against childhood obesity epidemic.
2Material and methods
2.1Study population
The OBEY-AD (Obesogeneicity of gadgets marketed with snacks) is an international study conducted in school facilities of different countries worldwide. For the purpose of the present study, 360 children (aged 3–11 years, balanced by gender) from Georgia and European countries (France 60, Germany 60, UK 60, Italy 60 and Georgia 120) were considered. Children were enrolled in school settings located in metropolitan areas of the countries involved in the study: Paris (France), London (United Kingdom), Hamburg (Germany), Trieste (Italy), and Tbilisi (Georgia).
Children with cognitive disorders or metabolic diseases were excluded. Parents were asked to provide informed consent, before their children participation in the study. Participants treatment followed the guidelines and ethics provided by the American Psychological Association (APA) [12]. Appropriate permission was obtained by the Institutional Review Boards.
2.2Study design
Data were derived by the baseline assessment of the OBEY-AD study [13], when parents were interviewed using a structured questionnaire and basic anthropometric measurements of the child were taken. In particular, every child was evaluated on the following parameters: anthropometrics, brand awareness, food habits, physical activity frequency, and socio economic status.
2.3Anthropometrics
Children were weighed and measured in light clothing and without shoes using a body meter and an electronic stand-up balance scale. Measurements were taken with children’s back against the wall, paying attention to have the back of the feet touching the wall.
Weight and height were used to calculate BMI. Children were considered to be overweight/obese with a BMI≥85th and underweight with a BMI < 5th, according to CDC growth standards [14].
2.4Study questionnaire
A standard questionnaire was developed for the purpose of the study and it was adapted to local characteristics to account for regional peculiarities. Both international and local versions have been validated through pilot investigations, including test-retest methods and comparison with in-deep interviewing. The questionnaire given to children’s parents was divided in sections. The first part aimed at assessing family characteristics and anthropometrics (number of siblings, with whom the child lives, weight/height/physical activity hours of parents), socio-economic status (parents’ educational level and working status, number of rooms in the house), time spent watching TV (number of TV in the house, hours spent every day by the child watching TV). The next section assessed child eating habits, asking about meal frequency and food consumption (number of servings of fruits, vegetables, pasta and rice, fish, meet, soft drinks and sweets). The last part investigated child’s physical activity (frequency and hours spent doing physical activity).
Finally, brand awareness of the child was evaluated administering the IBAI. The IBAI is a validated questionnaire; it consists of 12 images of food brand logos on the market, including both international and country-specific products [15]. Children were asked to recognize the brand, match it to an image chosen from 4 different options, and to name the product represented. Brand Awareness Scores (IBAI-score) could range from a minimum of 0 to a maximum of 36. The IBAI questionnaire was adapted for every country and a linguistic validation was performed before the beginning of the study.
2.5Statistical analysis
Categorical data were reported as percentages (absolute number), continuous data as median (I, III quartile). Chi-square tests or Wilcoxon signed rank test were performed to evaluate significance of differences in factors distribution across Georgia and Europe.
The effect of factors affecting BMI were estimated considering an Ordinary Least Square model (OLS) on Georgian and European data.
Analyses were performed using the R System [16] and rms library [17].
3Results
Children’s age range was 3–11 years, with a median age of 6.5 years. By design, sample was balanced by gender (180 females and 180 males). Normal weight children were 233 (65%), underweight 20 (6%), overweight 66 (18%) and obese 41 (11%). Georgian children were more likely to be obese compared to European ones (p-value 0.014). Table 1 shows the main factors evaluated through the questionnaire, comparing Georgia to Europe (including children data from UK, Germany, France, and Italy). We did not find significant differences among food habits, except regarding the number of vegetables’ servings per day: European children ate vegetables more often than Georgian children (p-value < 0.001). Referring to time spent doing physical activity and watching TV, our results showed that Georgian children were significantly different from European ones: they watched much more TV and did less physical activity (32% of Georgian children never did physical activity, against 14% of European children).
Table 1
Sample characteristics. Data are percentages (absolute numbers) for categorical variables and median [I, III quartile] for continuous variables
| Georgia (n = 120) | Europe (n = 240) | P-value | ||
| Age | 6.50 [5.00; 9.00] | 6.50 [4.00; 9.00] | 0.115 | |
| Gender | Male | 50 (60) | 50 (120) | 1 |
| Child weight status (CDC) | Normal weight | 63 (76) | 65 (157) | 0.014 |
| Obese | 12 (14) | 11 (27) | ||
| Overweight | 24 (29) | 15 (37) | ||
| Underweight | 1 (1) | 8 (19) | ||
| Mother’s BMI | 21.77 [19.58; 23.88] | 23.12 [20.90; 26.83] | <0.001 | |
| Father’s BMI | 26.15 [23.74; 28.73] | 25.12 [22.81; 27.73] | 0.042 | |
| Number of sisters | 0 | 42 (51) | 55 (132) | 0.04 |
| 1 | 46 (55) | 33 (79) | ||
| 2 | 7 (8) | 10 (23) | ||
| >3 | 5 (6) | 2 (6) | ||
| Number of brothers | 0 | 46 (55) | 51 (123) | 0.0682 |
| 1 | 42 (50) | 40 (95) | ||
| 2 | 12 (14) | 8 (20) | ||
| >3 | 1 (1) | 1 (2) | ||
| TV viewing (hours/week) | 16.00 [11.00; 19.25] | 11.00 [6.50; 15.62] | <0.001 | |
| Physical Activity (moderate/intense) Hours/week | about half an hour | 8 (10) | 5 (12) | <0.001 |
| about an hour | 13 (16) | 18 (43) | ||
| about 2–3 hours | 25 (30) | 41 (99) | ||
| about 4–6 hours | 12 (15) | 18 (43) | ||
| more than 7 hours | 8 (10) | 4 (10) | ||
| none | 32 (39) | 14 (33) | ||
| Frequency of breakfast before school | 2–3 times per week | 2 (3) | 4 (10) | 0.171 |
| 3–4 times per week | 4 (5) | 6 (14) | ||
| Every day | 83 (99) | 85 (204) | ||
| Never | 10 (12) | 5 (12) | ||
| Daily fruit servings | 1 | 48 (57) | 41 (99) | 0.205 |
| 2 | 34 (41) | 30 (72) | ||
| 3 | 8 (10) | 18 (42) | ||
| 4 | 3 (4) | 3 (7) | ||
| More than 4 | 4 (5) | 3 (8) | ||
| none | 2 (3) | 5 (12) | ||
| Daily vegetable servings | 1 | 68 (82) | 40 (95) | <0.001 |
| 2 | 18 (22) | 34 (81) | ||
| 3 | 2 (2) | 14 (34) | ||
| 4 | 0 (0) | 3 (8) | ||
| More than 4 | 0 (0) | 4 (10) | ||
| none | 12 (14) | 5 (12) | ||
| Eating Fish (times/week) | ≥2 | 38 (35) | 43 (90) | 0.436 |
| Eating Meat (times/week) | 4 [3; 6] | 4 [3; 5] | 0.146 | |
| Mother’s job | Office worker | 19 (15) | 41 (61) | <0.001 |
| Manager | 78 (61) | 39 (57) | ||
| Other | 3 (2) | 4 (6) | ||
| Workman | 0 (0) | 16 (24) | ||
| Father’s job | Office worker | 19 (18) | 31 (53) | <0.001 |
| Manager | 78 (76) | 35 (61) | ||
| Other | 1 (1) | 3 (5) | ||
| Workman | 2 (2) | 31 (54) | ||
| Socio-Economic level | Low | 42 (50) | 42 (102) | 0.88 |
| Number of TVs in House | 2.00 [1.00; 3.00] | 2.00 [1.00; 3.00] | 0.326 | |
| Number of rooms in the house (other than kitchen and bathroom) | 3.00 [3.00; 4.00] | 4.00 [3.00; 5.00] | <0.001 | |
| IBAI score | 13.00 [8.00; 18.25] | 12.00 [7.00; 17.00] | 0.177 |
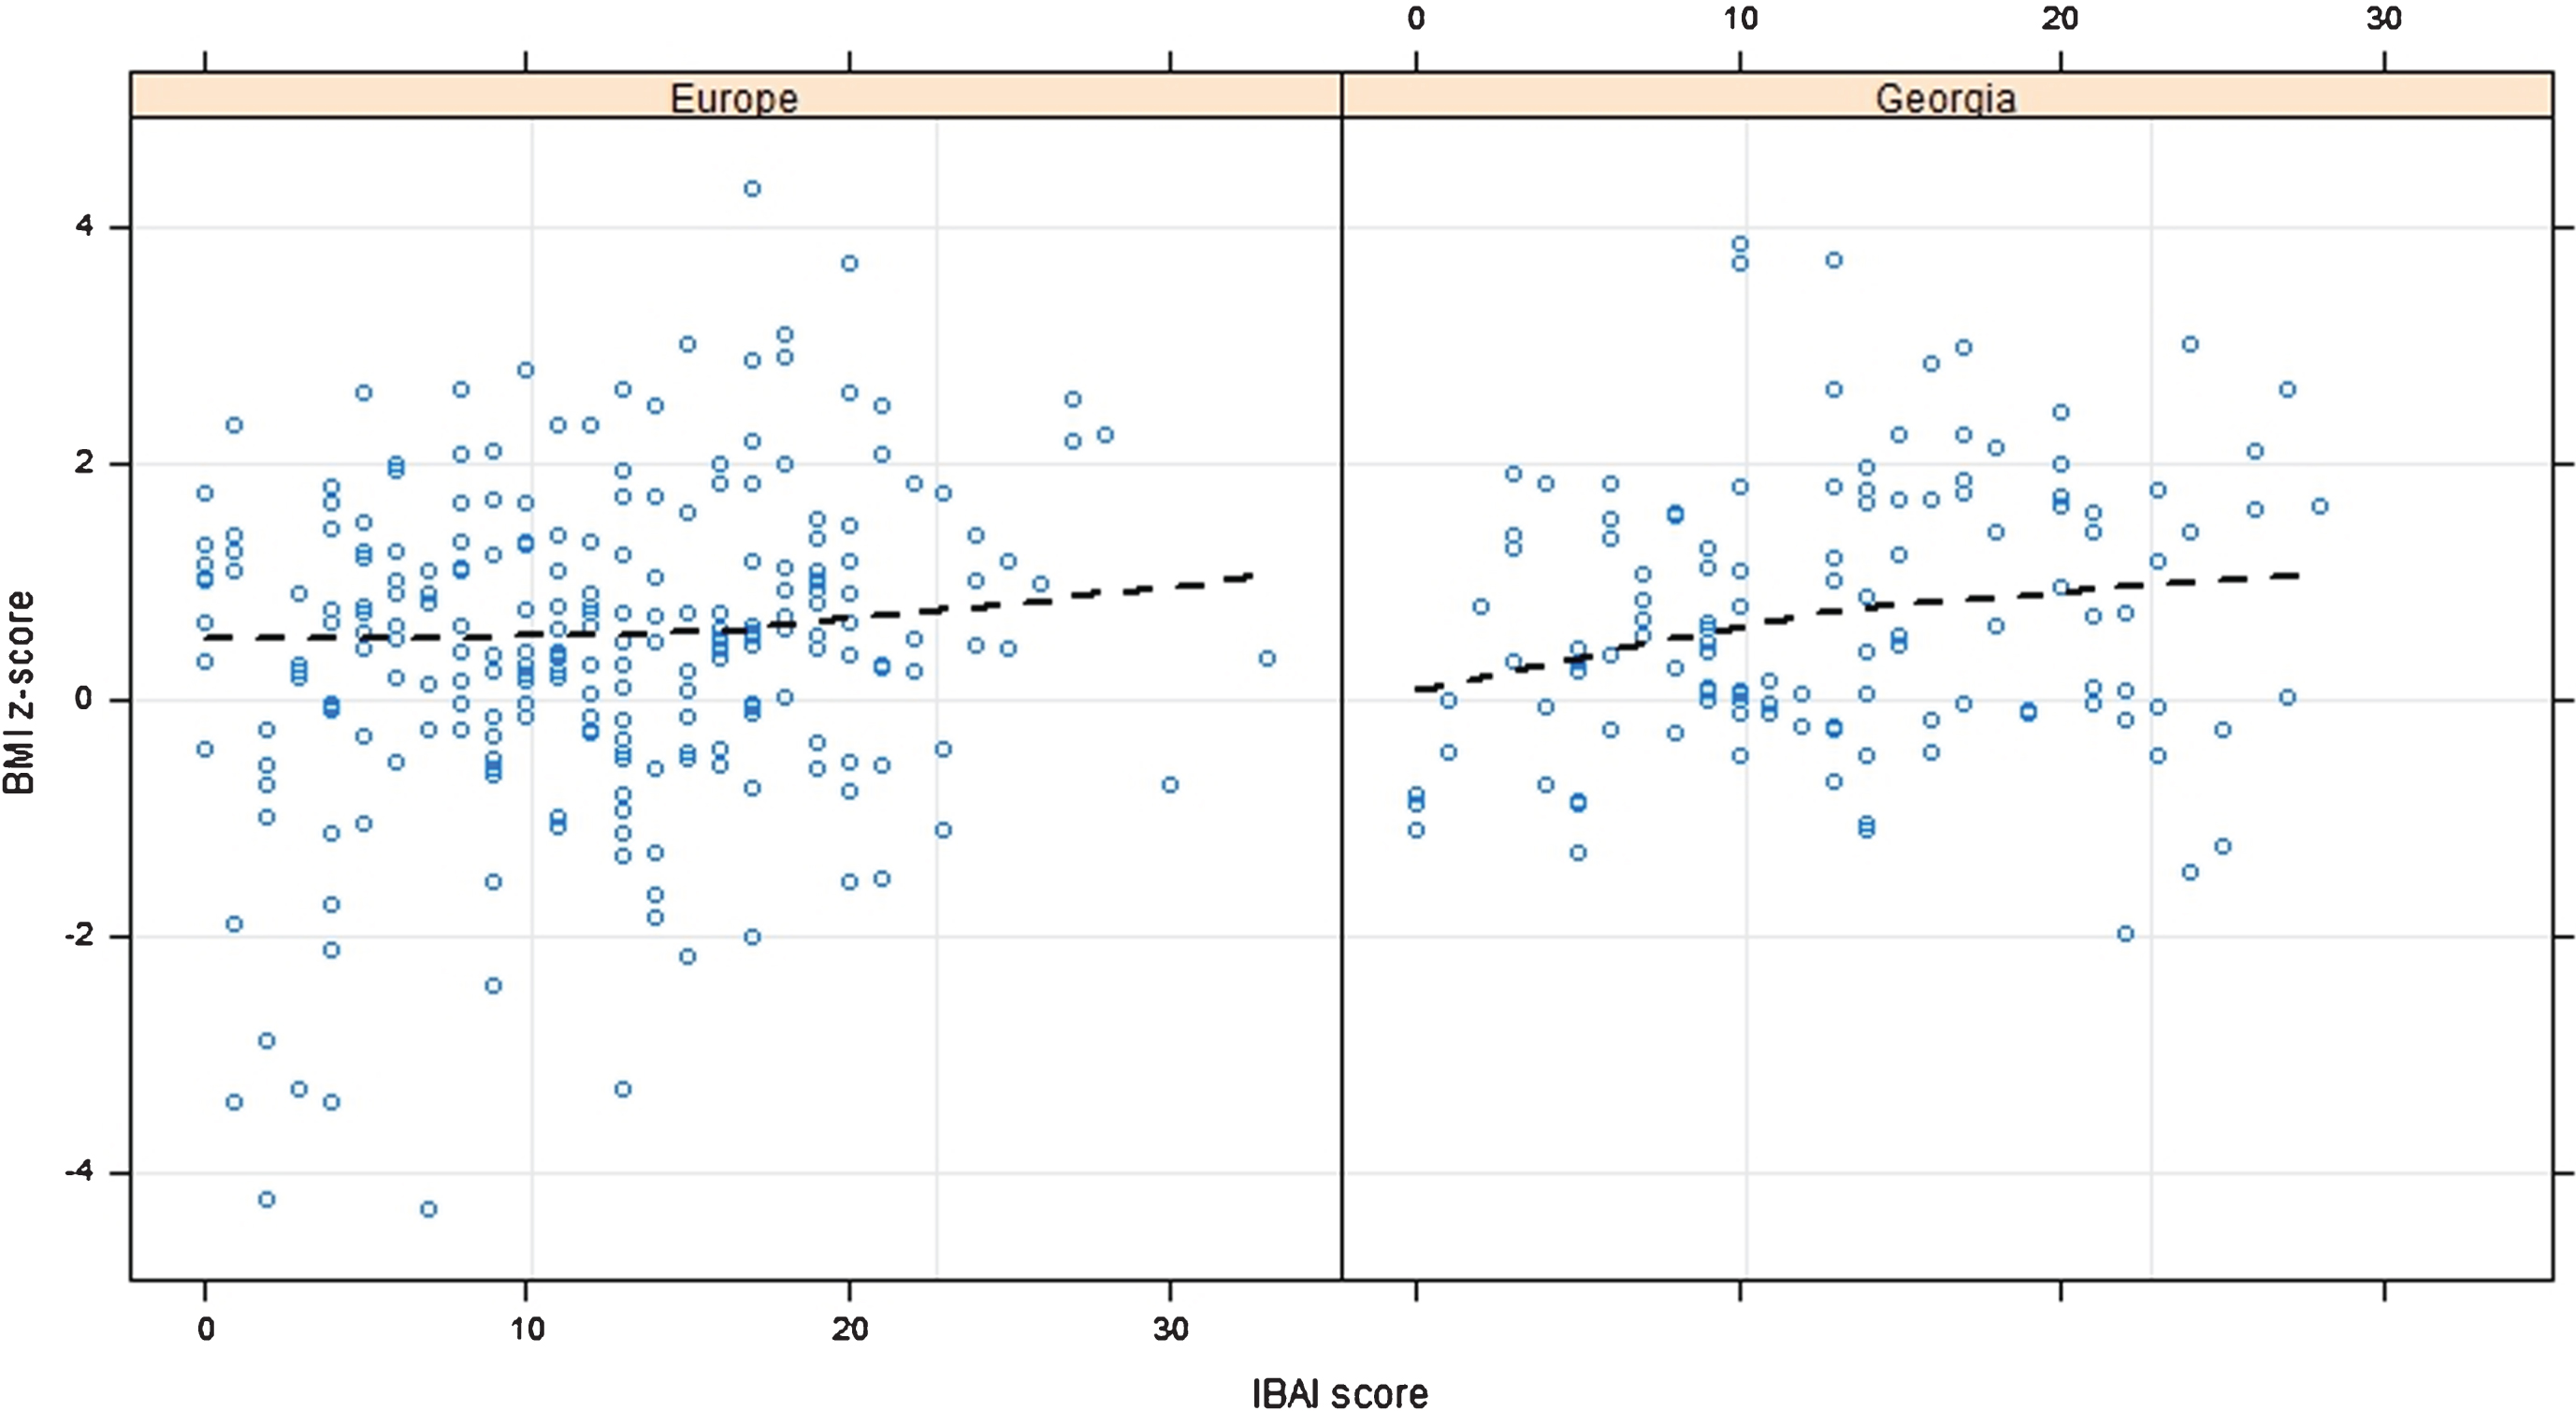
Figure 1 presents the relationship between BMI and IBAI score. The results demonstrated that, in Georgia, higher BMI was associated with higher IBAI score (p-value 0.05). Similarly, in Europe, we could observe a positive relationship (p-value 0.003) between BMI and IBAI score, starting from an IBAI score ranging from 10–15 points.
Fig.1
Effect of IBAI score on BMI CDC z-scores among Georgia and Europe. P-value 0.003 for Europe and 0.05 for Georgia.
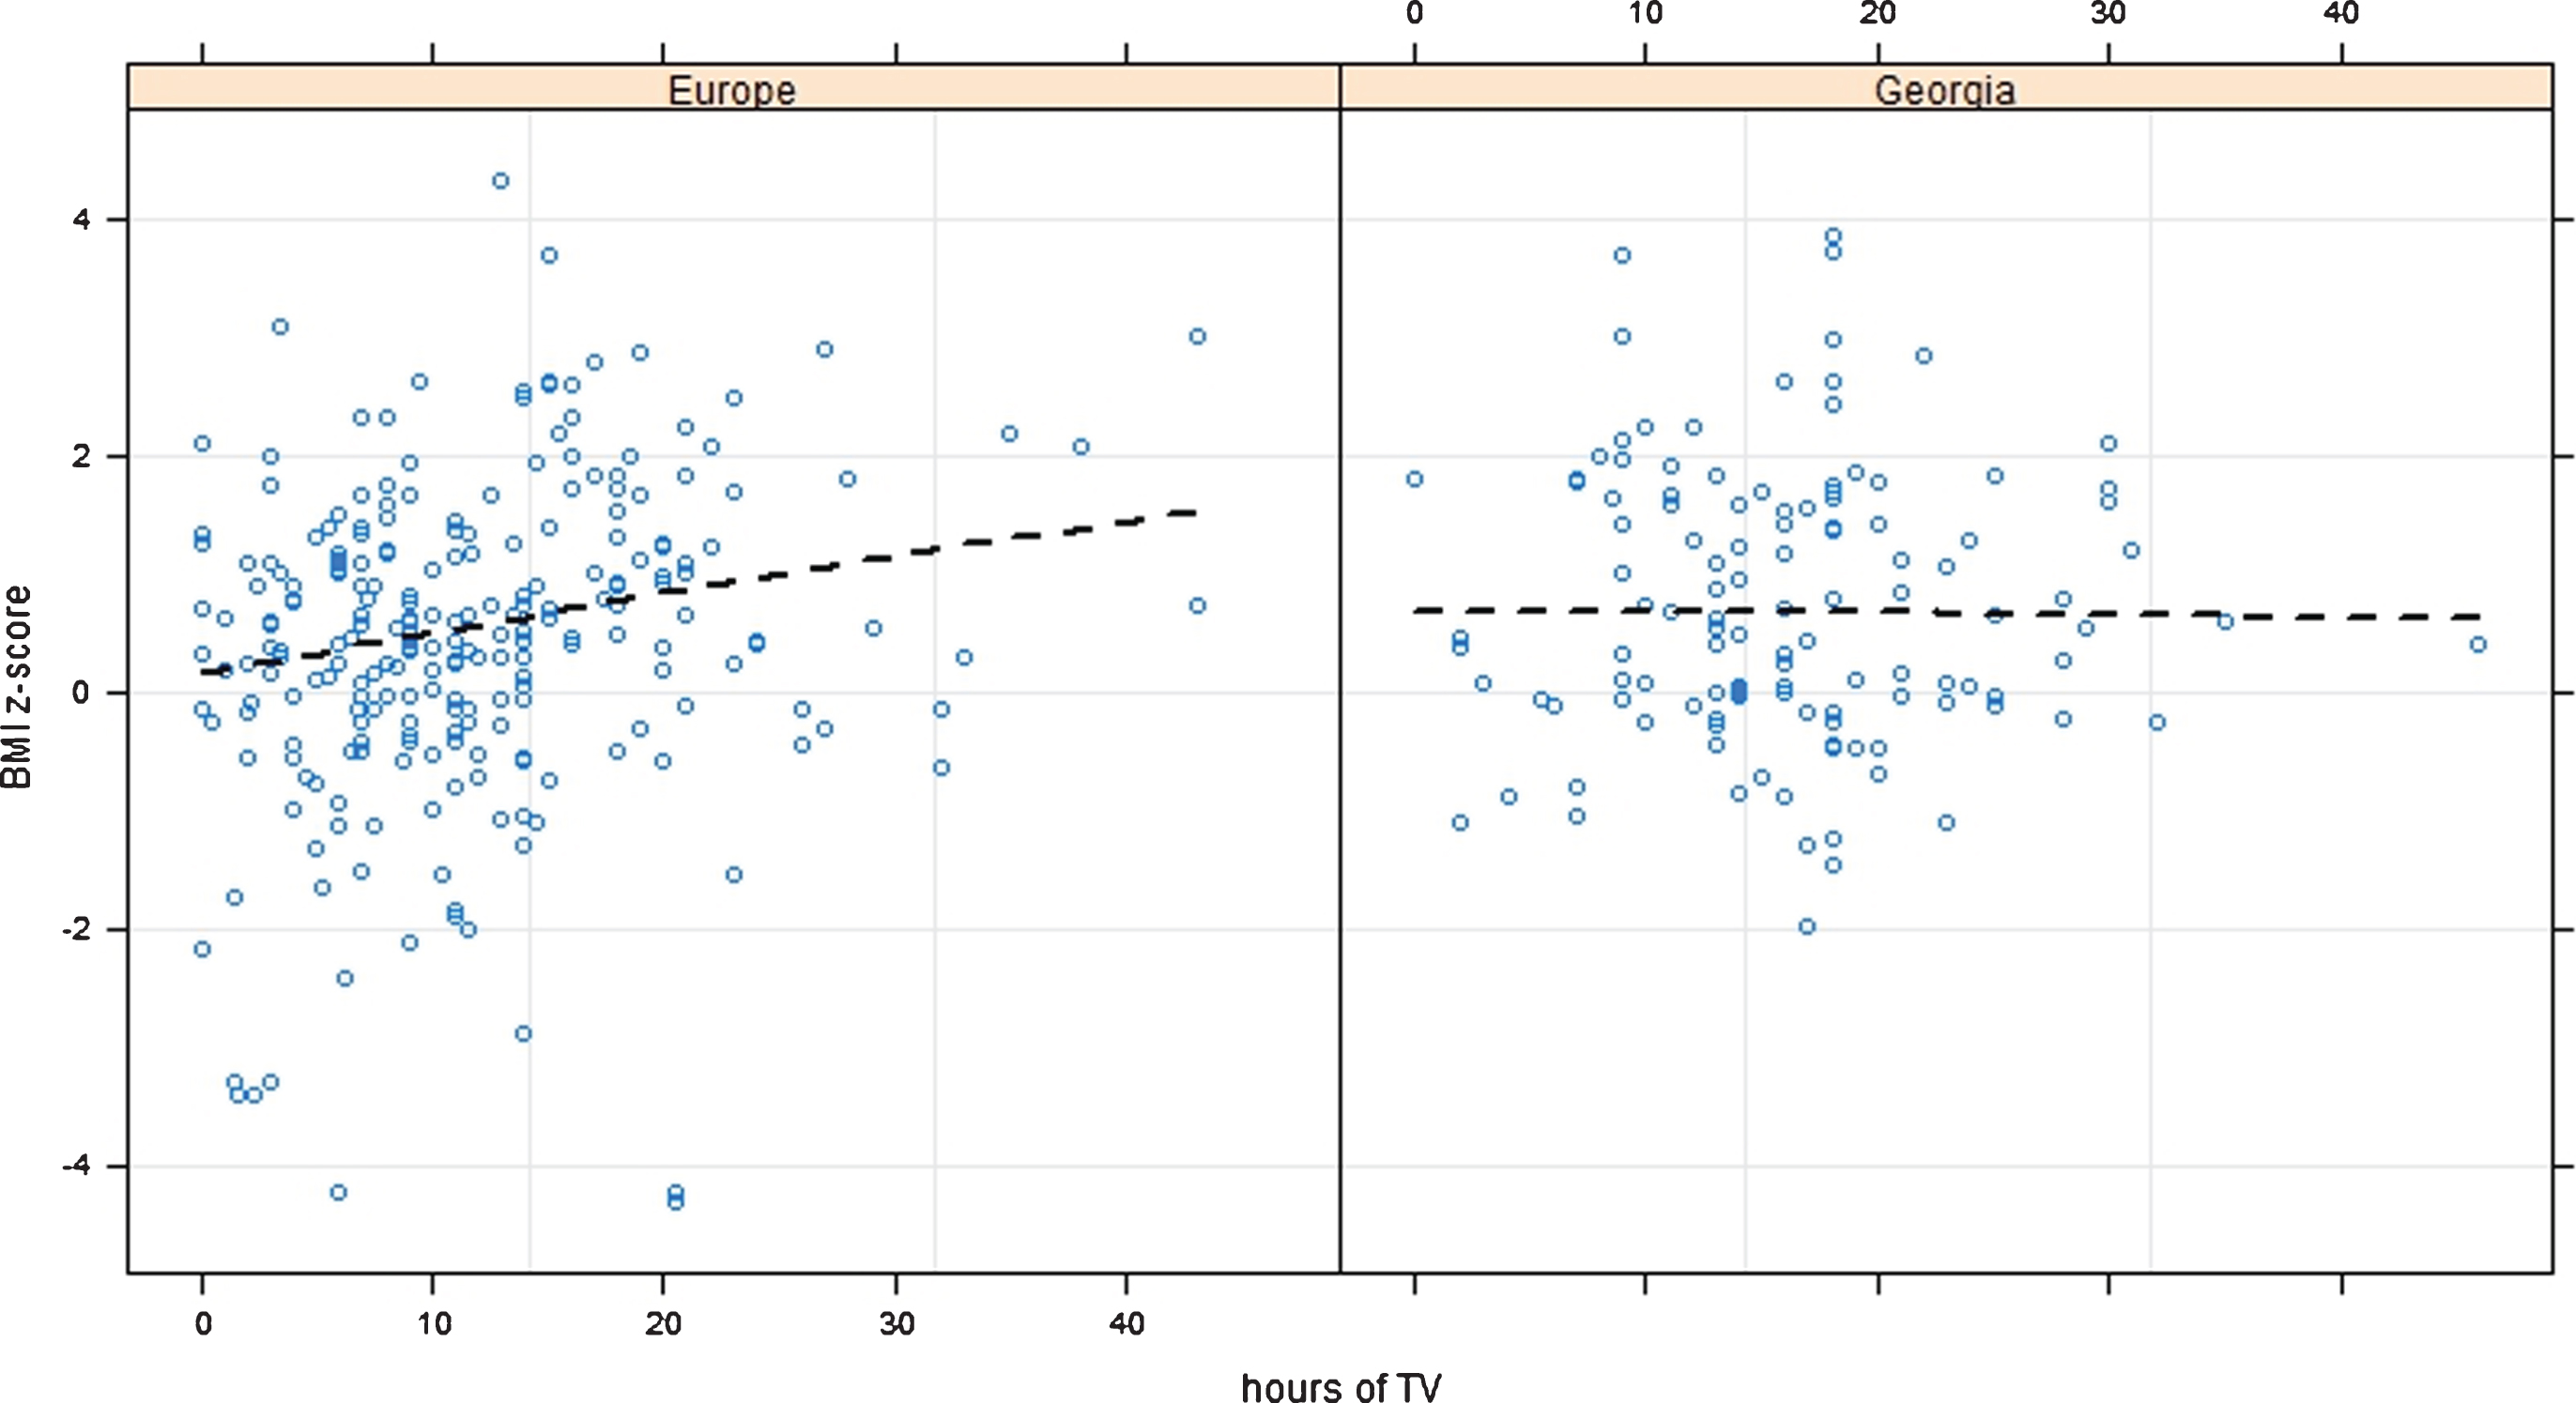
It was assessed also the relationship between BMI and TV viewing: Figure 2 shows no relationship between BMI and TV hours per day in Georgia (p-value 0.94), while longer time spent watching TV was related with BMI gain in European children (p-value < 0.001).
Fig.2
Effect of Time spent watching TV on BMI CDC z-scores among Georgia and Europe. P-value < 0.001 for Europe and 0.94 for Georgia.
4Discussion
Childhood obesity prevalence is worryingly worldwide, in both developed and newly industrialized countries [18]. It is well known that heterogeneous factors are involved in weight gain, and ethnicity has been hypothesized to be one of such obesity predictors. Several studies have focused on the prevalence of obesity among different ethnicities [19–21]. Undisputedly, genetics plays a key role in affecting obesity development among different ethnicities, but it is also essential to recognize the importance of environmental factors, especially lifestyle habits (e.g., sedentary behaviors, eating habits), in influencing the chance of obesity onset.
Our work represents a proof-of-concept study, providing first insights about overweight/obesity predictors in Georgian children and comparing such factors with European ones, through a unique study model.
The results of this investigation showed heterogeneity among the countries involved in the study for what concern lifestyle factors (especially regarding time spent watching TV and doing physical activity). This is reasonable, because Georgia presents distinctive history (it was part of the Soviet Union until the year 1991) compared with European countries enrolled in the study, and consequently it has its own culture and tradition, which inevitably influence lifestyle and food habits. However, we did not find significant differences regarding food consumption (except vegetables’ servings). No differences in food consumption are probably related to the facts that: Georgia is located in a geographical area nearby the European countries involved in the study; this country is experiencing a fast economic growth (following the severe economic collapse faced after the independence from the Soviet Union) which influences multiple factors, especially those regarding the improvement of population’s living conditions (including food habits); children were enrolled in a metropolitan area where living conditions are more similar (than those in rural areas) to living conditions and habits of children enrolled in European countries.
Focusing on non-traditional risk factors for obesity (Brand Awareness, measured through the IBAI instrument, and time spent watching TV), present results showed a significant association between IBAI score and BMI both in Georgian and European children, while a positive significant association between hours spent watching TV and BMI was reported only for European children. TV viewing has been hypothesized to result in weight gain for two main reasons: the reduction of physical activity in favor of the adoption of sedentary behaviors, and the fact that it seems to promote energy-dense, nutrient-poor food consumption [22, 23]. Several studies have shown that the longer the time spent watching TV, the greater the consumption of sweet and salty snacks, and of soft drinks [24, 25]. Moreover, TV viewing is strictly associated with brand awareness [26]: food industries target food advertising to children (food is well known to be the most sponsored product in TV channels aimed to children [27]), since children are considered a powerful tool able to influence families’ purchasing choices [28]. As results, the longer children watch TV the more they are exposed to food advertising, which have been shown to influence children’s (and families’) consumption patterns [29, 30]. However, hours spent watching TV were not found to be associated with BMI among Georgian children, although they spent much more time watching TV compared to European children. Such finding is remarkable, suggesting the need of better analyzing the contribution of non-traditional factors to childhood obesity onset in such country, presenting with peculiarities related to its own history, culture, and tradition.
Conflict of interest
The authors report no conflicts of interest. The authors alone are responsible for the content and writing of the paper.
Acknowledgments
Study was supported by an unrestricted grant of Prochild Onlus (www.prochild.eu).
References
[1] | WHO. Global Strategy on Diet, Physical Activity and Health 2012 [Available from: http://www.who.int/dietphysicalactivity/childhood/en/]. |
[2] | consultation We. Appropriate body-mass index for Asian populationsand its implications for policy and intervention strategies. The Lancet. (2004) ;363: (9403):157–63. |
[3] | Haffner SM . Relationship of metabolic risk factors and development of cardiovascular disease and diabetes. Obesity Reviews. Silver Spring. (2006) ;14: (3):121S–7S. |
[4] | Organisation WH. Preventing and managing the global epidemic. Report of a WHO consultation on obesity. World Health Organisation. (1998) . |
[5] | Romieu I , Dossus L , Barquera S , Blottière HM , Franks PW , Gunter M , et al. Energy balance and obesity: What are the main drivers? Cancer Causes & Control (2017) ;28: (3):247–58. |
[6] | Popkin BM , Adair LS , Ng SW . Global nutrition transition and the pandemic of obesity in developing countries. Nutrition Reviews. (2012) ;70: (1):3–21. |
[7] | Stillman S . Health and nutrition in Eastern Europe and the former Soviet Union during the decade of transition: A review of the literature. Economics & Human Biology. (2006) ;4: (1):104–46. |
[8] | WHO. Childhood overweight and obesity. (2010) . |
[9] | Ahrens W , Moreno LA , Pigeot I . Childhood obesity: Prevalence worldwide. Springer, editor. New York (2011) . |
[10] | UNICEF. Report of the 2009 Georgia National Nutrition Survey. (2010) . |
[11] | Kherkheulidze M , Kavlashvili N , Kandelaki E , Manjavidze T . Evaluation of nutritional knowledge of second grade school children and assessment of their dietary intake. Georgian Medical News. (2012) ;11: (212):58–64. |
[12] | Association AP . Ethical principles of psychologists and code of conduct. (2002) . |
[13] | Gregori D , Gulati A , Paramesh EC , Arockiacath P , Comoretto R , Paramesh H , et al. Cross-regional analysis of multiple factors associated with childhood obesity in India: A national or local challenge? The Indian Journal of Pediatrics (2014) ;81: (1):5–16. |
[14] | Kuczmarski RJ, Ogden CL, Grummer-Strawn LM, Flegal KM, Guo SS, Wei R, et al. CDC growth charts: United States. Advance data. (2000) ;(314):1–27. |
[15] | Vecchio MG , Ghidina M , Gulati A , Berchialla P , Paramesh EC , Gregori D . Measuring brand awareness as a component of eating habits in Indian children: The development of the IBAI questionnaire. The Indian Journal of Pediatrics. (2014) ;81: (1):23–9. |
[16] | R Development Core Team. R: A language and environment for statistical computing. Vienna: R Foundation for Statistical Computing. (2012) . |
[17] | Harrell FE Jr , Harrell MFE Jr , Hmisc D . Package ‘rms’. (2014) . |
[18] | de Onis M , Blössner M , Borghi E . Global prevalence and trends of overweight and obesity among preschool children. Am J Clin Nutr. (2010) ;92: (5):1257–64. |
[19] | Goran MI , Gower BA . Relation between visceral fat and disease risk in children and adolescents. Am J Clin Nutr. (1999) ;70: :149–56. |
[20] | Hedley AA , Ogden CL , Johnson CL , Carroll MD , Curtin LR , Flegal KM . Prevalence of overweight and obesity among US children, adolescents, and adults. JAMA. (2004) ;291: :2847–50. |
[21] | Madan A , Archambeau OG , Milsom VA , Goldman RL , Borckardt JJ , Grubaugh AL , et al. More than black and white: Differences in predictors of obesity among Native Hawaiian/Pacific Islanders and European Americans. Obesity. (2012) ;20: (6):1325–8. |
[22] | Caroli M , Argentieri L , Cardone M , Masi A . Role of television in childhood obesity prevention. International Journal of Obesity. (2004) ;28: (S3):S104. |
[23] | Coon K , Tucker K . Television and children’s consumption patterns. Minerva Pediatrica. (2002) ;54: (5):423–36. |
[24] | Utter J , Scragg R , Schaaf D . Associations between television viewing and consumption of commonly advertised foods among New Zealand children and young adolescents. Public Health Nutrition. (2006) ;9: (5):606–12. |
[25] | Wiecha JL , Peterson KE , Ludwig DS , Kim J , Sobol A , Gortmaker SL . When children eat what they watch: Impact of television viewing on dietary intake in youth. Archives of Pediatrics & Adolescent Medicine. (2006) ;160: (4):436–42. |
[26] | Vecchio MG , Berchialla P , Didier N , Cayul O , Valdenegro D , Ghidina M , et al. The IBAI instrument to assess brand awareness toward food in children: The Chile adaptation. The Open Obesity Journal. (2013) ;5: (1):30–35. |
[27] | Kelly B , Halford JC , Boyland EJ , Chapman K , Bautista-Castaño I , Berg C , et al. Television food advertising to children: A global perspective. American Journal of Public Health. (2010) ;100: (9):1730–6. |
[28] | Lee CK , Beatty SE . Family structure and influence in family decision making. Journal of Consumer Marketing. (2002) ;19: (1):24–41. |
[29] | Andreyeva T , Kelly IR , Harris JL . Exposure to food advertising on television: Associations with children’s fast food and soft drink consumption and obesity. Economics & Human Biology. (2011) ;9: (3):221–33. |
[30] | Halford JC , Gillespie J , Brown V , Pontin EE , Dovey TM . Effect of television advertisements for foods on food consumption in children. Appetite. (2004) ;42: (2):221–5. |


