
Iron deficiency anemia and nutritional status among women of childbearing age
Abstract
BACKGROUND:
Anemia is a condition in which the number of red blood cells is insufficient to meet the body’s physiologic needs. Iron deficiency is thought to be the most common cause of anemia, and its prevalence is an important health indicator.
OBJECTIVES:
The purpose of this study is to estimate the frequency of iron deficiency anemia among women of childbearing age and to identify the relationship between iron deficiency anemia and nutritional status.
METHODS:
Venous blood samples were collected from 140 women (20–26 years old). Hemato-biochemical analyses were conducted to assess nutritional status. Anamnesis, characteristics of menstruation and contraceptive use were collected through a survey. A statistical analysis was performed, and P values of less than 0.05 were considered statistically significant.
RESULTS:
The data revealed that of 140 women, 39 (28%) had anemia, 46.15% had iron deficiency anemia, 61.53% had microcytic hypochromic anemia and 99 (70.71%) had body mass index values within the normal range. Oral contraceptives were used by nearly 13% of respondents. Most (77.14%) of them reported a regular menstrual pattern.
CONCLUSION:
Special attention should be paid to avoiding physiological complications due to anemia during pregnancy.
1Introduction
Iron deficiency (ID) is the most common nutritional deficiency worldwide [1]; it affects individuals of all ages in both developed and developing countries [2].
It estimated that 25% of the world’s population has anemia, and approximately 50% of cases are due to ID [3].
Iron deficiency anemia (IDA) is characterized by a reduced hemoglobin (Hb) concentration [4].
IDA affects people of all ages, but is prevalent among women of reproductive age because of menstrual blood losses and high physiologic iron requirements. The functional consequences of ID include decreased physical performance, physical activity, and cognitive performance, as well as increased depression and fatigue [5].
The social and economic consequences of ID include increased maternal and perinatal mortality, low work productivity, increased energy needs and lost disability-adjusted life years [5].
Despite international economic and scientific efforts, the prevalence of IDA remains high worldwide [2].
This study aims to determine the frequency of anemia, ID and IDA among Algerian women of childbearing age and to identify correlations with nutritional status.
2Materials and methods
2.1Study sample
This study was carried out with 140 women of childbearing age between 20 and 26 years old. Participants were in good health and were recruited during a one-month period at the Higher National Agronomic School in El Harrach (Algiers, Algeria). The present study was approved by the ethics committee of the Algerian Ministry of Health and carried out in accordance with the World Medical Association code of ethics (and the Declaration of Helsinki).
2.2Exclusion criteria
All women diagnosed with a disease or taking drugs and/or supplements affecting the metabolism of iron were excluded from this study.
2.3Data collection
A survey was prepared to collect the anamnesis, as well as information on menstruation and the use of contraceptives.
2.4Anthropometric measurements
The nutritional status of each woman was assessed via anthropometric measurements: weight and height were collected in order to calculate the body mass index (BMI) and to estimate body fat.
[6] Where: a is age in years and x = 0 for the women.
2.5Venipuncture
After obtaining informed consent, 9 mL of blood was taken from each woman. Fasting blood samples were collected by venous puncture using dry and EDTA tubes, which are used to obtain a complete blood cell count or full blood count. This analysis was carried out using an apparatus (SYSMEX: Xs-500 I) that determines various erythrocytic indexes – mean corpuscular volume (MCV), mean corpuscular hemoglobin (MCH), mean corpuscular hemoglobin concentration (MCHC) – that allow the classification of anemia. Dry tubes underwent centrifugation at 3000 RPM (Revolutions Per Minute) for 15 minutes in order to collect the serum used to determine serum ferritin (FTμ), serum iron (SI), and serum transferrin (TRF) via two analyzers (Cobas E 411 and Cobas Integra 400+, France via electro chemiluminescence and colorimetry, respectively). The total binding capacity of transferrin (TIBC) and the siderophilin coefficient (SC) are calculated using the following formulas:
The serum collected was also used to evaluate C-reactive protein (CRP), which is normally lower than 5 mg/L and shows an absence of inflammation.
2.6Statistical analysis
The statistical analysis was conducted using STATISTICA version 8. This software program allows the calculation of descriptive statistics such as averages and standard deviations for the dependent and independent variables.
Kolmogorov-Smirnov (K-S) tests are used to analyze the distributions, with a significance threshold of P < 0.05.
3Results
3.1Study sample characteristics
Our study included 140 women of childbearing age, and the characteristics of the sample are presented in Table 1. The age range is between 20 and 26, with an average age of 22.45±1.24 years. The average weight and height values are 60.70±10.06 kg and 1.64±0.05 m, respectively.
Table 1
Characteristics of studied population (N = 140)
| Parameters | Mean±SD | % |
| Age (years) | 22.45±1.24 | |
| weight (kg) | 60.70±10.06 | |
| height (m) | 1.64±0.05 | |
| BMI (kg/m2) | ||
| BMI < 18 → underweight | 7.85 | |
| 18 < BMI < 25 → normal | 22.47±3.23 | 70.71 |
| 25 < BMI < 30 → overweight | 20 | |
| IMC > 30 → obese | 1.42 | |
| BFP% | 26.73±3.88 | |
| BFP < 25 | 35.71 | |
| 25 < BFP < 30 | 43.58 | |
| BFP > 30 | 20.71 |
Using the two last parameters, BMI was calculated using the formula: weight in kg/ (height in m)2. The average BMI value is 22.47±3.23 kg/m2.
Of the 140 women, 11 (7.85%) are underweight, 99 (70.71%) are normal weight, 28(20%) are overweight, and 2 (1.42%) are obese.
Body fat percentage (BFP) is used to evaluate the proportion of adipose tissue. The average BFP value is of 26.73±3.88%. According to this index, of the 140 women, 50 (35.71%) have low BFP values, 61 (43.58%) have normal BFP values, and 29 (20.71%) have high BFP values. BMI and BFP are significantly correlated (R = 0.99, p < 0.05).
Table 2 presents various menstrual cycle characteristics and indicates that approximately 13% of the women used oral contraceptives. The majority of women (77.14%) have regular menstrual cycles, and 7.85% of them menstruate for 3–5 days/cycle.
Table 2
Characteristics of menstruations (N = 140)
| Characteristics | N | % |
| Regular cycle | ||
| Yes | 108 | 77.14 |
| No | 32 | 22.86 |
| Number of days of the cycle | ||
| 3–5 | 11 | 7.85 |
| ≥5 | 129 | 92.15 |
| Use of oral contraceptives | ||
| Yes | 18 | 13 |
| No | 122 | 87 |
3.2Prevalence and severity of anemia
Anemia in women is defined by the World Health Organization as Hb < 120 g/L [7].
The average Hb of the sample is 12.34±1.07 g/dL. Of the 140 women, 39 (28%) have anemia. Of these, 69.23% present with mild anemia (11 < Hb < 11.9 g/dL) and 30.77% with moderate anemia (8 < Hb < 10.9 g/dL). No women present with severe anemia (Table 3).
Table 3
Severity of anemia N = 140
| Hb g/ dl | N | (%) |
| Anemia (Hb < 12 g/dl) | 39 | 28 |
| Mild anemia (11≤Hb < 11.9 g/dl) | 27 | 69.23 |
| Moderate anemia (8≤Hb < 10.9 g/dl) | 12 | 30.77 |
3.3Classification of anemia
Other hematological parameters (MCV, MCH) allow us to determine the type of anemia, as indicated in Table 4, which shows that of the 39 women with anemia, 24 (61.53%) present with hypochromic microcytic anemia, 7 (17.95%) with hypochromic normocytic anemia and 8 (20.52%) with normocytic normochromic anemia.
Table 4
Classification of anemia
| Type of anemia | MH | NH | NN | |
| Total Population | n | 35 | 24 | 81 |
| N = 140 | % | 25 | 17.14 | 57.86 |
| Anemic (Hb < 12 g/dL) | n | 24 | 7 | 8 |
| N = 39 | % | 61.54 | 17.95 | 20.51 |
| Non-anemic (Hb > 12 g/dL) | n | 11 | 17 | 73 |
| N = 101 | % | 10.89 | 16.83 | 72.28 |
MH: microcytic hypochromic, NH: Normocytic Hypochromic, NN: Normocytic Normochromic.
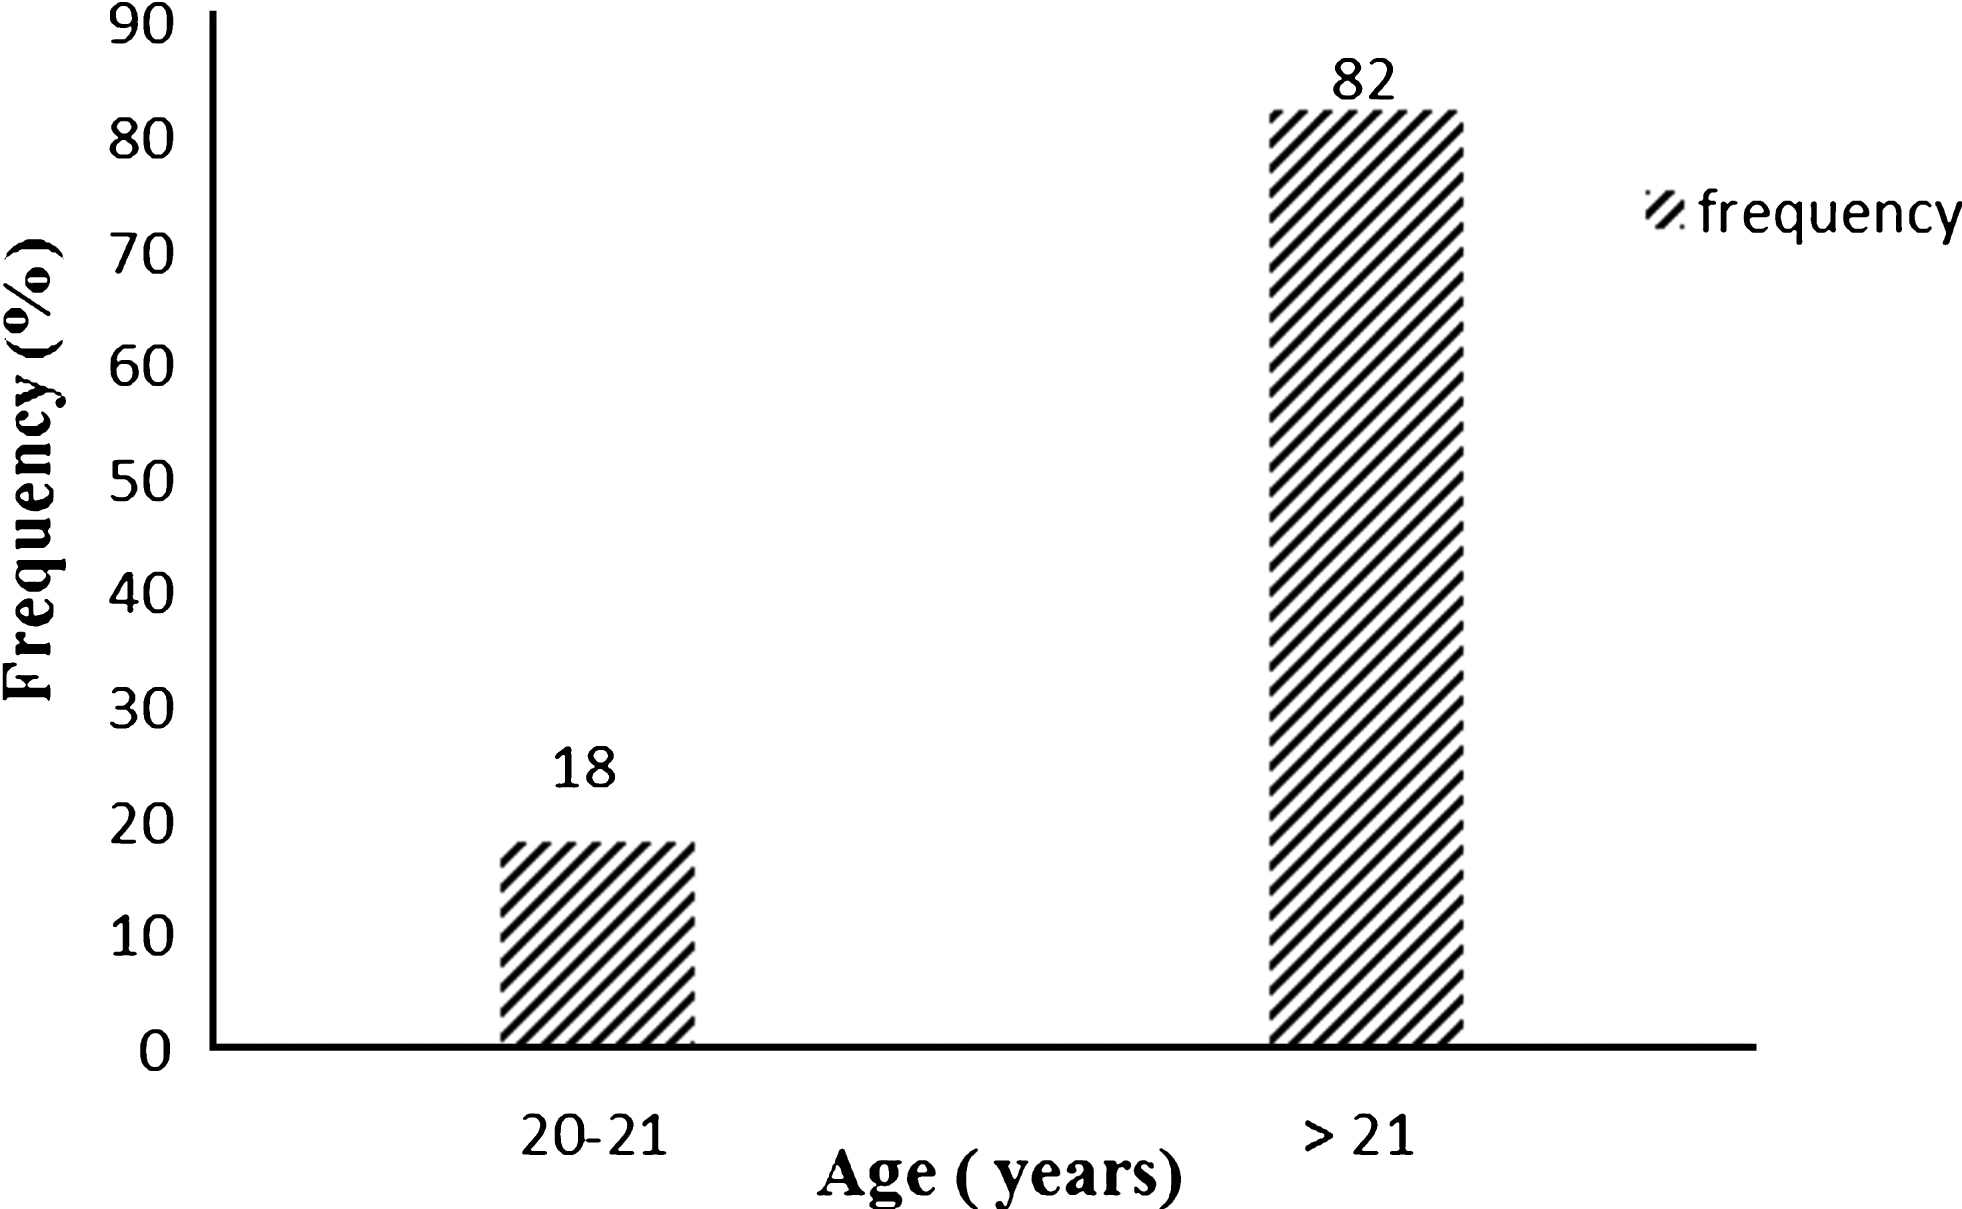
3.4Anemia and age
The prevalence of anemia increases with age. It is approximately 18% for women between 20 and 21 years old. Beyond this age, it reaches 82%. This age-related pattern follows the reproductive life of a woman (Fig. 1).
Fig.1
Evolution of anemia according to the age.
3.5Prevalence of ID and IDA
ID is characterized by a combination of two parameters: Hb < 12 g/dL and SC < 15%. The prevalence of ID is approximately 74.36% in our sample (Fig. 2).
Fig.2
Various types of anemia.ID: Iron deficiency; IDA: Iron Deficiency Anemia; Mixed A: Mixed Anemia.
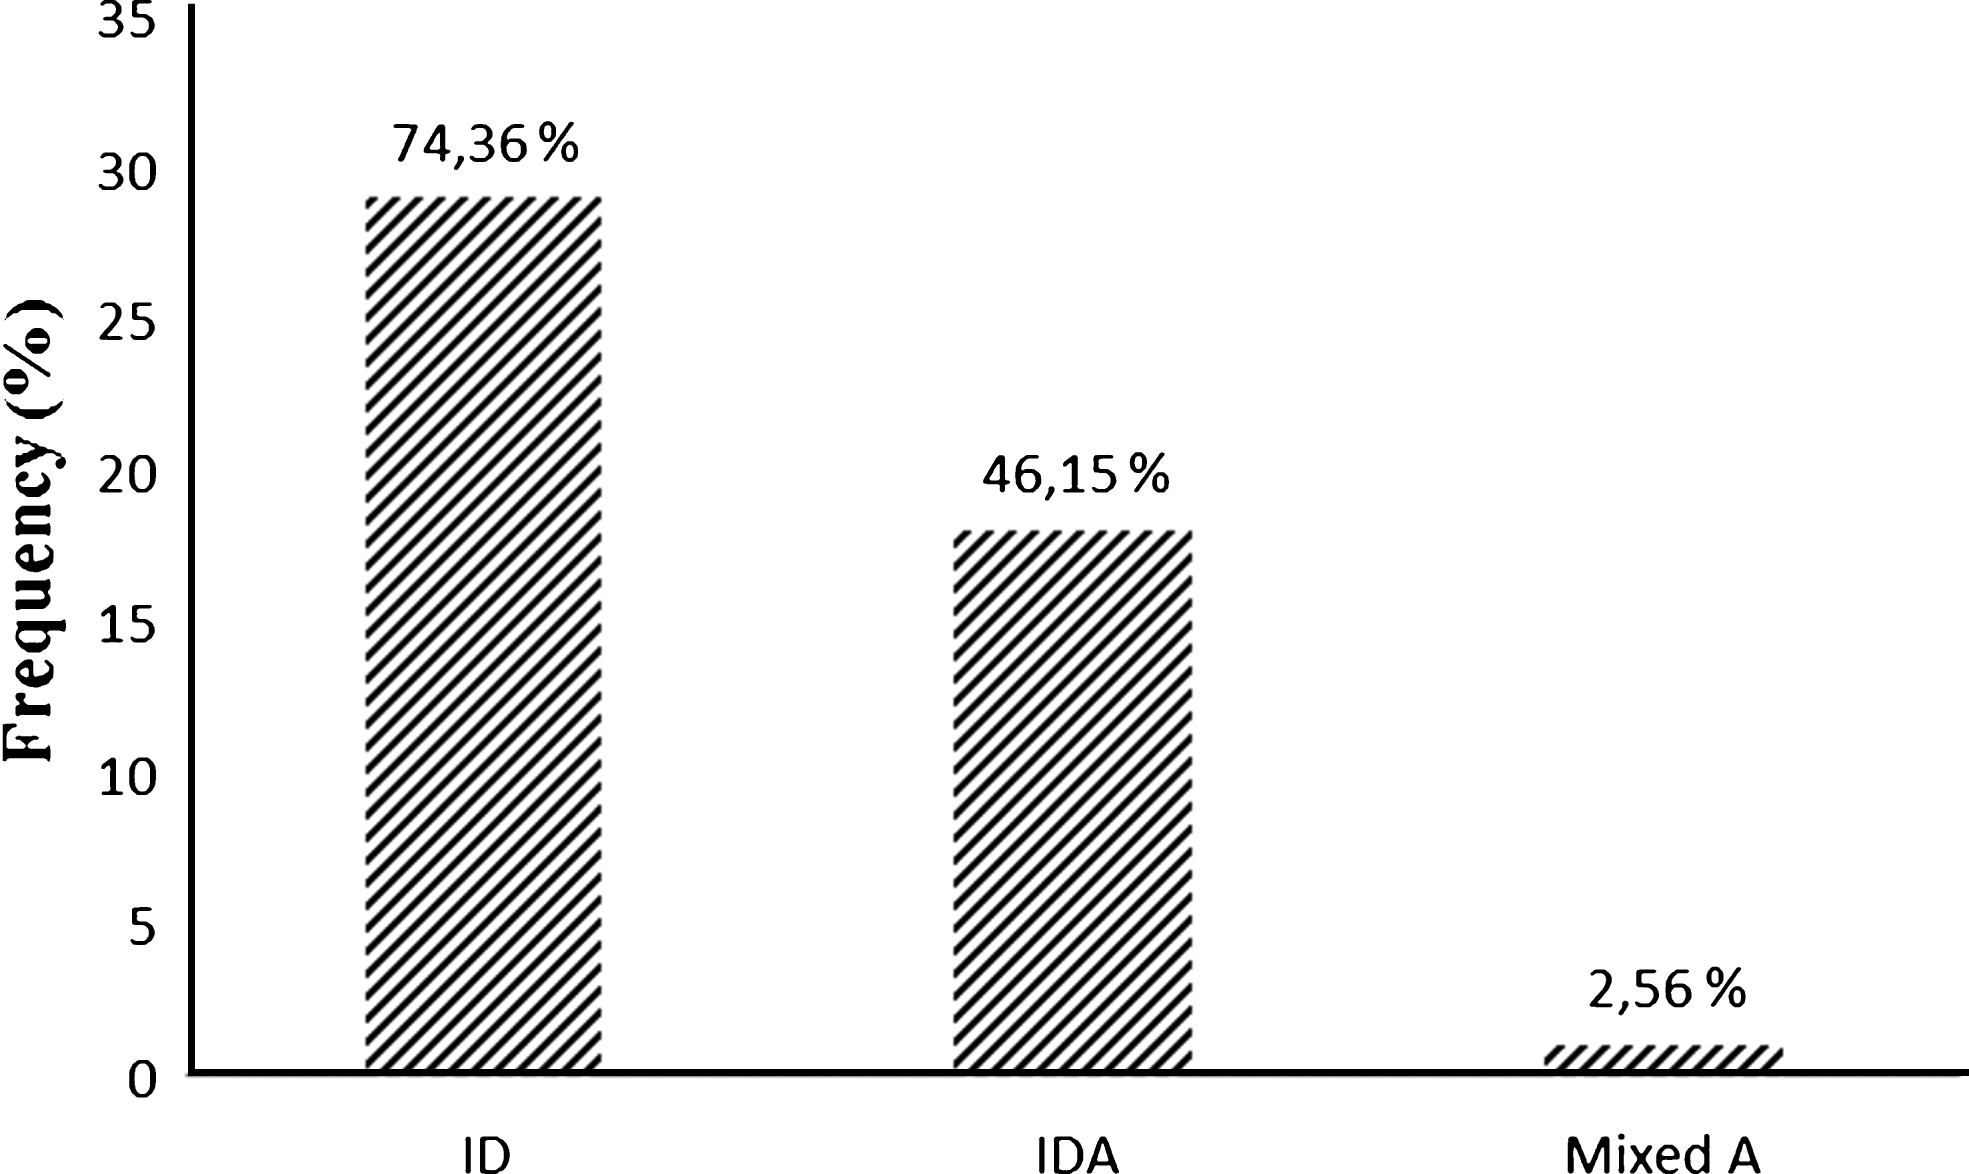
IDA is characterized by a combination of Hb < 12 g/dL, FTμ < 13 ng/mL, SC < 15% and CRP < 5 mg/L. The prevalence of IDA is estimated at 46.15%.
Mixed anemia, which includes IDA and inflammatory anemia, is characterized by an increase in CRP, normal blood ferritin and low SC. Only one case of mixed anemia is observed (2.56%).
Inflammatory anemia, characterized by an increase in CRP with normal or elevated serum ferritin, is not observed in our sample (Fig. 2).
4Discussion
IDA remains a major public health problem affecting more than 3.5 billion people in developing countries [8].
In Algeria, the majority of studies have been carried out on babies, toddlers, children, teenagers, and pregnant women. However, very few studies have focused on women of childbearing age, a group at risk for anemia that must monitor iron intake [9].
In this study, the frequency of anemia is estimated at 28%, the same frequency detected among women engaged in physical activity in Colombia (n = 72) [10].
Other studies estimating the frequency of this pathology, such as one conducted in Saudi Arabia, find frequencies of anemia as high as 64% among female university students (n = 268) [11].
Many studies attribute anemia mainly to dietary habits, insufficient consumption of iron and physiological factors related to age [9]. Based on Hb, mild anemia (11 < Hb < 11.9 g/dL) is most frequent, with a rate of 69.23%, followed by moderate anemia (8 < Hb < 10.9 g/dL), with a frequency of 30.77%. Indeed, a similar prevalence of anemia (51.3%) was found among the female students of Sant Baba Bhang Singh Institute in India [12]; in addition, no case of severe anemia was observed.
In absence of confirmatory tests, variation in Hb could be attributed to hemoglobinopathies [9].
Based on erythrocytic indexes (MCV, MCH), of the 39 women with anemia, 24 (61.54%) have hypochromic microcytic anemia (MCV < 80 fl and MCH < 27 pg) and 7 (17.95%) have hypochromic normocytic anemia (MCV > 80 fl and MCH < 27 pg).
In a study of female donors at a blood transfusion center in Nouakchott, Mauritania, the frequency of hypochromic microcytic anemia was 28% and that of normocytic normochromic anemia was 24% [13]. In a study of female university students in Saudi Arabia, the frequency of hypochromic microcytic anemia was 81% [11].
It is difficult to identify the causes of variations in MCV and MCH values, but they can be assessed by conducting colored blood film [9].
The frequencies of ID and IDA are 74.36% and 46.15%, respectively. In a study of female university students aged between 18 and 22 years old in Gaza (Palestine), the prevalence of IDA was estimated at 20.4% [14]. This high prevalence could be due reductions in socioeconomic status related to the political situation or to restrictions that have seriously affected savings in Gaza over the last seven years [15].
Among female soldiers in combat positions in the American army, the prevalence of ID is 32.8% and that of IDA is 20.9%. This finding could be attributed to insufficient iron intake among Americans of low socioeconomic status. Other causes are possible; studies show that even after adjusting for sociodemographic factors and diet, American women remain at risk for low iron reserves [16].
The evaluation of nutritional status is based on BMI and BFP. The average weight and height are 60.70±10.06 kg and 1.64±0.05 m, respectively. So, the average BMI is approximately 22.47±3.23 kg/m2.
Of the 140 women, 11 (7.85%) are regarded as underweight, 99 (70.71%) as normal weight, 28 (20%) as overweight and 2 (1.42%) as obese based on BFP.
BFP is used to evaluate the proportion of fat in the body. The average BFP is 26.73±3.88%, of the 140 women, 50 (35.71%) are lean, 61 (43.58%) have normal fat levels, and 29 (20.71%) have excess fat.
In Kuwait, the weights and heights of 255 high school girls were measured. The mean BMI was in the normal range, 37 girls were overweight, and 17 girls were underweight [17].
According to the results of the 2007 National Health and Nutrition Survey, 25.2% of young Japanese females are underweight, with BMI of less than 18.5 [18]. A survey of young females revealed that their ideal body weight in terms of BMI was 18.59 [19].
In our sample, oral contraceptives were used by nearly 13% of the women. The majority (77.14%) indicated that their menstrual cycles were regular, and 7.85% menstruate for 3–5 days per cycle.
Among young Australian women, hormonal contraceptive use is high at 66.5%, with oral contraceptives being the most common. Hormonal contraceptive use increased from 33.6% in 1999 to 43.3% in 2007 [20, 21]. Oral contraceptive has been shown to reduce menstrual blood loss by up to 50% [22].
It is probable that cultural influences are responsible for high rates of oral contraceptive use in certain countries. The most effective oral contraceptives for preventing anemia reduce the volume of menstrual blood lost each cycle [23].
Among young women, IDA constitutes a major public health problem, which requires the attention of national authorities and other organizations operating in the health sector.
This study aimed to determine the prevalence and severity of IDA, as well as to evaluate nutritional status based on anthropometric measurements, among a group of women of childbearing age (20 to 26 years).
Our study revealed that anemia; ID and IDA are quite frequent. Consequently, any policy that aims to reduce the prevalence of these conditions must take into account all the determining factors.
Conflict of interest
None to report.
References
[1] | Beck K , Conlon C , Kruger R , Coad J , Stonehouse W . The effect of gold kiwifruit consumed with an iron fortified breakfast cereal meal on iron status in women with low iron stores: A 16-week randomised controlled intervention study. BMC Public Health. (2010) ;10: :36. |
[2] | Sirdaha MM , Maged MY , El Shekhi S , Lubbad AM . Homocysteine and vitamin B12 status and iron deficiency anemia in female university students from Gaza Strip, Palestine. Rev Bras Hematolhemoter. (2014) ;36: (3):208–12. |
[3] | Falkingham M , Abdelhamid A , Curtis P , Fairweather-Tait S , Dye L , Hooper L . The effects of oral iron supplementation on cognition in older children and adults: A systematic review and meta-analysis. Nutr J. (2010) ;9: :4. |
[4] | Schweitzer A . Diagnostic des anémies. In: Hématologie. (2013) ;312. |
[5] | Jere DH , Sarah VL , Mercy GL , Michael JW , Laura EM-K , Stephen B , et al. Consuming Iron Biofortified Beans Increases Iron Status in Rwandan Women after 128 Days in a Randomized Controlled Feeding Trial. J Nutr. (2016) ;10.3945/jn.115.224741. |
[6] | Deurenberg P , Weststrate JA , Seidell JC . Br J Nutr (1991) ;65: (2):105–14. |
[7] | World Health Organization. Nutritional anemias. Report of a WHO scientific group. 1968. Report No.: 0512–3054. In: Björn W , Carl JÖ , Sigvard M , Patrik M . Prevalence andpredictive importance of anemia in Swedish nursing home residents—a longitudinal study. BMC Geriatrics. (2016) ;16: :206. |
[8] | Diouf S , Folquet M , Mbofung K , Ndiaye O , Brou K , Dupont C , et al. Prévalence et déterminants de l’anémie chez le jeuneenfant en Afrique francophone. Implication de la carence en fer. J Ped. (2015) . |
[9] | Sultan AH . Anemia among Female College Students Attending the University of Sharjah, UAE. Prevalence and Classification. Medical Laboratory. Technology Department. College of Health Sciences. University of Sharjah. J Egypt Public Health Assoc. (2007) ;82: (3). |
[10] | Sinclair LM , Hinton PS . Prevalence of Iron Deficiency with and without Anemia in Recreationally Active Men and Women. J Am Diet Assoc. (2005) ;105: :975–8. |
[11] | Nasir al Hassan N . The prevalence of iron deficiency anaemia in a Saudi University female students. J Microsc Ultrastruct. (2014) ;52: (4):25–28. |
[12] | Paul RC . Prevalence of Iron deficiency anemia in India: Results from a nationwide survey. J PS Stud. (2010) ;19: (1):2806. |
[13] | TayouTagny C , Diara A , Yahaya R , Hakizamana M , Nguessan A , Mbensa G , et al. Le centre de transfusion, le donneur de sang, et le sangdonné dans les pays d’Afrique (Nouakchott). Transfus ClinBiol. (2009) ;16: :431–8. |
[14] | Radi SM , El-Sayed NA , Nofal LM , Abdeen ZA . Ongoing deteriorationof the nutritional status of Palestinian preschool children inGaza under the Israeli siege. East Mediterr Health J. (2013) ;19: :234–41. |
[15] | WHO. Initial health assessment report: Gaza striEMRO. (2012) . |
[16] | McClung JP , Marchitelli LJ , Friedl KE , Young AJ . Prevalence of Iron Deficiency and Iron Deficiency Anemia among Three Populations of Female Military Personnel in the US Army. J Americ College of Nutr. (2006) ;25: (1):64–9. |
[17] | Al Mousa Z , Prakash P , Jackson RT , Al Raqua M . A comparison of selected nutrient intakes in anemic and non anemic adolescent girls in Kuwait. Nutrition Res. (2003) 425–33. |
[18] | NHANS. Outline for the Results of the National Health and Nutrition Survey. Japan. (2007) ;38. |
[19] | Kodama H . Problems of Underweight in Young Females and Pregnant Women in Japan. JMAJ. (2010) ;53: (5):285–9. |
[20] | Richters J , Grulich A , de Visser R , Smith A , Rissel C . Sex in Australia: Contraceptive practices among a representative sample of women. Aust NZ J Pub Health. (2007) ;27: (2):210–6. |
[21] | Australian Government Department of Families CSaIAF. Household Income and Labour Dynamics in Australia (HILDA) survey. (2005) . |
[22] | Miller L , Hughes J . Continuous combination oral contraceptive pills to eliminate with drawal bleeding: A randomized trial. Obstet and Gynecol. (2003) ;101: (4):653–61. |
[23] | Greig AJ , Palmer MA , Chepulis LM . Hormonal contraceptive practices in young Australian women (≤25 years) and their possible impact on menstrual frequency and iron requirements. Australia. Sex Reprod Healthc. (2010) 99–103. |


