
Fiber enriched protein-free pasta and bread: Is it a useful tool in chronic kidney disease in type 2 diabetes?
Abstract
BACKGROUND: Protein-free (PF) foods are routinely used in dietetic management of advanced chronic kidney disease in diabetic subjects. The enrichment by fiber has the purpose to reduce their impact on postprandial glucose levels.
OBJECTIVE: Aim of this study was to determine the Glycemic Index (GI) of PF bread and pasta enriched with soluble psyllium and inulin fiber.
METHODS: 14 adults, non obese, well controlled type 2 diabetic subjects consumed a 50 g carbohydrates containing serving of soluble fiber enriched PF pasta and PF bread. White bread was the reference food. Glucose levels were controlled fasting and at 30’, 60’, 90’, 120’ and 180’.
RESULTS: PF bread induces a significantly higher glucose increase at 120’ and 180’ (p < 0.05) and PF pasta at 30’ vs white bread (p < 0.05); PF pasta induces significantly lower glucose levels at 90’ and 120(p < 0.05) after the meal. PF pasta had (a medium) GI (70,10±22,6%), PF bread a high GI (117,32±26,9%).
CONCLUSIONS: These results confirm the unfavorable effect of PF food on postprandial glucose levels that is not limited by the addition of soluble fiber. In nutritional counselling it could be useful to suggest pasta to bread and include it in low GI meals.
1Aim of the study
Chronic Kidney Disease (CKD) is a common complication of type 1 and type 2 diabetes and most of Renal Failure patients are diabetic. Notwithstanding conflicting data in type 2 diabetes [1], dietary protein restriction plays an important role in the management of advanced CKD [2, 3] but it is difficult to realize it with natural foods. Protein-free derived cereal food (PF foods) are commonly used in clinical practice but they have a high Glycemic Index (GI) for the relative large amount of avalaible carbohydrates [4] and may worsen glucose control in CKD diabetic patients. The GI of a carbohydrate containing food is determined by its physical-chemical properties and by protein, fat and fiber content especially soluble fiber. In the last years Food Industry introduced lower PF foods GI adding soluble fiber to improve postprandial glucose levels and reduce cardiovascular risk and in CKD diabetic subjects [5]. There are not published data about PF foods GI and about the efficacy of soluble fiber addiction to reduce it. Aim of this study is to determine the in vivo postprandial glucose levels and GI of soluble fiber inulin enriched PF pasta, and psyllium-fiber and inulin enriched PF bread in type 2 diabetic subjects.
2Subjects and methods
14 adult (58±6.5 yrs), non obese (BMI 27±2.0), in good metabolic control (HbA1c 6.3±0.5%) type 2 diabetic subjects were enrolled. The disease duration was 4±2 years. They were treated only by diet without medication. The patients gave their consent to take part to the meal test.
PF pasta (size “Sedani”; Aproten®) and PF bread (type “Rosette”; Aproten®) were served as 50 g containing carbohydrate portions. The reference food was white bread. Added Fiber content was 1.35 g in pasta (inulin) and 4.56 g (50% inulin and 50% psyllum) in bread for each serving.
The steps indicated on the label were followed during pasta cooking (7 min. in boiling water); salt and seasoning were not added. The two PF foods and the reference one were administered twice in six different meals at midday lunch meal. Capillary blood samples (OneTouch Ultra®,Lifescan, Italy) were collected fasting and 30’, 60’, 90’, 120’, and 180’ after starting to eat; 250 ml of tap water was also served. During the test the subjects avoided any physical activity [6].
The Student t-test was applied to all measurement times (0’, 30’, 60’, 90’, 120‘and 180’); the temporal trend of the blood glucose differences between each PF product and the reference food was analyzed.
The GI was calculated according to Food and Agriculture Organization [7] using the trapezoid rule; each patient’s glucose values series after eating PF pasta and PF bread was matched with the reference food series; successively the GIs mean of all subjects was calculated. GIs were expressed in mmol/min/l.
PF food GI values were defined “Favorable” if blood glucose was lower than white bread glucose or “Unfavorable” if higher than white bread blood glucose. A Student’s t- two tailed test p < 0.05 result was considered significant.
3Results
The results are reported in Table 1. Blood glucose levels after PF bread were significantly higher than white bread ones at 120’ and 180’ (p < 0.05) (Fig. 1). On the contrary, PF pasta induces a significant early blood glucose increase at 30’ (p < 0.05), but significantly lower values at 90’ and 120’ vs the reference food (p < 0.05) (Fig. 2). The GI (mean±standard deviation value of all subjects), was 117,32±26,9% for PF bread and 70,10±22,6% for PF pasta. The sample variability, expressed as standard deviation, is higher for PF bread than PF pasta. The incremental areas are: 10516,5 mgmin/dl for white bread,12339 mgmin/dl for PF bread, 7372,06 mgmin/dl for PF pasta.
4Discussion
Despite PF foods have been used in clinical practice for several decades and are recommended by the nephrology guidelines, there are no studies on their GI. PF pasta determines postprandial blood glucose levels significantly lower than white bread and has a favorable medium GI (GI = 70,10); however it is higher than durum wheat one (GI = 49±2%); PF bread significantly increases late glucose levels at 120’ and 180’ and has an unfavorable GI (GI = 117,32±26,9%) that is higher than white bread [8]. Our results show how industrial soluble fiber addition does not seem to play a relevant role in decreasing the postprandial glucose response and it is not effective to determine low GI in PF cereal derived foods. Conflicting data on the GI reduction by fiber addition are reported: it seems effective in reducing biscuits (21%) and bread (41%) GI [9]. This effect has been recently quantified by the Glycemic Reduction Index Potential (GRIP) [10], though the addition of different amounts (4, 8, 12 g) of mixed soluble fiber to muffins failed to reduce their GI [11]. Not all fibers work similarly: in our experience the addition of β-glucan to oven-baked products (crackers) failed to reduce postprandial glycemia [12]. These conflicting results could depend on the inadequate amount of added fiber, stemming from the need to maintain an acceptable taste and texture, but also the starch type, the food processing, and the addition of simple sugars play a role. In pasta production, starch undergoes a molecular remodeling, that slows the digestion rate; however, there is a significant difference between common pasta (GI = 49±2%) [8] and PF pasta (GI = 70,10±22,6%) for to the different composition and processing of the two products: in PF pasta wheat flour is replaced with high GI rice, tapioca, potato derived starches; furthermore, extrusion and the use of high temperatures increase starch digestion rate. In our study the small sample size (14 subjects) does not invalidate the GI estimation error (around 10 for GI values of 80 and 95% confidence interval [6]. Further studies are needed about in vitro analytical data (resistant starch and fiber) of PF foods.
Despite PF pasta produced a lower blood glucose arise, individual variability was greater than that observed after bread intake. Furthermore, a recent meta-analysis on 15 studies confirmed that dietary protein restriction is beneficial to slow the progression of chronic kidney disease in non diabetic and in type 1 diabetes, but not in type 2 diabetes [1] suggesting to circumscribe the prescription of PF foods to the patients with the most compromised kidney function in this population.
Conclusions
PF pasta (size “sedani”) may be classified as a medium GI and bread (type “rosette”) as a high GI food.
The soluble fiber amount added to these products seems to have a modest influence in GI lowering; on the contrary, starch physical structure and its processing to produce PF pasta may have played a key role in maintaining a relatively low GI.
Since the maintenance of good glycemic control in diabetic subjects with advanced CKD represents an important therapeutic goal [13, 14, 15, 16], our observations suggest to find more effective fiber mixtures and different food industrial processing to reduce the GI of PF cereal derived foods; furthermore, it is advisable to prefer PF pasta to PF bread in clinical practice and associate it to fiber rich vegetables to compound lower GI meals; however, in type 2 diabetic subjects with advance CKD who need severe protein restriction, intensive pharmacological therapy (by insulin) is generally required to achieve a good metabolic goal.
Conflict of interest
The authors declare no conflict of interest.
References
[1] | Rughooputh MS , Zeng R , Yao Y . Protein diet restriction slows chronic kidney disease progression in non-diabetic and in type 1 diabetic patients, but not in type 2 diabetic patients: A meta-analysis of randomized controlled trials using glomerular filtration rate as a surrogate. PLoS One. (2015) ;10: (12). |
[2] | Joseph A. National kidney foundation K/DOQI clinical practice guidelines for nutrition in chronic renal failure. (2007) ;50: (2):169–180. |
[3] | Quintaliani G , Amerio ML , Bellizzi V . Position paper: Il trattamento dietetico nutrizionale nell’insufficienza renale cronica. Attualità in dietetica e nutrizione clinica. (2011) ;3: :51–60. |
[4] | Barclay AW , Petocz P , McMillan-Price J , Flood V M , Prvan T , Mitchell P , Brand Miller JC . Glycemic index, glycemic load, and chronic disease risk- a meta-analysis of observational studies. Am J Clin Nutr. (2008) ;87: :627–637. |
[5] | Thomas D , Elliot EJ . The Cochrane Collaboration. Low glyceamic index, or low glyceamic load, diets or diabetes mellitus. Cochrane Database of Systematic Reviews. (2009) ;1:CD006296. |
[6] | Brouns F , Bjorck I , Frayn KN , Gibbs AL , Lang V , Slama G , et al. Glicaemic index methodology. Nutrition Research Reviews. (2005) ;18: :145–171. |
[7] | FAO/WHO. Carbohydrates in human nutrition: Report of a joint FAO/WHO expert consultation. FAO Food and Nutrition Paper. (1998) ;66: :1–140. |
[8] | Atkinson FS , Foster-Powell K , Brand-Miller JC . International tables of glycemic index and glycemic load values. Diabetes Care. (2008) ;31: :2281–2283. |
[9] | Marangoni F , Poli A . The glycemic index of bread and biscuits is markedly reduced by the addition of a proprietary fiber mixture to the ingredients. Nutrition, Metabolism and Cardiovascular Diseases. (2008) ;18: (9):602–605. |
[10] | Jenkins AL , Jenkins DJA , Wolever TMS . Comparable postprandial glucose reduction with viscous fiber blend enriched biscuits in healthy subject and patients with diabetes mellitus: Acute randomized controlled clinical trial. Croat Med J. (2008) ;49: :772–782. |
[11] | Willis HJ , Thomas W , Eldridge AL , Harkness L , Green H , Slavin JL . Glucose and insulin do not decrease in a dose-dependent manner after increasing doses of mixed fibers that are consumed in muffin for breakfast. Nutr Res. (2011) ;31: (1):42–47. |
[12] | Tubili C , Morviducci L , Nardone MR , Agrigento S , Villani N . Addition of different soluble fiber fractions to oven baked products is not always a successful tool for reducing the Glycemic Index. Nutrition, Metabolism & Cardiovascular Diseases. (2010) ;20: :e6–e7. |
[13] | Kopple JD . National kidney foundation K/DOQI clinical practice guidelines for nutrition in chronic renal failure. American Journal of Kidney Diseases. (2001) ;37: (1):S 2, S66–S70. |
[14] | Beto JA , Bansal VK . Medical nutrition therapy in chronic kidney failure: Integrating clinical practice guidelines. J Am Diet Assoc. (2004) ;104: (3):404–409. |
[15] | American Diabetes Association. Standard of Medical Care of Diabetes. Diabetes Care (2014) ;37: (Suppl. 1). |
[16] | Raccomandazioni per la terapia medica nutrizionale per il diabete mellito. ADI AMD SID 2013-2014, www.adiitalia.net |
Figures and Tables
Fig.1
Blood glucose levels after PF bread were significantly higher than white bread ones at 120’ and 180’ (p < 0.05).
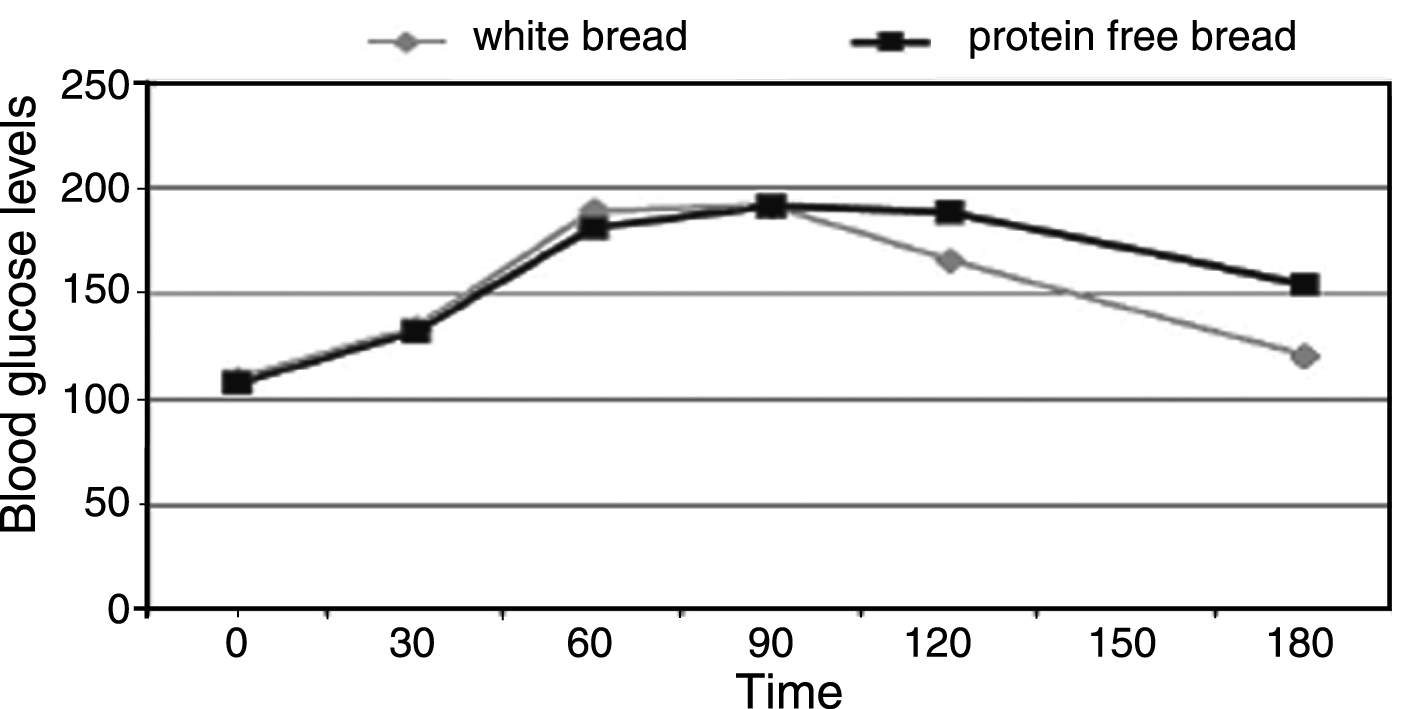
Fig.2
PF pasta induces a significant early blood glucose increase at 30’ (p < 0.05), but significantly lower values at 90’ and 120’ vs the reference food (p < 0.05).
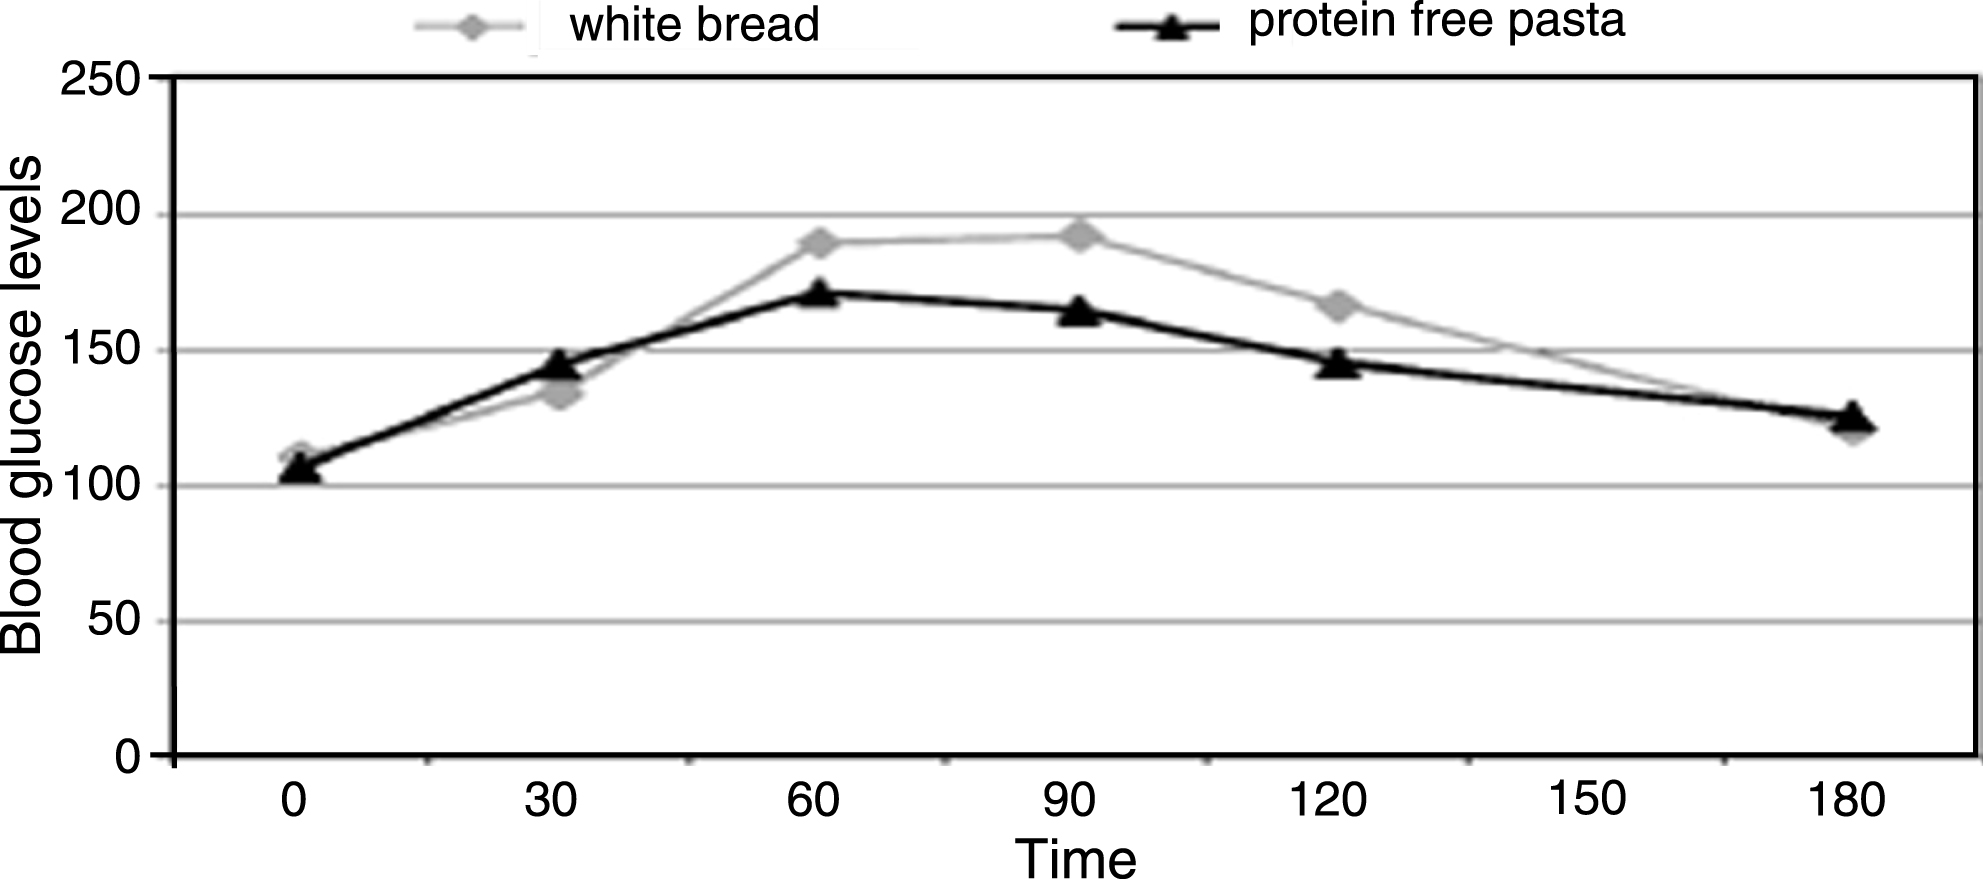
Table 1
| mg/dl | 0’ | 30’ | 60’ | 90’ | 120’ | 180’ |
| Protein-free bread | 109±5 | 128±10 | 180±12 | 191±10 | 186±9° | 150±8° |
| White bread | 111±4 | 127±9 | 187±18 | 190±9 | 168±10 | 122±7 |
| Protein-free pasta | 98±8 | 139±6° | 166±11 | 159±7* | 148±7* | 124±8 |
(p < 0.05) °higher than white bread. *lower than white bread.


