
Nutrient intake evaluation among school age children in Jakarta, Indonesia
Abstract
BACKGROUND:
It has been an important issue to assess energy and nutrient intakes of children within the population to observe their nutrient consumption whether it is excessive or inadequate, by comparing to reference values in the applicable Dietary Reference Intakes (DRIs), specifically among Jakarta population as a capital city of Indonesia.
OBJECTIVE:
The aim of this study is to further perform an in-depth exploration of nutrient intake assessment in this population, particularly among 6- to 12-year-old (school age) children group in Jakarta.
METHODS:
Data obtained from 2nd Indonesian National Basic Health Research Survey (RISKESDAS) in a cross-sectional setting were analyzed. The main sample consisted of children age 6- to 12-year old randomly selected in Jakarta area (n = 945). A 24-hr dietary recall was used for assessing the nutrient intake.
RESULTS:
Energy intake for the total population was about 79.3% from the Indonesian Dietary Reference Intake (DRI) with adequate intake of protein (112.4% ). There was an excessive intake of fat approximately about 193.4% and carbohydrate for about 150.5% , respectively. Fiber consumption was very low (18.3% ). Children in Jakarta also consumed diets that provide marginal amount of key micronutrients mainly for thiamin (vitamin B1), vitamin C, and zinc (less than 60% Indonesian DRI).
CONCLUSIONS:
Children from lower SES, girls, and the older age groups need to be given additional attention, since their daily nutrient intake were less than the counterparts. This study also suggested that the first improvement strategies are to provide diets with less fat, lower glycemic index foods, as well as higher intake of thiamin, vitamin C, and zinc.
1Introduction
Meeting adequate nutrient requirement in children is essential to promote normal growth and development which may also influence their long-term health such as obesity prevention and related chronic diseases as they age [1]. However, there is concern of disparities between higher energy intakes with nutrient density in their diet, resulted in childhood obesity and might co-exist with key micronutrient deficiencies or under-nutrition problem [2]. Accordingly, it is important to assess energy and nutrient intakes of children within the population to observe their nutrient consumption whether it is excessive or inadequate, by comparing to reference values in the applicable Dietary Reference Intakes (DRIs). This is important not only to assess current situation, but also to build nutritional knowledge in order to support evidence-based nutritional guidelines and recommendation in the population.
Data from 2nd Indonesian National Basic Health Research Survey in 2010 (RISKEDAS) showed that prevalence of overweight and obesity within 6- to 12-year-old children living in Jakarta was considerably high (12.8% ). This value was even considered to be higher than the national prevalence within the same age group (9.2% ), respectively [3]. This warrants further in-depth exploration of nutrient intake assessment in this population, particularly among school age children (6- to 12-year-old) group in Jakarta, Indonesia. Therefore, the aim of present study was to assess nutrients intake adequacy among children aged 6- to 12-year old living in Jakarta by using Indonesian DRIs as the reference value.
2Material and methods
2.1Study design
This study was a cross-sectional survey, in which data from 2nd Indonesian National Basic Health Research Survey (RISKESDAS Riset Kesehatan Dasar) was used. This survey was conducted from May to August 2010. Indonesian National Basic Health Research Survey (RISKESDAS) is a periodically conducted national health research survey every 5 to 6 years by Health Development and Research Institute (Badan Penelitian dan Pengembangan Kesehatan) under Indonesian Ministry of Health while sample collection is assessed by the Indonesian Central Statistics Bureau (Badan Pusat Statistik). The primary aim of this national research survey is to assess the health status, dietary practices, prevalence of diseases, and nutritional status within Indonesian population.
2.2Study population
Main sample population in this study consisted of school age children age 6- to 12-year old randomly selected in Jakarta area. In RISKESDAS 2010, two-stage sampling technique was used to select the household. This sampling technique was performed in all 33 provinces within Indonesia including Jakarta. First, to select block census in each province based on socio-economic status and urban/rural area ratio using stratified random sampling. Subsequently, household within each block census was selected using random sampling technique. In Jakarta, there were 111 block census were chosen as representative, and from each block census, 25 household were selected. From 2775 block census registered, 2662 household were visited and 1062 children were measured as the main respondents for this study.
2.3Data collection and analysis
Data used in this study was obtained from RISKESDAS 2010 including subject identity (age, gender, weight, and height), socio-economic (SES) status, 24-hr dietary consumption data, BMI (Body Mass Index), and macronutrient consumption (energy, protein, carbohydrate, fat, and fiber). Subject identity data were collected using family assessment questionnaire (RKD10.RT BLOK IV Questionnaire) and interview method by trained interviewer. SES categorization was assessed by Indonesian Central Statistics Bureau (Badan Pusat Statistik) using quintile with the 1st and 2nd quintile as low SES, 3rd quintile as medium SES, and 4th and 5th quintile as high SES.
For 24-hr dietary recall questionnaire (RKD10.IND BLOK IX Questionnaire), interviews were conducted together with parents and subjects. Micronutrient analysis was accomplished using NutriSurvey for Windows 2005 software (University of Indonesia, SEAMEO-TROPMED) for vitamin A (mg RE), vitamin B1 (mg), vitamin B2 (mg), vitamin B6 (mg), vitamin C (mg), calcium (mg), iron (mg), and zinc (mg). If data for particular food does not exist in the software, then DKBM database (Indonesian Food Consumption Database) published by Indonesian Ministry of Food and Agriculture was used. For Indonesian Dietary Intake Reference, AKG 2004 (Angka Kecukupan Gizi) was used as the standard for each age category. For carbohydrate, fiber, and fat, DRI (Dietary Reference Intake) from Institute of Medicine (2005) were used as a standard.
As for anthropometry measurement, height was assessed using multifunction measurement tools with the maximum height of 2 m and 0.1 cm accuracy level. Digital weight balance with “AND” Brand was used to measure weight and it was calibrated every day. Body Mass Index (BMI) was calculated as weight/height2 (kg/m2) whilst BMI z-score was calculated for further analysis using WHO 2007 formula.
2.4Statistical analysis
Before analyzing these data, cleaning and editing were accomplished using Microsoft Excel 2007 for Windows. If data such as height or weight were not available, subjects were excluded from the analysis. Additionally, subjects was screened out if total energy ratio to basal metabolic rate (BMR) was <0.3 or >3 (FANTA-2 Study, 2009) and if BMI >36 and <12 (WHO Growth Chart, 2007) in order to ensure the data usage within this study were logic.
All the statistical analyses were conducted using SPSS version 17.0 for Windows. Descriptive statistics were used to describe subject characteristics, daily nutrients intake, and BMI z-score within the study population. Multiple regression analysis using Stepwise method was conducted to examine the relationship between age, gender, and SES (socioeconomic status) to the total energy intake, macronutrient (protein, carbohydrate, fat, and fiber), selected micronutrient (vitamin A, B1, B2, B6, calcium, iron, and zinc), and also BMI z-score. The same analysis was also conducted to investigate differences of nutrient intake and BMI z-score within different demographic subgroups.
3Results
3.1Subject characteristics
From 1062 children data obtained in Jakarta from RISKESDAS 2010, only 945 children were included in final analysis after applying the cleaning criteria, which means the final response was 88.9% (Fig. 1).
This study consisted slightly more boys than girls (52% versus 48% ), with a mean age of 9 years. Age group was classified based on Indonesian DRI and 6 years age group was the lowest number (14.2% ) in comparison with other age groups in this study as shown in Table 1. Seventy two children (7.6% ) were classified as underweight based on WHO (2007) criteria (< -2SD) while its counterpart, overweight group consist of 308 children (32.6% ) and the rest was classified as having normal BMI (59.8% ). More than half (64.6% ) of the children were coming from high socio-economic status family in Jakarta (4th and 5th quintile based on Indonesian Central Statistics Bureau).
3.2Daily nutrient intake and BMI z-score in total population
Intakes of macronutrients, selected micronutrients, and BMI z-score for total population within this study were summarized in Table 2. Overall, the energy intake for total population was about 79.3% from Indonesian DRI and they consumed adequate intake of protein (112.4% ). However, amount of total fat intake exceeded the Acceptable Macronutrient Distribution Ranges (IOM, 2005), approximately 193.4% . Consumption of carbohydrates amongst Jakarta children was also very high (150.5% ) in comparison with DRI carbohydrate standard (IOM, 2005) while fiber consumption was very low (18.3% ). On the other hand, micronutrient intakes still did not meet dietary requirement, particularly for zinc (52.6% ) which is considered an essential nutrient for growth and development (55) and also for vitamin B1 (46.7% ) which has been acknowledged as important vitamin to help converting carbohydrate to energy (56). There were no correlations between energy, macro, and micronutrient intakes with BMI z-score.
3.3Daily nutrient intake and BMI z-score across different demographic groups
Based on multiple regression analysis using Stepwise method, SES and gender were correlated and significantly associated with total energy intake (r = 0.022; p < 0.001). Intakes of macronutrients and key micronutrients across different SES and gender were shown in Tables 3 and 4 below.
Children in high SES group consumed significantly higher (p < 0.001) for nearly all the daily macro and micronutrients with exception for fat, fiber, and zinc in comparison with low SES group. Nonetheless, for all SES groups, fiber intake and the micronutrients still did not meet recommendation. For fat and carbohydrate, the consumption again exceeded recommendation (>100% ) and there was no significant difference between all the groups. Daily protein consumption was significantly lowest (p < 0.001) in low SES group (86.7% ) in comparison with the medium (102.2% ) and high group (120.6% ). Highest BMI z-scores were found in high SES group (p < 0.001).
Overall, boys tended to have higher intakes of daily energy, protein, fiber, vitamin B1, and vitamin B2 compared with girls (p < 0.005). There were no statistical differences in others macro and micronutrients. Nonetheless, daily total energy, fiber, and selected micronutrients still did not meet standard requirement for each gender. For both genders, fat and carbohydrate intakes were considerably excessive in comparison with DRI value as seen in Table 4.
Age group was divided based on Indonesian DRI into 3 different groups which were 6 years, 7–9 years, and 10 to 12 years old group. Group 10 to 12 years old had only significantly higher intake of vitamin B2 (p < 0.001) compared with other age groups although still did not meet the requirement intake. Highest consumption of daily calcium was in 6 years old age group (p < 0.001). As expected, daily consumption of fat and carbohydrate among all group were more than the recommendation as shown in Table 5.
4Discussions
The results of this analysis clearly showed that the nutrient intake within school aged children living in Jakarta was associated with very high intake of carbohydrate (150.52% ) and fat (193.44% ) in comparison to the Indonesian DRI. However, the protein consumption met the recommendation (112.38% ). Although the current mean BMI z-score in the population was 0.32 (i.e. normal weight status), these findings raise a concern since excessive intake of fats [4] and carbohydrates, mainly from high glycemic index foods, in children may result in weight gain and childhood obesity. This would then be associated with adverse long-term effect on their health as they age [5–8]. High glycemic index foods produce fairly large increase in postprandial blood glucose concentration and could contribute to hunger stimulation through sequences of hormonal events induction which might be the cause of overeating [7]. Research has shown that high glycemic index diet has been linked with risk for central adiposity [9], cardiovascular disease [10], and type 2 diabetes [11] in adults. Additionally, fiber consumption was also inadequate (18.3% ). Fiber has been acknowledged as a beneficial macronutrient due to its numerous health benefits. For example, the production of short chain fatty acids (SCFA) which may promote regularity of bowel movements, reduce the risk of colorectal cancer, cardiovascular disease, type 2 diabetes, and also increase satiety which may decrease the likelihood of obesity [12].
Children in Jakarta were found to consume diets that provide marginal amount of key micronutrients mainly thiamin (vitamin B1), vitamin C, and zinc (less than 60% DRI) which are beneficial for children health. For instance, thiamin has been known as the coenzyme responsible for metabolism of carbohydrates into energy, vitamin C as antioxidant and immune system, while zinc is for growth and development in children [13]. Although rice is a good source of thiamin [13] and Indonesians are generally over-dependent on it (consumed about 102 kg per capita/year [14], marginal intake of thiamin approximately 46.7% from Indonesian RDI, still occurred in this population. This may be due to the excess refining and polishing of rice which removes considerable proportions of vitamin B [13].
The lack of correlations between energy intake, macronutrients, and micronutrients intake with BMI z-score in this study was also found by similar research conducted in Australia [15, 16]. Those studies showed that physical activity level rather than the percentage of energy from macronutrients, was associated with percentage body fat, suggesting that within the school aged children, physical activity may act as stronger predictor of weight and BMI status [15]. To the author’s knowledge, there are no current overview of nutrient intake in Jakarta school aged children, thus it is difficult to compare this findings with other similar studies from Jakarta.
The findings also suggested that higher SES was associated with better daily nutrient intake and the closest to Indonesian DRI while low SES was associated with a lower intake of all nutrients. This is consistent with the study conducted by Hulshof and colleagues (2003) as well as Dapi and colleagues (2011). They concluded that in general, dietary intake among subjects in higher SES group tended to be closer with the country’s recommendation and better overall nutrient intake in comparison with low SES group [17, 18]. This might be explained by the economic restriction and access limitation to healthy products in low SES group [19]. High consumption of starchy fried foods within Jakarta population as a homemade or street food products may also explained the excessive daily intake of fat and carbohydrate as well as inadequacy of fiber intake [20].
Generally, boys tended to have higher intake of energy, protein, fiber, thiamin (vitamin B1), and vitamin B2 compared to girls. Higher BMI z-score was also found in boys although it was not statistically significant. This might be due to the higher energy requirement for boys specifically in the middle of puberty stage [21]. However, both genders were reported to have inadequate intakes of the micronutrients.
With regards to specific target groups, this study found that children from lower SES, girls, and the older age groups need to be given additional attention, since their daily nutrient intake were less than the counterparts. Moreover, the risk subgroups identified within this study were basically in-line with the other previous studies [17, 21]. This study also suggested that the first improvement strategies are to provide diets with less fat, lower glycemic index foods, as well as higher intake of thiamin, vitamin C, and zinc.
5Conclusions
Nutrient intake within school aged children living in Jakarta was associated with high intake of carbohydrate (150.52% ) and fat (193.44% ) in comparison with Indonesian DRI. However, consumption amount of protein met the recommendation (112.38% ) while fiber consumption was inadequate (18.26% ). Children in Jakarta also consumed diets that provide marginal amount of key micronutrients mainly for thiamin (vitamin B1), vitamin C, and zinc (less than 60% DRI). There were no correlations between energy intake, macronutrients and micronutrients intake with BMI z-score. Higher SES was associated with better daily nutrient intake and tended to be closer with the Indonesian DRI while low SES was associated with a lower intake of all nutrients. Nonetheless, all SES groups did not meet the recommendation intake suggesting there is an urgent need to increase the diet quality within this population, for instance from breakfast recommendation. Boys tended to have higher daily intake of energy, protein, fiber, thiamin (vitamin B1), and vitamin B2 compared to girls. Although there were no statistically significant differences among all age subgroup, lowest intake of micronutrients such as vitamin A, thiamin, riboflavin, vitamin C, calcium, iron, and zinc was apparent in the oldest age group (10- to 12-year-old age group) suggesting extra attention needs to be given.
Acknowledgments
The author thank Health Development and Research Institute under Indonesian Ministry of Health for the 2010 RISKESDAS data provided. The author whoheartedly thank Prof. Stef Kremers and Prof. Fred Brouns for the guidance and valuable insights during the writing process. Special thank goes to Rob te Biesebeke, PhD for his insightful and whole-hearted guidance. The author would also thank Andre Binarto Wijaya for his sincere supports and great assistance in compiling the data used in this study. Highest appreciation also goes to Prof. Hardinsyah from Faculty of Human Ecology (FEMA) Bogor Agricultural University (IPB), Indonesia for the nutrition inputs. The author thank Leonie Scheys, Aileen Mulja, and Natasha Ayuningtyas for the friendship. Last but not least, the author would also like to extend my deeply thank to Satriani Subagyo, Mardi Wu, PhD. and Susana, MSc., PD.Eng for their endless encouragement to make this study happened.
References
1 | Field CJ . Early risk determinants and later health outcomes: Implications for research prioritization and the food supply. Summary of the workshop. Am J Clin Nutr. [Research Support, Non-U.S. Gov’t]. (2009) ;89: (5):1533S–9S. |
2 | Picciano M , Smiciklas-Wright H , LL B . Nutritional guidance is needed during dietary transition in early childhood. Pediatrics. (2000) ;106: :109–14. |
3 | Badan Pengembangan dan Penelitian Kesehatan. Riset Kesehatan Dasar (RISKESDAS). Jakarta. 2010. |
4 | Jequier E . Is fat intake a risk factor for fat gain in children? J Clin Endocrinol Metab. [Review]. (2001) ;86: (3):980–3. |
5 | Whitaker RC , Wright JA , Pepe MS , Seidel KD , Dietz WH . Predicting obesity in young adulthood from childhood and parental obesity. N Engl J Med. [Research Support, Non-U.S. Gov’t Research Support, U.S. Gov’t, P.H.S.]. (1997) ;337: (13):869–73. |
6 | Micic D . Obesity in children and adolescents–a new epidemic? Consequences in adult life. J Pediatr Endocrinol Metab. [Review]. (2001) ;14: (Suppl-5):1345–52; discussion 65. |
7 | Ludwig DS , Majzoub JA , Al-Zahrani A , Dallal GE , Blanco I , Roberts SB . High glycemic index foods, overeating, and obesity. Pediatrics. [Clinical Trial Controlled Clinical Trial Research Support, Non-U.S. Gov’t Research Support, U.S. Gov’t, P.H.S.]. (1999) ;103: (3):E26. |
8 | Swartz MB , Puhl R . Childhood Obesity: A societal problem to solve. Obes Rev. (2003) ;4: (1):57–71. |
9 | Toeller M , Buyken AE , Heitkamp G , Cathelineau G , Ferriss B , Michel G . Nutrient intakes as predictors of body weight in European people with type 1 diabetes. Int J Obes Relat Metab Disord. [Research Support, Non-U.S. Gov’t]. (2001) ;25: (12):1815–22. |
10 | Liu S , Willett WC , Stampfer MJ , Hu FB , Franz M , Sampson L , et al. A prospective study of dietary glycemic load, carbohydrate intake, and risk of coronary heart disease in US women. Am J Clin Nutr. [Research Support, U.S. Gov’t, P.H.S.]. (2000) ;71: (6):1455–61. |
11 | Salmeron J , Manson JE , Stampfer MJ , Colditz GA , Wing AL , Willett WC . Dietary fiber, glycemic load, and risk of non-insulin-dependent diabetes mellitus in women. Jama. [Research Support, Non-U.S. Gov’t Research Support, U.S. Gov’t, P.H.S.]. (1997) ;277: (6):472–7. |
12 | ILSI. Dietary Fibre: Definition, Analysis, Physiology, and Health. ILSI Europe Consise Monograph Series. 2006 |
13 | WHO. Vitamin and mineral requirements in human nutrition. Geneva. 2004. |
14 | Biro Pusat Statistik (BPS) Indonesia. National Socio Economic Survey. Jakarta. 2008 |
15 | Zhou SJ , Gibson RA , Gibson RS , Makrides M . Nutrient intakes and status of preschool children in Adelaide, South Australia. Med J Aust. [Research Support, Non-U.S. Gov’t]. (2012) ;196: (11):696–700. |
16 | Atkin LM , Davies PS . Diet composition and body composition in preschool children. Am J Clin Nutr. (2000) ;72: (1):15–21. |
17 | Hulshof KF , Brussaard JH , Kruizinga AG , Telman J , Lowik MR . Socio-economic status, dietary intake and 10 y trends: The Dutch National Food Consumption Survey. Eur J Clin Nutr. [Research Support, Non-U.S. Gov’t];(2003) ;57: (1):128–37. |
18 | Dapi LN , Hornell A , Janlert U , Stenlund H , Larsson C . Energy and nutrient intakes in relation to sex and socio-economic status among school adolescents in urban Cameroon, Africa. Public Health Nutr. [Comparative Study Multicenter Study Research Support, Non-U.S. Gov’t]. (2011) ;14: (5):904–13. |
19 | James WP , Nelson M , Ralph A , Leather S . Socioeconomic determinants of health. The contribution of nutrition to inequalities in health. Bmj. [Review]. (1997) ;314: (7093):1545–9. |
20 | Draper A. Street Foods in Developing Countries: The Potential for Micronutrient Fortification. 1996 |
21 | Shomaker LB , Tanofsky-Kraff M , Savastano DM , Kozlosky M , Columbo KM , Wolkoff LE , et al. Puberty and observed energy intake: Boy, can they eat!. Am J Clin Nutr. [Clinical Trial Research Support, N.I.H., Extramural Research Support, N.I.H., Intramural Research Support, U.S. Gov’t, Non-P.H.S.]. (2010) ;92: (1):123–9. |
Figures and Tables
Fig.1
Subjects cleaning flowchart in the study.
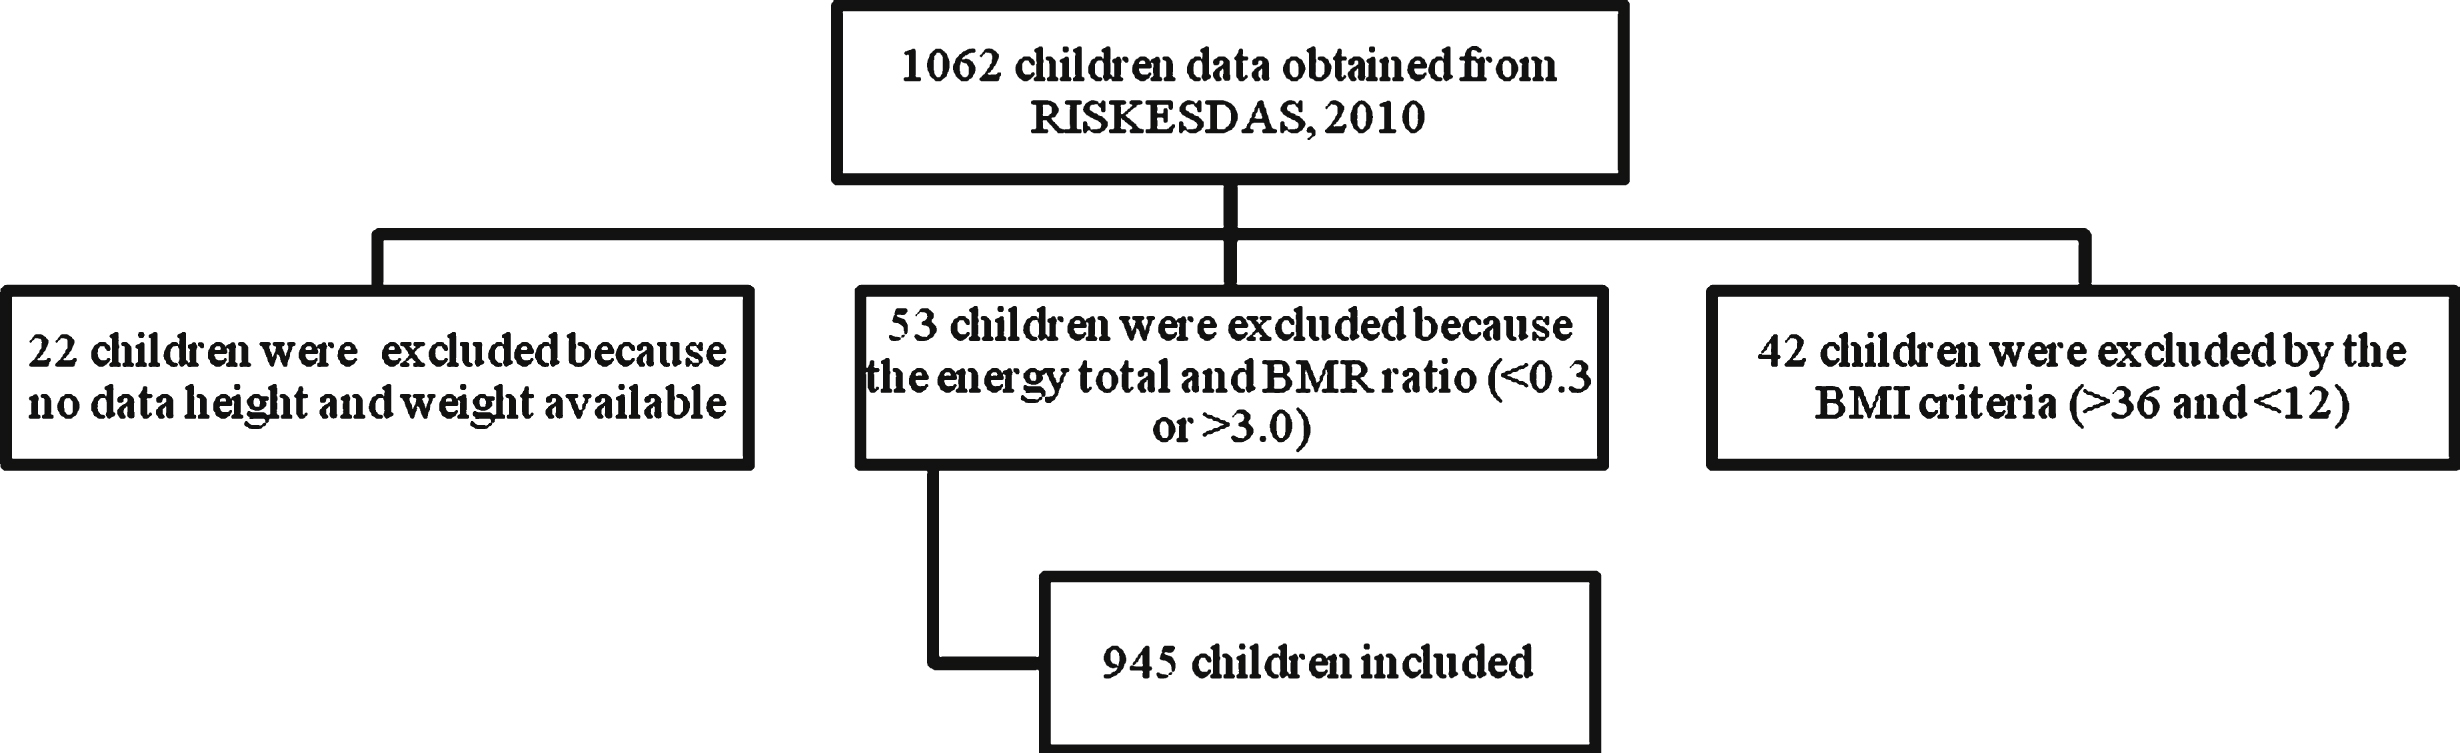
Table 1
Means (SD) and percentages of subject characteristics
| n sample (percentages | |
| or mean±SD) | |
| Gender | |
| Boys | 494 (52.3%) |
| Girls | 451 (47.7%) |
| Socioeconomic status (SES) | |
| Low | 610 (64.6%) |
| Medium | 198 (21.0%) |
| High | 137 (14.5%) |
| Age (years) | 9.00 ± 1.972 |
| 6 years old | 134 (14.2%) |
| 7–9 years old | 409 (43.3%) |
| 10–12 years old | 402 (42.5%) |
| Weight (kg) | 29.99 ± 10.00 |
| Height (cm) | 129.5 ± 14.81 |
| BMI for age (WHO 2007) | 17.63 ± 4.055 |
| Underweight | 72 (7.6%) |
| Normal | 565 (59.8%) |
| Overweight/Obese | 308 (32.6%) |
Table 2
Daily Nutrient Intake and BMI z score in 6–12 year old children in Jakarta and comparison with Indonesian DRI
| Nutrient | Total Population | % Recommended Intake‡ |
| n = 945 | ||
| Energy (kcal) | 1428 ± 641.5 (1334) | 79.3% |
| Carbohydrate (g) | 195.68 ± 96.4 (180) | 150.5% |
| Protein (g) | 50.57 ± 27.5 (54.5) | 112.4% |
| Fat (g)§ | 48.36 ± 31.4 (42.7) | 193.4% |
| Fiber (g) | 5.66 ± 4.27 (4.7) | 18.3% |
| Vitamin A (RE) | 539.68 ± 936 (238.5) | 107.9% |
| Vitamin B1 (mg) | 0.42 ± 0.31 (0.3) | 46.7% |
| Vitamin B2 (mg) | 0.78 ± 0.64 (0.6) | 86.7% |
| Vitamin B6 (mg) | 26.99 ± 53.3 (0.6) | 74% |
| Vitamin C (mg) | 425.75 ± 547.4 (7.0) | 59.9% |
| Calcium (mg) | 449.68 ± 664.9 (149.8) | 74.9% |
| Iron (mg) | 7.87 ± 29.8 (4.5) | 78.7% |
| Zinc (mg) | 5.89 ± 3.7 (4.9) | 52.6% |
| BMI z-score | 0.32 ± 1.8 (0.2) | – |
†All values are presented as means ± SD (median). ‡Recommended intake is based on Indonesian DRI (AKG 2004) and Dietary Reference Intakes 2005 by Institute of Medicine of The National Academies for carbohydrate and fiber. §For fat, the Acceptable Macronutrient Distribution Ranges from Institute of Medicine is used.
Table 3
Daily macronutrient, selected micronutrient intake, and BMI z-score across SES in total population†
| SES category Nutrient | Low SES | Medium SES | High SES | Recommended Intake‡ | P value* |
| n = 137 | N = 198 | n = 610 | |||
| Energy (kcal) | 1234a (54.3) | 1412b (45.3) | 1477b (25.8) | 1800–2050 | P < 0.001 |
| Carbohydrate (g) | 171a (8.2) | 196b (6.8) | 200b (3.8) | 130 | p < 0.05 |
| Protein (g) | 39a (2.3) | 46b (1.9) | 54.3c (1.1) | 45–50 | p < 0.001 |
| Fat (g)§ | 43 (2.7) | 48 (2.2) | 50 (1.3) | 25–35 | ns |
| Fiber (g) | 5.2 (0.4) | 5.6 (0.3) | 5.8 (0.2) | 25–31 | ns |
| Vitamin A (RE) | 364a (79.7) | 461ab (66.4) | 605b (37.8) | 500–600 | p < 0.01 |
| Vitamin B1 (mg) | 0.32a (0.03) | 0.38a (0.02) | 0.45b (0.01) | 0.9–1.0 | p < 0.001 |
| Vitamin B2 (mg) | 0.55a (0.05) | 0.71a (0.05) | 0.86b (0.03) | 0.9–1.0 | p < 0.001 |
| Vitamin B6 (mg) | 0.59a (0.05) | 0.75b (0.04) | 0.77b (0.02) | 1–1.3 | p < 0.01 |
| Vitamin C (mg) | 17.4a (4.5) | 21.5ab (3.8) | 30.9b (2.1) | 45–50 | p < 0.01 |
| Calcium (mg) | 260.6a (55.8) | 392.1ab (46.6) | 510.8b (26.5) | 600–1000 | p < 0.001 |
| Zinc (mg) | 4.5a (0.3) | 5.7b (0.3) | 6.3b (0.2) | 11.2–14 | p < 0.001 |
| Iron (mg) | 5.2 (2.6) | 6.05 (2.1) | 9.1 (1.2) | 10–13 | ns |
| BMI z-score | –0.029a (0.15) | 0.049a (0.12) | 0.49b (0.07) | – | p < 0.001 |
†All values are presented as means (SE), mean values was adjusted with gender and age. ‡Recommended intake is based on Indonesian DRI (AKG 2004) and Dietary Reference Intakes 2005 by Institute of Medicine of The National Academies for carbohydrate and fiber. §For fat, the Acceptable Macronutrient Distribution Ranges from Institute of Medicine is used. *p < 0.05 is considered as statistically significant.
Table 4
Daily Macronutrient, Selected Micronutrient Intake, and BMI z-score based on gender amongst Jakarta children†
| Gender Nutrient | Boys | Girls | Recommended | P value* |
| Intake‡ | ||||
| n = 494 | n = 451 | |||
| Energy (kcal) | 1473 (28.6) | 1380 (29.9) | 1800–2050 | p < 0.05 |
| Carbohydrate (g) | 200.8 (4.3) | 189.9 (4.5) | 130 | ns |
| Protein (g) | 52.43 (1.2) | 48.55 (1.3) | 45–50 | p < 0.05 |
| Fat (g)§ | 50.23 (1.4) | 46.32 (1.5) | 25–35 | ns |
| Fiber (g) | 5.93 (0.2) | 5.37 (0.2) | 25–31 | p < 0.05 |
| Vitamin A (RE) | 565.62 (41.9) | 511.28 (43.9) | 500–600 | ns |
| Vitamin B1 (mg) | 0.44 (0.01) | 0.39 (0.01) | 0.9–1.0 | p < 0.05 |
| Vitamin B2 (mg) | 0.83 (0.03) | 0.74 (0.03) | 0.9–1.0 | p < 0.05 |
| Vitamin B6 (mg) | 0.75 (0.03) | 0.73 (0.03) | 1–1.3 | ns |
| Vitamin C (mg) | 28.03 (2.4) | 25.86 (2.5) | 45–50 | ns |
| Calcium (mg) | 457.4 (29.4) | 441.3 (30.7) | 600–1000 | ns |
| Iron (mg) | 7.09 (1.3) | 8.72 (1.4) | 10–13 | ns |
| Zinc (mg) | 6.09 (0.2) | 5.68 (0.2) | 11.2–14 | ns |
| BMI z-score | 0.36 (0.1) | 0.28 (0.1) | – | ns |
†All values are presented as means (SE), mean values was adjusted with age and SES. ‡Recommended intake is based on Indonesian DRI (AKG 2004) and Dietary Reference Intakes 2005 by Institute of Medicine of The National Academies for carbohydrate and fiber. §For fat, the Acceptable Macronutrient Distribution Ranges from Institute of Medicine is used. *p < 0.05 is considered as statistically significant.
Table 5
Daily Macronutrient, Selected Micronutrient Intake, and BMI z-score based on age group amongst Jakarta children†
| Age group Nutrient | 6 years | 7–9 years | 10–12 years | Recommended | P value* |
| Intake‡ | |||||
| n = 134 | n = 409 | n = 402 | |||
| Energy (kcal) | 1456 (55.5) | 1421 (31.8) | 1427 (32) | 1800–2050 | ns |
| Carbohydrate (g) | 197.3 (8.4) | 194.8 (4.8) | 196.03 (4.8) | 130 | ns |
| Protein (g) | 52.7 (2.4) | 50.8 (1.4) | 49.6 (1.4) | 45–50 | ns |
| Fat (g)§ | 49.9 (2.7) | 47.8 (1.6) | 48.3 (1.6) | 25–35 | ns |
| Fiber (g) | 4.9 (0.4) | 5.7 (0.2) | 5.8 (0.2) | 25–31 | ns |
| Vitamin A (RE) | 574.5 (80.9) | 576.7 (46.3) | 490.45 (46.7) | 500–600 | ns |
| Vitamin B1 (mg) | 0.46 (0.03) | 0.41 (0.02) | 0.4 (0.02) | 0.9–1.0 | ns |
| Vitamin B2 (mg) | 0.94a (0.06) | 0.82a (0.03) | 0.69b (0.03) | 0.9–1.0 | p < 0.001 |
| Vitamin B6 (mg) | 0.73 (0.05) | 0.76 (0.03) | 0.73 (0.03) | 1–1.3 | ns |
| Vitamin C (mg) | 37.2 (4.6) | 26 (2.6) | 24.5 (2.7) | 45–50 | ns |
| Calcium (mg) | 647.4a (56.9) | 467.2b (32.6) | 365.98b (32.8) | 600–1000 | p < 0.001 |
| Iron (mg) | 7.9 (2.6) | 9.2 (1.5) | 6.4 (1.5) | 10–13 | ns |
| Zinc (mg) | 6.1 (0.3) | 5.8 (0.2) | 5.8 (0.2) | 11.2–14 | ns |
| BMI z-score | 0.57 (0.2) | 0.38 (0.1) | 0.18 (0.1) | – | ns |
†All values are presented as means (SE) adjusted with gender and SES. ‡Recommended intake is based on Indonesian DRI (AKG 2004) and Dietary Reference Intakes 2005 by Institute of Medicine of The National Academies for carbohydrate and fiber. §For fat, the Acceptable Macronutrient Distribution Ranges from Institute of Medicine is used.


