
Prognostic Impact of Lymphnode Metastases in Patients with Metastatic Renal Cell Carcinoma
Abstract
BACKGROUND:
Lymphnode metastases (LMN) in metastatic renal cell carcinoma (mRCC) has been associated with an unfavourable prognosis. However, the prognostic impact of LNM in mRCC in context of other solid organ metastases and throughout subsequent therapeutic lines is not well-defined.
OBJECTIVE:
This retrospective single-center analysis was designed to elucidate the impact of LNM in the context of other solid organ metastases and throughout subsequent therapeutic lines.
METHODS:
mRCC patients (pts) at our center were analysed (observation period, 04/00-03/16). Primary endpoint was overall survival (OS) and the impact of line of therapy as a co-variate. Pts were grouped into: with LNM [LNM(+)], without LNM [LNN(–)]. Subgroup analyses of LNM(+) was performed including the subgroup LNM(+) and other solid organ metastases [LNM(+) other] and LNM(+) without other solid organ metastases [LMN(+) only].
RESULTS:
383/401 mRCC pts were eligible. 318 (83.2%), 230 (60.1%) and 154 (40.5%) pts received 1stL, 2ndL and 3rdL medical treatment, respectively. In the overall population OS was 40.1 months (95%CI: 32.7–47.4), with superior OS in LNM(–) compared to LNM(+) pts (log rank, HR 1.7, 95%-CI 1.3-2.2, p < 0.001). This effect was maintained across lines of therapies. LNM(+) only had a similar risk of death as LNM(–) pts (HR 1.2, 95%-CI 0.8–2.0, p = 0.4), while the risk of death was significantly increased for LNM(+) other compared to LNM(–) (HR 1.9, 95%-CI 1.5–2.6, p < 0.001).
CONCLUSION:
LNM(+) in mRCC is associated with a poor OS. However, impaired OS in LNM(+) might be associated with the presence of other solid organ metastases rather than with the existence of LNM alone. Further studies are warranted to support this hypothesis.
INTRODUCTION
Our understanding of the underlying biology of a metastatic tumor disease is crucial in therapeutic decision-making as well as patient counselling. Additionally, to histology, molecular, genetic and other clinical parameters the pattern and location of metastatic disease often guide treatment decisions, also in renal cell carcinoma (RCC) [1]. Especially lymph node metastases (LNM) have been a subject of discussion over decades, since local lymph node invasion might not contradict a curative approach while distant LNM are mostly an indicator for widespread disease and palliative treatment. In this sense, previous studies critically discussed radical lymph node dissection during nephrectomy not only as diagnostic but also therapeutic approach with curative intend [2, 3].
In metastatic RCC (mRCC) a recent retrospective analysis of 10105 patients identified LNM as independent predictor of impaired overall survival (OS) [4]. It has also been postulated that LNM located below the diaphragm are associated with a worse outcome when treated with targeted therapy than LNM above the diaphragm [3]. However, many questions regarding LNM have not been addressed. Therefore, this retrospective analysis was designed to elucidate the impact of LNM in the context of other solid organ metastases and throughout subsequent therapeutic lines.
MATERIAL AND METHODS
Patients and treatment
This study is a retrospective single-center analysis. Patients with mRCC treated with targeted agents in our department were identified retrospectively from medical records. All patients with metastatic disease within the observation period from April 2000 to March 2016 at the Hannover Medical School were eligible. Synchronous metastatic disease was defined as diagnosis of distant metastases within 3 months of primary RCC diagnosis. Nephrectomy was performed at initial diagnosis with curative intention or cytoreductive in metastatic disease.
Treatment and therapeutic monitoring were conducted according to local standards of care, which included CT scans every 3 months. Clinical progression free survival (cPFS) was defined either by radiological evidence of disease progression, clinical progression or death from any cause. Only patients who received medical treatment in the respective line of therapy were eligible for corresponding subgroup analyses.
Clinical data was extracted from medical charts and collected in a database. Data were assessed by physicians and data managers. Last database update was performed in March 2016. Patients' data were assessed in an anonymized manner in concordance with recommendations of the local ethic committee and in concordance with the declaration of Helsinki in its latest revised version (Nr.: 3171-2016).
Statistical analysis
Overall survival (OS) was defined as primary endpoint for this study. Patients were grouped for analysis: without LNM [LNM(–)] and with LNM [LNM(+)]. Patients with LNM(+) were further sub-grouped into LNM(+) with other solid organ metastases [LNM(+) other] and LNM(+) without solid organ metastases [LNM(+) only]. Prognostic impact and OS were analysed in regard to 1st, 2nd and 3rd line of therapy (1stL, 2ndL, 3rdL).
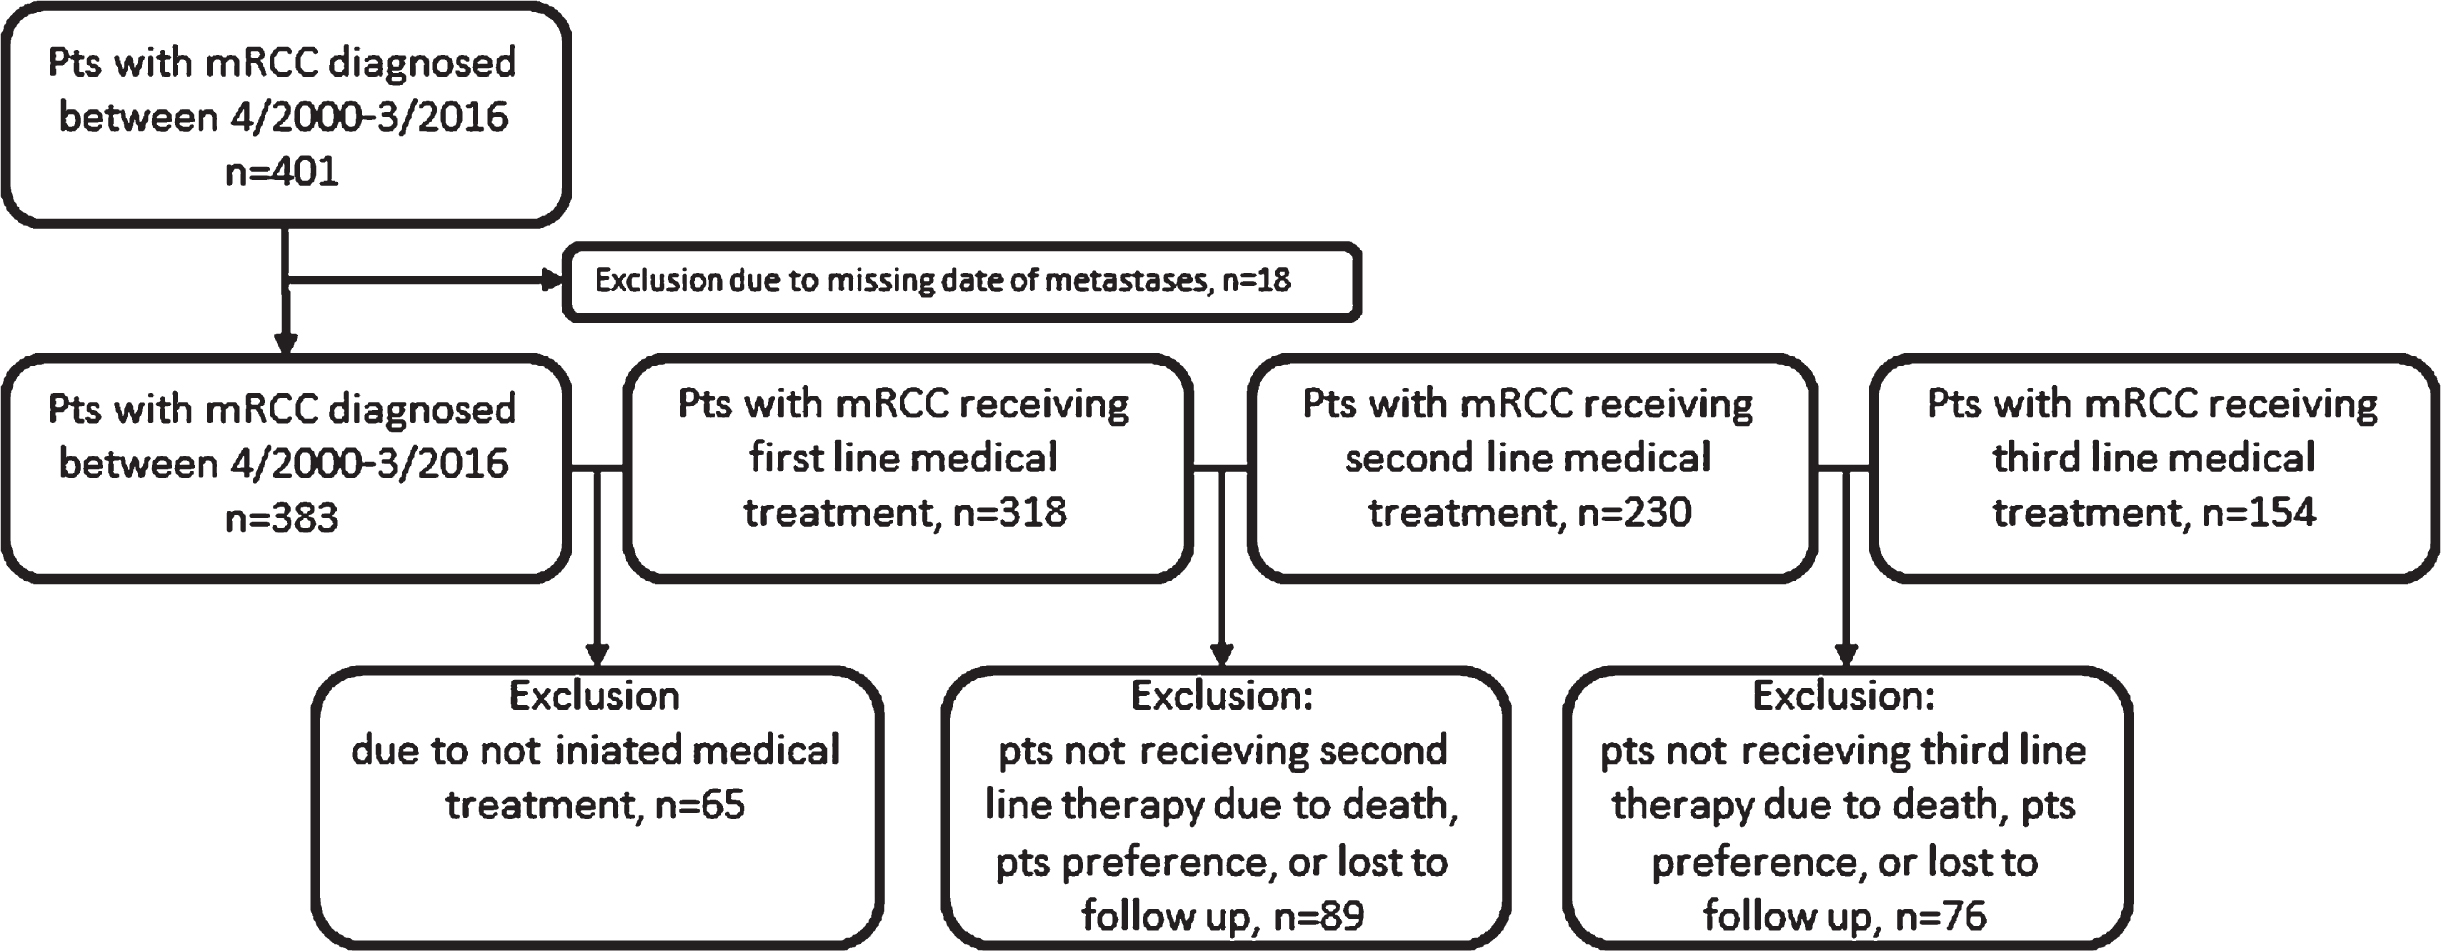
Patients were excluded from analysis when date of metastatic disease was missing. In subsequent analysis of patients receiving medical treatment, patients who did not receive medical treatment due to death, patient preference or lost to follow up were excluded (Fig. 1).
Fig. 1
Consort diagram.
OS was calculated by Kaplan-Meier analysis and subgroups were compared by log-rank test. Uni- and multivariate Cox regression models were conducted to analyse the association between survival and LNM groups and subgroups. OS was defined from first diagnosis of metastatic disease or from the time of treatment initiation until death or last follow up as applicable. Patients lost in follow up were censored at time of last documented follow up.
SPSS 21.0 was used for statistical analysis. A two-sided p-value below 0.05 was considered as statistically significant.
RESULTS
Patient characteristics
Overall, 401 patients with mRCC were identified within the observation period. Thereof, 383 patients were eligible for analysis and 318 (83.2%), 230 (60.1%) and 154 (40.5%) received 1stL, 2ndL and 3rdL medical treatment, respectively (Fig. 1).
Median age was 61.6 (range 26.4–89.6) years with a predominance of clear cell histology (77.0%). 94.0%of patients previously underwent nephrectomy. The performance status defined by ECOG was ≤1 in 68.9%. While 36.8%were diagnosed with synchronous metastatic disease, median time from initial diagnosis to metastatic RCC was 7.2 (range 0–341.9) months. Numbers of metastatic organ sites ranged from 0 to 8. Pulmonary (50.7%), liver (31.3%) and bone (28.5%) were the most frequent metastases. LMN(+) accounted for 120 (31.3%) patients of whom LMN(+) others and LMN(+) only occurred in 92 (24.0%) and 28 (7.3%) patients. Patient characteristics are summarized in Table 1.
Table 1
Base line characteristics at diagnosis of metastatic RCC
| Parameter | All patients (n = 383) |
| Median age at diagnosis mRCC, years (range) | 61.6 (26.4–89.6) |
| Males, n (%) | 261 (68.1) |
| Nephrectomy, n (%) | 360 (94) |
| Histology | |
| clear cell, n (%) | 295 (77) |
| Non clear cell, n (%) | 45 (11.8) |
| NE, n (%) | 43 (11.2) |
| Performance Status | |
| ECOG≤1, n (%) | 264 (68.9) |
| ECOG≥2, n (%) | 21 (5.5) |
| NE, n (%) | 98 (25.6) |
| Synchronous metastatic diseases, n (%) | 141 (36.8) |
| Time from diagnosis RCC to metastatic RCC, median (range) months | 7.2 (0–341.9) |
| MSKCC | |
| favorable, n (%) | 37 (9.7) |
| intermediate, n (%) | 114 (29.8) |
| poor, n (%) | 13 (3.4) |
| NE, n (%) | 219 (57.2) |
| Median numbers of metastatic organ sites, n (range) | 1 (0–8) |
| Pts. with pulmonary metastasis, n (%) | 194 (50.7) |
| Pts. with liver metastasis, n (%) | 120 (31.3) |
| Pts. with bone metastasis, n (%) | 109 (28.5) |
| Pts. with lymphnode metastasis and other sites, n (%) | 92 (24) |
| Pts. with lymphnode metastasis only, n (%) | 28 (7.3) |
Patient characteristics at initiation of subsequent medical treatment lines
The median number of metastatic sites was significantly higher in LNM(+) at 1stL, 2nd L and 3rd L (p≤0.01, respectively p≤0.01, p≤0.01, see Table 2). A significant difference in cPFS in favour of LNM(–) was seen in patients receiving 1stL and 3rdL. A significantly larger number of non clear cell RCC (non-ccRCC) was detected in LNM(+) only subgroup in 1stL and 3rdL, as well as in LNM(+) vs. LNM(–) in 2ndL. Furthermore, discontinuation of treatment was statistically more frequent in LNM(+) only compared with LNM(+) other in 1stL and 2ndL. Median age at initiation of medical treatment did not show a significant difference between LNM(–) and LNM(+) at any line of medical treatment as well as performance status measured by ECOG, usage of TKI or discontinuation of treatment due to an adverse event (Table 2).
Table 2
Treatment characteristics and differences for LNM(–) and LNM(+) groups, as well as for LNM(+) other and LNM(+) only subgroups corresponding to medical treatment line
| Parameter | All | LNM(–) | LNM(+) | p-Value* | LNM(+) other | LNM(+) only | p-Value* |
| 1st line medical treatment, n | 319 | 184 | 135 | 111 | 24 | ||
| Histology, non-ccRCC, n (%) | 41 (12.9) | 20 (10.9) | 21 (15.6) | 0.11 | 14 (12.6) | 7 (29.2) | 0.03 |
| RCC diagnosis to treatment < 1 year, n (%) | 141 (44.2) | 80 (43.5) | 61 (45.2) | 0.75 | 58 (52.7) | 15 (62.5) | 0.38 |
| Median age, years (range) | 61.9 (26.8–89.9) | 62.5 (26.8–85.8) | 60 (37.2–89.8) | 0.13 | 61.1 (37.2–84.5) | 57.8 (45.6–89.8) | 0.93 |
| ECOG≤1, n (%) | 219 (70.7) | 129 (70.1) | 90 (66.7) | 0.75 | 74 (92.5) | 6 (94.1) | 0.81 |
| Median No. of metastatic sites, n (range) | 2 (0–8) | 2 (0–6) | 2 (1–8) | < 0.01 | 3 (2–8) | 1 (1–1) | < 0.001 |
| MSKCC≥1, n (%) | 109 (34.2) | 56 (30.4) | 53 (39.3) | 0.12 | 44 (39.6) | 9 (37.5) | 0.41 |
| TKI, n (%) | 228 (71.5) | 132 (71.7) | 96 (71.1) | 0.7 | 76 (68.5) | 20 (83.3) | 0.15 |
| mTOR, n (%) | 13 (4.1) | 8 (4.3) | 5 (3.7) | 0.49 | 4 (3.6) | 1 (4.2) | 0.63 |
| Checkpoint-Inhibitor, n (%) | 4 (1.3) | 1 (0.5) | 3 (2.2) | 0.21 | 3 (2.7) | 0 (0) | 0.55 |
| cPFS, median (95%-CI), months | 9.3 (7.2–11.4) | 10.2 (7.3–13.1) | 7.0 (4.8–9.3) | 0.01 | 7.0 (4.7–9.3) | 12 (3.8–20.2) | 0.88 |
| Discontinuation due to AE, n (%) | 59 (18.5) | 38 (20.7) | 21 (15.6) | 0.52 | 14 (12.6) | 7 (29.2) | 0.04 |
| 2nd line medical treatment, n (%) | 230 (72.1) | 114 | 116 | 100 | 16 | ||
| Histology, non-ccRCC, n (%) | 30 (13.0) | 10 (8.8) | 20 (17.2) | 0.04 | 15 (15.0) | 5 (31.3) | 0.09 |
| Median age, years (range) | 61.8 (29.1–85.2) | 62.8 (29.1–85.2) | 59.9 (38.5–85.0) | 0.13 | 60.0 (38.5–85.0) | 59.1 (45.7–80.8) | 0.79 |
| ECOG≤1, n (%) | 215 (93.5) | 107 (93.9) | 108 (93.1) | 0.24 | 92 (92.0) | 16 (100.0) | 0.24 |
| Median No. of metastatic sites, n (range) | 2 (0–8) | 2 (0–5) | 3 (1–8) | < 0.01 | 3 (2–8) | 1 (1–1) | < 0.001 |
| MSKCC≥1, n (%) | 73 (31.7) | 34 (29.8) | 39 (33.6) | 0.13 | 32 (32) | 7 (43.8) | 0.18 |
| TKI, n (%) | 123 (53.5) | 65 (57) | 58 (50) | 0.46 | 47 (47.0) | 11 (68.8) | 0.11 |
| mTOR, n (%) | 85 (37.0) | 38 (33.3) | 47 (40.5) | 0.28 | 42 (42) | 5 (31.3) | 0.30 |
| Checkpoint-Inhibitor, n (%) | 3 (1.3) | 1 (0.9) | 2 (1.7) | 0.51 | 2 (2) | 0 (0) | 0.74 |
| cPFS, median (95%-CI), months | 6.6 (5–8.2) | 8.3 (5.3–11.3) | 5.4 (4–6.8) | 0.34 | 6.0 (4.5–7.5) | 5.2 (0.2–10.2) | 0.91 |
| Discontinuation due to AE, n (%) | 41 (17.8) | 21 (18.4) | 20 (17.1) | 0.83 | 14 (14.0) | 6 (37.5) | 0.02 |
| 3rd line medical treatment, n (%) | 155 (48.6) | 76 | 79 | 73 | 6 | ||
| Histology, non-ccRCC, n (%) | 18 (11.6) | 7 (9.2) | 11 (13.9) | 0.26 | 8 (11.0) | 3 (50.0) | 0.01 |
| Median age, years (range) | 60.25 (30–84) | 62.5 (30–84) | 58.9 (39–82) | 0.27 | 58.3 (39.0–82.0) | 69.2 (51.0–79.0) | 0.79 |
| ECOG≤1, n (%) | 145 (93.5) | 70 (92.1) | 65 (95) | 0.57 | 69 (94.5) | 6 (100.0) | 0.56 |
| Median No. of metastatic sites, n (range) | 2 (0–7) | 2 (0–6) | 3 (1–7) | < 0.01 | 3 (2–7) | 1 (1–1) | < 0.001 |
| MSKCC≥1, n (%) | 49 (31.6) | 22 (28.9) | 27 (34.2) | 0.25 | 24 (32.9) | 3(50) | 0.45 |
| TKI, n (%) | 89 (57.4) | 41 (53.9) | 48 (60.8) | 0.59 | 43 (58.9) | 5 (83.3) | 0.24 |
| mTOR, n (%) | 48 (31.0 | 26 (34.2) | 22 (27.8) | 0.24 | 21 (28.8) | 1 (16.7) | 0.46 |
| Checkpoint-Inhibitor, n (%) | 6 (3.9) | 4 (5.3) | 2 (2.5) | 0.32 | 2 (2.7) | 0 (0) | 0.85 |
| cPFS, median (95%-CI), months | 5.5 (4.1–7) | 7.1 (4.4–9.8) | 3.6 (4–4.1) | 0.001 | 3.6 (3.1–4.1) | 3.6 (0.0–7.2) | 0.41 |
| Discontinuation due to AE, n (%) | 29 (18.7) | 16 (21.1) | 13 (16.5) | 0.07 | 12 (16.4) | 1 (16.7) | 0.99 |
*log rank analysis; TKI: Tyrosine Kinase Inhibition; cPFS: clinical Progression Free Survival, defined by time form treatment start to clinical or radiographic progression; AE: Adverse Event.
Overall survival and association with LNM(+)
Measured from diagnosis of mRCC, OS was 40.1 (95%CI: 32.7–47.4) months for the overall population. A significant improvement in OS by 20.1 month (p < .001) was shown for LNM(–) compared to LNM(+) at diagnosis of mRCC, which was consistent over the different lines of therapy assessed (Difference in median OS LNM(+) vs. LNM(–): 12.2month in 1stL, p = 0.02; 15.1 month in 2nd L, p =0.03; 12.1 month in 3rd L, p = 0.01; Fig. 2A and 2B). In subgroup analysis for LMN(+) only compared to LMN(+) other no statistically significance could be identified at diagnosis of mRCC as well as for 1stL, 2ndL and 3rdL. (Table 3, Fig. 2C and 2D).
Fig. 2
Kaplan Meier curves comparing OS in LNM(+) with LNM(–) at baseline (A) and from start of 1stL (B), as well as Kaplan Meier curves comparing OS in LNM(+) other with LNM(+) only at baseline (C) and from start of 1stL (D).
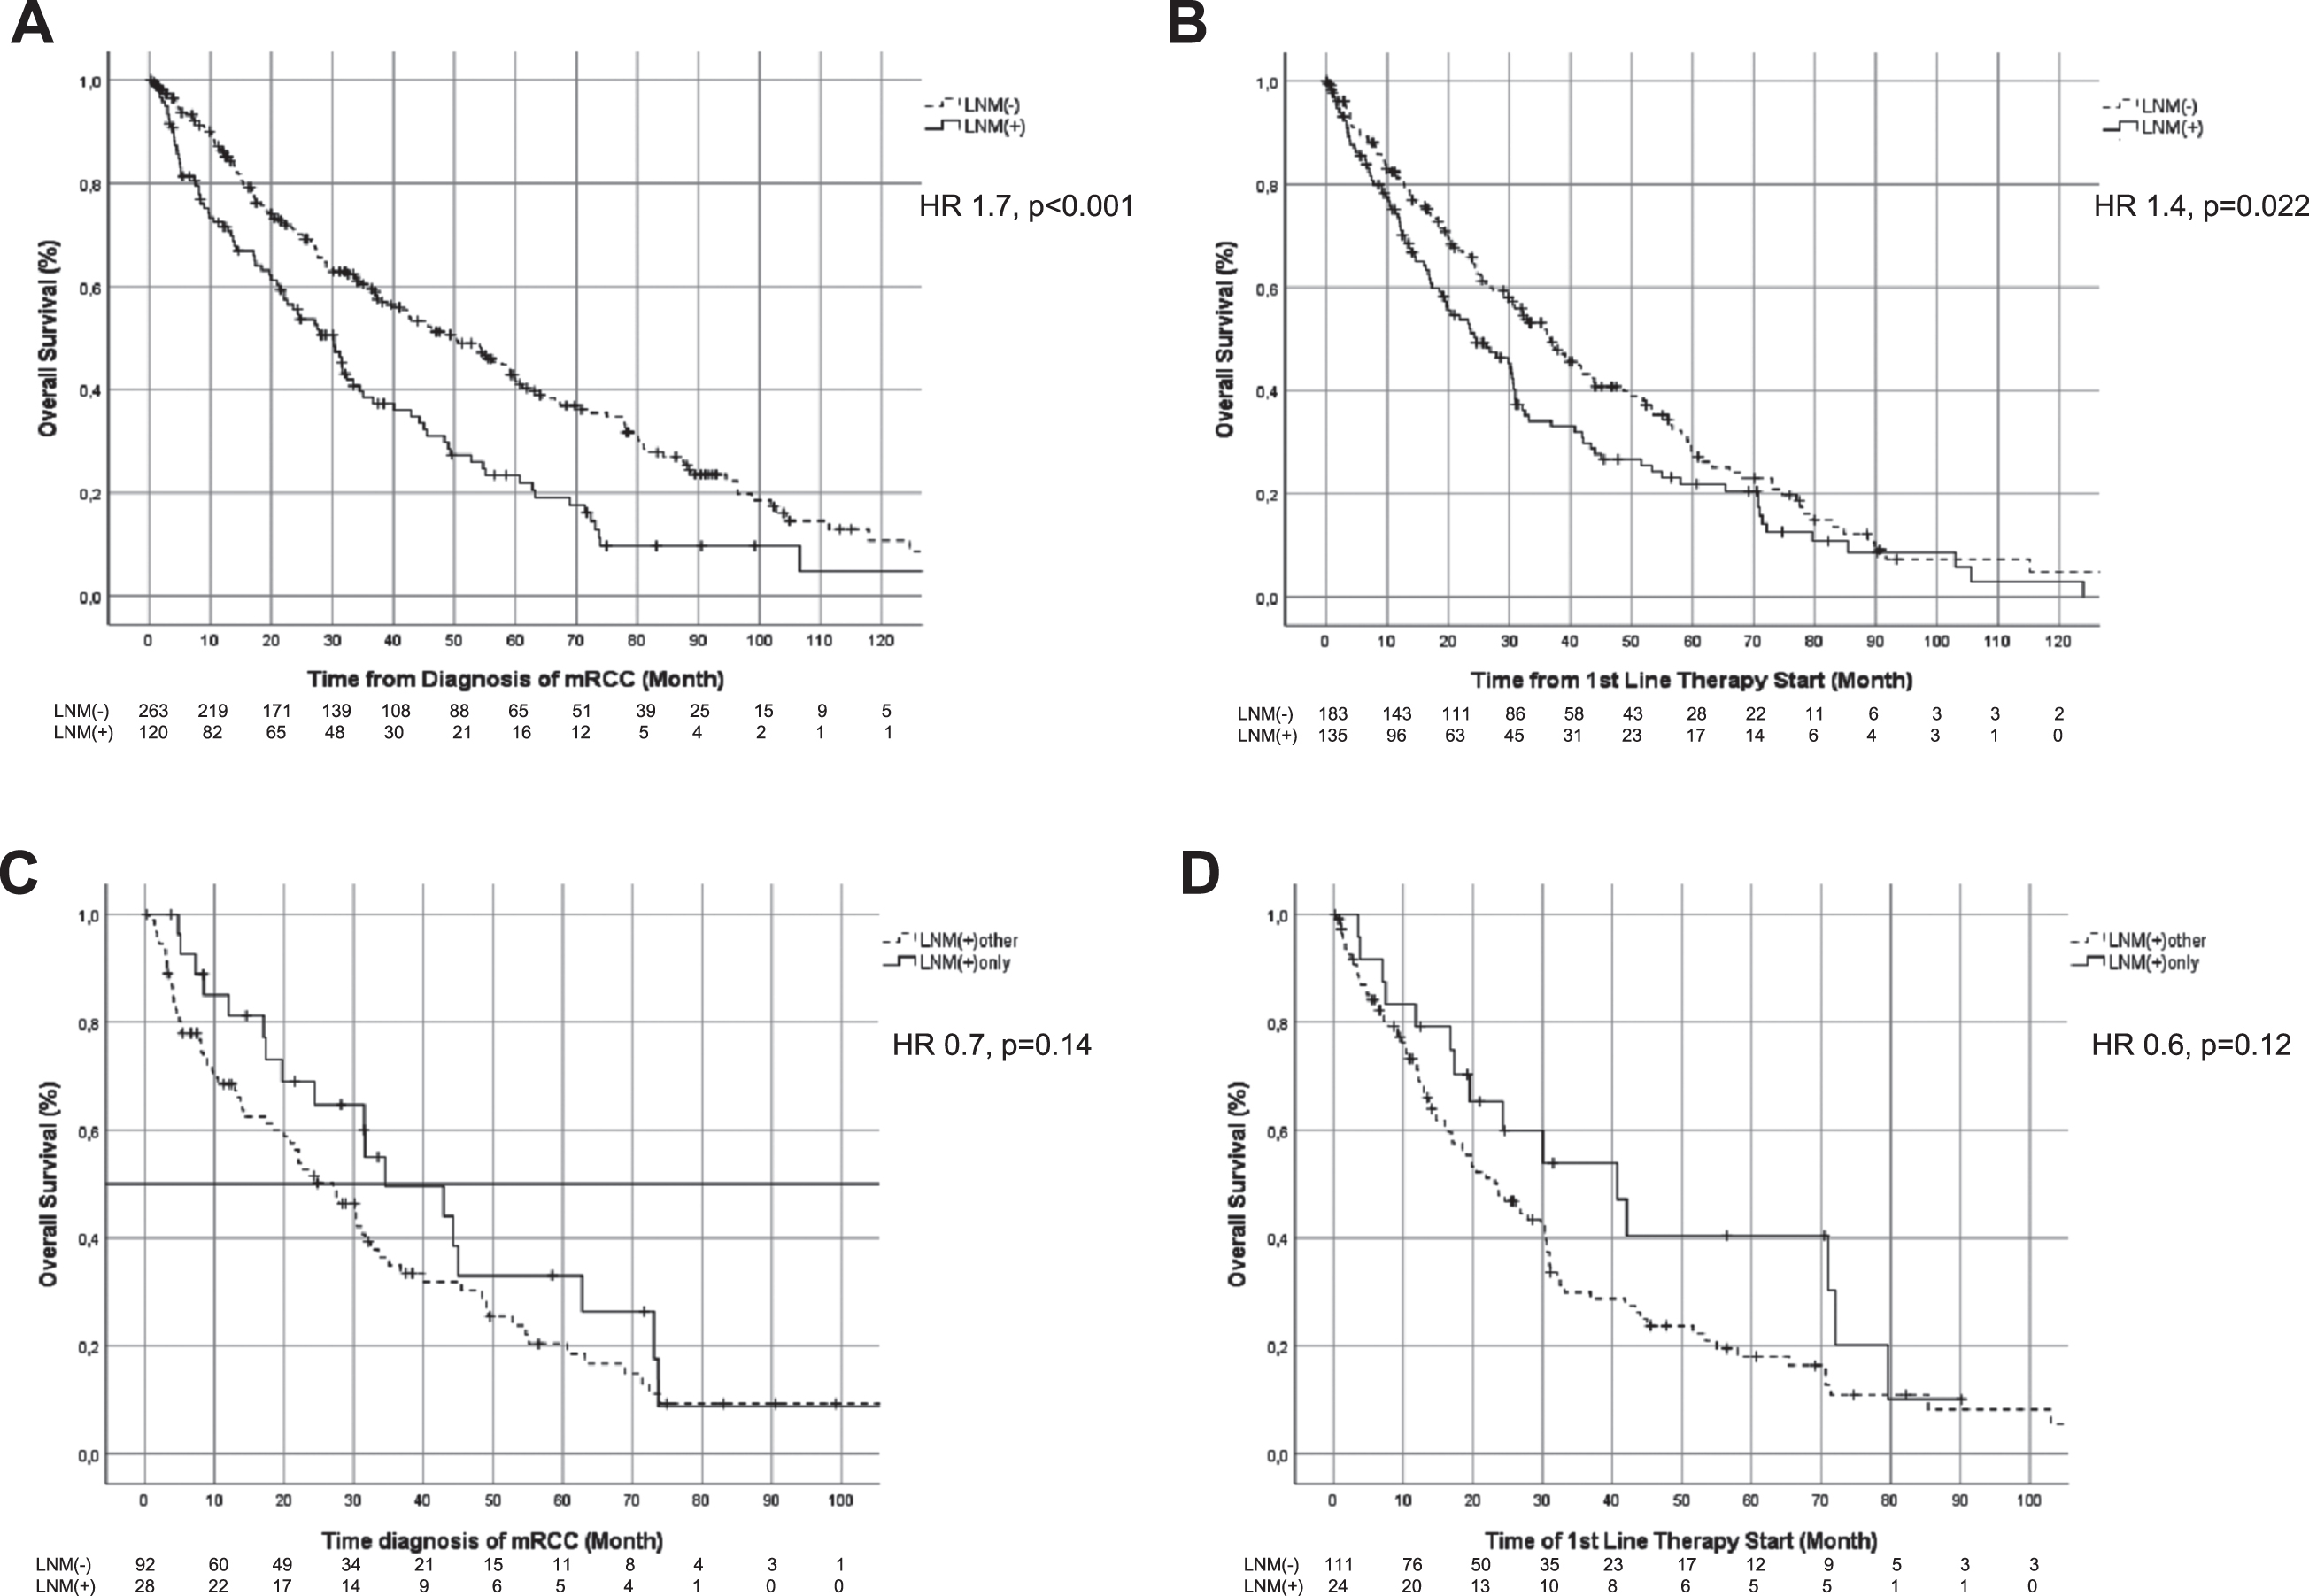
Table 3
Overall survival of patients with mRCC according to line of therapy with corresponding Log-rank analyses of LNM(–) vs. LNM(+) and subgroup of LNM(+) other vs. LNM(+) only
| Parameter | All patients, median OS (95%-CI), n | LNM(–), median OS (95%-CI), n | LNM(+), median OS (95%-CI), n | LNM(+) other, median OS (95%-CI), n | LNM(+) only, median OS (95%-CI), n | P-Value (Log rank) |
| Diagnosis mRCC –death | 40.1 (32.7–47.4), 383 | 50.4 (40.1–60.7), 263 | 30.3 (24.3–36.3), 120 | – | – | < 0.001 |
| Subgroups | – | – | 27.1 (19.7–34.5), 92 | 34.5 (13.1–55.9), 28 | 0.137 | |
| 1st line –death | 30.7 (25.2–36.2), 318 | 36.8 (29.8–43.8), 183 | 24.6 (16.4–32.8), 135 | – | – | 0.021 |
| Subgroups | – | – | 23.5 (16.4–30.6), 111 | 40.7 (20–61.4), 24 | 0.117 | |
| 2nd line –death | 22.5 (16.2–28.8), 230 | 29.7 (18.0–41.4), 114 | 14.6 (10.6–18.6), 116 | – | – | 0.032 |
| Subgroups | – | – | 14.6 (10.7–18.5), 100 | 28.2 (5.7–50.7), 16 | 0.491 | |
| 3rd line –death | 18.2 (14–22.5), 154 | 24.5 (10.4–38.6), 75 | 12.4 (6.8–18), 78 | – | – | 0.01 |
| Subgroups | – | – | 13.1 (6–20.2), 72 | 12 (9.6–14.4), 6 | 0.626 |
Footnote: Overall survival defined by survival from diagnosis until death, respectively start of medical treatment until death.
Multivariate analysis showing LNM(+) as independent predictor for OS
In univariate analysis LNM(+) vs. LNM(–) and in subgroups LNM(+) other vs. LNM(–) but not LNM(+) only vs. LNM(–) were associated with decreased OS. In multivariate analysis we identified LNM(+) other as independent risk factors for diminished OS at baseline and 1stL. For patients in 2ndL and 3rdL multivariate analysis identified LNM(+), LNM(+) other and LNM(+) only as factors for diminished OS (Table 4).
Table 4
Cox regression analysing impact of LNM(+) and subgroups LNM(+) other and LNM(+) only at different time points on OS
| Univariate HR (95%-CI) | p-Value | Multivariate HR (95%-CI) | p-Value | |
| OS (mRCC-death) | ||||
| LNN(+) vs. LNM(–) | 1.7 (1.3–2.2) | < 0.001 | 1.4 (0.9–2.0) | 0.13 |
| Subgroup | ||||
| LNM(+) other vs. LNM(–) | 1.9 (1.5–2.6) | < 0.001 | 1.7 (1.1–2.6) | 0.01 |
| LNM(+) only vs. LNM(–) | 1.2 (0.8–2.0) | 0.40 | 0.6 (0.3–1.4) | 0.24 |
| OS (1st line-death) | ||||
| LNN(+) vs. LNM(–) | 1.4 (1.0–1.8) | 0.022 | 1.4 (0.9–2.1) | 0.10 |
| Subgroup | ||||
| LNM(+) other vs. LNM(–) | 1.5 (1.1–2.0) | 0.006 | 1.8 (1.2–2.6) | 0.008 |
| LNM(+) only vs. LNM(–) | 0.9 (0.5–1.6) | 0.932 | 0.5 (0.2–1.3) | 0.14 |
| OS (2nd line-death) | ||||
| LNN(+) vs. LNM(–) | 1.4 (1.0–2.0) | 0.026 | 1.7 (1.2–2.4) | 0.002 |
| Subgroup | ||||
| LNM(+) other vs. LNM(–) | 1.5 (1.1–2.0) | 0.023 | 1.7 (1.2–2.4) | 0.002 |
| LNM(+) only vs. LNM(–) | 1.3 (0.7–2.6) | 0.415 | 2.2 (1.0–4.7) | 0.04 |
| OS (3rd line-death) | ||||
| LNN(+) vs. LNM(–) | 1.6 (1.1–2.4) | 0.011 | 1.8 (1.2–2.6) | 0.007 |
| Subgroup | ||||
| LNM(+) other vs. LNM(–) | 1.7 (1.1–2.4) | 0.011 | 1.7 (1.1–2.5) | 0.01 |
| LNM(+) only vs. LNM(–) | 1.6 (0.6–4.4) | 0.403 | 5.9 (1.5–23.6) | 0.01 |
Footnote: Multivariate analysis for OS at baseline and for 1stL was corrected for histology, time to 1st line medical treatment, LDH above upper limits of normal, haemoglobin below lower limits of normal, Calcium above upper limits of normal, ECOG equal or above one. Multivariate analysis for 2ndL and 3rdL was corrected for histology, presence of liver or bone metastases as well as for ECOG equal or above one.
DISCUSSION
LNM in mRCC is postulated to be an unfavourable predictor of OS. This study was designed to further characterise the impact of LNM in mRCC in the context of other solid organ metastases and throughout palliative treatment lines.
In the overall population of 383 mRCC patients our results showed inferior OS for patients with LNM, thereby reproducing previous findings [3]. In context of study population size our Hazard ratio for OS in LNM(+) vs. LNM(–) of 1.7 (95%-CI: 1.3–2.2) is higher compared to one of the largest studies on metastatic sites in 10105 mRCC patients showing a Hazard ratio of 1.04 (95%-CI: 0.98–1.11). This might be explainable by a larger proportion of patients treated with checkpoint inhibition as 1stL in this very recent study (6.1%vs. 1.3%) [4]. The Hazard ratio of one of the most detailed studies on LNM in 2996 mRCC patients treated only with targeted therapy in first line setting until 2013 is comparable to ours with 1.3 (95%-CI: 1.2–1.5) [3]. Generally, application of checkpoint inhibition and treatment period differ between these study populations and our data. However, age and histologic subtype are comparable in cross-study analysis, while our study inherits less patients with brain metastases. Other factors can not be reliably compared due to a larger amount of missing data in this retrospective analysis. Our median OS was generally higher compared to these two studies. We found a median OS in LNM(–) of 50.4 (95%-CI: 40.1–60.7) vs. 30.3 (95%–CI: 24.3–36.3) months in LNM(+), while Kroeger et al. reported a median OS of 24.0 vs. 16.0 months and Dudani et al. showed a median OS of 21.4 months in LNM(+) [3, 4]. Cross-study comparison of differences in median OS remains difficult and various some factors as outlined above may impact results. Differences in the observation period with limited therapeutic options as well as selection bias of our singlecentre analysis are likely to contribute.
Previously undescribed, our results demonstrate that LNM(+) remains a predictor of poor OS in subsequent therapeutic lines. Median OS is significantly worse in LNM(+) showing an increased risk for death with a Hazard ratio of 1.7 (95%-CI: 1.3–2.2). This finding was maintained in 1stL, 2ndL and 3rdL. It is notable that LNM(+) and LNM(–) groups as well as subgroups are well distributed except for histology. Non-ccRCC are markedly found in the LNM(+) only subgroup. It is questionable whether this is a bias or a histology driven difference in metastatic pattern.
Most interestingly, to our knowledge this is the first study that showed an association of impaired OS with LNM(+) in the presence of other metastatic sites. Multivariate analysis showed a significant increase in risk of death for LNM(+) other vs. LNM(–) but not for LNM(+) only vs. LNM(–) at baseline and 1stL. This is especially noteworthy since the Hazard ratio for death in LNM(+) is not identified as an independent predictor of OS in the overall population and 1stL. This pattern is not consistent in subsequent therapeutic lines (2nd L, 3rd L), where LNM(+) regardless of LNM(+) or LNM(+) only shows to be an independent predictor of worse OS in our analysis. These results generally support LNM as predictor of inferior OS, but more importantly findings in the overall population and 1stL population allow to postulate that negative prognostic impact of LNM(+) might be largely explained by the presence of other solid organ metastases. Therefore, LNM(+) only might not be as unbeneficial as previously suggested [3].
There are very few studies investigating LNM in the context of other solid organ metastases. Kroeger et al. as well as Dudani and collegues did not differentiate between LNM(+) other and LNM(+) only [3, 4]. A study of patients who underwent nephrectomy with tumor thrombectomy from 1971 to 2012 showed synchronous metastatic disease in 44%of patients. Herein, isolated LNM(+) was associated with inferior cancer specific survival compared to other isolated metastasis [5]. Comparison of previous study results to our results is difficult, but it has to be mentioned that there is hardly any data contradicting our results. On the one hand there are studies showing that surgical approach to isolated loco-regional recurrent LNM can generate durable progression-free survival, while on the other hand data implies that especially patients with multiple organs affected by multifocal disease are more likely to have poor OS [6, 7]. Both support our notion that LNM(+) only might not be as strongly associated with poor outcome as previously suggested, and potentially needs to be considered more as an oligometastatic biological state.
Following our clinical findings, it raises the question of underlying molecular alterations explaining differences in patient outcome. Although our study does not allow further elucidation of this research question, previous findings suggest that LNM might be associated with other molecular findings than usual mRCC. For example, a large retrospective study of molecular alterations postulates that LNM in mRCC is often independent of typical von-Hippel-Lindau loss and characterized by low CAIX expression [8]. Other data also indicates that c-MET might play a decisive role in occurrence of LNM [9].
Our study is limited by the retrospective and single-center design with incorporation of missing values as well as a time period and selection bias. Especially the high fraction of missing MSKCC risk assessments introduces uncertainty whether relevant differences in tumor biology exist, thereby representing a potential bias. Furthermore a higher proportion of discontinuation of therapy due to adverse events within the LNM(+) only subgroup possibly represents an additional bias. Since treatment of mRCC has rapidly changed over the past decades it is unclear whether LNM(+) will remain an unbeneficial factor in the era of combined targeted and immunotherapy.
In conclusion our findings show a negative impact of LNM(+) on prognosis in line with previous findings. However, our study is the first to show that an increased risk for death in LNM(+) might be associated with the presence of other solid organ metastases rather than with the presence of LNM alone. In the context of study limitations, this finding is hypothesis generating and should be explored or confirmed by future studies.
ACKNOWLEDGMENTS
None
FUNDING
The authors report no funding.
AUTHORS CONTRIBUTION
VG and PI are responsible for conception, interpretation of data and proof reading. MAK is responsible for proof reading, interpretation of data and advisory role. HE, PI and IP are responsible for manuscript drafting. HE, MLT and PI are responsible for data acquisition and statistical analysis.
CONFLICT OF INTEREST
VG is an Associate Editor of this journal, but was not involved in the peer-review process of this manuscript nor had access to any information regarding its peer-review. HE: Travel grants by Ipsen. VG: Honoraria from BMS, Novartis and Pfizer. Fees as an advisor and speaker from BMS, Novartis, Pfizer and Bayer. PI: Advisory and speaker fees from Novartis, GSK, Bayer, BMS and Pfizer. All other authors have no conflicts of interest to declare.
REFERENCES
[1] | Aeppli S , Schmaus M , Eisen T , Escudier B , Grünwald V , Larkin J , et al. First-line treatment of metastatic clear cell renal cell carcinoma: a decision-making analysis among experts. ESMO Open. (2021) ;6: (1):100030. |
[2] | Carr I , Pettigrew N , Weinerman B . Lymphatic metastasis and its treatment. Cancer Treat Rev. (1987) ;14: (1):53–64. |
[3] | Kroeger N , Pantuck AJ , Wells JC , Lawrence N , Broom R , Kim JJ , et al. Characterizing the impact of lymph node metastases on the survival outcome for metastatic renal cell carcinoma patients treated with targeted therapies. Eur Urol. (2015) ;68: (3):506–15. |
[4] | Dudani S , de Velasco G , Wells JC , Gan CL , Donskov F , Porta C , et al. Evaluation of Clear Cell, Papillary, and Chromophobe Renal Cell Carcinoma Metastasis Sites and Association With Survival. JAMA Netw Open. (2021) ;4: (1):e2021869. |
[5] | Tilki D , Hu B , Nguyen HG , Dall’Era MA , Bertini R , Carballido JA , et al. Impact of synchronous metastasis distribution on cancer specific survival in renal cell carcinoma after radical nephrectomy with tumor thrombectomy. J Urol. (2015) ;193: (2):436–42. |
[6] | Russell Christopher M , Espiritu Patrick N , Kassouf W , Schwaab T , Buethe David D , Dhilon J , et al. Surgical Outcomes in the Management of Isolated Nodal Recurrences: A Multicenter, International Retrospective Cohort. Journal of Urology. (2014) ;192: (2):350–6. |
[7] | Capitanio U , Abdollah F , Matloob R , Salonia A , Suardi N , Briganti A , et al. Effect of number and location of distant metastases on renal cell carcinoma mortality in candidates for cytoreductive nephrectomy: implications for multimodal therapy. Int J Urol. (2013) ;20: (6):572–9. |
[8] | Kroeger N , Seligson DB , Klatte T , Rampersaud EN , Birkhäuser FD , Rao PN , et al. Clinical, molecular, and genetic correlates of lymphatic spread in clear cell renal cell carcinoma. Eur Urol. (2012) ;61: (5):888–95. |
[9] | Erlmeier F , Ivanyi P , Hartmann A , Autenrieth M , Wiedemann M , Weichert W , et al. c-Met in chromophobe renal cell carcinoma. Med Oncol. (2017) ;34: (2):15. |


