
Thickness of Perirenal Fat Predicts the Growth Pattern of Renal Cell Carcinoma
Abstract
Background:
Partial nephrectomy is the standard treatment for T1a and select T1b tumors. Tumor location is very important because it may predict surgical complications and malignant potential. The aim of this study was to investigate the association between adipose tissue, especially around the kidney, and the growth pattern of RCC.
Methods:
We retrospectively reviewed computed tomography scans of 153 patients with stage 1 renal cell carcinoma who underwent radical or partial nephrectomy at our hospital between January 2013 and July 2016. We calculated visceral/subcutaneous/perirenal fat volumes using SYNAPSE VINCENT®. In 60 patients, perirenal fat was immunohistochemically stained for leptin, adiponectin, COX-2 and UCP1, and the association with outward tumor protrusion was evaluated.
Results:
Among the 153 cases, 88 had confirmed outward expansion (57.5%), 110 were classed as pT1a (52 and 58 with outer and inner expansion, respectively), and 43 were classed as pT1b (36 and seven with outer and inner expansion, respectively; pT1a vs. pT1b, P < 0.0001). A multivariate logistic regression model showed a trend towards significance in pT1b (vs. pT1a; odds ratio [OR] 6.033; 95% confidence interval [CI] = 2.409– 15.108; P = 0.0001) and perirenal fat percentage >1.0 (vs. ≤1.0; [OR] 2.596; 95% CI = 1.205– 5.591; P = 0.014) as independent predictors for outer protrusion. Immunohistochemical staining was positive for UCP1 expression in 31 out of 41 outgrowth types (75.6%) and in all 19 endogenous types (100%; P = 0.003).
Conclusions:
Renal cell carcinoma with thick perirenal fat correlates with an increased likelihood of developing outward tumor protrusion; therefore, fat distribution may affect the development of renal cell carcinoma.
INTRODUCTION
In recent years, partial nephrectomy has been the standard surgical treatment for T1a tumors (≤4 cm) and select T1b tumors (>4 cm, 7 cm≥). Among these tumor classes, the tumor location can be divided into inner or outer sites. RCC location is very important to surgeons because intraparenchymal tumors are relatively hard to partially resect and have high perioperative complications [1]. Furthermore, slow growing RCCs tend to be outwardly located in comparison with rapidly growing types [2]. Therefore, the tumor location may predict surgical complications and malignant potential. However, to date, little attention has been paid to the mechanism of RCC growth pattern.
There is much epidemiological evidence to suggest that long-standing obesity is one of the primary causes of cancer, including cancers of the breast, colon, esophagus, pancreas, and kidney [3]. In the human body there are two types of adipose tissue: white adipose tissue (WAT) and brown adipose tissue (BAT) [4]. WAT is important for energy storage and releases hormones and cytokines that regulate metabolism and insulin sensitivity [5– 7]. In contrast, BAT is important for thermogenesis. BAT expresses uncoupling protein 1 (UCP1), which is rich in mitochondria and uncouples mitochondrial respiration from ATP synthesis to facilitate heat production [5, 8]. BAT is mainly located in the thyroid and mediastinal, supraclavicular, and perirenal tissues [8]. The kidney is surrounded by perirenal fat; however, no studies have been undertaken to investigate the relationship between RCC and BAT. Perirenal fat is located in the retroperitoneum and is a type of visceral fat [9]. Adipose tissue is generally considered as the storage site of excess energy, although recently it has been revealed that adipocytes have endocrine activity and produce hormones, inflammatory cytokines, and adipocytokines [10].
A previous study found that prostate cancer (PCa) patients that had higher levels of periprostatic fat had more aggressive PCa [11]. Moreover, patients with metabolic syndromes, including obesity, have poorer outcomes after radical prostatectomy [12], and obesity is a risk factor for aggressive PCa [13]. For breast cancer patients, obesity is associated with advanced disease at diagnosis and with a poor prognosis [14]. Also, in RCC patients, thickness and stranding of perirenal fat affect progression-free survival of clinically localized kidney cancer [15]. These results suggest that adipose tissue may also affect RCC growth.
Based on these results, we hypothesized that an investigation of the anatomical characteristics of stage 1 renal tumor may lead to the identification of factors involved in the development of renal tumors. The kidney is usually surrounded by perirenal fat, therefore, to elucidate anatomical factors, we conducted this study to examine the association between adipose tissue, especially around the kidney, and the growth pattern of RCC.
MATERIALS AND METHODS
Study population
After receiving the approval of the institutional review board (approval nr. 30-197), we retrospectively included 153 consecutive patients who were diagnosed with cT1 RCC and who underwent partial or radical nephrectomy. All patients were treated at Kyushu University from January 2013 and July 2016. Patients who had undergone hemodialysis were excluded. All the patients had a single kidney tumor.
Computed tomography measurement of fat volume
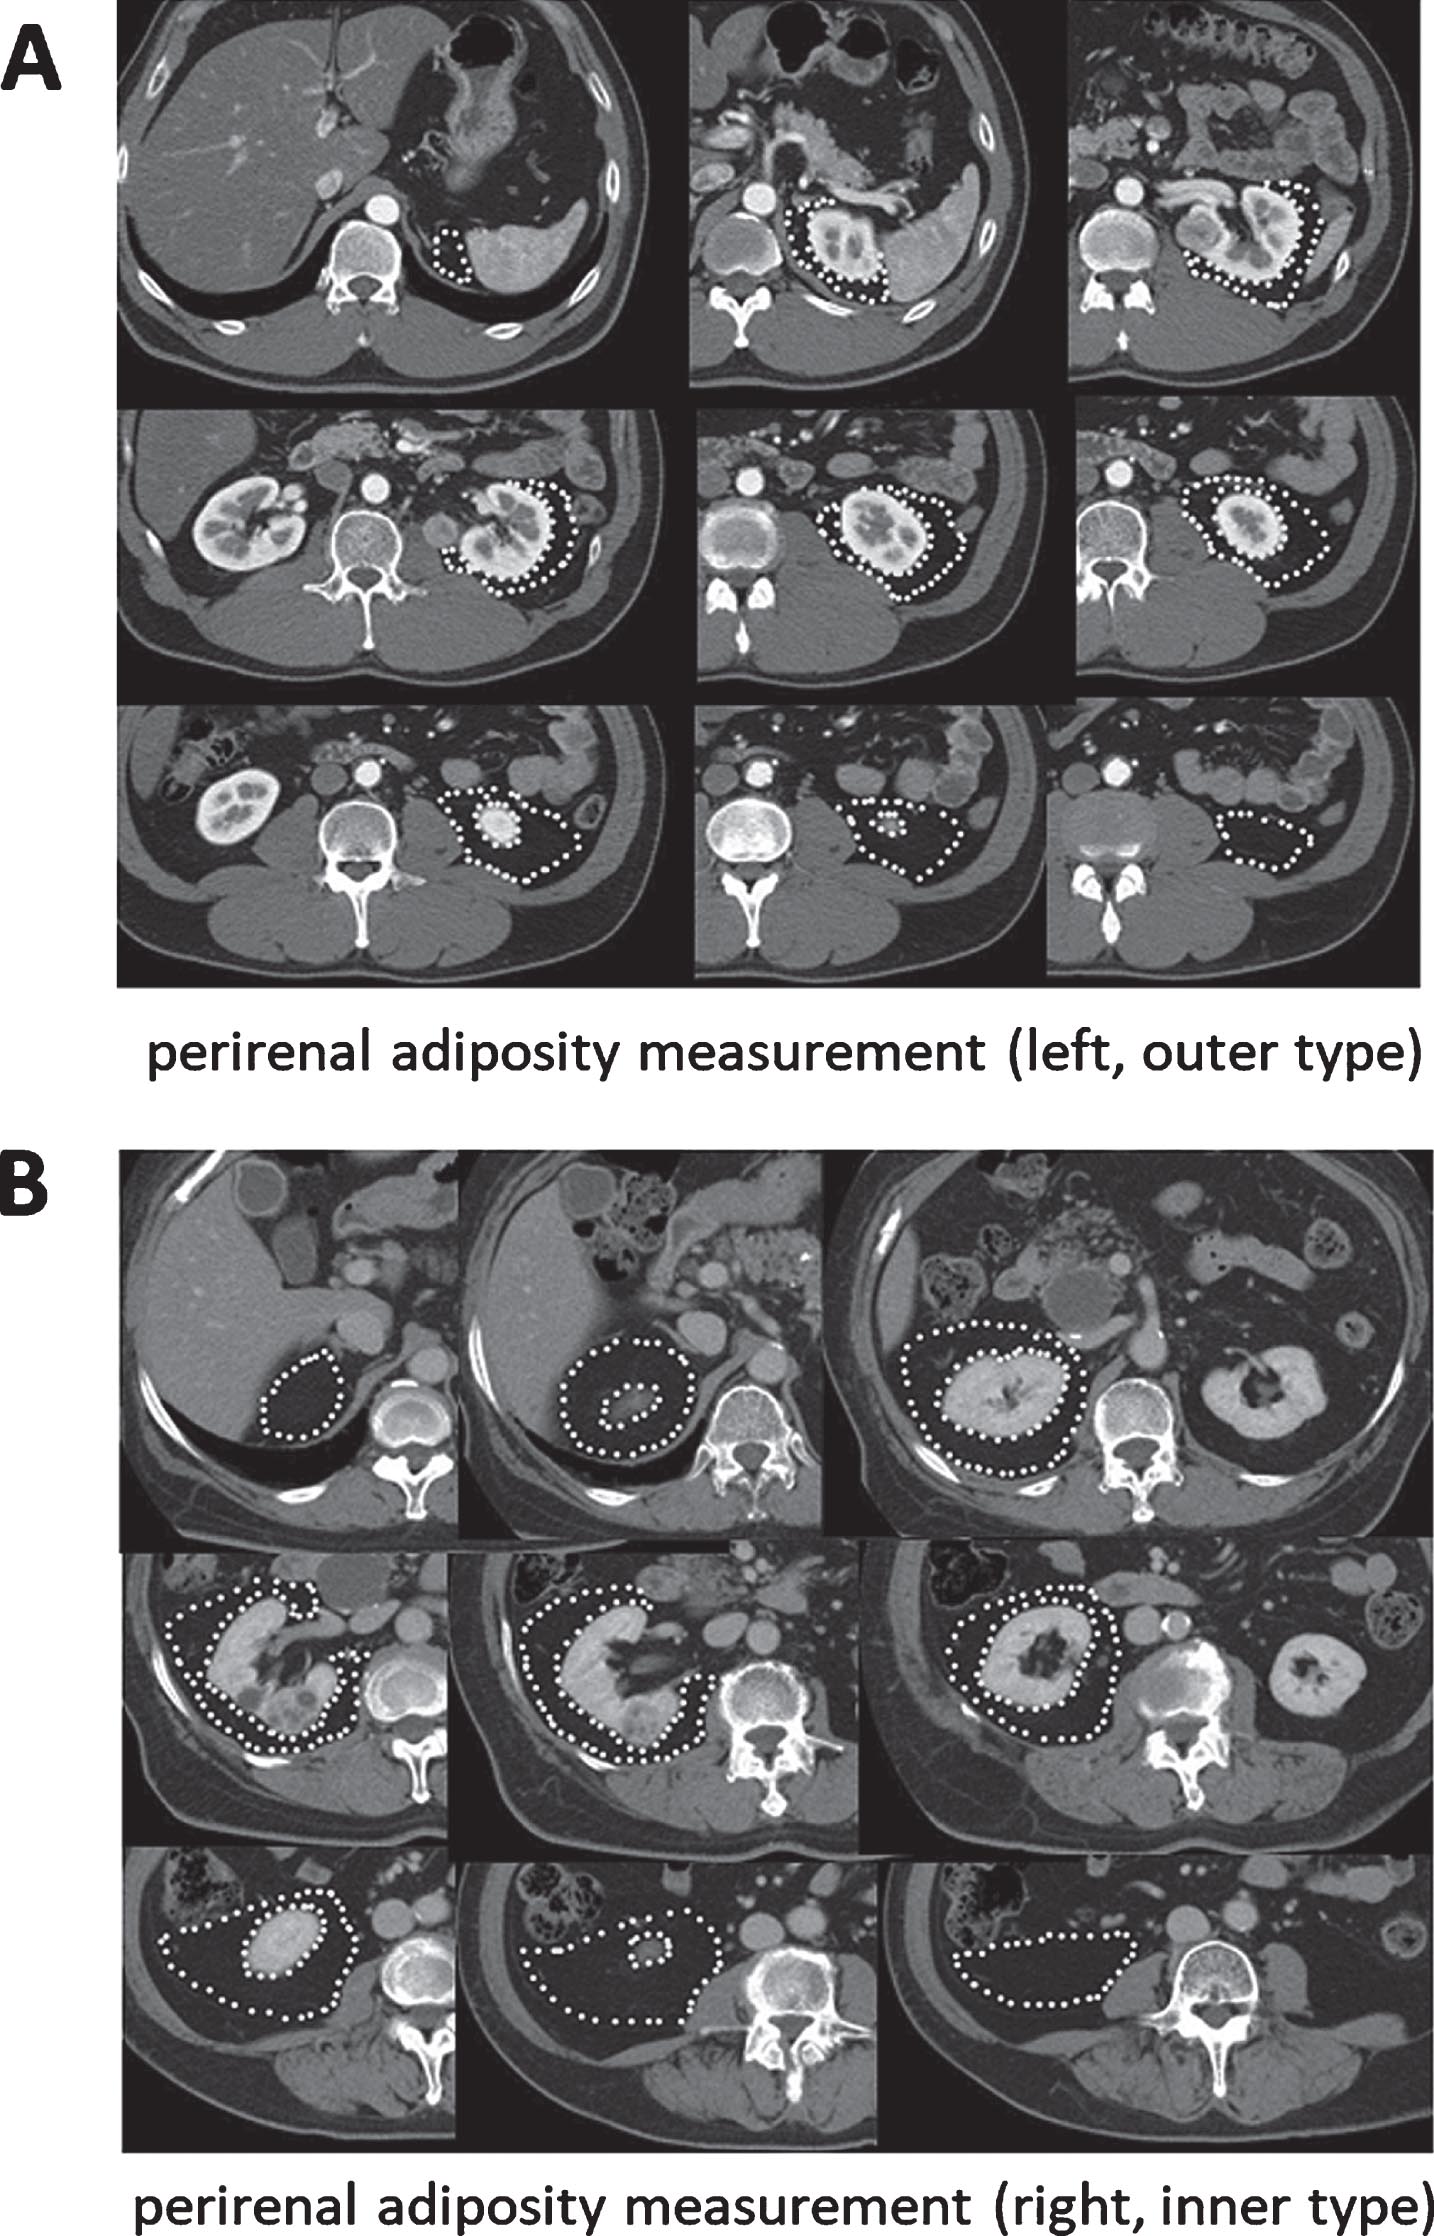
Computed tomography (CT) studies were performed using a 4-slice multidetector CT scanner (Aquilion; Toshiba Medical Systems, Tokyo, Japan). Adipose tissue was identified as the pixels ranging from – 250 to – 50 Hounsfield units. All imaging data were transferred to a computer workstation for analysis of the total abdominal fat volume. The visceral fat (VF) volume, subcutaneous fat (SF) volume, perirenal fat (PF) volume, and abdominal volume were calculated using SYNAPSE VINCENT® software (Fuji Film, Tokyo, Japan). Subcutaneous fat and abdominal volume were calculated from the diaphragm to pubic bone level. To calculate the visceral fat/subcutaneous fat ratio (V/S ratio), the VF volume was divided by the SF volume. The PF volume was measured by marking the area of adiposity on each CT image (Fig. 1A, B). To calculate the PF percentage, the PF volume was divided by the abdominal volume. To minimize inter-observer variation, adipose tissue assessments were carried out by the same examiner. When a tumor was 50% or more exophytic it was classified as an ‘outer location’ and if it was less than 50% exophytic it was classified as an ‘inner location’. In this study, when the maximum section of a tumor protruded from the kidney in the horizontal or coronary view of a preoperative CT scan, it was defined as exophytic.
Fig. 1
Measurement of fat area using 5 mm CT slices and SYNAPSE VINCENT® software. (A) Perirenal adiposity measurement (left side, RCC is outer type). (B) Perirenal adiposity measurement (right side, RCC is inner type).
Immunohistochemistry
Immunohistochemistry was performed on 5μm-thick adipose tissue sections taken from partial or radical nephrectomy specimens attached to tumor. Primary antibodies against leptin (dilution 1 : 100; SC-842; Santa Cruz, Dallas, TX, USA), adiponectin (dilution 1 : 100; ab22554; Abcam, Cambridge, MA, USA), UCP1 (dilution 1 : 500; U6382; Sigma, St Louis, MO, USA), or COX-2 (dilution 1 : 100; 160112; Cayman, Ann Arbor, MI, USA) were applied, followed by a broad-spectrum secondary antibody (Invitrogen, Carlsbad, CA, USA), as described previously [16].
For scoring of leptin, adiponectin, UCP1 and COX-2 expression, stained cells were divided into three categories as follows: 0, negative; 1, positive; and 2, strong positive. All stains were visually quantified by a single pathologist (T. A.) blinded to the sample identity.
Statistical analysis
All statistical analyses were performed using JMP13 software (SAS Institute, Cary, NC, USA). Univariate and multivariate analyses were performed using the logistic regression model. Correlations between parameters were examined by χ2 test. P values <0.05 were considered significant.
RESULTS
Clinical characteristics
The clinical features of the patients are shown in Table 1. The median age at diagnosis was 62 (34– 83) years, and of the 153 patients, 112 (73.2%) were men and 41 (26.8%) were women. Seventy-three patients (47.7%) had right-sided RCC and 80 (52.3%) had left-sided RCC; 88 (57.5%) were outer and 65 (42.5%) were inner expansion. A total of 132 (86.3%) had clear cell RCC, 11 (7.2%) had papillary RCC, and nine (5.9%) had chromophobe RCC; 110 (71.9%) of the patients presented with pT1a tumors and 43 (28.1%) with pT1b. Twenty-three (15.9%) of the patients had Fuhrman nuclear grade 1, 100 (69.4%) had grade 2, 20 (13.8%) had grade 3, and one (0.7%) had grade 4. The median body mass index (BMI) was 23.5 (range, 16.0– 36.5). The median V/S ratio was 1.00 (range, 0.11– 2.73) and the median perirenal fat percentage was 1.01% (range, 0.03% – 3.59%).
Table 1
Patients’ characteristics (n = 153)
| Variable | |
| Median age, Years (range) | 62 (34– 83) |
| Gender, n (%) | |
| Male | 112 (73.2%) |
| Female | 41 (26.8%) |
| Laterarity, n (%) | |
| Right | 73 (47.7%) |
| Left | 80 (52.3%) |
| Expansion pattern, n(%) | |
| Outer | 88 (57.5%) |
| Inner | 65 (42.5%) |
| Histology, n (%) | |
| Clear cell | 132 (86.3%) |
| Papillary | 11 (7.2%) |
| Chromophobe | 9 (5.9%) |
| Collecting duct | 1 (0.6%) |
| pT stage, n (%) | |
| PT1a | 110 (71.9%) |
| PT1 b | 43 (28.1%) |
| Fuhrman nuclear grade, n (%) | |
| 1 | 23 (15.9%) |
| 2 | 100 (69.4%) |
| 3 | 20 (13.8%) |
| 4 | 1 (0.7%) |
| Median BMI, kg/m2 (range) | 23.5 (16.0– 36.5) |
| Median visceral fat, % (range) | 33.0 (5.1– 59.9) |
| Median subcutaneous fat, % (range) | 15.7 (2.0– 37.9) |
| Median body fat, % (range) | 32.8 (5.0– 54.8) |
| Median V/S ratio, ratio (range) | 1.00 (0.11– 2.73) |
| Median Perirenal fat, % (range) | 1.01 (0.03– 3.59) |
| Hypertension, n (%) | |
| Negative | 76 (49.7%) |
| Positive | 77 (50.3%) |
| Diabetes mellitus, n (%) | |
| Negative | 137 (89.5%) |
| Positive | 16 (10.5%) |
| Hyperlipidemia, n (%) | |
| Negative | 121 (79.1%) |
| Positive | 32 (20.9%) |
V/S ratio: Visceral fat/subcutaneous fat ratio; Body fat percentage: (Visceral fat+Subcutaneus fat)/abdominal volume Perirenal fat percentage: perirenal fat/abdominal volume.
Univariate and multivariate analyses of patient characteristics and expansion pattern
Table S1 summarizes the expansion pattern and characteristics of the patients. To determine the important factors that are required for outward growth, we performed univariate and multivariate analyses. Patients were divided into two groups according to the median of each of the following parameters: BMI, body fat, subcutaneous fat, visceral fat, perirenal fat percentage, and V/S ratio. In the univariate analysis, sex (odds ratio [OR] 2.129; 95% confidence interval (CI) 1.030– 4.400; P = 0.041), pT stage (OR 5.736; 95% CI 2.351– 13.995; P = 0.0001), and PF percentage (OR 2.713; 95% CI 1.399– 5.258; P = 0.003) were associated with expansion pattern (Table 2). The multivariate analyses showed that pT stage (OR 6.033; 95% CI 2.409– 15.108; P = 0.0001) and PF percentage (OR 2.596; 95% CI 1.205– 5.591; P = 0.014) were independent factors.
Table 2
Univariate and multivariate analyses between characteristics of patients and outer expansion pattern
| Univariate analysis | Multivariate analysis | |||||
| Variable | OR | 95% CI | P value | OR | 95% CI | P value |
| Gender (Male vs. Female) | 2.129 | 1.030– 4.400 | 0.041 | 1.420 | 0.601– 3.357 | 0.423 |
| Laterarity (Right vs. Left) | 0.899 | 0.473– 1.709 | 0.746 | |||
| Historogy (clear vs. non-clear) | 0.809 | 0.314– 2.084 | 0.661 | |||
| pTstage (pT1b vs. pT1a) | 5.736 | 2.351– 13.995 | 0.0001 | 6.033 | 2.409– 15.108 | 0.0001 |
| BMI (>23.5 vs.<23.5) | 1.146 | 0.601– 2.184 | 0.677 | |||
| Body fat percentage (>32.8 vs.<32.8) | 1.400 | 0.736– 2.675 | 0.304 | |||
| Subcutaneous fat percentage (>16 vs.<16) | 0.819 | 0.430– 1.556 | 0.542 | |||
| Visceral fat percentage (>33 vs.<33) | 1.400 | 0.735– 2.663 | 0.305 | |||
| V/S ratio (>1.0 vs.<1.0) | 1.738 | 0.910– 3.321 | 0.093 | |||
| PF percentage (>1.0 vs.<1.0) | 2.713 | 1.399– 5.258 | 0.003 | 2.596 | 1.205– 5.591 | 0.014 |
| Hypertension (positive vs. negative) | 0.747 | 0.703– 2.543 | 0.375 | |||
| Diabetes mellitus (positive vs. negative) | 0.402 | 0.138– 1.171 | 0.094 | |||
| Hyperlipidemia (positive vs. negative) | 0.493 | 0.224– 1.086 | 0.079 | |||
Clear: clear cell RCC, non-clear: papillary RCC and chromophobe RCC. pT stage: pathological T stage, T1a: <4 cm, T1b: 4– 7 cm. V/S ratio: Visceral fat/Subcutaneus fat ratio. PF percentage: Perirenal fat/abdominal volume.
Leptin, adiponectin, COX-2, and UCP1 expression in perirenal fat of RCC patients
We immunohistochemically stained samples from 60 patients for leptin, adiponectin, COX-2, and UCP1. Positive signals representing these proteins were predominantly detected in adipocytes (Fig. 2), and their expression patterns are summarized in Table 3. Leptin was detected in three (7.4%) of the 41 outer expansion samples (3 [7.4%] 1+) and two (10.5%) of the 19 inner expansion samples (2 [10.5] 1+; P = 0.681, 0 vs. 1+/2+). Adiponectin was positive in all 41 (100%) of the outer expansion samples (3 [7.3%] 1+, 38 [92.7%] 2+) and all 19 (100%) of the inner expansion samples (1 [5.2%] 1+, 18 [94.8%] 2+; P = 0.762, 0/1+ vs. 2+). COX-2 was also positive in all 41 (100%) of the outer expansion samples (41 [100%] 2+) and all 19 (100%) of the inner expansion samples (1 [5.2%] 1+, 18 [94.8%] 2+; P = 0.126, 0/1+ vs. 2+). UCP1 was positive in 31 (75.6%) of the 41 outer expansion samples (31 [75.6%] 1+) and all 19 (100%) of the inner expansion samples (14 [73.7%] 1+, 5 [26.3%] 2+; P = 0.003, 0 vs. 1+/2+).
Fig. 2
Immunohistochemistry of adiponectin (A), COX-2 (B), leptin (C), and UCP1 (D) in perirenal fat (original magnification: 200×).
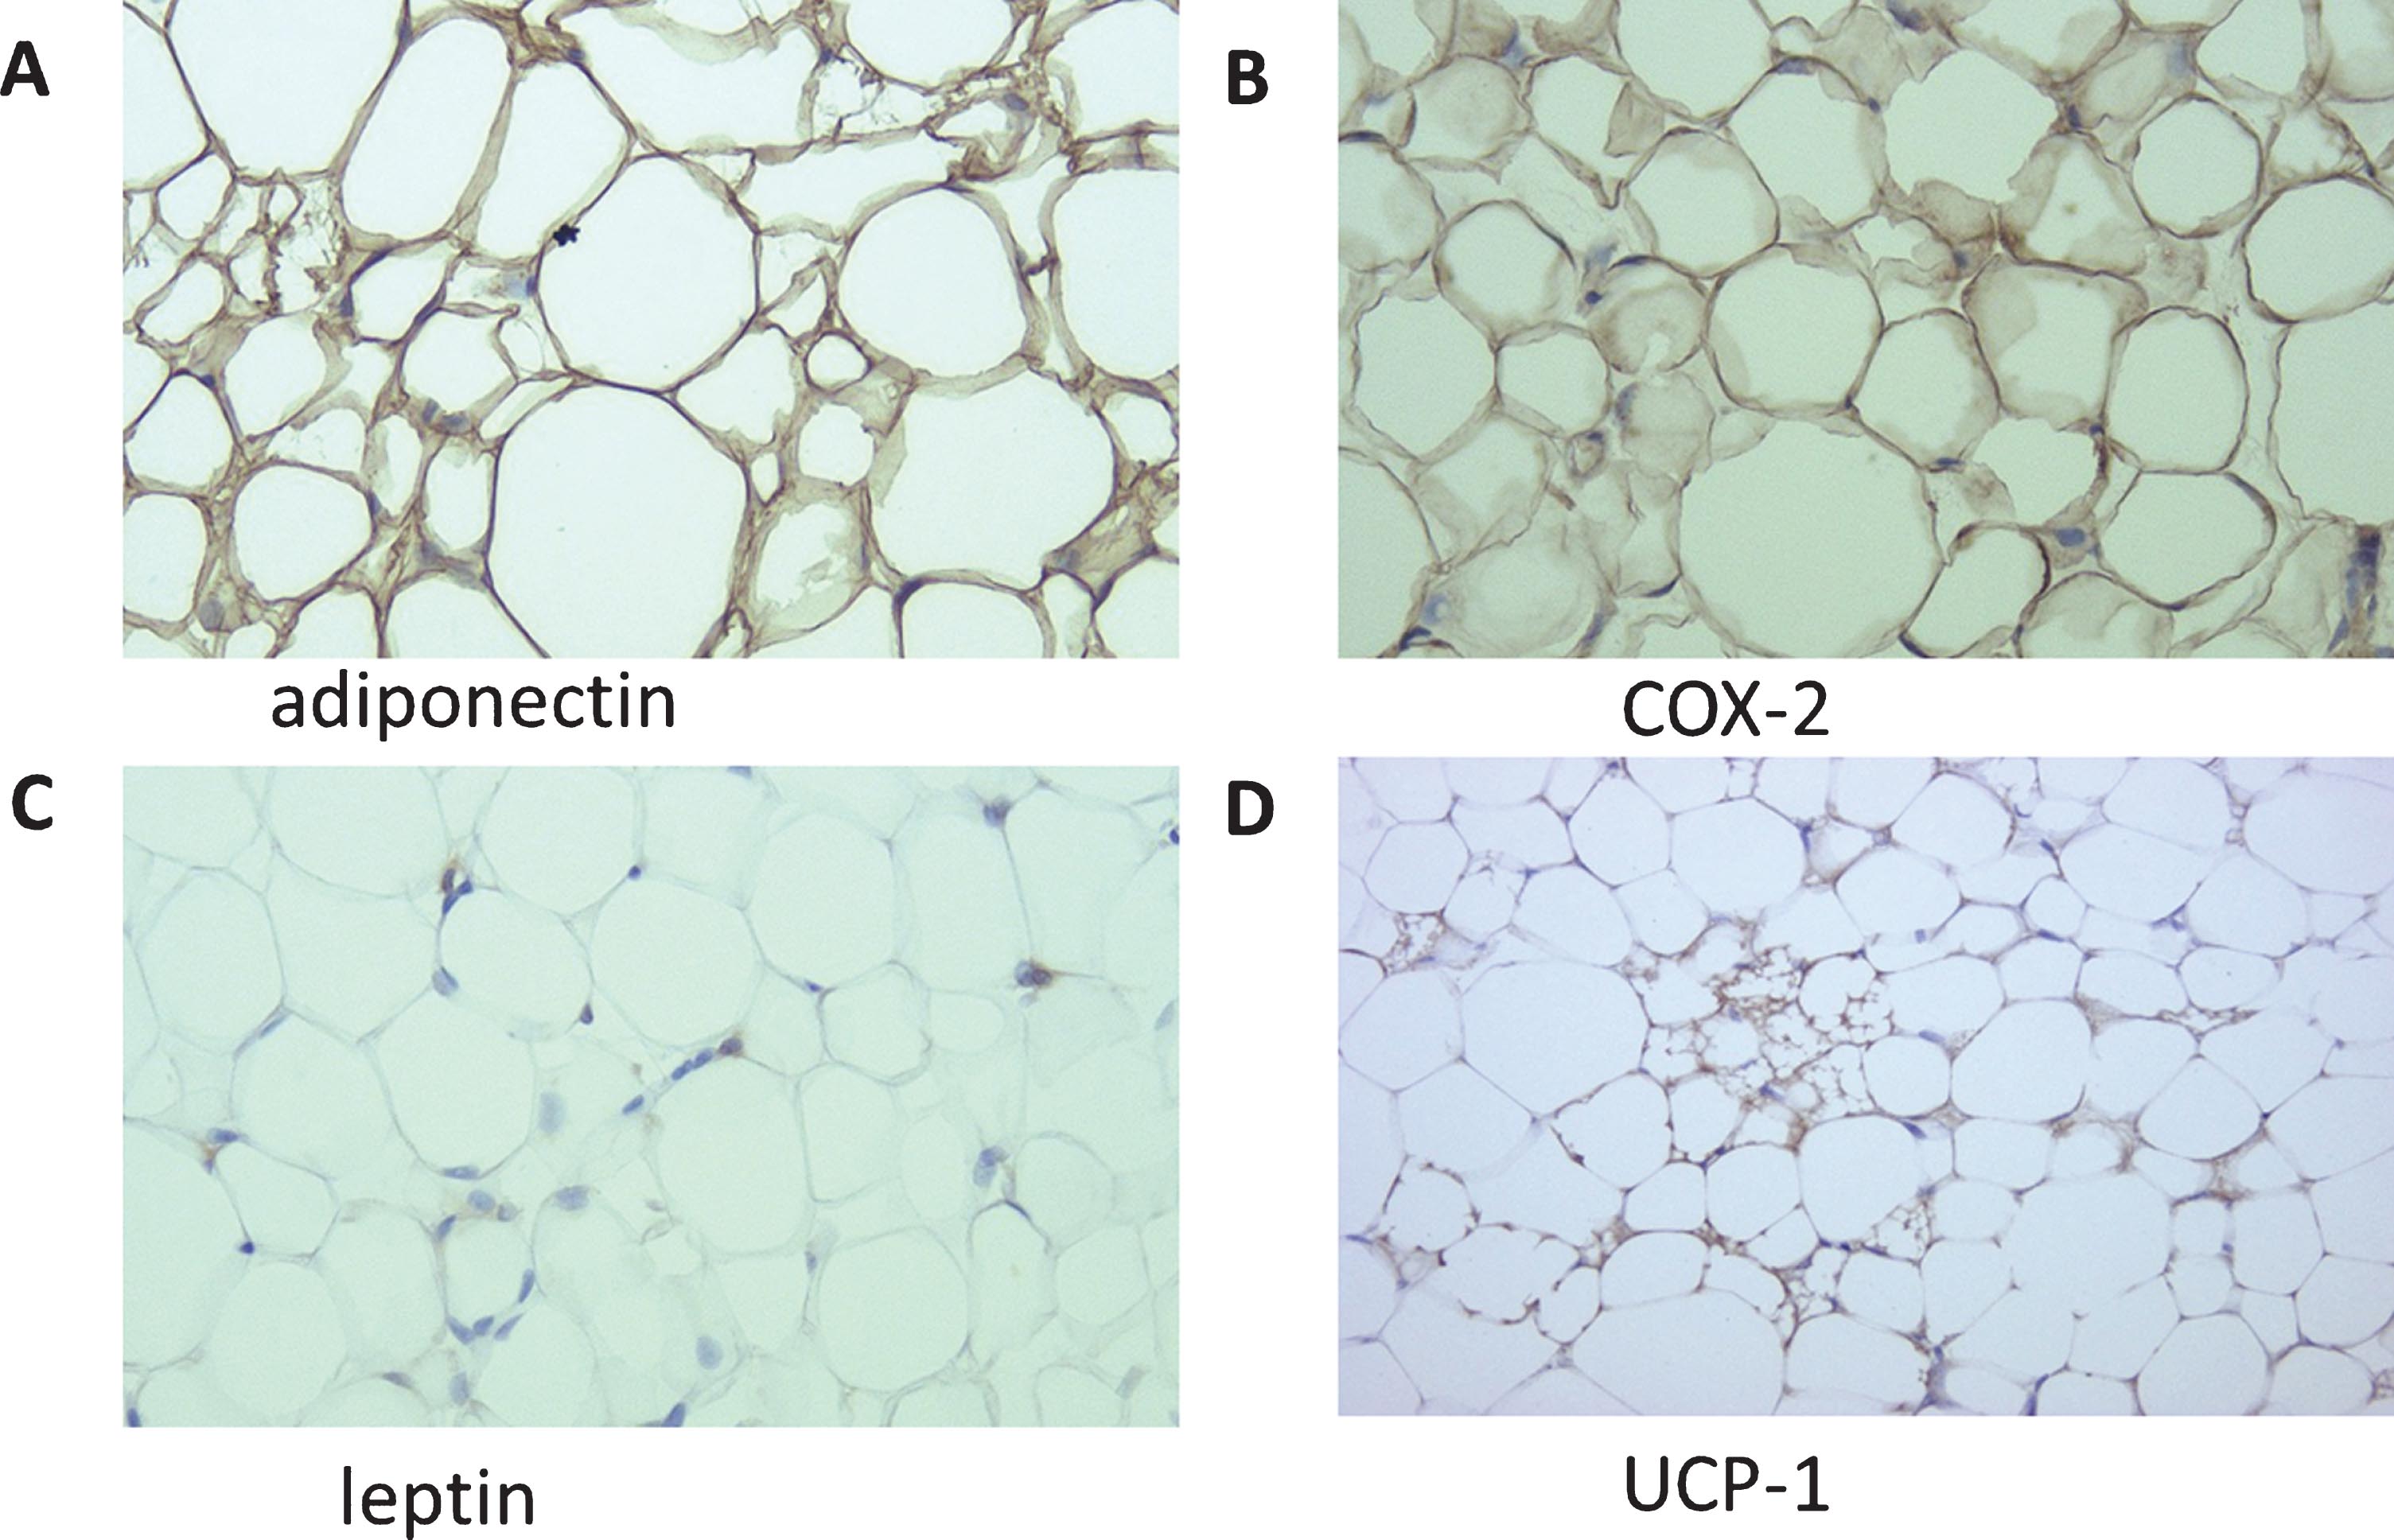
Table 3
Expression of leptin, adiponectin, COX-2 and UCP-1 in perirenal fat
| Expression levels | P value | |||||
| n | Negative | Positive | 0 vs 1+/2+ | 0/1+ vs 2+ | ||
| 0 | 1+ | 2+ | ||||
| Leptin | ||||||
| Outer expansion | 41 | 38 (92.6%) | 3 (7.4%) | 0 (0%) | 0.681 | NA |
| Inner expansion | 19 | 17 (89.5%) | 2 (10.5%) | 0 (0%) | ||
| Adiponectin | ||||||
| Outer expansion | 41 | 0 (0%) | 3 (7.3%) | 38 (92.7%) | NA | 0.762 |
| Inner expansion | 19 | 0 (0%) | 1 (5.2%) | 18 (94.8%) | ||
| COX-2 | ||||||
| Outer expansion | 41 | 0 (0%) | 0 (0%) | 41 (100%) | NA | 0.126 |
| Inner expansion | 19 | 0 (0%) | 1 (5.2%) | 18 (94.8%) | ||
| UCP-1 | ||||||
| Outer expansion | 41 | 10 (24.4%) | 31 (75.6%) | 0 (0%) | 0.003 | 0.287 |
| Inner expansion | 19 | 0 (0%) | 14 (73.7%) | 5 (26.3%) | ||
DISCUSSION
The aim of this study was to determine whether body fat affects the pattern of RCC expansion. Our starting hypothesis was that visceral/perirenal fat affects the growth direction of RCC. Our results support this hypothesis and suggest that perirenal fat has an important role in RCC growth pattern.
Around 80% of all body fat is located subcutaneously, and 20% is located in visceral areas [17]. The area of visceral fat increases with age, and accumulation of visceral fat increases the risk not only of metabolic diseases [18], but also PCa in men [19]. The V/S ratio is useful for classifying obesity into subgroups: generally, a V/S ratio of 0.4 or above is considered as visceral obesity, and a V/S ratio below 0.4 is considered as subcutaneous obesity [20, 21].
Table 2 shows that pT stage and PF percentage were also independent factors for tumor location. When the tumor becomes larger, it is difficult for it to remain in the kidney, and therefore, it is reasonable that pT stage is a risk factor. Even in pT1a tumors less than 4 cm, PF percentage was correlated with growth pattern (Table S2). Together, these results suggest that perirenal fat can affect the growth direction of renal tumors even if pT stage is the important factor.
Conversely, we hypothesized that the growth pattern alters the thickness/amount of fat tissue. The visceral fat and PF percentages showed a positive correlation (R = 0.46, P < 0.0001; data not shown) but tumor size (e.g., pT1a vs. pT1b) and the visceral fat/PF percentages showed no significant correlation (data not shown). This means that when a tumor becomes larger, and as a result, more exophytic, it did not accumulate adipose tissue.
Recent studies showed that accumulation of perirenal adipose tissue is related to clinical outcome. Perirenal fat thickness is a predictor of clear cell RCC pathology [22] and is a risk factor of poor progression-free survival [23]. Thickness and stranding are also associated with RCC aggressiveness [15]. In an in vitro study, conditioned medium derived from perineoplasm perirenal fat of clear cell RCC promoted ACHN and Caki-2 cell migration via WNT signaling [24]. These studies indicate that PF may have an important role in RCC growth.
In this study, a 50% or more exophytic mass was defined as ‘outer expansion’ followed by the RENAL nephrectomy score, a classification system based on RCC anatomy [25]. Exophytic properties are an important nephrectomy score, and if the tumor location is more endophytic it scores more points. Tumor location is a predictive factor of malignancy and Fuhrman nuclear grade [26, 27], and high total RENAL nephrectomy score contributes to pathological malignancy [28] and upstaging [29]. Furthermore, tumor location is also important for renal function outcomes after partial nephrectomy. The contact surface area (CSA) of the RCC– renal parenchyma correlates with tumor protrusion, and the CSA can be a useful predictive marker of postoperative renal function [30]. We also investigated the relationship between fat distribution and Fuhrman nuclear grade but did not find a significant difference (data not shown). Furman nuclear grade correlates with tumor stage [31] and size [27], but in this study we investigated mainly T1a and few T1b, thus this may be the reason why there was no statistical difference.
Anatomically, kidney cancer can grow into the renal parenchyma or into the perirenal fat. The pressure inside the perirenal fat may be lower than that inside the renal parenchyma; therefore, it may be easier for tumors to grow outside the kidney. This easier growth may also influence the RCC shape and give rise to asymmetrical and/or non-cubic tumors. However, most masses are symmetrical and cubic [25], and it has been reported that RCCs with regular shapes localize to the outside of the kidney and grow more slowly [2]. These studies suggest that the pressure around the RCC may not have a large influence on the direction of growth. We found that perirenal fat may stimulate the RCC to grow into the perirenal fat. Adipose tissue is recognized as an endocrine organ and secretes not only adipocytokines, but also biologically effective molecules such as vascular endothelial growth factor, interleukin 6 (IL 6), and TNFα [6]. IL6 and TNFα can induce inflammation and tumorigenesis [32, 33]. However, whether perirenal adipose tissue secretes these molecules was not revealed in this study. Therefore, how the perirenal fat induces the progression and/or carcinogenesis of RCC is unclear and further studies are required to explore the precise molecular mechanisms involved.
Correlations between adipocytokines, such as leptin and adiponectin, and the clinical characteristics of RCC have been studied. Serum leptin concentration is associated with RCC progression and invasion [34]. In contrast, serum adiponectin is inversely associated with the incidence of RCC [35], and reduced serum adiponectin levels are correlated with increased tumor size and metastasis [36]. Serum leptin concentration is directly associated with BMI, while adiponectin levels are inversely associated with BMI [10]. Leptin interacts with its receptor (ObR) and activates many signals, including VEGF via hypoxia-inducible factor-1α (HIF-1α) and NF-κB [37], and the Janus kinase/signal transducer and activator of transcription 3 (JAK/STAT3) [38]. In contrast, adiponectin deficiency suppresses AMPK activation and, as a result, increases angiogenesis in RCC cell lines [39]. These results suggest that adipocytokines have important roles in RCC and may be useful therapeutic targets.
We immunohistochemically stained leptin, adiponectin, COX-2, and UCP1 in perirenal fat. The expression patterns of leptin and adiponectin did not correlate with the growth pattern (Table 3), in contrast with the results of previous studies of serum levels. In most of our cases, leptin was negative (55 of 60 cases) and adiponectin was positive (60 of 60 cases), and there were few cases in which the expression of both adipocytokines was detected. More sensitive modalities will be required in future to quantify these adipocytokines. We also examined COX-2 because obesity can cause adipose tissue overgrowth and inflammation associated with tumorigenesis [40], and COX-2 is expressed at sites of inflammation [41]. However, COX-2 expression also did not correlate with growth pattern in our study. UCP1 is a marker of BAT mitochondria [8] but the relationship between BAT and cancer has not yet been reported. We found that UCP1 expression was associated with inner-type growth, suggesting that BAT prevents outwards RCC growth. TNFα, which is also secreted by adipose tissue, inhibits UCP1 expression via extracellular-regulated kinases (ERKs) [6], and inflammation also inhibits UCP1 in mice [42]. These results suggest that low expression of UCP1 may reflect the inflammation around the kidney. Furthermore, PTEN, a tumor suppressor gene, affects metabolism and regulates UCP1 transcription [43], therefore UCP1 also reflect the expression of PTEN, and, as a result, may suppress RCC protrusion. Furthermore, in this study UCP1 expression was inversely correlated with PF percentage (data not shown). Accumulation of adipose tissue in the body decreases BAT [44], compatible with our data. Amassing fat around the kidney may decrease BAT and the tumor may grow outwardly as a result. Further studies are needed to clarify how UCP1 may influence RCC expansion.
We propose that adipose tissue stimulates renal cancer in two ways: (i) adipocytokines that are generated in visceral and/or perirenal fat reach the kidney through the blood stream; or (ii), adipocytokines directly activate RCC through paracrine mechanisms. In this study, we showed that RCCs in patients with thick perirenal fat tend to grow outwardly, such that the RCCs protrude into areas that are rich in adipocytokines and/or inflammatory cytokines. This suggests that paracrine mechanisms are more important for RCC growth direction.
In this study, we also investigated the relationship between radiographic/immunohistochemical findings and tumor location. We clearly showed that perirenal fat affected the growth direction of renal tumors, but whether the thickness of perirenal fat can affect clinical outcome is inconclusive. Furthermore, the sample size was relatively small, and future studies are required to investigate the precise role of adipocytes in renal tumor promotion.
In conclusion, an increased perirenal fat percentage may predict RCC protrusion. Adipose tissue, especially BAT, may have some influence on RCC extension. Further studies are needed to investigate the mechanisms involved.
FUNDING
This work was supported by a Japan Society for the Promotion of Science Early Career Scientists Grant (Number 18K16738).
AUTHOR CONTRIBUTIONS
All authors contributed to the study conception, performance and interpretation of data.
CONFLICT OF INTEREST
Each author declares no conflict of interest.
ACKNOWLEDGMENTS
We thank Shelley Robison, PhD, and H. Nikki March, PhD, from Edanz Group (www.edanzediting.com/ac) for editing a draft of this manuscript.
SUPPLEMENTARY MATERIAL
[1] The supplementary material is available in the electronic version of this article: https://dx.doi.org/10.3233/KCA-190079
REFERENCES
[1] | Autorino R , Khalifeh A , Laydner H , Samarasekera D , Rizkala E , Eyraud R , et al. Robot-assisted partial nephrectomy (RAPN) for completely endophytic renal masses: a single institution experience. BJU Int. (2014) ;113: (5):762–8. |
[2] | Choi SJ , Kim H-S , Ahn S-J , Park Y , Choi H-Y . Differentiating radiological features of rapid-and slow-growing renal cell carcinoma using multidetector computed tomography. J Comput Assist Tomogr. (2012) ;36: (3):313–8. |
[3] | Calle EE , Kaaks R . Overweight, obesity and cancer: epidemiological evidence and proposed mechanisms. Nat Rev Cancer. (2004) ;4: (8):579–91. |
[4] | Cypess AM , Lehman S , Williams G , Tal I , Rodman D , Goldfine AB , et al. Identification and importance of brown adipose tissue in adult humans. N Engl J Med. (2009) ;360: (15):1509–17. |
[5] | Marzetti E , D’Angelo E , Savera G , Leeuwenburgh C , Calvani R . Integrated control of brown adipose tissue. Heart and metabolism: management of the coronary patient. (2016) ;69: :9–14. |
[6] | Kershaw EE , Flier JS . Adipose tissue as an endocrine organ. J Clin Endocrinol Metab. (2004) ;89: (6):2548–56. |
[7] | Vázquez-Vela MEF , Torres N , Tovar AR . White adipose tissue as endocrine organ and its role in obesity. Arch Med Res. (2008) ;39: (8):715–28. |
[8] | Enerbäck S . Human brown adipose tissue. Cell Metab. (2010) ;11: (4):248–52. |
[9] | Hung C-S , Lee J-K , Yang C-Y , Hsieh H-R , Ma W-Y , Lin M-S , et al. Measurement of visceral fat: should we include retroperitoneal fat?. PLoS One. (2014) ;9: (11):e112355. |
[10] | Galic S , Oakhill JS , Steinberg GR . Adipose tissue as an endocrine organ. Mol Cell Endocrinol. (2010) ;316: (2):129–39. |
[11] | van Roermund JG , Hinnen KA , Tolman CJ , Bol GH , Witjes JA , Bosch J , et al. Periprostatic fat correlates with tumour aggressiveness in prostate cancer patients. BJU Int. (2011) ;107: (11):1775–9. |
[12] | Shiota M , Yokomizo A , Takeuchi A , Imada K , Kiyoshima K , Inokuchi J , et al. The feature of metabolic syndrome is a risk factor for biochemical recurrence after radical prostatectomy. J Surg Oncol. (2014) ;110: (4):476–81. |
[13] | Buschemeyer WC , Freedland SJ . Obesity and prostate cancer: epidemiology and clinical implications. Eur Urol. (2007) ;52: (2):331–43. |
[14] | Ewertz M , Jensen M-B , Gunnarsdóttir KÁ , Højris I , Jakobsen EH , Nielsen D , et al. Effect of obesity on prognosis after early-stage breast cancer. J Clin Oncol. (2010) ;29: (1):25–31. |
[15] | Thiel DD , Davidiuk AJ , Meschia C , Serie D , Custer K , Petrou SP , et al. Mayo adhesive probability score is associated with localized renal cell carcinoma progression-free survival. Urology. (2016) ;89: :54–62. |
[16] | Kashiwagi E , Ide H , Inoue S , Kawahara T , Zheng Y , Reis LO , et al. Androgen receptor activity modulates responses to cisplatin treatment in bladder cancer. Oncotarget. (2016) ;7: (31):49169–79. |
[17] | Wajchenberg BL . Subcutaneous and visceral adipose tissue: their relation to the metabolic syndrome. Endocr Rev. (2000) ;21: (6):697–738. |
[18] | Kim SK , Kim HJ , Hur KY , Choi SH , Ahn CW , Lim SK , et al. Visceral fat thickness measured by ultrasonography can estimate not only visceral obesity but also risks of cardiovascular and metabolic diseases. Am J Clin Nutr. (2004) ;79: (4):593–9. |
[19] | Hafe P , Pina F , Pérez A , Tavares M , Barros H . Visceral fat accumulation as a risk factor for prostate cancer. Obesity. (2004) ;12: (12):1930–5. |
[20] | Matsuzawa Y , Nakamura T , Shimomura I , Kotani K . Visceral fat accumulation and cardiovascular disease. Obesity. (1995) ;3: (S5):645S–7S. |
[21] | Docimo S , Lee Y , Chatani P , Rogers AM , Lacqua F . Visceral to subcutaneous fat ratio predicts acuity of diverticulitis. Surg Endosc. (2017) ;31: (7):2808–12. |
[22] | Okhunov Z , Mues A , Kline M , Haramis G , Xu B , Mirabile G , et al. Evaluation of perirenal fat as a predictor of cT 1a renal cortical neoplasm histopathology and surgical outcomes. J Endourol. (2012) ;26: (7):911–6. |
[23] | Huang H , Chen S , Li W , Wu X , Xing J , editors . High perirenal fat thickness predicts a poor progression-free survival in patients with localized clear cell renal cell carcinoma. Urol Oncol. (2018) ;36: (4):157.e1–6. |
[24] | Zi X , Lusch A , Blair CA , Okhunov Z , Yokoyama NN , Liu S , et al. Effect of perineoplasm perinephric adipose tissues on migration of clear cell renal cell carcinoma cells: a potential role of WNT signaling. Oncotarget. (2016) ;7: (33):53277–88. |
[25] | Kutikov A , Uzzo RG . The RENAL nephrometry score: a comprehensive standardized system for quantitating renal tumor size, location and depth. J Urol. (2009) ;182: (3):844–53. |
[26] | Venkatesh R , Weld K , Ames CD , Figenshau SR , Sundaram CP , Andriole GL , et al. Laparoscopic partial nephrectomy for renal masses: effect of tumor location. J Urol. (2006) ;67: (6):1169–74. |
[27] | Chen S-H , Wu Y-P , Li X-D , Lin T , Guo Q-Y , Chen Y-H , et al. RENAL Nephrometry score: a preoperative risk factor predicting the fuhrman grade of clear-cell renal carcinoma. J Cancer. (2017) ;8: (18):3725. |
[28] | Ball MW , Gorin MA , Bhayani SB , Rogers CG , Stifelman MD , Kaouk JH , et al. Preoperative predictors of malignancy and unfavorable pathology for clinical T1a tumors treated with partial nephrectomy: a multi-institutional analysis. Urol Oncol. (2015) ;33: (3):112.e9–14. |
[29] | Tay MH , Thamboo TP , Wu FM , Zhaojin C , Choo TB , Ramaan L , et al. High RENAL Nephrometry scores are associated with pathologic upstaging of clinical T1 renal-cell carcinomas in radical nephrectomy specimens: implications for nephron-sparing surgery. J Endourol. (2014) ;28: (9):1138–42. |
[30] | Leslie S , Gill IS , de Castro Abreu AL , Rahmanuddin S , Gill KS , Nguyen M , et al. Renal tumor contact surface area: a novel parameter for predicting complexity and outcomes of partial nephrectomy. Eur Urol. (2014) ;66: (5):884–93. |
[31] | Bretheau D , Lechevallier E , Fromont MD , Sault MC , Rampal M , Coulange C . Prognostic value of nuclear grade of renal cell carcinoma. J Cancer. (1995) ;76: (12):2543–9. |
[32] | Hodge DR , Hurt EM , Farrar WL . The role of IL-6 and STAT3 in inflammation and cancer. Eur J Cancer. (2005) ;41: (16):2502–12. |
[33] | Wu Y-D , Zhou B . TNF-α/NF-κB/Snail pathway in cancer cell migration and invasion. Br J Cancer. (2010) ;102: (4):639. |
[34] | Horiguchi A , Sumitomo M , Asakuma J , Asano T , Zheng R , Asano T , et al. Increased serum leptin levels and over expression of leptin receptors are associated with the invasion and progression of renal cell carcinoma. J Urol. (2006) ;176: (4):1631–5. |
[35] | Spyridopoulos TN , Petridou ET , Skalkidou A , Dessypris N , Chrousos GP , Mantzoros CS . Low adiponectin levels are associated with renal cell carcinoma: A case-control study. Int J Cancer. (2007) ;120: (7):1573–8. |
[36] | Pinthus JH , Kleinmann N , Tisdale B , Chatterjee S , Lu J-P , Gillis A , et al. Lower plasma adiponectin levels are associated with larger tumor size and metastasis in clear-cell carcinoma of the kidney. Eur Urol. (2008) ;54: (4):866–74. |
[37] | Gonzalez-Perez RR , Xu Y , Guo S , Watters A , Zhou W , Leibovich SJ . Leptin upregulates VEGF in breast cancer via canonic and non-canonical signalling pathways and NFκB/HIF-1α activation. Cell Signal. (2010) ;22: (9):1350–62. |
[38] | Li L , Gao Y , Zhang L-L , He D-l . Concomitant activation of the JAK/STAT3 and ERK1/2 signaling is involved in leptin-mediated proliferation of renal cell carcinoma Caki-2 cells. Cancer Biol Ther. (2008) ;7: (11):1787–92. |
[39] | Kleinmann N , Duivenvoorden WC , Hopmans SN , Beatty LK , Qiao S , Gallino D , et al. Underactivation of the adiponectin– adiponectin receptor 1 axis in clear cell renal cell carcinoma: implications for progression. Clin Exp Metastasis. (2014) ;31: (2):169–83. |
[40] | Pérez-Hernández AI , Catalán V , Gómez-Ambrosi J , Rodríguez A , Frühbeck G . Mechanisms linking excess adiposity and carcinogenesis promotion. Front Endocrinol (Lausanne). (2014) ;5: (65):1–17. |
[41] | Willoughby DA , Moore AR , Colville-Nash PR . COX-1, COX-2, and COX-3 and the future treatment of chronic inflammatory disease. Lancet. (2000) ;355: (9204):646–8. |
[42] | Sakamoto T , Nitta T , Maruno K , Yeh Y-S , Kuwata H , Tomita K , et al. Macrophage infiltration into obese adipose tissues suppresses the induction of UCP1 level in mice. Am J Physiol Endocrinol Metab. (2016) ;310: (8):E676–E87. |
[43] | Ortega-Molina A , Serrano M . PTEN in cancer, metabolism, and aging. Trends Endocrinol Metab. (2013) ;24: (4):184–9. |
[44] | Saito M , Okamatsu-Ogura Y , Matsushita M , Watanabe K , Yoneshiro T , Nio-Kobayashi J , et al. High incidence of metabolically active brown adipose tissue in healthy adult humans: effects of cold exposure and adiposity. Diabetes. (2009) ;58: (7):1526–31. |


