
Utility of FDG-PET/CT in Patients with Advanced Renal Cell Carcinoma with Osseous Metastases: Comparison with CT and 99mTc-MDP Bone Scan in a Prospective Clinical Trial
Abstract
Objective:
Compare FDG-PET/CT, CT, and bone scan for detecting and monitoring bone metastases’ response in metastatic renal cell cancer (mRCC).
Methods:
Patients with mRCC prospectively underwent FDG-PET/CT, CT, and bone scans at baseline and after 8 weeks of therapy. Tumor visibility and metabolic activity were retrospectively recorded. Response was evaluated by PERCIST, RECIST, and MD Anderson bone criteria. Kaplan-Meier methodology estimated event-time distributions for PFS, OS, and time to symptomatic skeletal event (SSE). Log-rank test tested differences in event-time distributions between response at 8 weeks by response criteria.
Results:
Sixteen patients (n = 30; 53%) were evaluable. Baseline FDG-PET/CT detected more osseous metastases (n = 55) than CT (n = 45) or bone scan (n = 34). From baseline to 8 weeks, metabolic activity of lesions decreased >20%, while qualitative and quantitative CT and bone scan parameters were unchanged for most patients. Partial metabolic responders by PERCIST had longer PFS and OS (n = 5, 20+ months) versus those with stable (n = 9; PFS = 9.2 mos, OS = 8.7 mos) and progressive (n = 2; PFS = 5.4 mos, OS = 12.1 mos) metabolic disease, p = 0.09 and 0.42, respectively. By RECIST, longer PFS and OS was seen for stable (n = 12, PFS = 8.3 mos, OS = 17.7 mos) versus progressive (n = 4; PFS = 3.7 mos, OS = 7.5 mos) disease, p = 0.16, 0.02, respectively. OS was not reached, but estimated ≥20 mos, for 4 patients with RECIST SD and PERCIST PMR, compared to OS of 17.7 mos for other patients with RECIST SD.
Conclusions:
FDG-PET/CT identified more bone metastases and greater numbers of quantitative and qualitative treatment responses in mRCC compared to CT and bone scan. FDG-PET/CT also may identify a sub-group of patients with better outcomes than predicted by standard imaging modalities.
INTRODUCTION
Osseous metastases in renal cell carcinoma (mRCC) negatively impact survival [1, 2]. Their detection is critical to accurately assess tumor burden to optimize therapy and monitor therapy response. 99mTc-methyl-diphosphonate (MDP) bone scintigraphy is suggested to assess for suspected bone metastases in National Comprehensive Cancer Network (NCCN) guidelines despite American College of Radiology’s (ACR) Appropriateness Criteria rating of “usually not appropriate” [3]. In mRCC, bone scans underestimate the extent of bone metastases because they are typically osteolytic [4–6].
The use of positron emission tomography/computed tomography with [18F]-fluorodeoxy-2-D-glucose (FDG-PET/CT) in mRCC is not well defined [7, 8]. FDG-PET/CT directly images metabolically active tumor and may be more sensitive than bone scan for detecting early bone marrow and lytic osseous metastases. Mixed results have been reported regarding diagnostic performance of FDG-PET alone for detecting bone metastases in mRCC compared to bone scan [9] and bone scan plus CT [10]. Hybrid FDG-PET/CT has higher sensitivity than FDG-PET alone for detecting extra-renal mRCC with similar specificity [11].
Early studies have suggested a role for FDG-PET/CT in assessing therapy response and predicting outcomes in mRCC [12–14], but RECIST 1.1 remains the current standard of assessment in most clinical trials of mRCC. To test our hypothesis that FDG-PET/CT detects more bone metastases than bone scan and provides a more accurate measure of tumor response compared to CT and bone scan in patients with mRCC, we performed an exploratory imaging sub-study as part of a phase II study in patients receiving radium-223 and anti-vascular endothelial growth factor (VEGF) therapy using new metabolic imaging criteria (PERCIST 1.0).
MATERIAL AND METHODS
Study design and patients
This is a retrospective analysis of imaging data prospectively collected as part of a two-cohort trial of radium-223 and anti-VEGF therapy in mRCC [15]. The trial was conducted in full concordance with Declaration of Helsinki principles and Good Clinical Practice (NCT02406521) and approved by our institutional review board. All patients gave informed written consent.
Treatment-naïve patients were assigned to receive pazopanib (800 mg orally once daily) and previously treated patients were assigned to receive sorafenib (400 mg orally twice daily). The study design included dose modifications. Radium-223 was to be administered to all patients every 28 days for up to 6 cycles [16]. The imaging sub-study considered the two treatment cohorts together to evaluate different imaging methods, not differences in response between the two treatment cohorts. Patients had histologically-proven renal cell cancer, ≥1 bone metastasis on imaging and non-measurable bone-only disease was allowed. Eligibility criteria, treatment data, and the safety and efficacy results of the therapeutic clinical trial have been reported [15].
Imaging protocols
Imaging response assessments were performed per standard of care with contrast-enhanced CT and bone scans at baseline and every 8 weeks. The trial design prospectively included standard of care FDG-PET/CT at baseline and at 8 weeks after starting therapy. Baseline scans were obtained within 28 days of enrollment. All scans were obtained following our standard institutional protocols and described briefly.
Patients fasted for ≥4 hours prior to receiving an intravenous injection of FDG (mean injected activity was 509.3±22.9 MBq at baseline and 507.9±23.0 MBq at week 8, t-test p = 0.87). After a planned uptake phase of 60 minutes, 3D PET images were acquired from the skull base through the thighs, 3–5 minutes per bed position (Biograph 16 HiRez, Siemens Healthineers or Discovery ST, GE Healthcare). Non-contrast low-dose CT imaging (3.75- to 5 mm axial slice thickness; kV 140; weight-based mA 90–120) was performed over the same range without breath-hold for anatomic correlation and attenuation correction of PET images.
Contrast-enhanced CT was performed following standard clinical protocols at our institution. The routine oncology protocol was employed on multidetector CT scanners (64 detector row, General Electric Discovery CT 750HD or General Electric Revolution GSI) using oral contrast in all patients, and intravenous contrast in patients with adequate estimated glomerular filtration rate (eGFR) and no known allergy to the contrast. Patients were scanned in the supine position, from supraclavicular fossa to pubic symphysis (0.6–1.0 mm collimation, pitch of 0.65–1.00, 120 kVp, and 160–280 mA), and images were reconstructed in 5 mm axial plane and 4 mm coronal plane. Contrast-enhanced scans were performed after 75–100 cc iohexol administration (Omnipaque-350, GE Healthcare Inc., based on eGFR), empirically timed with chest images obtained in the arterial phase (30-second delay) and abdomen images obtained in the portal venous phase (70-second delay). Images were reviewed and measured on Picture Archiving and Communication System (PACS) (Centricity, GE Healthcare Inc.).
Bone scan was performed 2–3 hours following the intravenous administration of 925 MBq of 99mTc-methylene diphosphonate. Whole body images were acquired with a large field of view gamma camera (E. CAM or Symbia Intevo, Siemens Healthineers) and the following parameters: low-energy high resolution collimator, scan speed 18 cm/min, and 256×1024 matrix. Static planar images of the lateral skull were also routinely acquired.
Image interpretation and response criteria
Response assessments were performed for the published clinical trial [15] by the Tumor Imaging Metrics Core Lab at the Dana-Farber/Harvard Cancer Center. Objective response was determined using RECIST 1.1 [17] every 8 weeks. RECIST 1.1 definitions of response are shown in Supplemental Table 1. Metabolic response between the baseline and week 8 FDG-PET/CT scans was evaluated according to PERCIST [18] by a board-certified radiologist (KK) and board-certified nuclear medicine physician (HJ) in consensus. FDG-PET/CT at baseline and after 8 weeks of treatment (PET2) were reviewed for abnormal FDG uptake, defined as increased uptake greater than background not consistent with normal anatomy or physiology. Maximum standardized uptake value adjusted for body weight (SUVmax) and peak SUV adjusted for lean body mass (SULpeak) were measured in the five hottest lesions at baseline and on PET2 (Hybrid Viewer 2.2D, Hermes Medical Solutions, Stockholm, Sweden). Per PERCIST [18], metabolic response on PET2 was categorized using changes in SULpeak in the single hottest lesions at baseline and PET2 as follows: complete metabolic response (CMR) - resolution of all abnormal FDG uptake to the level of blood pool; partial metabolic response (PMR) - ≥30% and 0.8 SUL unit decrease in SULpeak, no new lesions; progressive metabolic disease (PMD) - >30% and 0.8 SUL unit increase in SULpeak or new FDG uptake consistent with mRCC; stable metabolic disease (SMD) – not CMR, PMR or PMD. We explored using up to the 5 hottest lesions on baseline and PET2 for categorizing metabolic response.
Because this study focused on investigating changes in bone lesions, SUVmax and SULpeak in up to 5 additional bone lesions were also measured. Metabolic activity in up to 10 total lesions per patient were measured (5 hottest + 5 additional bone lesions). For bone lesions measured on FDG-PET/CT, quantitative and qualitative assessments on CT were also recorded, including: 1) presence or absence of a CT correlate; 2) ill-defined or well-defined borders; 3) low-density, high-density, or mixed; and 4) heterogeneous or homogenous. CT Hounsfield units (HU) were recorded in a 1 cm region of interest corresponding to FDG uptake in bone.
Bone response was assigned according to MD Anderson Bone Criteria (MDA) [19] independently from the PERCIST response by a board-certified radiologist (KK) and board-certified nuclear medicine physician (HJ) in consensus. The number of abnormal foci of radiotracer uptake on bone scan at baseline and after 8 weeks of treatment (Bone2) was recorded and grouped; <5, 5–10, 11–20, >20. The abnormal bone findings recorded on FDG-PET/CT were evaluated on bone scan as visible or not visible.
Bone lesions measured as target lesions on baseline FDG-PET/CT were assessed independently by a third board-certified nuclear radiologist (CS) for their presence or absence on the baseline contrast-enhanced CT scans and bone scans to assess inter-reader variability.
Clinical outcomes and statistical analyses
Progression-free survival (PFS) was defined as time from clinical trial registration to earliest date of disease progression or death from any cause, whichever occurred first. Patients alive without disease progression were censored on the date of last adequate disease assessment. Overall survival (OS) was defined as time from clinical trial registration to death from any cause. Patients still alive were censored at date of last contact. Symptomatic skeletal events (SSE) were defined as use of external beam radiation to relieve bone pain, occurrence of new/symptomatic pathologic fracture or spinal cord compression, or tumor-related orthopedic surgical intervention. Time to SSE was defined as time from clinical trial registration to first SSE. Patients alive without an SSE were censored on last contact date.
Percent changes in SULpeak, SUVmax and HU were calculated between baseline (S0) and 8-week (S1) scans:
Associations between percent change in SULpeak, SUVmax, and HU to OS, PFS, and time to SSE were evaluated using Kaplan-Meier methodology. Log-rank tests were used to test for differences in event-time distributions. For groups whose median event time was not reached (NR), a censored median time was reported based on Kaplan-Meier curves. All P-values are two-sided, and all confidence intervals are at the 95% level, with statistical significance defined as P≤0.05.
The kappa statistic was used to describe inter-reader variability for the presence or absence of target bone lesions measured on baseline FDG-PET/CT on baseline contrast-enhanced CT scans and bone scans. Kappa < 0 represented no agreement, between 0.00–0.20 slight agreement, 0.21–0.40 fair agreement, 0.41–0.60 moderate agreement, 0.61–0.80 substantial agreement, and 0.81–1.00 almost perfect agreement [20].
RESULTS
Patients
Twenty-two of 30 patients enrolled on the clinical trial completed baseline FDG-PET/CT, CT, and bone scans (median age 60 years, range 41–82, 16 men); 6 were taken off study prior to scans at 8 weeks of therapy (Fig. 1). Sixteen patients had FDG-PET/CT, CT, and bone scans at baseline and after 8 weeks of therapy. Median time between FDG-PET/CT scans and bone scans, including baseline and the 8-week timepoints, was 3 days (range 0–16 days), between FDG-PET/CT and contrast-enhanced CT was 3 days (range 1–17 days), and between bone scan and contrast-enhanced CT was 0 days (range 0–20 days). Median follow-up was 23.9 months (range 6.0–27.6 months) with 9 deaths observed (6 from progressive mRCC, 3 from unknown causes). Table 1 shows individual data for 16 patients who had baseline and PET2 scans. Five had bone-only metastatic disease.
Fig. 1
Flowchart of patients included in the study.
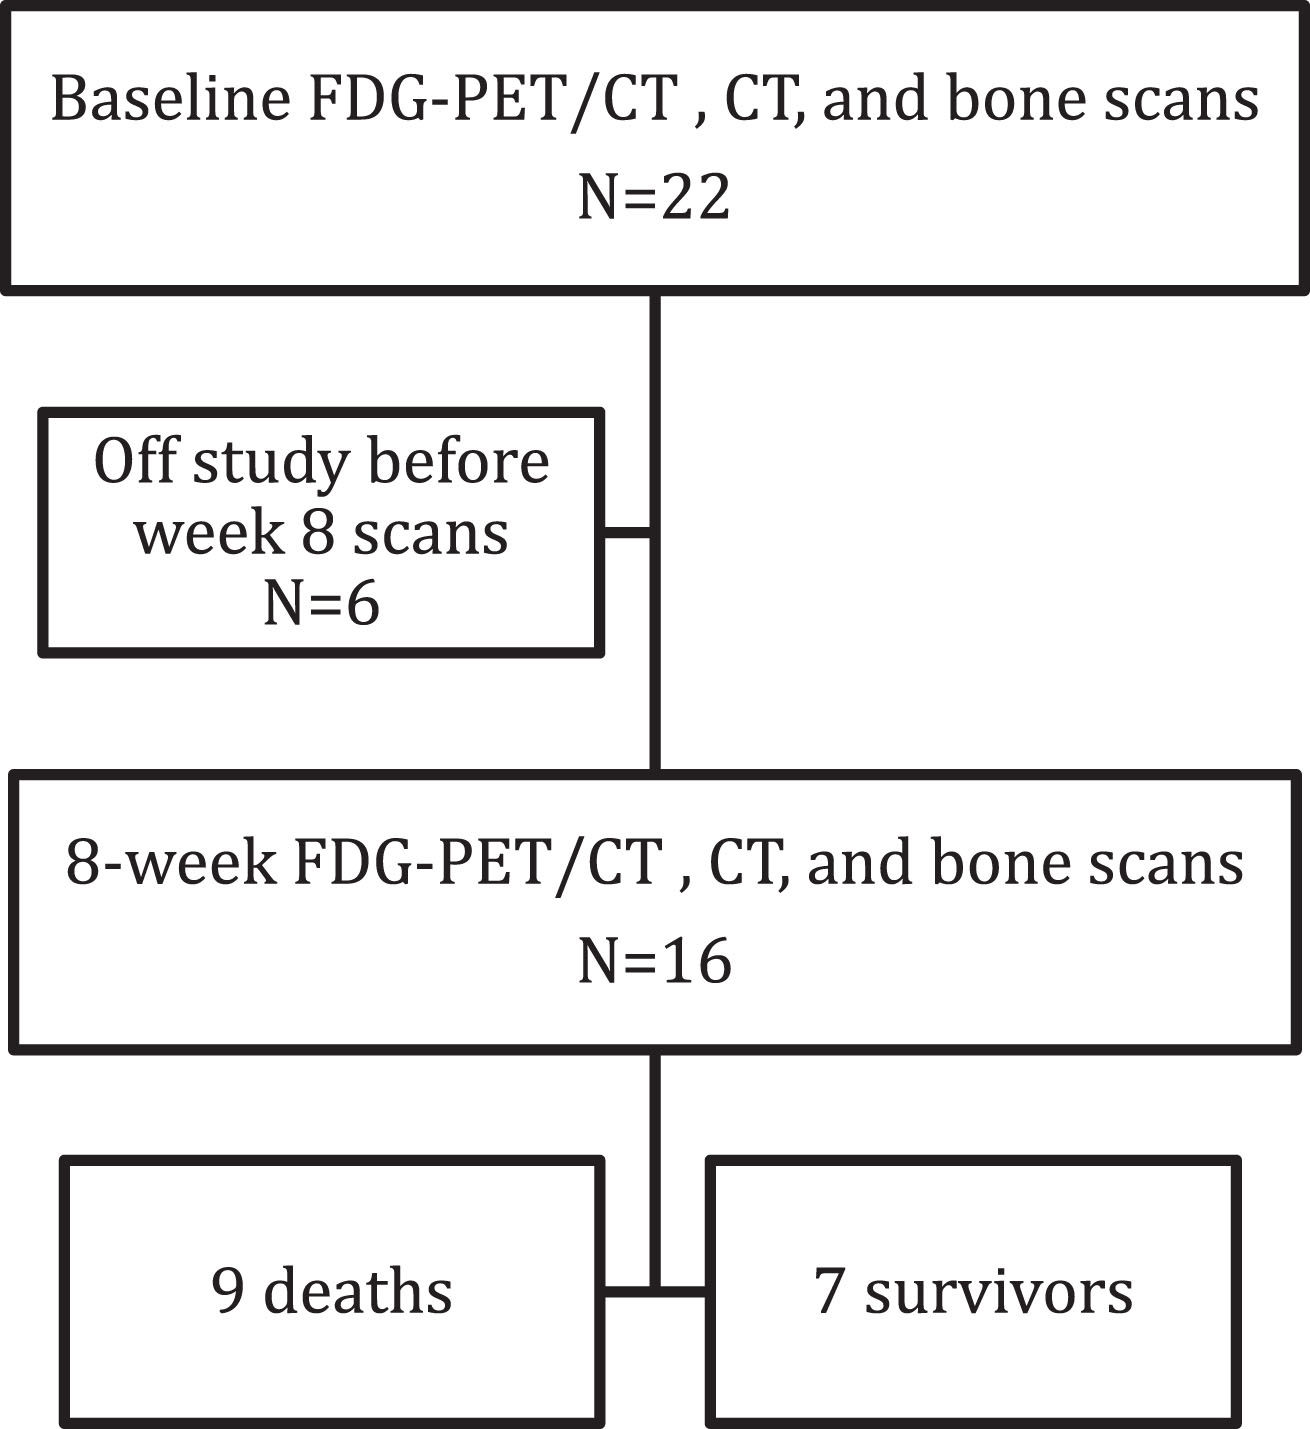
Table 1
Individual Data for Patients Undergoing Baseline and Week 8 FDG-PET/CT, CT and Bone Scans
| Patient | No. of Lesions | Response after 8 Weeks of Treatment | Outcomes | |||||
| Bone | Soft tissue | PERCIST | RECIST | MD | OS** | PFS† | Time to SSE‡ | |
| 1.0 | 1.1 | Anderson | (months) | (months) | (months) | |||
| 1 | 5 | 0 | SMD | PD | SD | 5.95 | 1.81 | 1.81* |
| 2 | 6 | 4 | SMD | PD | PD | 6.31 | 5.42* | 5.42* |
| 4 | 1 | 1 | PMR | SD | SD | 27.60* | 21.19* | 21.19* |
| 5 | 5 | 3 | SMD | SD | SD | 27.07* | 12.78 | 12.78* |
| 7 | 1 | 5 | PMD | SD | PD | 17.71 | 5.52 | 5.52* |
| 9 | 2 | 4 | SMD | PD | SD | 8.71 | 3.65 | 3.65* |
| 10 | 1 | 1 | PMR | SD | SD | 23.89* | 3.68* | 3.68* |
| 11 | 5 | 2 | SMD | SD | SD | 5.98 | 3.61 | 1.28 |
| 12 | 6 | 0 | PMR | SD | PR | 11.83 | 8.25 | 8.25* |
| 13 | 5 | 1 | SMD | SD | PR | 7.79 | 5.59 | 5.78 |
| 14 | 6 | 3 | PMR | PD | PR | 16.62 | 5.45* | 0.20 |
| 16 | 1 | 1 | SMD | SD | SD | 11.43* | 4.60* | 3.42 |
| 19 | 2 | 0 | PMR | SD | SD | 15.44* | 8.25* | 2.27 |
| 20 | 4 | 3 | PMD | SD | CR | 6.51 | 5.22 | 3.65 |
| 21 | 5 | 0 | SMD | SD | PR | 14.92* | 6.47* | 6.34 |
| 22 | 1 | 0 | SMD | SD | PR | 13.73* | 7.29* | 7.29* |
*Patients censored for OS, PFS, or SSE; **Overall Survival (months); † Progression free survival (months); ‡ Time to symptomatic skeletal event (months).
Imaging response assessment and correlation with clinical outcomes
For 16 patients with baseline FDG-PET/CT and PET2, 5 had PMR per PERCIST, 9 had SMD, and 2 had PMD. There were no complete or partial responses per RECIST 1.1; 12 patients had SD and 4 had PD. Based on MDA criteria, 1 patient had CR, 5 had PR, 8 had SD, and 2 had PD. A representative example of treatment response after 8 weeks on FDG-PET/CT, CT, and bone scan is shown in Fig. 2.
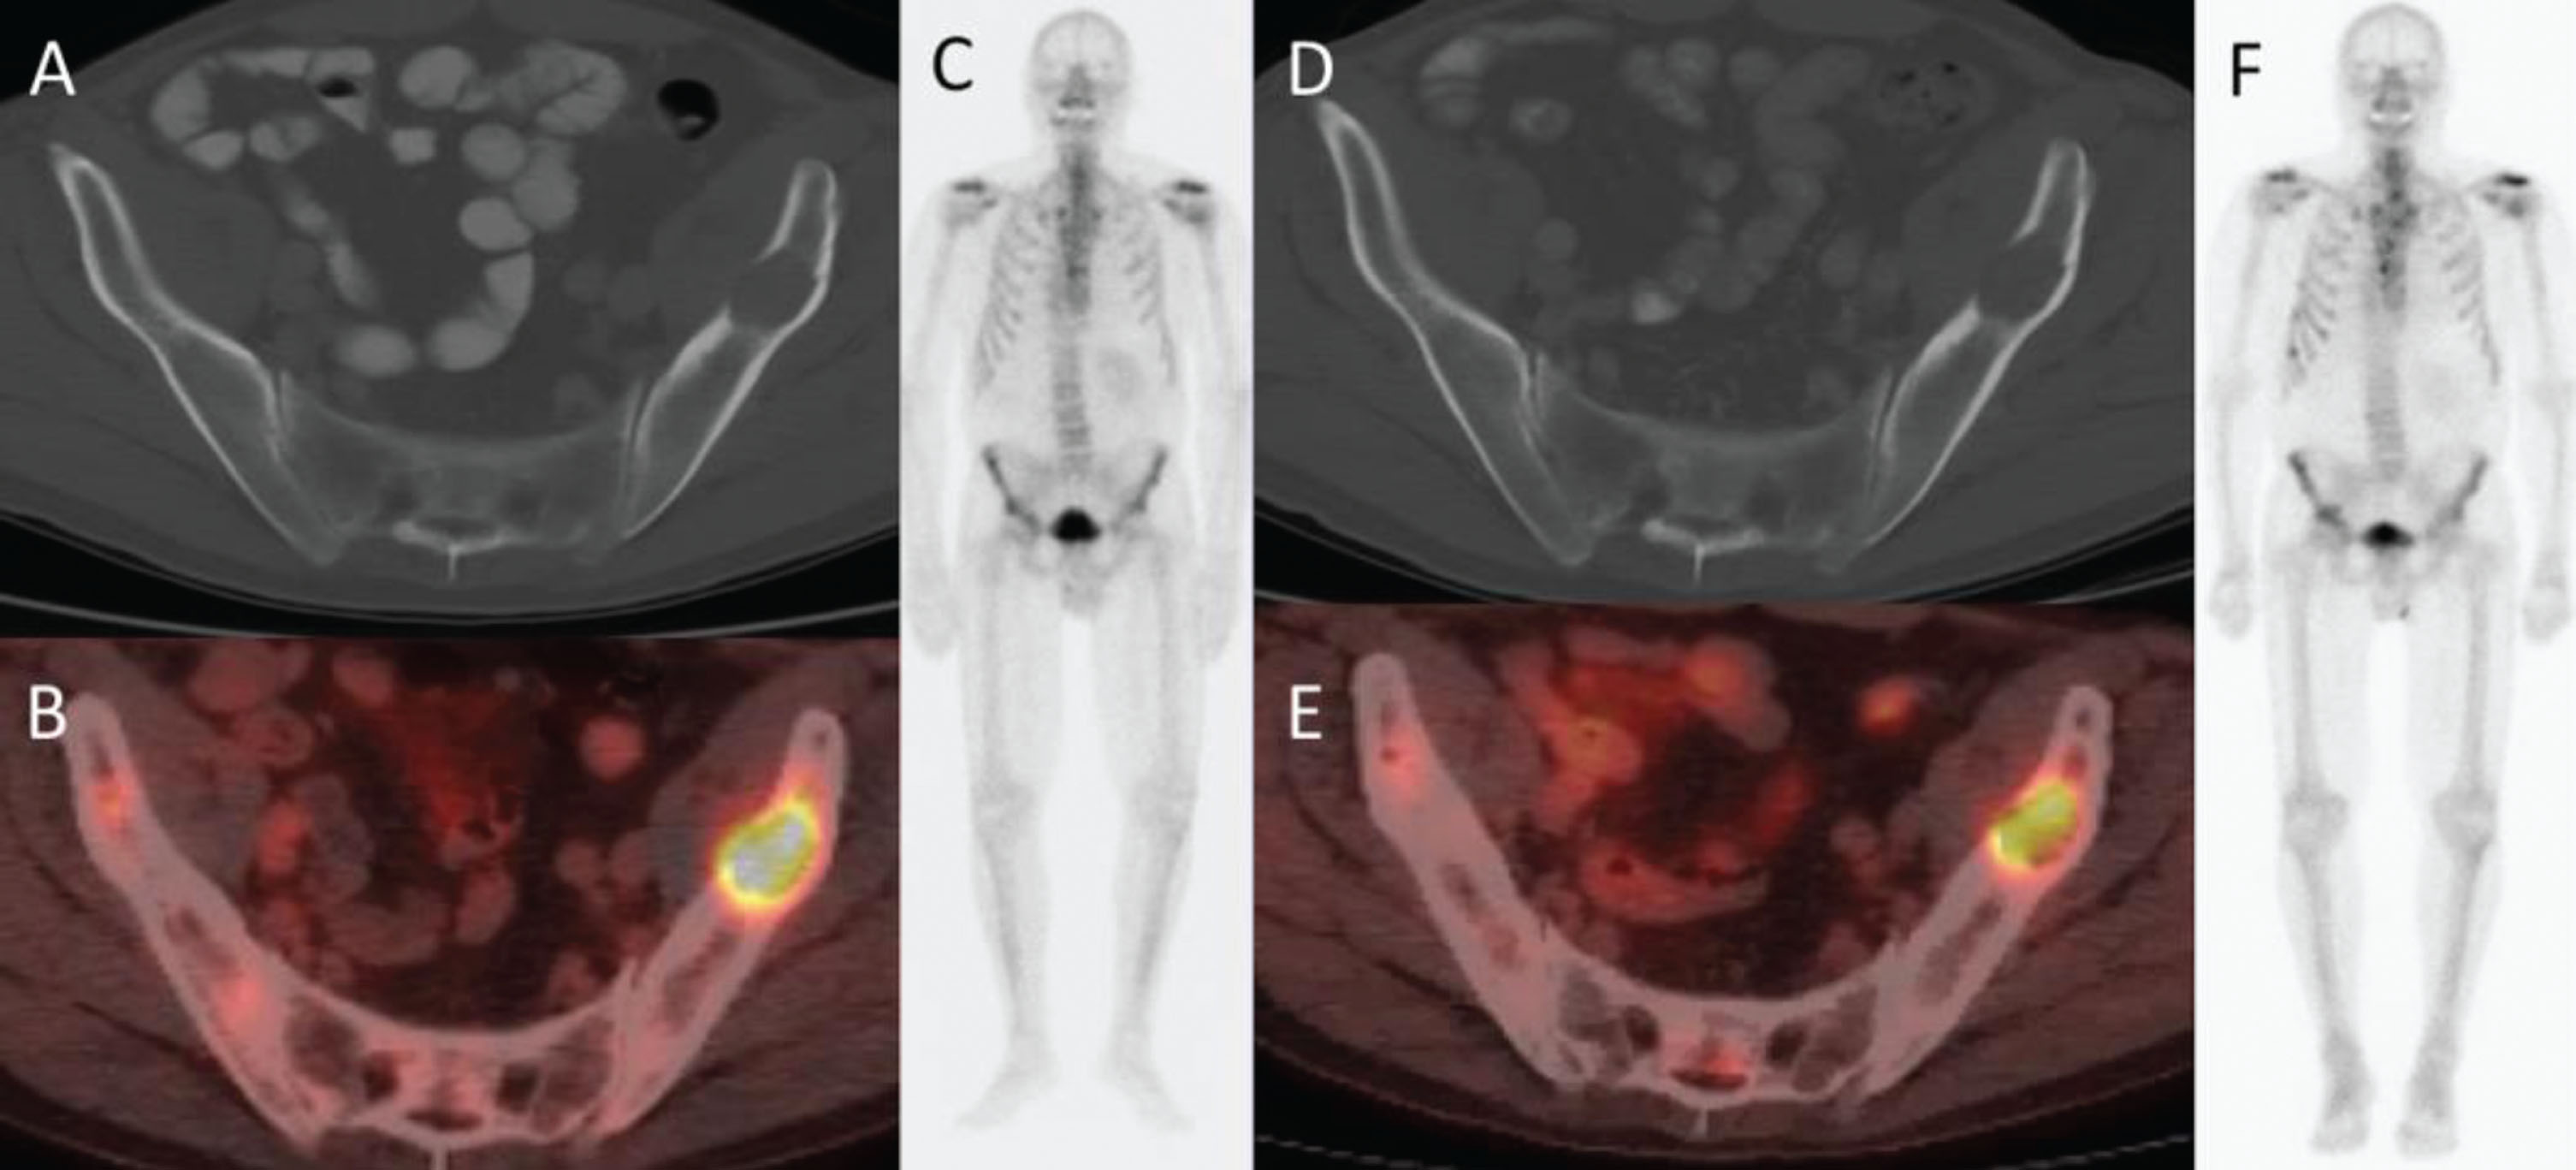
Fig. 2
66-year-old man with metastatic renal cell carcinoma. (A) CT and (B) PET/CT at baseline show an FDG-avid lytic lesion in the left iliac bone. (C) Anterior whole-body bone scan does not show the lesion. (D) CT at 2 cycles shows an unchanged lytic lesion, (E) PET/CT shows >50% decrease in SUVmax, (F) and anterior whole-body bone scan again does not show the lesion.
Median PFS in the cohort was 8.3 months (95% CI: 5.5-NR) and median OS was 16.6 months (95% CI: 7.8-NR). Table 2 shows median PFS and OS according to response categories within the response criteria evaluated. With a small number of patients in each response category, no statistically significant differences in PFS and OS were found based on response/clinical benefit (PR, SD) or lack of response (PD) between response groups according to PERCIST. However, median PFS, OS, and time to SSE were not reached for those with PMR but estimated to be at least 20 months in this group. Metabolic responders (PMR), using up to the 5 most metabolically active lesions, had longer PFS, OS and time to SSE compared to metabolic non-responders (Table 3).
Table 2
Outcomes based on PERCIST 1.0, RECIST 1.1, and MD Anderson Bone Response Criteria
| Response criteria and category | N | OS* (months) | P-value | PFS† (months) | P-value | SSE‡ (months) | P-value |
| PERCIST 1.0a | |||||||
| Partial metabolic response | 5 | 20+ | 0.42 | 20+ | 0.09 | 20+ | 0.96 |
| Stable metabolic disease | 9 | 8.7 | 9.2 | 6.3 | |||
| Progressive metabolic disease | 2 | 12.1 | 5.4 | 3.7 | |||
| RECIST 1.1a | |||||||
| Stable disease | 12 | 17.7 | 0.02 | 8.3 | 0.16 | 6.3 | 0.96 |
| Progressive disease | 4 | 7.5 | 3.7 | 5+ | |||
| MD Anderson Bone | |||||||
| Complete response | 1 | 6.5 | 0.37 | 5.2 | 0.53 | 3.7 | 0.62 |
| Partial response | 5 | 16.6 | 8.3 | 6.3 | |||
| Stable disease | 8 | 24+ | 12.8 | 20+ | |||
| Progressive disease | 2 | 12.0 | 5.5 | 5+ |
*Median overall survival; †Median progression free survival; ‡Median time to symptomatic skeletal event. aNo PERCIST complete metabolic response or RECIST complete or partial responses were observed. + Median time to event was not reached in this group, the median event time was estimated to be at least the reported value, based on Kaplan-Meier curves.
Table 3
Tumor Response of up to the Five Most Metabolically Active Lesions per Patient versus Clinical Outcomes
| N | OS*(months, 95% CI) | PFS† (months, 95% CI) | SSE‡ (months, 95% CI) | |
| Responders** | 6 | 17.7 (16.62-NR) | 8.25 (5.52-NR) | 8+(2.27-NR) |
| Non-responders | 10 | 8.25 (6.31-NR) | 5.59 (3.65-NR) | 6.34 (3.65-NR) |
*Overall survival; †Progression free survival; ‡Time to symptomatic skeletal event **Responders: greater than 30% decrease in SUVmax of up to 5 hottest lesions between baseline and cycle 2 scans + Median time to event was not reached in the group; the median event time was estimated to be at least the reported values, based on Kaplan-Meier curves.
According to RECIST 1.1, patients with SD at 8 weeks had longer median OS compared to those with PD (17.7 versus 7.5 months, p = 0.02). Four patients with SD by RECIST 1.1 had PMR by PERCIST (Table 1). Median OS for those 4 patients was not reached, but was estimated to be at least 20 months, compared to the median OS of 17.7 months for patients with SD by RECIST 1.1 but no PMR.
CT and bone scan characteristics of bone metastases detected on FDG-PET/CT at baseline
In 16 patients with baseline and PET2 scans, fifty-five target bone lesions were identified on either baseline CT (n = 45) or baseline bone scan (n = 34) (Table 4, Figs. 3 and 4) Ten lesions on FDG-PET/CT but not CT were from 4 patients. Supplemental Table 2 includes these results for all 22 patients with baseline scans. There was substantial agreement between readers for the presence or absence of target lesions detected on FDG-PET/CT scans on contrast-enhanced CT (agreement = 90.9%, kappa = 0.65, 95% CI 0.38–0.93) and bone scans (agreement = 83.6%, kappa = 0.65, 95% CI 0.44–0.86) (Supplemental Table 3).
Fig. 3
42-year-old man with metastatic renal cell carcinoma. Baseline PET/CT imaging shows osseous metastases at (A) L3 (arrow) and (B) in the pubic bones (arrows). CT does not show the metastatic lesions at L3 (C, arrow) or in the pubic bones (D, arrows).
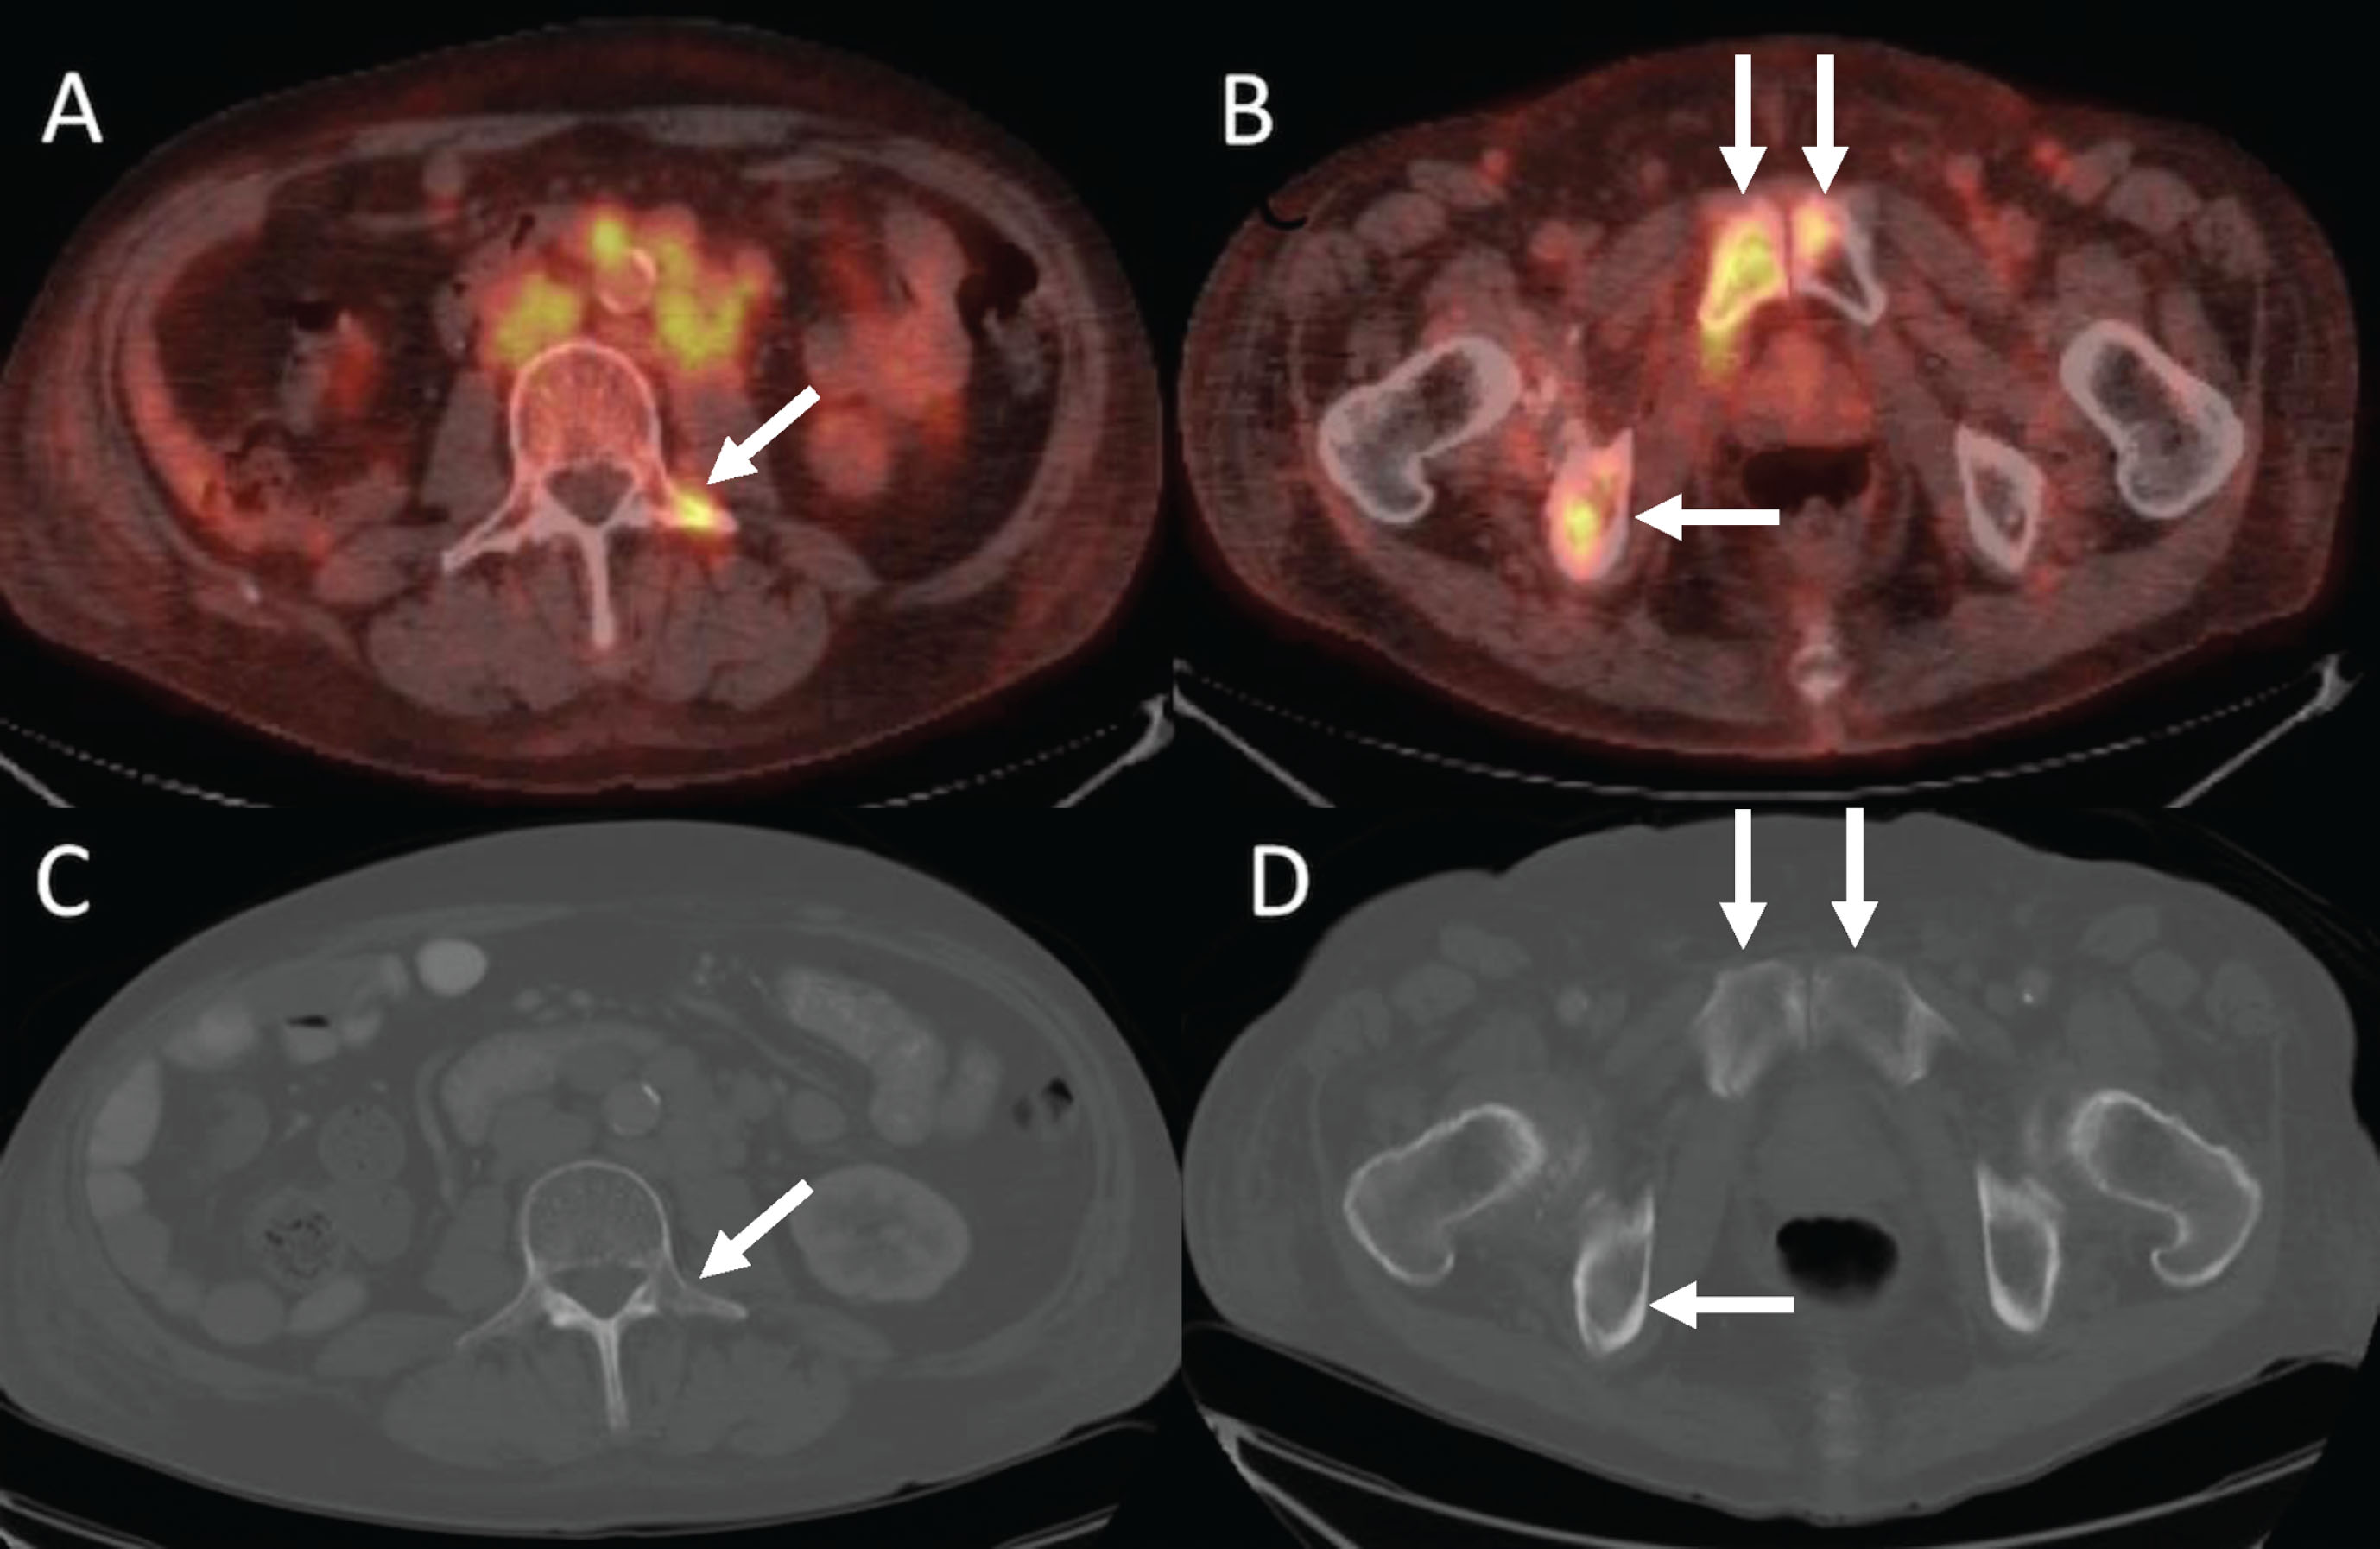
Fig. 4
66-year-old man with metastatic renal cell carcinoma. (A) FDG-PET/CT shows numerous foci of intense FDG uptake in the bones. While some lesions have corresponding lytic lesions (bilateral iliac bones and see Fig. 4), the extent of FDG uptake is greater than the lucencies and others have no CT correlate (e.g., sternum, T7). (B) Bone scan significantly underestimates the amount of metabolically active bone metastases.
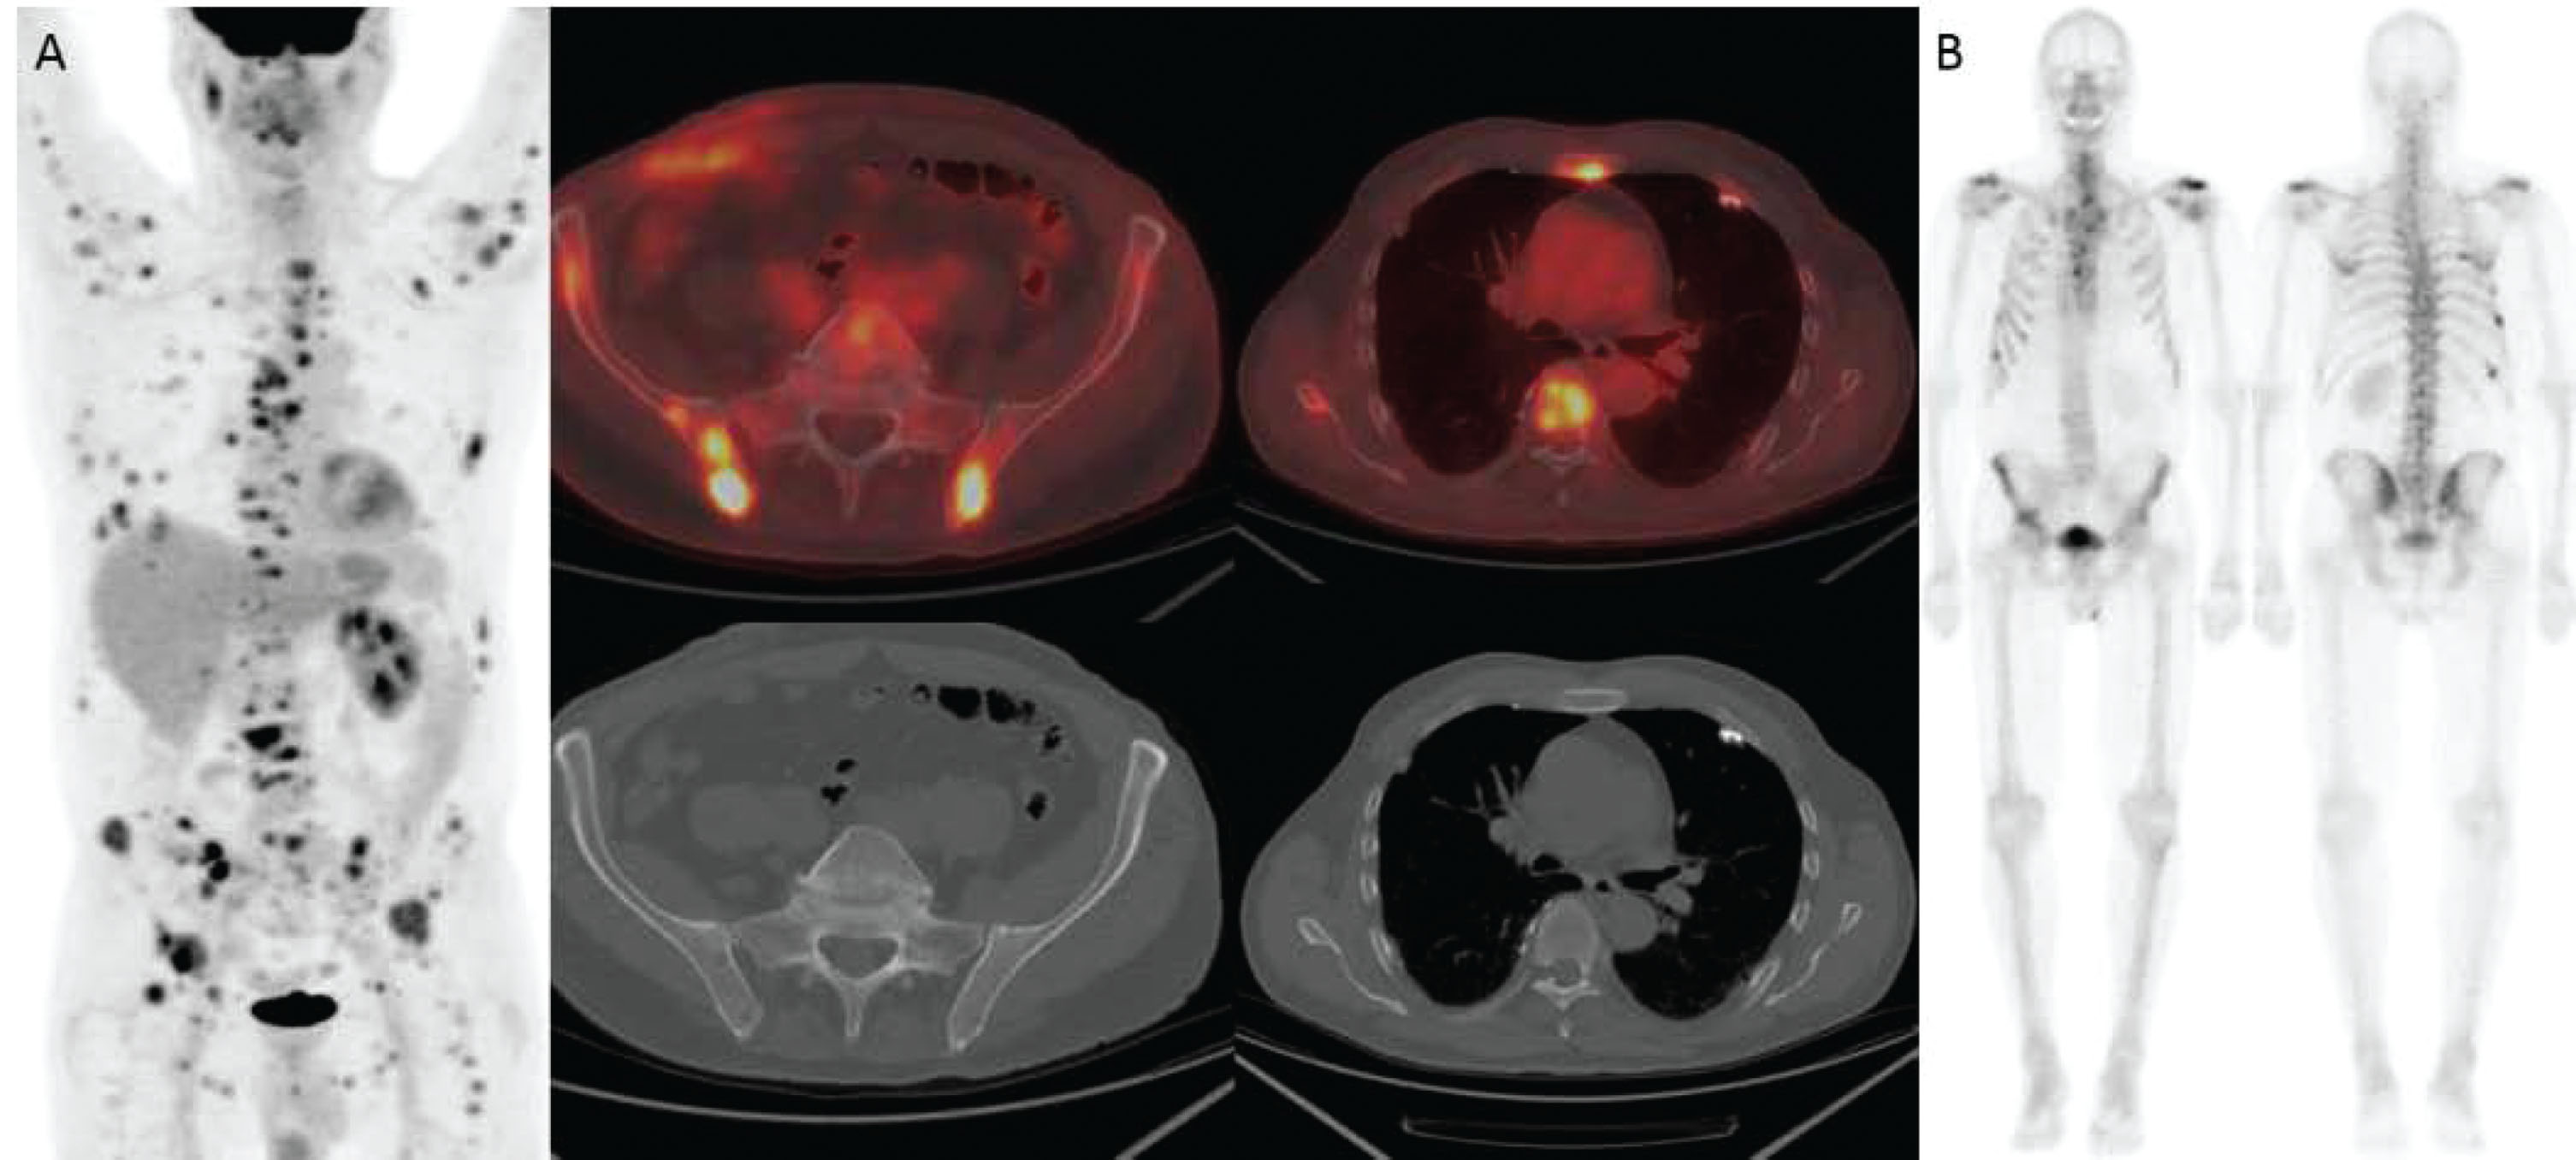
Table 4
Number of baseline bone lesions visible on FDG-PET/CT versus CT and bone scan (N = 16)
| CT positive | CT negative | Bone positive | Bone negative | |
| PET positive | 45 | 10 | 34 | 21 |
| PET negative | 0 | 0 | 0 | 0 |
| Bone positive | 27 | 7 | ||
| Bone negative | 18 | 3 |
Qualitative and quantitative imaging changes in bone metastases after 8 weeks of treatment
On FDG-PET/CT, mean percent change in SUVmax was –24.5% for the single hottest bone lesion at baseline and PET2 and –23.6% for up to the 5 hottest bone lesions. The results were similar for SULpeak (Supplemental Table 4). On CT, percent change in HU was –9.5% and –6.6%, respectively. There was no significant correlation between percent change in either SUVmax or SULpeak and HU (Supplemental Table 4).
Qualitative CT parameters of bone lesions did not change from baseline to 8-week follow-up scans (Table 3). Thirteen patients had no change and 3 had a decrease in the number of bone metastases detected between baseline bone scan and Bone2.
Table 5
Qualitative Parameters for Bone Metastases on CT and Bone Scan
| Week 8 Scans | |||||
| Baseline | Heterogeneous | Homogeneous | |||
| CT Homogeneity | |||||
| Heterogeneous | 15 | 0 | |||
| Homogeneous | 0 | 30 | |||
| CT Density | High | Low | Mixed | Soft Tissue | |
| High | 4 | 0 | 0 | 0 | |
| Low | 0 | 16 | 0 | 0 | |
| Mixed | 0 | 0 | 10 | 0 | |
| Soft tissue | 0 | 0 | 0 | 15 | |
| Number of Lesions on Bone Scan | 0 | <5 | 5–10 | 10–20 | >20 |
| 0 | 1 | 0 | 0 | 0 | 0 |
| <5 | 0 | 8 | 0 | 0 | 0 |
| 5–10 | 0 | 3 | 2 | 0 | 0 |
| 10–20 | 0 | 0 | 0 | 1 | 0 |
| >20 | 0 | 0 | 0 | 0 | 1 |
DISCUSSION
This study is one of the first to prospectively compare standard assessments of response to metabolic response using FDG-PET/CT in patients with mRCC within a therapeutic clinical trial. The therapeutic trial provided a unique setting to assess response and correlate imaging assessments with critical time to event outcomes as well as to study changes in individual bone lesions across multiple imaging modalities. Because response to treatment in bone lesions is difficult to characterize with the most commonly used anatomically-based imaging modalities (CT) and response criteria (RECIST 1.1) in mRCC, this study represents a special effort to characterize response using FDG-PET/CT in this setting.
To optimally assess response to treatment, imaging modalities must first be able to detect the relevant lesions. Although not primarily designed as a detection study, FDG-PET/CT identified more metabolically active bone metastases from mRCC in our cohort compared to the other imaging modalities. Specifically, many bone lesions detected in our cohort on FDG-PET/CT (38%, 21/55) or CT (40%, 18/45) were not detected on bone scan. This known insensitivity of bone scan for detecting lytic metastases is likely a reason for the limited number of studies comparing FDG-PET/CT and bone scan for detecting bone metastases from mRCC [21, 22]. In 18 patients with mRCC, bone scan missed lesions in 5 (27%) compared to FDG-PET [9]. This study was not designed as a detection/sensitivity-specificity study, however, at baseline we showed substantial agreement for classifying FDG-avid target bone lesions as present or absent on contrast-enhanced CT and bone scan.
Kang et al reported lower sensitivity of FDG-PET (77%) versus CT and bone scan (94%) for detecting bone metastases [10]. This study, however, included a mixed population regarding scan indication and provided little detail regarding prior systemic therapy at the time of FDG-PET/CT to determine whether individual lesions were inherently less metabolically active or inactive due to treatment [10]. Like breast cancer (33), FDG-avid lytic lesions in mRCC may also become increasingly sclerotic and non-FDG-avid over time with successful treatment. FDG-PET/CT may enhance detection of active tumor burden compared to CT in the setting of multiple prior therapies and provide the most accurate baseline for following response to a new therapy.
In our cohort, only half of the bone metastases had a soft tissue component to qualify as “measurable” disease per RECIST 1.1 [17]. Unlike with traditional bone scan, use of PET allowed generally “unmeasurable” bone lesions to be quantitatively assessed for response. Validation of these findings in larger studies may open opportunities to enroll patients on clinical trials who have bone-only or bone-dominant disease that is generally considered unmeasurable by RECIST 1.1 and thus often deemed ineligible as they cannot be assessed for response.
Another important finding in the current exploratory study is that FDG-PET/CT may identify a sub-group of patients with mRCC who have a better outcome than determined by standard anatomic response assessment. Median PFS, OS, and time to SSE were at least 20 months for 5 patients with PMR by PERCIST. This is at least as long as the same outcome parameters for those with SD by RECIST 1.1. PERCIST was able to further separate out the SD RECIST 1.1 cohort into two distinct groups — median OS for 4 patients with PMR by PERCIST but SD by RECIST 1.1 was estimated to be at least 20 months, compared to the median OS of 17.7 months for all patients with SD by RECIST 1.1 but no PMR. It is very difficult to draw conclusions regarding statistical significance of the differences between groups and response criteria due to the small number of patients in the study and individual response groups but this deserves further study as if true would enhance prognostic discussions and/or potentially identify patients who may benefit from therapy intensification.
Several studies have previously reported the ability of FDG-PET/CT to predict outcomes in patients undergoing treatment for mRCC [12–14, 23–29], but the methodologies between these studies were variable limiting overall conclusions. Our study used PERCIST which provides greater detail on lesion analysis and may be less ambiguous [18] than other PET based criteria [30, 31].
In a prospective study of 39 patients with mRCC receiving tyrosine kinase inhibitors, metabolic response defined using PERCIST or volumetric changes of total lesion glycolysis predicted PFS and OS while changes in SUVmax, which is used in EORTC criteria, did not [25]. Lyrdal et al. also showed early decreases in metabolic activity in both soft tissue and osseous metastases from mRCC treated with sorafenib and suggested that monitoring response with FDG-PET/CT may be advantageous compared to RECIST 1.1, which only measures soft tissue metastases [32].
Although less common, we have observed the use of bone specific response criteria in clinical trials in the setting of bone-only or bone-dominant metastatic disease. In our study, both the number and visual appearance of most lesions seen on bone scan did not change from baseline to 8 weeks after starting treatment. These results are concordant with others showing that PET is more sensitive than bone scan in evaluating treatment effect [33]. The utility of bone scan in monitoring treatment response in mRCC appears limited.
Our study has several limitations, most notably the small number of patients and single institution design. While the prospective design mitigated some bias and all patients received anti-VEGF and radium-223 therapy; we did not consider variability in outcomes of patients with osseous metastases in mRCC based on other factors including ECOG performance status, location of additional sites of disease, and time to development osseous metastases [34]. Although some lesions detected on PET but not on CT may be false positives, approximately half of the time, bone lesions on PET do not have a morphologic CT correlate [35].
Further, not all patients enrolled in the therapeutic trial underwent the FDG-PET/CT scanning (22 of planned 30) and of those 22, only 16 had PET2. The major reason for not obtaining FDG-PET/CT was lack of insurance coverage. While the current evidence for using FDG-PET/CT to detect and monitor response in mRCC is based on small retrospective studies, an interdisciplinary consensus in 2018 recognized the need for more precise surveillance algorithm for monitoring patients with bone metastases from mRCC [36].
In conclusion, our exploratory study corroborates trends suggesting that FDG-PET/CT may better monitor response and predict outcome compared to the current standard response assessment using CT and bone scan in mRCC, especially in patients with bone metastases. It is critical that future prospective clinical trials include well-designed imaging endpoints to further test the hypothesis that combined FDG PET/CT should replace CT alone and bone scan for measuring tumor response in mRCC and to evaluate cost-effectiveness, which has been a major logistical barrier to rigorously studying FDG PET/CT in clinical trials.
CONFLICTS OF INTEREST
Elizabeth H. Dibble declares that she has no conflict of interest.
Sasha Kravets declares that she has no conflict of interest.
SuChen Cheng declares that she has no conflict of interest.
Kathryn P. Gray has stock and other ownership interests in MDGN.
Amanda Abbott declares that she has no conflict of interest.
Dominick Bossé has had an advisory role or received honoraria from Pfizer, BMS, AstraZeneca, AbbVie, Amgen, and Ipsen.
Mark M. Pomerantz declares that he has no conflict of interest.
Bradley A. McGregor has had a consulting or advisory role with Astellas, Exelixis, Genentech, and Seattle Genetics.
Lauren C. Harshman has received consulting fees from Genentech, Dendreon, Pfizer, Medivation/Astellas, Exelixis, Bayer, Kew Group, Corvus, Merck, Novartis, Michael J Hennessy Associates (Healthcare Communications Company and several brands such as OncLive and PER), Jounce, and EMD Serono; Research funding from Bayer, Sotio, Bristol-Myers Squib, Merck, Takeda, Dendreon/Valient, Jannsen, Medivation/Astellas, Genentech, Pfizer, Endocyte (Novartis), and support for research travel from Bayer and Genentech.
M. Dror Michaelson declares that he has no conflict of interest.
Rana R. McKay has received research funding from Bayer (Inst) and Pfizer (Inst).
Toni K. Choueiri has received honoraria from NCCN and UpToDate; he has a consulting or advisory role with Bayer, Bristol-Myers Squibb, Eisai, Foundation Medicine, GlaxoSmithKline, Merck, Novartis, Pfizer, Prometheus Laboratories, and Roche/Genentech; and he has received research funding from AstraZeneca (Inst), Bristol-Myers Squibb (Inst), Exelixis (Inst), GlaxoSmithKline (Inst), Merck (Inst), Novartis (Inst), Peloton Therapeutics (Inst), Pfizer (Inst), Roche/Genentech (Inst), and TRACON Pharma (Inst).
Katherine M. Krajewski declares that she has no conflict of interest.
Heather A. Jacene has received honoraria from Bayer Healthcare and Janssen Pharmaceuticals; she has received research Support from Siemens Healthcare (Inst) and GTx, Inc (Inst); she has received consulting fees from Advanced Accelerator Applications, Inc.
SUPPLEMENTARY MATERIAL
[1] The supplementary material is available in the electronic version of this article: https://dx.doi.org/10.3233/KCA-190075
ACKNOWLEDGMENTS
The authors thank Yating Wang, MS, for assistance with statistical analyses.
REFERENCES
[1] | Yoon HJ , Paeng JC , Kwak C , Park YH , Kim TM , Lee SH , et al. Prognostic implication of extrarenal metabolic tumor burden in advanced renal cell carcinoma treated with targeted therapy after nephrectomy. Ann Nucl Med. (2013) ;27: :748–55. doi: 10.1007/s12149-013-0742-4. |
[2] | McKay RR , Kroeger N , Xie W , Lee JL , Knox JJ , Bjarnason GA , et al. Impact of bone and liver metastases on patients with renal cell carcinoma treated with targeted therapy. Eur Urol. (2014) ;65: :577–84. doi: 10.1016/j.eururo.2013.08.012. |
[3] | Casalino DD , Remer EM , Bishoff JT , Coursey CA , Dighe M , Harvin HJ , et al. ACR appropriateness criteria post-treatment follow-up of renal cell carcinoma. J Am Coll Radiol. (2014) ;11: :443–9. doi: 10.1016/j.jacr.2014.01.023. |
[4] | Staudenherz A , Steiner B , Puig S , Kainberger F , Leitha T . Is there a diagnostic role for bone scanning of patients with a high pretest probability for metastatic renal cell carcinoma? Cancer. (1999) ;85: :153–5. |
[5] | Griffin N , Gore ME , Sohaib SA . Imaging in metastatic renal cell carcinoma. AJR Am J Roentgenol. (2007) ;189: :360–70. doi: 10.2214/AJR.07.2077. |
[6] | Seto E , Segall GM , Terris MK . Positron emission tomography detection of osseous metastases of renal cell carcinoma not identified on bone scan. Urology. (2000) ;55: :286. |
[7] | Vikram R , Beland MD , Blaufox MD , Moreno CC , Gore JL , Harvin HJ , et al. ACR Appropriateness Criteria Renal Cell Carcinoma Staging. J Am Coll Radiol. (2016) ;13: :518–25. doi: 10.1016/j.jacr.2016.01.021. |
[8] | Motzer RJ , Jonasch E , Agarwal N , Bhayani S , Bro WP , Chang SS , et al. Kidney Cancer, Version 2.2017, NCCN Clinical Practice Guidelines in Oncology. J Natl Compr Canc Netw. (2017) ;15: :804–34. doi: 10.6004/jnccn.2017.0100. |
[9] | Wu HC , Yen RF , Shen YY , Kao CH , Lin CC , Lee CC . Comparing whole body 18F-2-deoxyglucose positron emission tomography and technetium-99m methylene diphosphate bone scan to detect bone metastases in patients with renal cell carcinomas - a preliminary report. J Cancer Res Clin Oncol. (2002) ;128: :503–6. doi: 10.1007/s00432-002-0370-1. |
[10] | Kang DE , White RL Jr , Zuger JH , Sasser HC , Teigland CM . Clinical use of fluorodeoxyglucose F 18 positron emission tomography for detection of renal cell carcinoma. J Urol. (2004) ;171: :1806–9. doi: 10.1097/01.ju.0000120241.50061.e4. |
[11] | Wang HY , Ding HJ , Chen JH , Chao CH , Lu YY , Lin WY , et al. Meta-analysis of the diagnostic performance of [18F]FDG-PET and PET/CT in renal cell carcinoma. Cancer Imaging. (2012) ;12: :464–74. doi: 10.1102/1470-7330.2012.0042. |
[12] | Vercellino L , Bousquet G , Baillet G , Barre E , Mathieu O , Just PA , et al. 18F-FDG PET/CT imaging for an early assessment of response to sunitinib in metastatic renal carcinoma: preliminary study. Cancer Biother Radiopharm. (2009) ;24: :137–44. doi: 10.1089/cbr.2008.0527. |
[13] | Kayani I , Avril N , Bomanji J , Chowdhury S , Rockall A , Sahdev A , et al. Sequential FDG-PET/CT as a biomarker of response to Sunitinib in metastatic clear cell renal cancer. Clin Cancer Res. (2011) ;17: :6021–8. doi: 10.1158/1078-0432.CCR-10-3309. |
[14] | Ueno D , Yao M , Tateishi U , Minamimoto R , Makiyama K , Hayashi N , et al. Early assessment by FDG-PET/CT of patients with advanced renal cell carcinoma treated with tyrosine kinase inhibitors is predictive of disease course. BMC Cancer. (2012) ;12: :162. doi: 10.1186/1471-2407-12-162. |
[15] | McKay RR , Bosse D , Gray KP , Michaelson MD , Krajewski KM , Jacene HA , et al. Radium-223 dichloride in Combination with Vascular Endothelial Growth Factor-Targeting Therapy in Advanced Renal Cell Carcinoma with Bone Metastases. Clin Cancer Res. (2018) . doi: 10.1158/1078-0432.CCR-17-3577. |
[16] | Nuclear Regulatory Commission Office of Nuclear Materials Safety and Safeguards. Notice 2016-03: Revision to the National Institute of Standards and Technology Standard for Radium-223 Impact on Dose Calibration for the Medial Use of Radium-223 Dichloride. https://www.nrc.gov/docs/ML1526/ML15264B095.pdf. Accessed June 4, 2018. |
[17] | Eisenhauer EA , Therasse P , Bogaerts J , Schwartz LH , Sargent D , Ford R , et al. New response evaluation criteria in solid tumours: revised RECIST guideline (version 1.1). Eur J Cancer. (2009) ;45: :228–47. doi: 10.1016/j.ejca.2008.10.026. |
[18] | Wahl RL , Jacene H , Kasamon Y , Lodge MA . From RECIST to PERCIST: Evolving Considerations for PET response criteria in solid tumors. J Nucl Med. (2009) ;50: Suppl 1:122S–50S. doi: 10.2967/jnumed.108.057307. |
[19] | Hamaoka T , Madewell JE , Podoloff DA , Hortobagyi GN , Ueno NT . Bone imaging in metastatic breast cancer. J Clin Oncol. (2004) ;22: :2942–53. doi: 10.1200/JCO.2004.08.181. |
[20] | Landis JR , Koch GG . The measurement of observer agreement for categorical data. Biometrics. (1977) ;33: :159–74. |
[21] | Atlas I , Kwan D , Stone N . Value of serum alkaline phosphatase and radionuclide bone scans in patients with renal cell carcinoma. Urology. (1991) ;38: :220–2. |
[22] | Bos SD , Piers DA , Mensink HJ . Routine bone scan and serum alkaline phosphatase for staging in patients with renal cell carcinoma is not cost-effective. Eur J Cancer. (1995) ;31A: :2422–3. |
[23] | Namura K , Minamimoto R , Yao M , Makiyama K , Murakami T , Sano F , et al. Impact of maximum standardized uptake value (SUVmax) evaluated by 18-Fluoro-2-deoxy-D-glucose positron emission tomography/computed tomography (18F-FDG-PET/CT) on survival for patients with advanced renal cell carcinoma: a preliminary report. BMC Cancer. (2010) ;10: :667. doi: 10.1186/1471-2407-10-667. |
[24] | Revheim ME , Winge-Main AK , Hagen G , Fjeld JG , Fossa SD , Lilleby W . Combined positron emission tomography/computed tomography in sunitinib therapy assessment of patients with metastatic renal cell carcinoma. Clin Oncol (R Coll Radiol). (2011) ;23: :339–43. doi: 10.1016/j.clon.2010.11.006. |
[25] | Farnebo J , Gryback P , Harmenberg U , Laurell A , Wersall P , Blomqvist LK , et al. Volumetric FDG-PET predicts overall and progression- free survival after 14 days of targeted therapy in metastatic renal cell carcinoma. BMC Cancer. (2014) ;14: :408. doi: 10.1186/1471-2407-14-408. |
[26] | Horn KP , Yap JT , Agarwal N , Morton KA , Kadrmas DJ , Beardmore B , et al. FDG and FLT-PET for Early measurement of response to 37. 5 mg daily sunitinib therapy in metastatic renal cell carcinoma. Cancer Imaging. (2015) ;15: :15. doi: 10.1186/s40644-015-0049-x. |
[27] | Minamimoto R , Barkhodari A , Harshman L , Srinivas S , Quon A . Prognostic Value of Quantitative Metabolic Metrics on Baseline Pre-Sunitinib FDG PET/CT in Advanced Renal Cell Carcinoma. PLoS One. (2016) ;11: :e0153321. doi: 10.1371/journal.pone.0153321. |
[28] | Nakaigawa N , Kondo K , Tateishi U , Minamimoto R , Kaneta T , Namura K , et al. FDG PET/CT as a prognostic biomarker in the era of molecular-targeting therapies: max SUVmax predicts survival of patients with advanced renal cell carcinoma. BMC Cancer. (2016) ;16: :67. doi: 10.1186/s12885-016-2097-4. |
[29] | Ito H , Kondo K , Kawahara T , Kaneta T , Tateishi U , Ueno D , et al. One-month assessment of renal cell carcinoma treated by everolimus using FDG PET/CT predicts progression-free and overall survival. Cancer Chemother Pharmacol. (2017) ;79: :855–61. doi: 10.1007/s00280-017-3275-z. |
[30] | Skougaard K , Johannesen HH , Nielsen D , Schou JV , Jensen BV , Hogdall EV , et al. CT versus FDG-PET/CT response evaluation in patients with metastatic colorectal cancer treated with irinotecan and cetuximab. Cancer Med. (2014) ;3: :1294–301. doi: 10.1002/cam4.271. |
[31] | Lasnon C , Quak E , Le Roux PY , Robin P , Hofman MS , Bourhis D , et al. EORTC PET response criteria are more influenced by reconstruction inconsistencies than PERCIST but both benefit from the EARL harmonization program. EJNMMI Phys. (2017) ;4: :17. doi: 10.1186/s40658-017-0185-4. |
[32] | Lyrdal D , Boijsen M , Suurkula M , Lundstam S , Stierner U . Evaluation of sorafenib treatment in metastatic renal cell carcinoma with 2-fluoro-2-deoxyglucose positron emission tomography and computed tomography. Nucl Med Commun. (2009) ;30: :519–24. |
[33] | Fujimoto R , Higashi T , Nakamoto Y , Hara T , Lyshchik A , Ishizu K , et al. Diagnostic accuracy of bone metastases detection in cancer patients: comparison between bone scintigraphy and whole-body FDG-PET. Ann Nucl Med. (2006) ;20: :399–408. |
[34] | Santoni M , Conti A , Procopio G , Porta C , Ibrahim T , Barni S , et al. Bone metastases in patients with metastatic renal cell carcinoma: are they always associated with poor prognosis? J Exp Clin Cancer Res. (2015) ;34: :10. doi: 10.1186/s13046-015-0122-0. |
[35] | Nakamoto Y , Cohade C , Tatsumi M , Hammoud D , Wahl RL . CT appearance of bone metastases detected with FDG PET as part of the same PET/CT examination. Radiology. (2005) ;237: :627–34. doi: 10.1148/radiol.2372031994. |
[36] | Grunwald V , Eberhardt B , Bex A , Florcken A , Gauler T , Derlin T , et al. An interdisciplinary consensus on the management of bone metastases from renal cell carcinoma. Nat Rev Urol. (2018) . doi: 10.1038/s41585-018-0034-9. |


