
miR-22 Regulates Invasion, Gene Expression and Predicts Overall Survival in Patients with Clear Cell Renal Cell Carcinoma
Abstract
Background:
Clear cell renal cell carcinoma (ccRCC) is molecularly diverse and distinct molecular subtypes show different clinical outcomes. MicroRNAs (miRNAs) are essential components of gene regulatory networks and play a crucial role in progression of many cancer types including ccRCC.
Objective:
Identify prognostic miRNAs and determine the role of miR-22 in ccRCC.
Methods:
Hierarchical clustering was done in R using gene expression profiles of over 450 ccRCC cases in The Cancer Genome Atlas (TCGA). Kaplan-Meier analysis was performed to identify prognostic miRNAs in the TCGA dataset. RNA-Seq was performed to identify miR-22 target genes in primary ccRCC cells and Matrigel invasion assay was performed to assess the effects of miR-22 overexpression on cell invasion.
Results:
Hierarchical clustering analysis using 2,621 prognostic genes previously identified by our group demonstrated that ccRCC patients with longer overall survival expressed lower levels of genes promoting proliferation or immune responses, while better maintaining gene expression associated with cortical differentiation and cell adhesion. Targets of 26 miRNAs were significantly enriched in the 2,621 prognostic genes and these miRNAs were prognostic by themselves. MiR-22 was associated with poor overall survival in the TCGA dataset. Overexpression of miR-22 promoted invasion of primary ccRCC cells in vitro and modulated transcriptional programs implicated in cancer progression including DNA repair, cell proliferation and invasion.
Conclusions:
Our results suggest that ccRCCs with differential clinical outcomes have distinct transcriptomes for which miRNAs could serve as master regulators. MiR-22, as a master regulator, promotes ccRCC progression at least in part by enhancing cell invasion.
INTRODUCTION
The global incidence of renal cell carcinoma (RCC) is rising, with a predicted increase of 20% or more by 2030 compared to 2007 [1]. In 2018, it is estimated that 65,340 people will be diagnosed with RCC and 14,970 people will die of this disease in the U.S. [2]. Clear cell renal cell carcinoma (ccRCC) accounts for approximately 75% of all RCC and is responsible for the majority of RCC mortality [3]. Accurate prediction of disease progression will help guide the intensity of postoperative surveillance and administration of adjuvant therapy to high-risk patients, thereby improving clinical outcome of RCC patients [4]. However, the prognostic algorithms currently in use that incorporate tumor stage, grade, and patient performance status to predict disease recurrence were developed more than a decade ago and do not take into account the molecular diversity of RCC [5–7]. To better stratify RCC patients into different risk groups, molecular biomarkers should be incorporated into the prognostic algorithms since they capture the molecular diversity of the disease.
ccRCCs are molecularly diverse and distinct molecular subtypes show different clinical outcomes [8]. We previously identified five molecular subtypes of ccRCC with different outcomes in a cohort of 177 patients [9]. In addition, we discovered 3,674 unique prognostic genes differentially expressed in the 177 patients that predicts overall survival independent of tumor stage, grade, and performance status [9]. Recently, Verbiest et al. described four molecular subtypes that have prognostic value upon first-line sunitinib or pazopanib therapy in a cohort of 43 patients with metastatic ccRCC after complete metastasectomy [10]. Moreover, Chen et al. classified 894 RCCs of various histologic types available from The Cancer Genome Atlas (TCGA) into nine major genomic subtypes including three prognostic subtypes of predominantly ccRCC cases by systematic analysis of five genomic data platforms [11]. These subtypes showed high concordance with the subtype designation previously called for the same samples on the basis of gene expression profiles [12].
MicroRNAs (miRNAs) are essential components of gene regulatory networks and play a crucial role in a wide range of diseases, including cancer [13]. Although upregulated and downregulated miRNAs have been frequently identified in RCC [14], to date only a few studies focused on identification of prognostic miRNAs in primary tumors of RCC [15]. Of the 3,674 unique prognostic genes identified previously [9], 2,621 were found in the gene expression profiles of 480 ccRCC cases available in TCGA. Here, we clustered these 480 ccRCC cases using the 2,621 prognostic genes and stratified patients into subtypes associated with differential overall survival. We then identified prognostic miRNAs in these patients by Kaplan-Meier analysis. A hypergeometric test was performed to identify master regulator miRNAs whose target genes were enriched in the set of prognostic genes differentially expressed in ccRCC subtypes. Finally, we determined the role of miR-22, one of the master regulators, in the invasion of primary ccRCC cells in vitro and delineated the mechanisms of its action in primary ccRCC cells by RNA-Seq.
MATERIALS AND METHODS
Patient cohort, microarray and RNA-Seq datasets
The TCGA cohort of RCC includes 480 cases of ccRCC. RNA-Seq data of mRNA and miRNA expression and associated de-identified clinical data from TCGA were obtained from the Cancer Genomics Hub (CGHub, https://cghub.ucsc.edu/) and TCGA Data Portal (https://gdc.cancer.gov/) with approved authorization from TCGA.
Clustering and survival analysis
The prognostic genes were defined as the overlapping genes between the prognostic gene set previously published [9] and the genes in the TCGA dataset. The expression sub-matrix was retrieved from the entire TCGA dataset for these genes. Hierarchical clustering was done in R, using average linkage clustering with Pearson correlation on mean-centered log2 RPKMs (Reads Per Kilobase of transcript, per Million mapped reads) of the TCGA gene expression data after normalization. Kaplan-Meier analysis was performed for each miRNA in the TCGA dataset. All statistical analyses (Kaplan-Meier, log-rank test, multivariable Cox Proportional Hazards analysis) were performed using R.
Identification of prognostic master miRNAs and construction of the network
A miRNA was defined as a prognostic master regulator if: (1) its expression predicted overall survival in the TCGA cohort by Kaplan-Meier analysis with a P value cutoff of 0.01; (2) it regulated significantly more targets than by random chance. The predicted miRNA target genes were downloaded from TargetScan (version 6.2). For each miRNA, a hypergeometric test was carried out to determine whether it regulated significantly more gene targets than random. The significance of the number of targets regulated by a miRNA was calculated according to the cumulative hypergeometric distribution model:
Culture of primary RCC cells
Primary ccRCC cells were established from a tumor obtained from a 75-year old male with Furhman grade III-IV ccRCC using methodology described by Valente et al. [16]. Briefly, tissues were digested in collagenase, incubated with red cell lysis buffer and passaged through 70-μm and 40-μm cell strainers. The single cells were centrifuged, resuspended in DMEM/F12 + GlutaMAX-Itrademark supplemented with 10% fetal bovine serum, human transferrin (5μg/ml) and gentamycin (100μg/ml) and placed in collagen-coated dishes. Medium was replaced every 3 days. TrypLE Express was used to passage the cells 1:2 or 1:3. Cells were cryopreserved in culture medium with 10% DMSO and stored in liquid nitrogen.
MiR-22 mimic transfection, quantification and invasion assay
Cells at passage 10 were seeded in 6-well plates at a density of 40,000 cells/well and transfected with 0.2 nM miR-22 mimics (5′-AAGCUGCCAGUUGAAGAACUGU-3′) or negative control miRNA (5′-UUGUACUACACAAAAGUACUG-3′) using DharmaFECT Duo reagent. Total RNA and miRNA were purified from transfected cells after 24 and 48 hours using the miRNeasy mini kit (Qiagen). cDNAs were reverse transcribed by miScript Reverse Transcriptase and miR-22 level was quantified using miScript Primer assays using Hs_miR-22_1 miScript Primer Assay kit (Qiagen) according to manufacturer’s instructions.
For invasion assay, cells were detached 48 hours after transfection and seeded at a density of 50,000 cells/ml onto BD BioCoattrademark Matrigeltrademark inserts (0.5 ml/insert) provided in the BioCoattrademark Matrigel Invasion Assay Kit. Cells that invaded through the inserts were quantified after 24 hours using Calcein staining at a concentration of 0.5μg/ml. All assays were done in triplicate and significant differences assessed by ANOVA.
RNA-Seq library preparation, sequencing and data analysis
ccRCC cells were transfected with mimic of miR-22 or non-targeting control, and total RNA was isolated 24 and 48 hrs post-transfection. Barcoded RNA-Seq libraries were then prepared from total RNA using the Illumina TruSeq RNA Sample Prep Kit (v2), and sequenced (single-end, 101-bp reads) on an Illumina HiSeq 2000 instrument to a depth of approximately 50 million reads per sample. Sequence reads were mapped to the human genome (hg19) and transcripts quantified as RPKM using Cufflinks according to RefSeq annotation. Biological pathways implicated by gene expression changes were identified using Ingenuity Pathway Analysis (IPA) (Qiagen). The complete dataset of raw RNA-Seq reads is available at GEO (Accession GSE115552). Hierarchical clustering was done in R, using average linkage clustering with Pearson correlation on mean-centered log2 RPKMs.
RESULTS
Prognostic genes differentially expressed in previous patient cohort predict overall survival in TCGA patients
We identified 2,621 genes that overlapped between 3,674 unique prognostic genes differentially expressed in a previous cohort of 177 ccRCC patients and those represented in expression profiles of 480 ccRCC patients from TCGA (Supplemental Table 1). When an unsupervised average linkage cluster was performed based on the expression levels of these genes, the 480 ccRCC patients were separated into two main groups, group 1 and 2 with 220 and 260 patients, respectively (Fig. 1A). These patients showed distinct gene expression profiles with clusters of genes up- or down-regulated in each group (Fig. 1B). Clinical follow-up information was available for 453 of the 480 patients (Supplemental Table 2) and patients in group 1 had significantly worse survival compared to patients in group 2 as determined by Kaplan-Meier analysis (Fig. 1C), demonstrating the prognostic value of the 2,621 genes in a totally independent cohort.
Fig.1
Differential expression of 2,621 genes in ccRCC patients from TCGA predicts survival. Unsupervised average linkage cluster based on the expression levels of 2,621 genes separated the 480 ccRCC patients into 2 main groups (A). Heatmap of this classification showed distinct gene expression patterns in these patients (B). Gene cluster 1 (yellow bar) was enriched with metabolism genes. Gene cluster 2 (blue bar) was enriched with genes promoting virus defense response and B and T cell activation. Genes involved in B, T and NK cell functions as well as antigen processing and presentation were enriched in gene cluster 4 (red bar). Gene cluster 3 (orange bar) was enriched with genes involved in cell cycle. Gene cluster 5 (green bar) was enriched with extracellular matrix (ECM) proteins. Gene cluster 6 (purple bar) was enriched with genes that are highly expressed in the normal kidney cortex. Patients in the 2 main groups had different outcomes determined by Kaplan-Meier analysis (C).
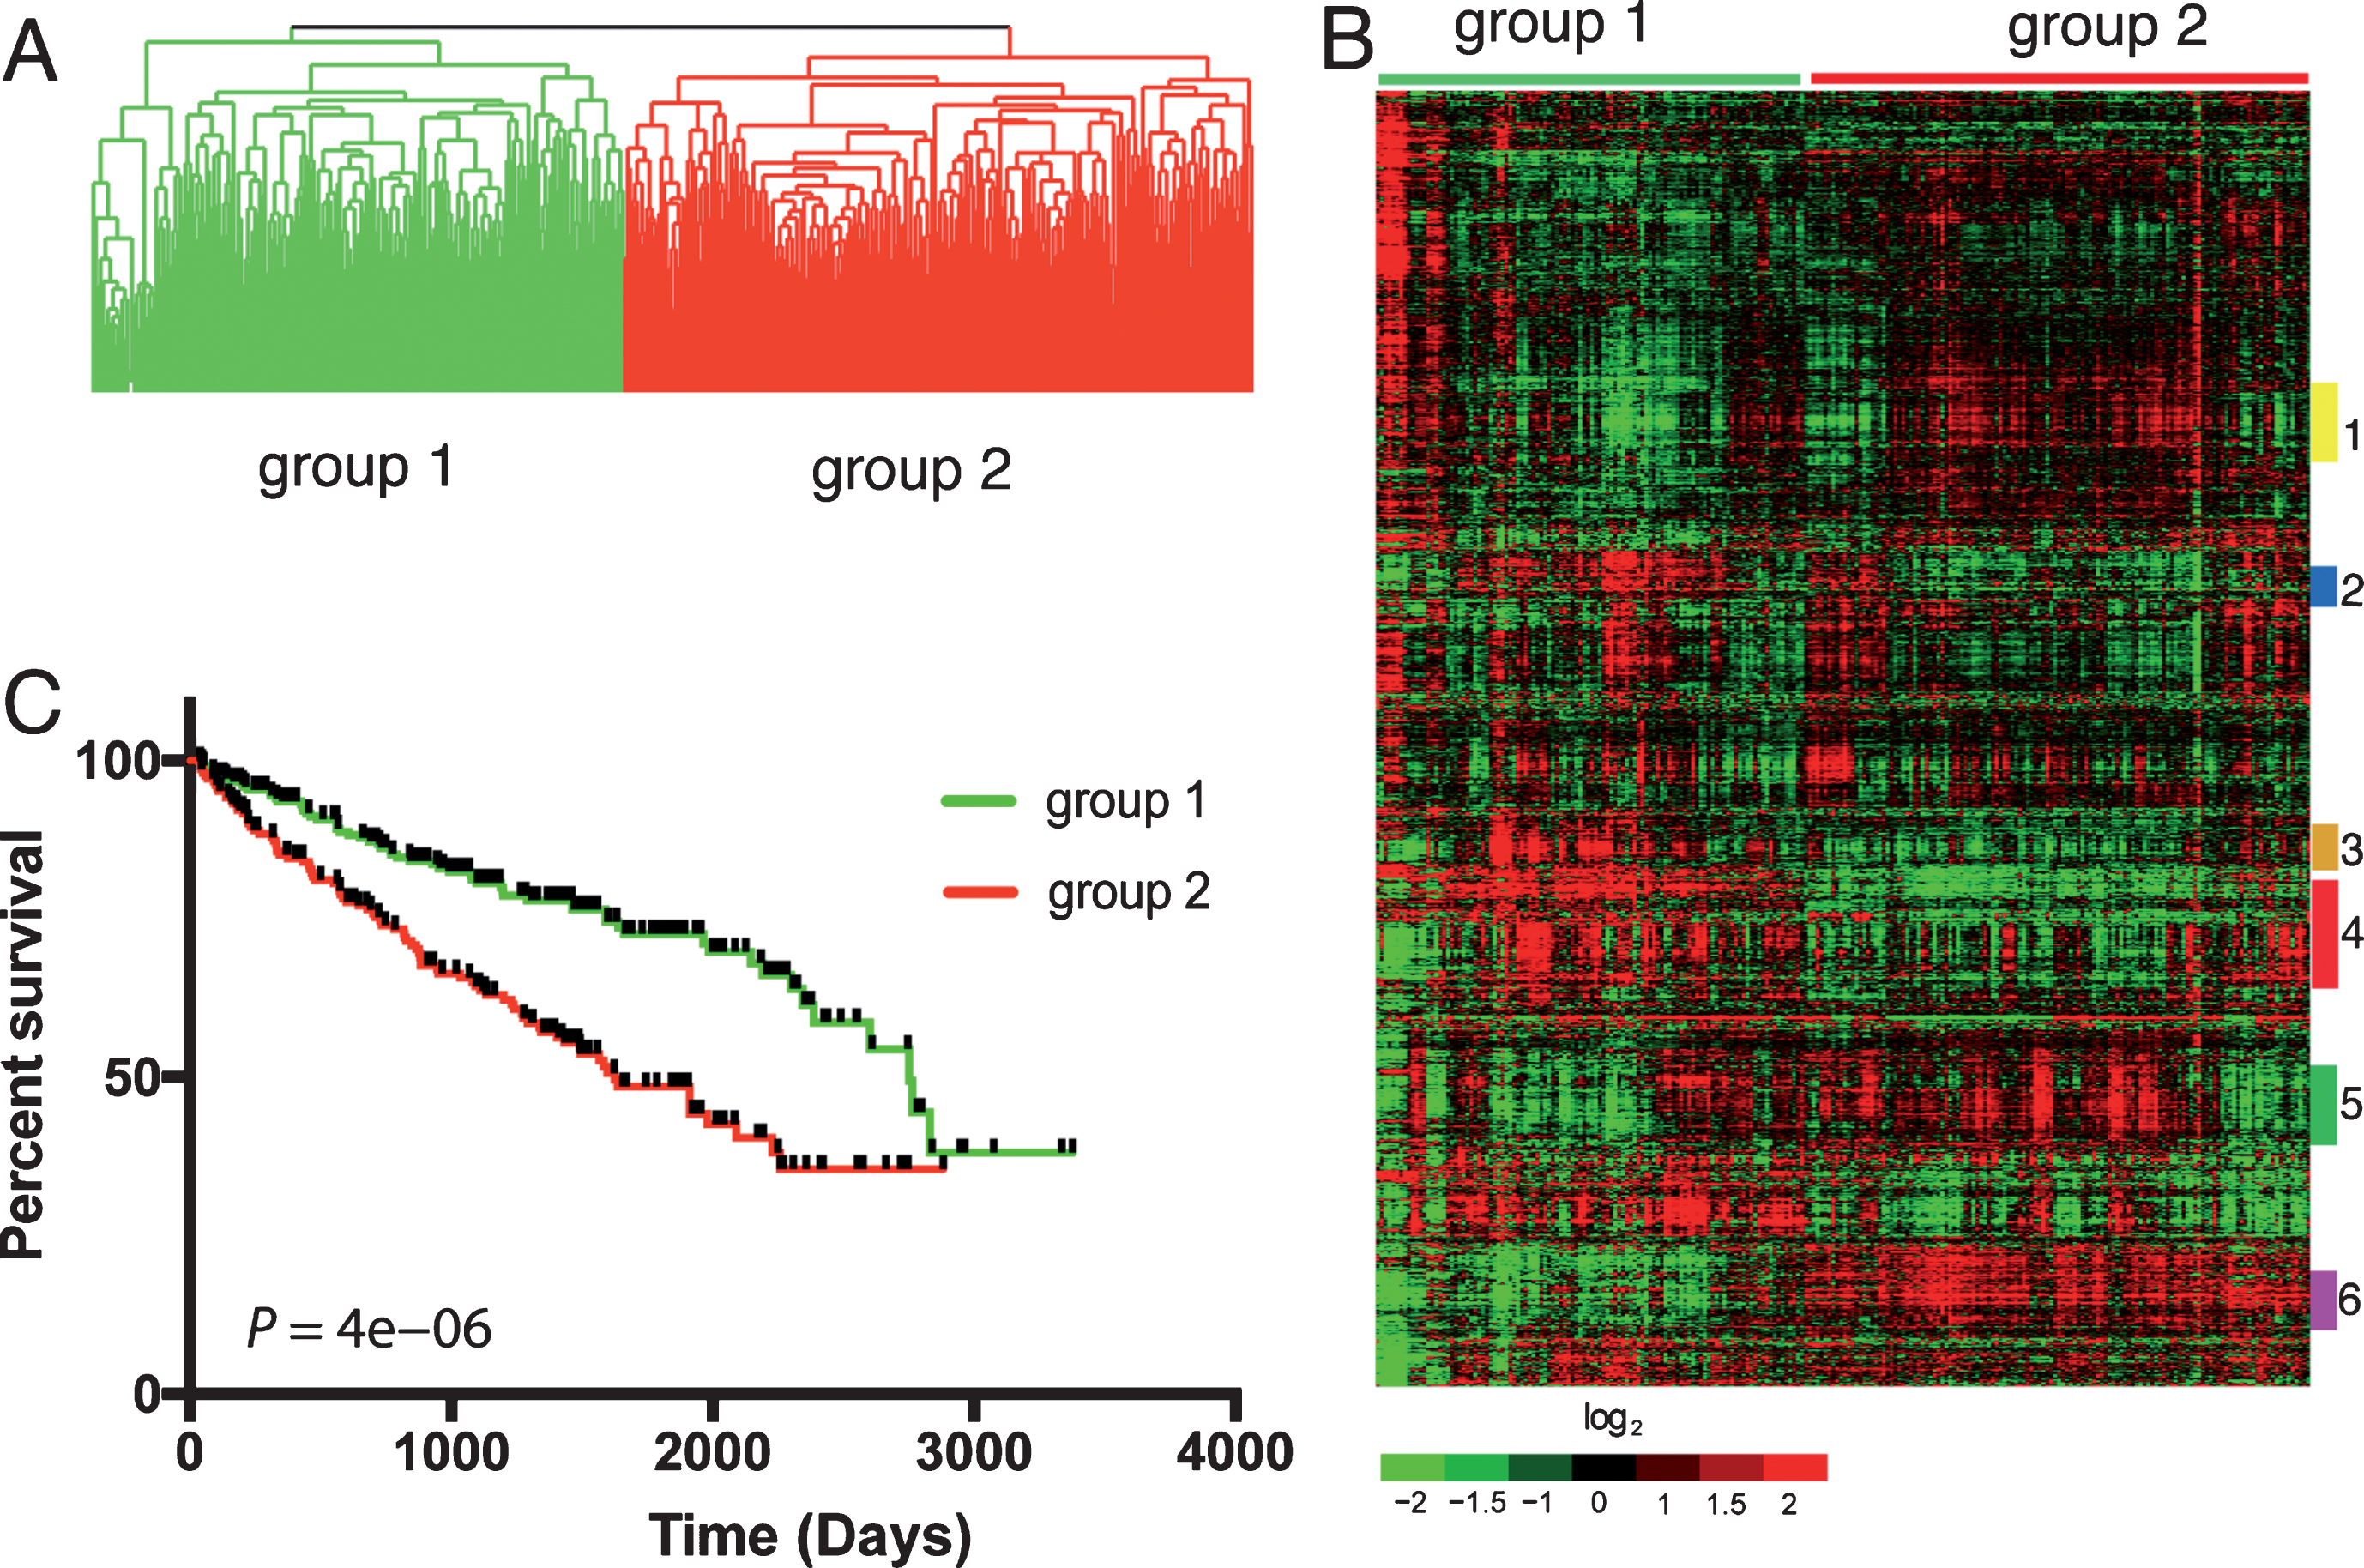
Table 1
KEGG pathways enriched in the 2,621 gene list ranked by P value
| Pathway name | P value (<0.01) | Fold Enrichment (>1.5) | FDR (<10%) |
| Pathways in cancer | 2.43E-11 | 1.75 | 0.00 |
| Proteoglycans in cancer | 1.01E-08 | 1.93 | 0.00 |
| Focal adhesion | 4.00E-08 | 1.88 | 0.00 |
| Adherens junction | 1.82E-07 | 2.53 | 0.00 |
| PI3K-Akt signaling pathway | 6.10E-06 | 1.53 | 0.01 |
| Cell cycle | 9.48E-06 | 1.93 | 0.01 |
| ECM-receptor interaction | 1.24E-05 | 2.13 | 0.02 |
| FoxO signaling pathway | 1.53E-05 | 1.87 | 0.02 |
| HTLV-I infection | 1.77E-05 | 1.60 | 0.02 |
| Biosynthesis of antibiotics | 2.97E-05 | 1.64 | 0.04 |
| Complement and coagulation cascades | 3.97E-05 | 2.21 | 0.05 |
| Hippo signaling pathway | 4.10E-05 | 1.77 | 0.05 |
| Platelet activation | 8.08E-05 | 1.80 | 0.11 |
| Amoebiasis | 8.17E-05 | 1.90 | 0.11 |
| Transcriptional misregulation in cancer | 9.22E-05 | 1.69 | 0.12 |
| Colorectal cancer | 1.29E-04 | 2.20 | 0.17 |
| Small cell lung cancer | 1.44E-04 | 1.99 | 0.19 |
| HIF-1 signaling pathway | 1.92E-04 | 1.89 | 0.26 |
| ErbB signaling pathway | 2.31E-04 | 1.94 | 0.31 |
| Dopaminergic synapse | 2.63E-04 | 1.74 | 0.35 |
| Carbon metabolism | 7.48E-04 | 1.73 | 0.99 |
| Renal cell carcinoma | 8.02E-04 | 2.01 | 1.06 |
| Leukocyte transendothelial migration | 8.63E-04 | 1.71 | 1.14 |
| Valine, leucine and isoleucine degradation | 1.02E-03 | 2.20 | 1.35 |
| p53 signaling pathway | 1.29E-03 | 1.95 | 1.70 |
| Citrate cycle (TCA cycle) | 1.35E-03 | 2.54 | 1.78 |
| Fc gamma R-mediated phagocytosis | 1.58E-03 | 1.82 | 2.08 |
| Chronic myeloid leukemia | 1.62E-03 | 1.89 | 2.14 |
| Osteoclast differentiation | 1.78E-03 | 1.62 | 2.34 |
| Malaria | 1.78E-03 | 2.11 | 2.34 |
| TNF signaling pathway | 1.98E-03 | 1.70 | 2.60 |
| Insulin signaling pathway | 2.63E-03 | 1.58 | 3.43 |
| Insulin resistance | 5.36E-03 | 1.61 | 6.90 |
| Glyoxylate and dicarboxylate metabolism | 5.56E-03 | 2.42 | 7.15 |
| Chagas disease (American trypanosomiasis) | 5.64E-03 | 1.62 | 7.25 |
| AMPK signaling pathway | 6.05E-03 | 1.56 | 7.75 |
| Alanine, aspartate and glutamate metabolism | 6.74E-03 | 2.18 | 8.60 |
| TGF-beta signaling pathway | 7.16E-03 | 1.69 | 9.11 |
Table 2
KEGG pathways involved in immune response enriched in gene cluster 4
| Pathway name | P value (<0.01) | Fold Enrichment (>1.5) | FDR (<10%) |
| Staphylococcus aureus infection | 6.22E-08 | 10.43 | 0.0001 |
| Complement and coagulation cascades | 6.76E-08 | 8.9 | 0.0001 |
| Measles | 1.51E-06 | 5.39 | 0.0019 |
| Primary immunodeficiency | 3.06E-06 | 12.04 | 0.0038 |
| Natural killer cell mediated cytotoxicity | 2.17E-05 | 5.03 | 0.03 |
| Fc gamma R-mediated phagocytosis | 3.19E-05 | 6.09 | 0.04 |
| Fc epsilon RI signaling pathway | 4.51E-05 | 6.77 | 0.06 |
| Hematopoietic cell lineage | 2.23E-04 | 5.42 | 0.28 |
| B cell receptor signaling pathway | 3.50E-04 | 5.93 | 0.44 |
| Antigen processing and presentation | 6.33E-04 | 5.39 | 0.79 |
| Chemokine signaling pathway | 9.22E-04 | 3.3 | 1.14 |
| NF-kappa B signaling pathway | 1.42E-03 | 4.71 | 1.76 |
| Pertussis | 3.20E-03 | 4.78 | 3.92 |
| T cell receptor signaling pathway | 3.72E-03 | 3.98 | 4.55 |
| Cytokine-cytokine receptor interaction | 4.91E-03 | 2.67 | 5.96 |
| Jak-STAT signaling pathway | 6.99E-03 | 3.18 | 8.38 |
Enrichment analysis using online tools available from The Database for Annotation, Visualization and Integrated Discovery (DAVID) [17] identified 38 KEGG pathways that are significantly enriched (P < 0.01) at least 1.5-fold in the 2,621 genes with a false discovery rate (FDR)<0.1 (Table 1). These include PI3K-Akt, FoxO, Hippo, HIF-1, ErbB, p53, TNF, insulin, AMPK and TGF-β signaling pathways previously implicated in RCC progression [18–23]. In addition, proteoglycans in cancer, focal adhesion and cell cycle are among the top most significantly enriched KEGG pathway terms (Table 1). Genes functioning in the same cellular processes tend to cluster together as shown in the heatmap (Fig. 1B). For example, gene cluster 1 (yellow bar in Fig. 1B) was enriched with metabolism regulating genes such as valine/leucine/isoleucine degradation (ACADM, ACADSB, DBT, MDT and BCKDHB). These genes were expressed at higher levels in patients with longer overall survival (group 2 in Fig. 1C), suggesting a tumor suppressor role of their activities in promoting patient survival. Similarly, gene cluster 6 (purple bar in Fig. 1B), expressed at higher levels in patients with favorable outcome (group 2), was enriched with genes that are highly expressed in the normal kidney cortex, including many members of soluble carrier families (SLC28A1, SLC17A1, SLC16A9, SLC1A1, SLC5A12, SLC4A4, SLC23A3). These genes represent the transcriptional programs intrinsic to the cortex in its normal, fully differentiated state [24], suggesting that a critical feature of lethal ccRCC is loss of normal cortical differentiation which is consistent with previous findings from our group and others [25, 26]. In addition, extracellular matrix (ECM) proteins involved in ECM-receptor interactions as well focal adhesion including COL44A1, COL44A2, COL15A1, CDH8, CDH13, LAMA4, LAMB2, LAMC1 and ITGB1 were enriched in gene cluster 5 (green bar in Fig. 1B). They were upregulated in the majority of group 2 patients and downregulated in the majority of group 1 patients, indicating they are mostly associated with better survival.
In contrast, gene cluster 3 (orange bar in Fig. 1B) was upregulated in patients with shorter survival (group 1 in Fig. 1A) compared to patients with better outcome (group 2). This cluster was enriched with genes involved in cell cycle such as PCNA, CDC25B, CENPE, CENPF, CCNE2, CDCA3, CDCA7, BUB1 and TOP2A, consistent with the notion that tumors with poor prognosis were more proliferative [27]. Moreover, gene clusters 2 and 4 whose expression levels were also higher in patients with poor survival were enriched with immune response genes, a phenomenon not detected by KEGG enrichment analysis. Specifically, gene cluster 2 was enriched with genes promoting virus defense response (IFITM1, IFITM2, ISG20, IL15RA and CXCR4) and B and T cell activation (ADA, VAV3, MAPK13 and TGFB1). Moreover, genes involved in B, T and NK cell functions as well as antigen processing and presentation were enriched in gene cluster 4. Sixteen KEGG pathways regulating immune response that were significantly enriched in gene cluster 4 with a FDR of < 10% are listed in Table 2. These immunity-enhancing pathways were highly active in patients with poor survival, suggesting that aggressive ccRCC tumors are highly immunogenic.
Identification of prognostic master regulator miRNAs associated with ccRCC survival
We defined a miRNA as a prognostic master regulator if its expression was prognostic in the TCGA patients and it regulated significantly more of the 2,621 genes than expected by chance. Of 344 miRNAs analyzed using the TCGA dataset, expression levels of 127 miRNAs were associated with ccRCC patient survival by Kaplan-Meier analysis (P < 0.01) (Supplemental Table 3). When a hypergeometric test was performed using the predicted miRNA target genes downloaded from TargetScan (version 6.2), 66 miRNAs regulated significantly more gene targets than random in the list of 2,621 genes (Supplemental Table 4). Of these 66 miRNAs, 26 were prognostic (Fig. 2A). The significance of each miRNA in predicting survival and regulating prognostic gene expression as well as average expression levels of each in the TCGA dataset are listed in Table 3. We focused on miR-22 for further study because it is highly expressed in the TCGA dataset and its role in cancer is highly controversial. To determine the prognostic value of miR-22, Kaplan-Meier analysis was performed using the TCGA dataset. As shown in Fig. 2B, patients with high expression of miR-22 (equal or greater than the mean) experienced poor overall survival compared to those with low expression with a P value of 0.004. The 96 target genes regulated by miR-22 in the list of 2,621 genes are shown in Fig. 2C. Twenty biological processes annotated in Gene Ontology were significantly enriched in the miR-22 target genes (Table 4). Notably, gene transcription is enriched with the highest number of miR-22 target genes, suggesting that miR-22 contributes to survival of patients with ccRCC through directly regulating genes that are involved in gene transcription. When a supervised hierarchical clustering of the 480 ccRCC patients in TCGA dataset was performed using these 96 genes, the patients were separated into two groups with significantly different overall survival determined by Kaplan-Meier analysis (Fig. 2D). This classification largely overlapped with stratification using the 2,621 genes, e.g. 187 cases were classified as group 1 tumors and 167 as group 2 tumors by both classifications (Fig. 2D), demonstrating the prognostic value of the miR-22 target genes in ccRCC.
Fig.2
Identification of master regulator miRNAs associated with ccRCC survival. (A) Venn diagram of the prognostic miRNAs identified by Kaplan-Meier analysis based on miRNA expression in the TCGA dataset and the master regulator of the prognostic genes in the Stanford dataset. The overlapping miRNAs are listed under the plot. (B) Kaplan-Meier plots of overall survival for miR-22, P-value (log-rank test) indicated. High expression is defined as equal or greater than the mean and low expression smaller than the mean. (C) Of the 2,621 genes separating the 480 ccRCC patients into 2 main groups, 96 were identified as miR-22 target genes by TargetScan. (D) Supervised average linkage cluster based on the expression levels of the 96 miR-22 target genes separated the 480 ccRCC patients into 2 main groups, largely overlapping with stratification using the 2,621 genes.
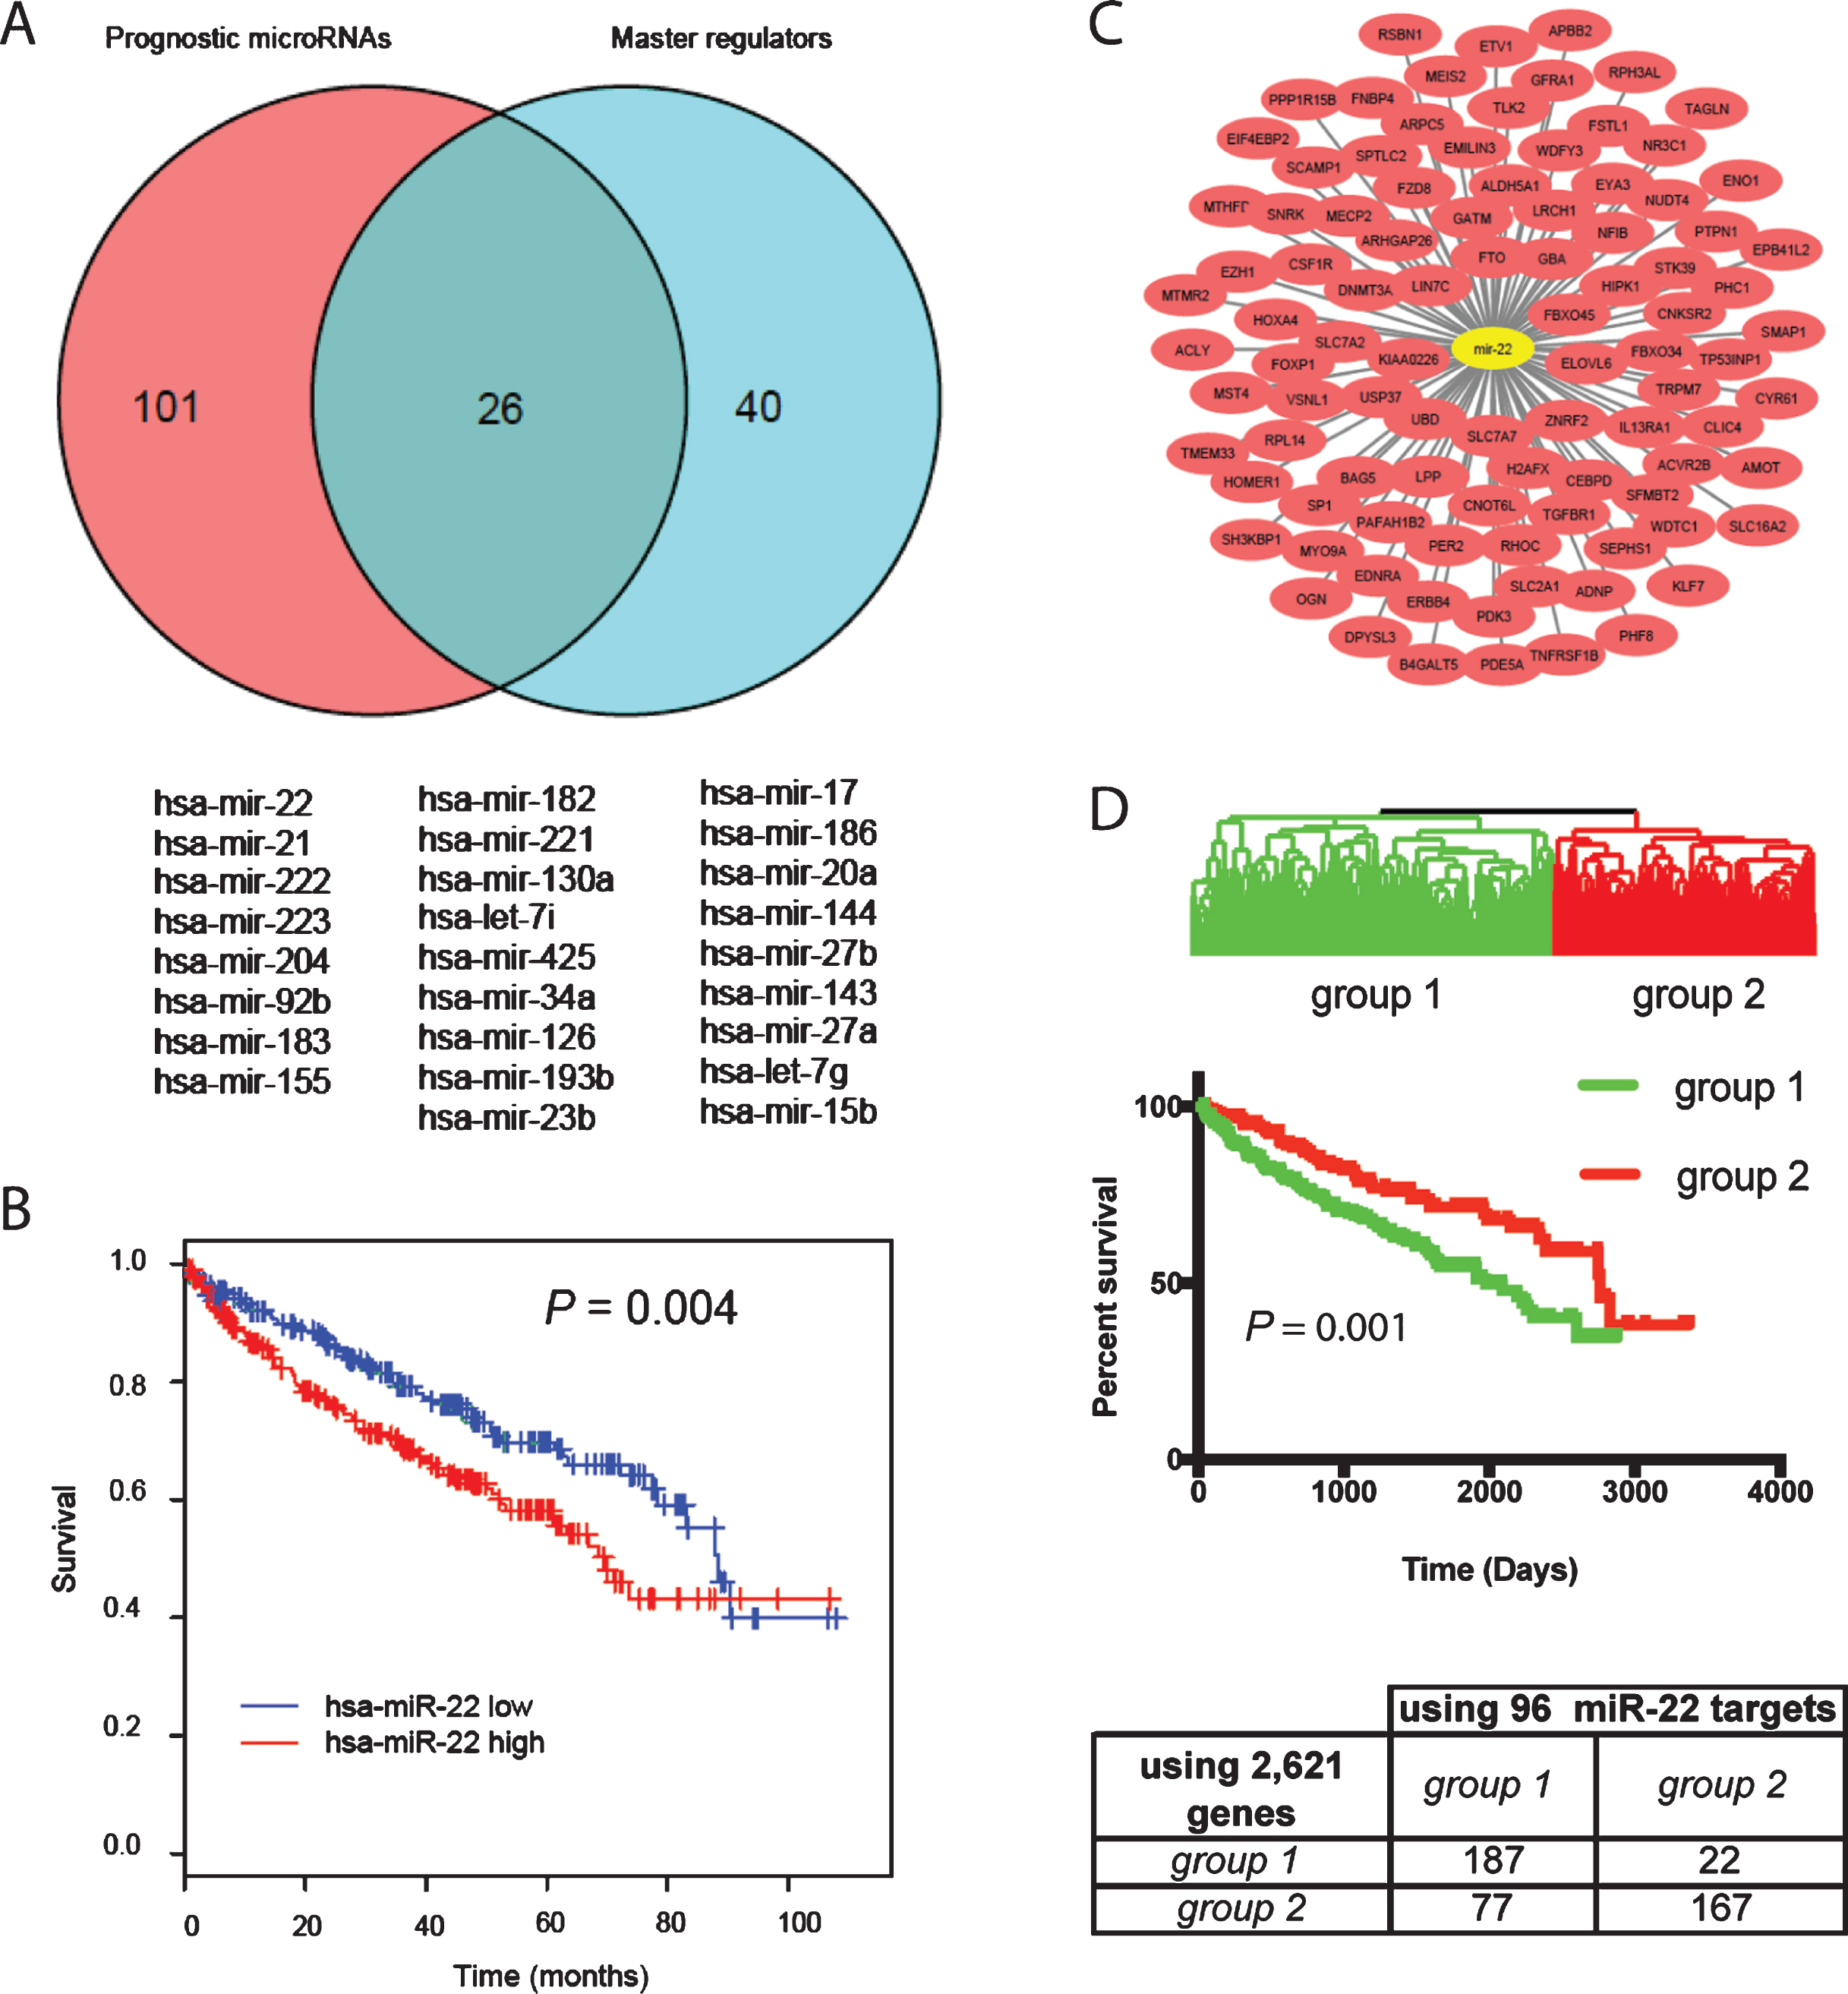
Table 3
Prognostic master regulator microRNAs
| Name | # of genes regulated in the 2,612 gene list | P value in target enrichment analysis | P value in survival analysis | Z score | Expression level |
| miR-21 | 91 | 3.79E-07 | 2.49E-08 | 5.57 | 195030.16 |
| miR-143 | 108 | 3.03E-06 | 1.96E-02 | – 2.33 | 73060.48 |
| miR-22 | 96 | 5.65E-03 | 3.97E-03 | 2.88 | 68515.71 |
| miR-126 | 10 | 2.03E-02 | 1.56E-03 | – 3.16 | 13012.51 |
| miR-182 | 281 | 2.77E-11 | 2.37E-04 | 3.68 | 5574.91 |
| miR-183 | 109 | 2.44E-07 | 3.02E-06 | 4.67 | 1400.98 |
| miR-23b | 272 | 1.29E-09 | 2.52E-03 | – 3.02 | 1395.20 |
| miR-27b | 300 | 2.07E-11 | 1.87E-02 | – 2.35 | 895.05 |
| miR-27a | 300 | 2.07E-11 | 2.09E– 02 | 2.31 | 804.57 |
| miR-155 | 124 | 3.23E– 08 | 5.82E– 05 | 4.02 | 745.25 |
| let-7g | 219 | 4.00E-04 | 2.29E-02 | 2.27 | 596.74 |
| let-7i | 219 | 4.00E-04 | 3.24E-04 | 3.60 | 535.02 |
| miR-144 | 257 | 2.22E-16 | 8.68E-03 | – 2.62 | 454.08 |
| miR-17 | 309 | 1.34E-12 | 3.13E-03 | 2.95 | 399.00 |
| miR-204 | 170 | 7.70E-08 | 1.53E-06 | – 4.81 | 341.99 |
| miR-186 | 204 | 3.04E-07 | 3.38E-03 | 2.93 | 310.85 |
| miR-34a | 125 | 3.64E-02 | 1.34E-03 | 3.21 | 244.35 |
| miR-20a | 309 | 1.34E-12 | 4.61E-03 | 2.83 | 175.98 |
| miR-15b | 288 | 7.41E-08 | 2.52E-02 | 2.24 | 150.87 |
| miR-223 | 96 | 4.20E-08 | 6.20E-07 | 4.98 | 141.27 |
| miR-221 | 108 | 6.69E-05 | 2.90E-04 | 3.62 | 123.93 |
| miR-425 | 58 | 2.90E-04 | 3.77E-04 | 3.56 | 110.84 |
| miR-130a | 234 | 6.57E-11 | 2.98E-04 | 3.62 | 93.76 |
| miR-222 | 108 | 6.69E-05 | 2.23E-07 | 5.18 | 65.90 |
| miR-92b | 210 | 3.04E-07 | 2.17E-06 | 4.74 | 52.00 |
| miR-193b | 57 | 1.03E-03 | 2.16E-03 | 3.07 | 51.20 |
Table 4
Biological processes enriched in miR-22 target genes found in the 2,621 genes
| GO term | Gene symbol |
| transcription, DNA-templated | KLF7, ERBB4, CEBPD, EZH1, ADNP, MECP2, NR3C1, FOXP1, EYA3, HIPK1, HOXA4, CNOT6L, PER2, PHF8, ENO1, NFIB, TP53INP1 |
| negative regulation of transcription from RNA polymerase II promoter | DNMT3A, FZD8, ACVR2B, WDTC1, MEIS2, PER2, MECP2, FOXP1, NFIB |
| intracellular signal transduction | SNRK, NUDT4, TGFBR1, STK39, TLK2, APBB2, MYO9A |
| in utero embryonic development | EDNRA, WDTC1, TGFBR1, AMOT, FOXP1 |
| post-embryonic development | ACVR2B, ALDH5A1, TGFBR1, MECP2 |
| anatomical structure morphogenesis | EYA3, HOXA4, EZH1, CYR61 |
| peptidyl-serine phosphorylation | TGFBR1, PDK3, STK39, TLK2 |
| regulation of small GTPase mediated signal transduction | AMOT, RHOC, MYO9A, ARHGAP26 |
| negative regulation of gene expression | ADNP, SFMBT2, TP53INP1, GBA |
| signal transduction by protein phosphorylation | ACVR2B, TGFBR1, STK39 |
| response to ionizing radiation | EYA3, DNMT3A, H2AFX |
| positive regulation of osteoblast differentiation | ACVR2B, CEBPD, CYR61 |
| regulation of inflammatory response | SLC7A2, STK39, FOXP1 |
| glucose metabolic process | WDTC1, ALDH5A1, PDK3 |
| regulation of cardiac muscle cell proliferation | TGFBR1, FOXP1 |
| negative regulation of PERK-mediated unfolded protein response | PTPN1, PPP1R15B |
| anterior commissure morphogenesis | FBXO45, NFIB |
| basic amino acid transmembrane transport | SLC7A2, SLC7A7 |
| sphingosine biosynthetic process | SPTLC2, GBA |
| positive regulation of IRE1-mediated unfolded protein response | TMEM33, PTPN1 |
miR-22 regulates transcriptional signature that predicts ccRCC outcome
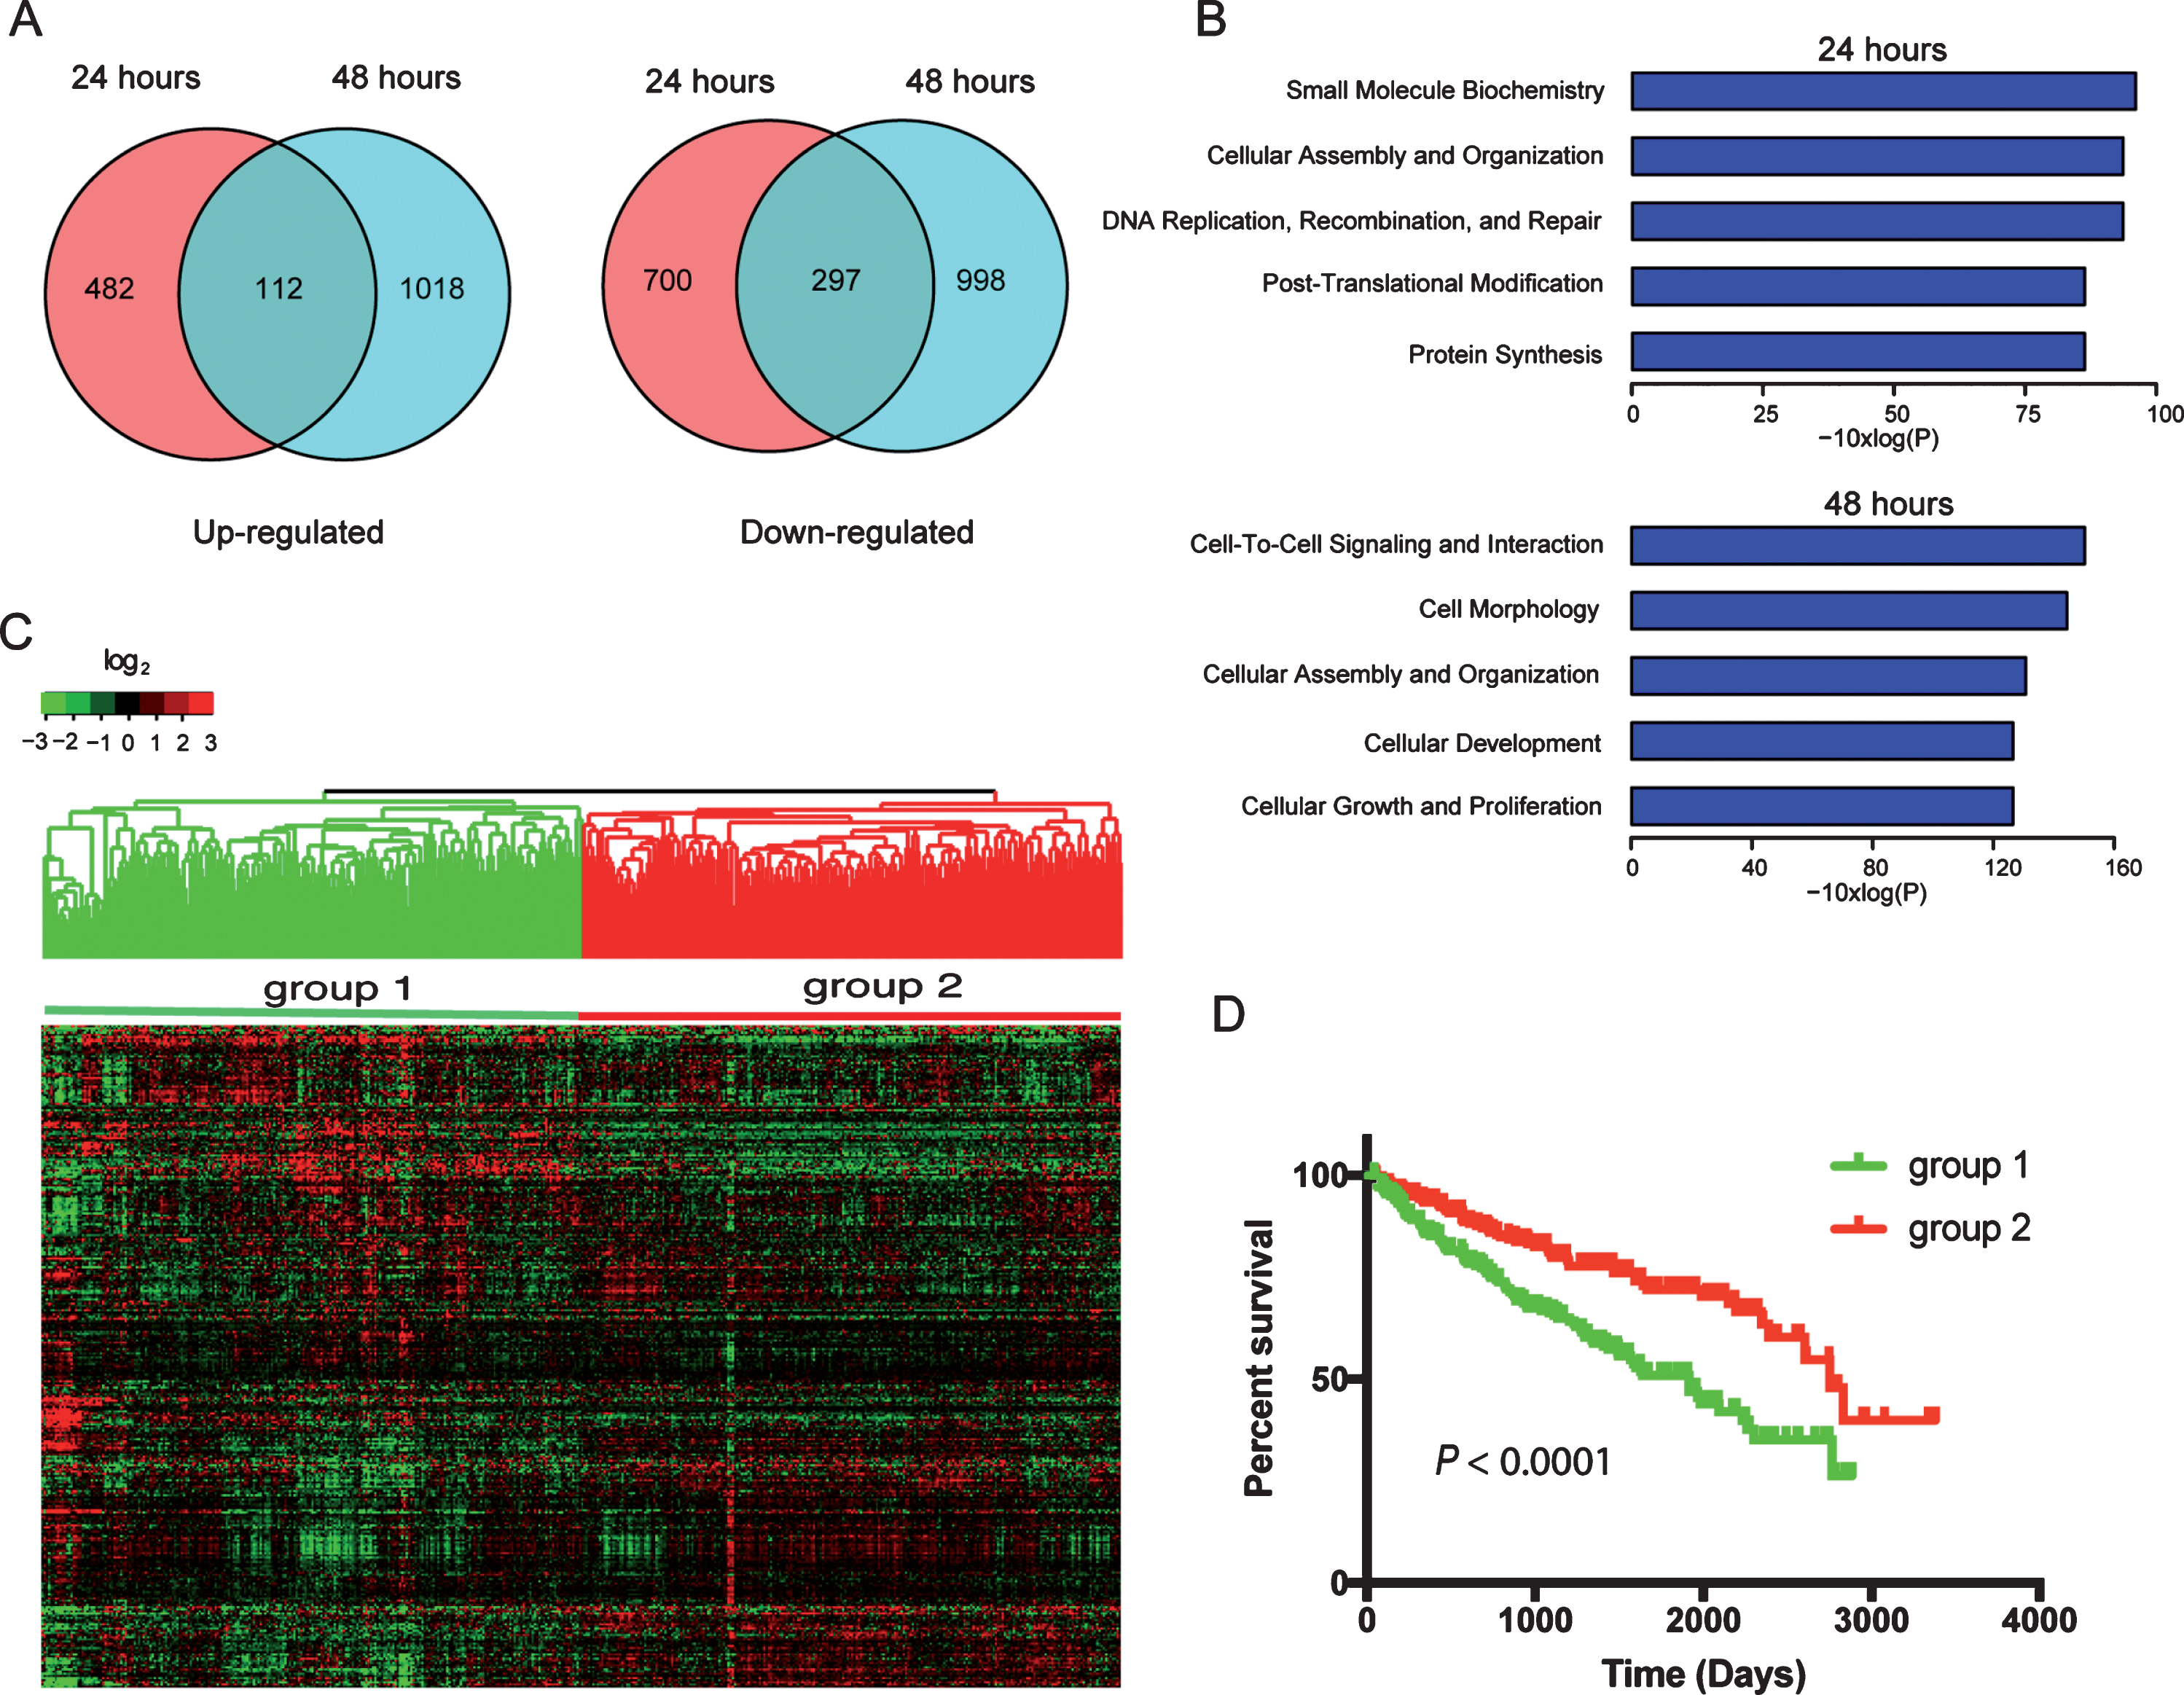
To determine the effects of miR-22 on the transcriptome of ccRCC cells, we transfected primary ccRCC cells with miR-22 mimics and performed RNA-Seq at 24 hr and 48 hr after transfection. At 24 hr after transfection, 594 and 997 genes were up- or down-regulated, respectively, compared to control (Fig. 3A) (Supplemental Table 5). Expression of an increased number of genes was affected at 48 hr after transfection compare to 24 hr i.e., 1130 and 1295 genes were up- or down-regulated, respectively (Fig. 3A). One hundred and twelve genes were consistently upregulated at both 24 and 48 hr while 297 genes were consistently downregulated. Enrichment analysis using IPA identified key cellular processes in cancer progression affected by miR-22 overexpression such as DNA repair and cell proliferation (Fig. 3B). Of the 112 genes upregulated and 297 genes downregulated by miR-22, expression levels of 308 genes were available for the 480 ccRCC patients from TCGA (Supplemental Table 6). When hierarchical clustering analysis was performed using these 308 genes, patients were separated into two main groups that are > 90% overlapping with the two groups classified using the 2,621 genes (Fig. 3C). Specifically, 210 out of the 220 cases that were classified as group 1 tumors using the 2,621 genes were also placed in group 1 when the 308 genes were used. Two hundred and thirty three of 260 group 2 tumors using the 2,621 genes were classified as group 2 tumors when the 308 genes were used. These two groups showed significantly different outcomes by Kaplan-Meier analysis (P < 0.001) as expected (Fig. 3D). Biological processes that are significantly enriched in these 308 genes identified by GO enrichment analysis are listed in Supplemental Table 7. These results suggest that miR-22 regulates an important transcriptional program that contributes to outcomes of patients with ccRCC.
Fig.3
Transcriptome (RNA-Seq) analysis of miR-22 overexpression in primary ccRCC cells identifies prognostic gene signatures in TCGA dataset. (A) Veen diagram illustrate genes≥1.5-fold upregulated (left) or downregulated (right) following transfection of miR-22 mimic into ccRCC cells. (B) Significantly enriched biological functions (by Ingenuity Pathway Analysis) associated with transfection of miR-22 mimic into cells at each of the two time points. (C) Hierarchical clustering of TCGA samples across the 308 genes affected by miR-22 mimic transfection into ccRCC cells (common among both time points). Note, two main sample clusters are observed (red and blue bars). (D) Kaplan-Meier survival analysis comparing the two TCGA sample clusters from above; P-value (log-rank test) indicated.
miR-22 promotes cell invasion in ccRCC
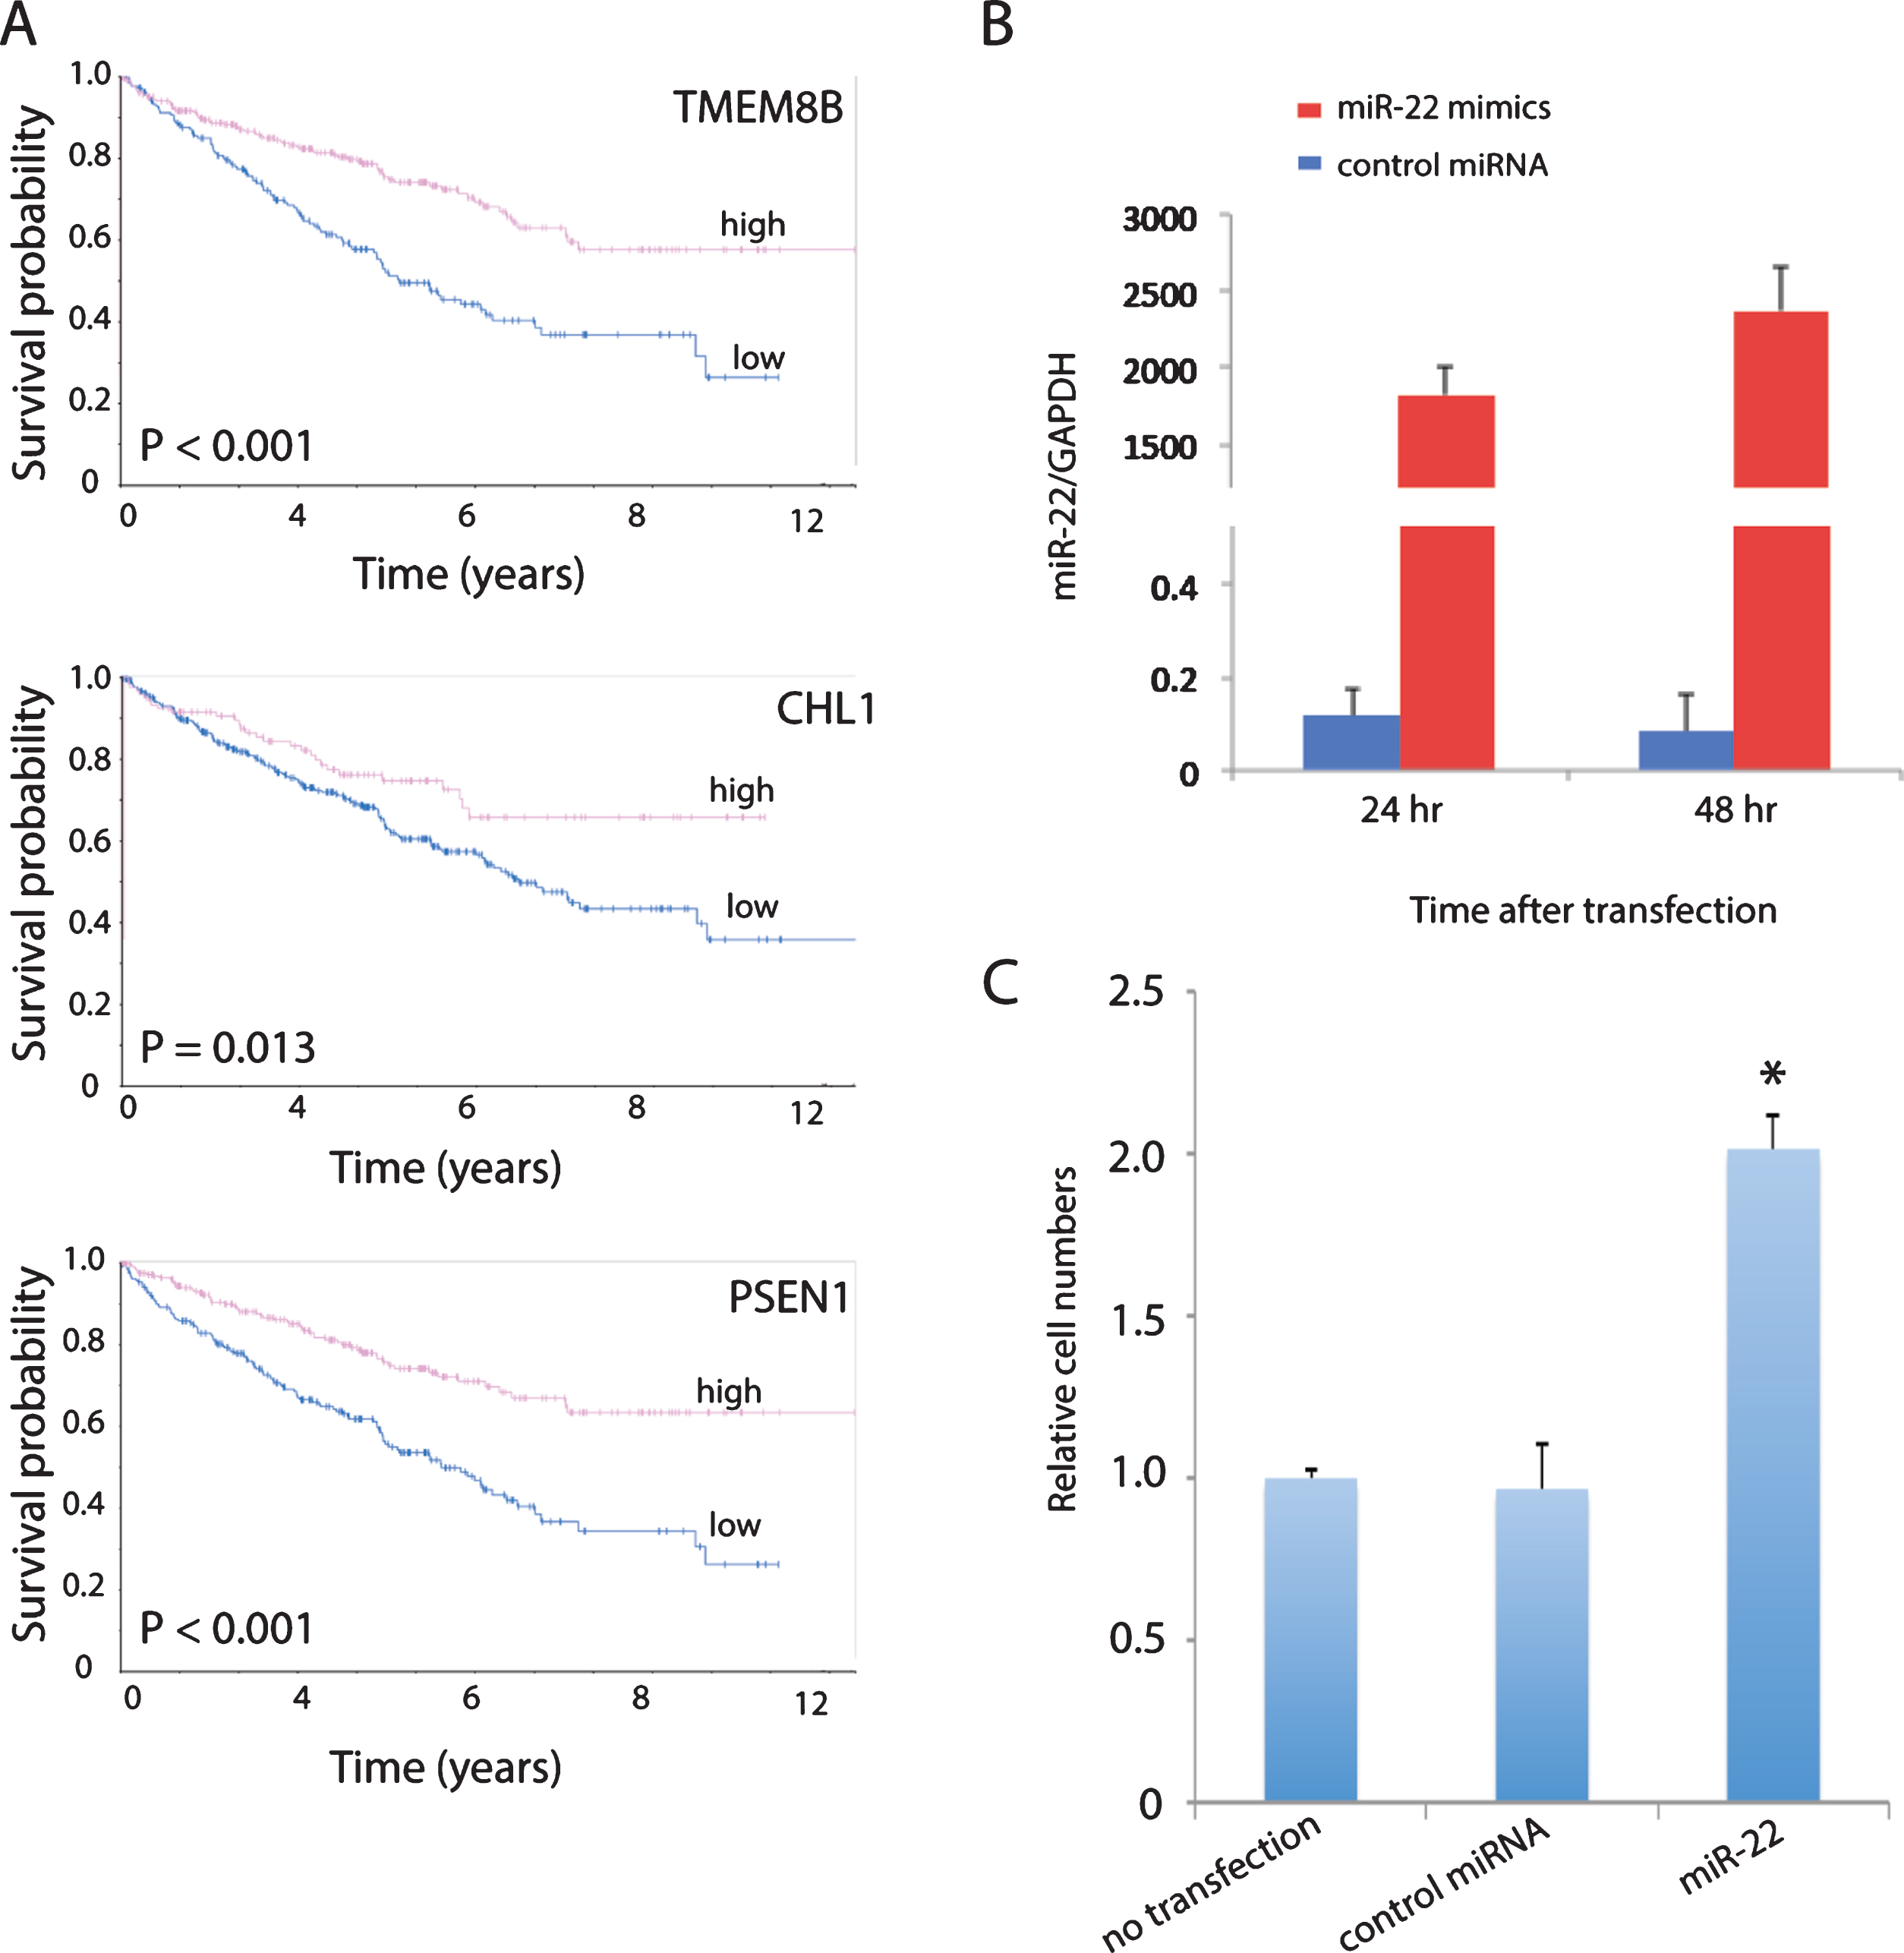
Cell adhesion (focal adhesion, adherens junction and ECM-receptor interaction) is one of the top pathways enriched in the list of 2,621 prognostic genes (Table 1). In addition, high expression of a number of genes involved in cell adhesion that are downregulated by miR-22 in the primary ccRCC cells including CHL1 [28, 29], PSEN1 [30, 31] and TMEM8B [32, 33] were predictive of good overall survival in ccRCC patients from TCGA shown by Kaplan-Meier analysis from the Human Protein Atlas (https://www.proteinatlas.org) (Fig. 4A). Therefore, we determined the effect of miR-22 overexpression on cell invasion using a Matrigel invasion assay. MiR-22 overexpression was confirmed by qPCR in cells cultured from a primary ccRCC tumor expressing typical ccRCC markers such as CAIX and CD10 (Supplemental Figure 1) and transfected with miR-22 mimics (Fig. 4B). Cells transfected with scrambled RNA showed no difference in invasion compared to cells without transfection, whereas cells transfected with miR-22 mimics showed significantly higher invasiveness compared to cells transfected with scrambled RNA as well as cells without transfection (Fig. 4C). These results suggest that increased invasion may be one biological mechanism by which overexpression of miR-22 increases risk of ccRCC progression.
Fig.4
miR-22 promotes cell invasion in primary ccRCC cells. (A) MiR-22 downregulated cell adhesion promoting genes in primary ccRCC that are associated with good overall survival in TCGA patients. High expression is defined as equal or greater than the mean and low expression smaller than the mean. (B) Validation of miR-22 level in primary ccRCC cells after transfection with miR-22 mimics by qPCR. (C) Quantification of cell invasion following transfection of cells with miR-22 mimics, compared to no transfection and non-targeting control (NTC). P-value is significant by ANOVA.
DISCUSSION
Gene expression profiling can improve outcome prediction in patients with ccRCC beyond that provided by stage, grade, and patient performance status as we and other groups have previously reported [9, 25, 26, 34–36]. It is encouraging to see that similar pathways contribute to prognosis in different ccRCC patient cohorts. For example, we found that tumors whose gene expression profiles most resembled the normal renal cortex or glomerulus showed better overall survival than those that did not in both the TCGA ccRCC patients and a cohort of Swedish patients [25], suggesting that a critical feature of lethal ccRCC is loss of normal cortical differentiation. Similarly, Buttner at al. reported that cancer-specific survival of the TCGA ccRCC patients was significantly associated with gene expression similarity to the proximal tubules [26]. The risk score developed in this study based on differential gene expression between nephron regions using the TCGA patients was validated in the Swedish cohort, supporting the notion that gene expression in the cell of origin of ccRCC can be used for prognostic risk stratification [26]. Moreover, cell adhesion, metabolism and hypoxia signaling are among the differentially expressed prognostic pathways in ccRCC identified by different groups [35–38]. Interestingly, we found that tumors with poor prognosis expressed high levels of many genes promoting immune responses. This gene expression pattern may be attributed to tumor microenvironment rather than tumor cells themselves, as shown by studies characterizing the tumor immune microenvironment of ccRCC [39, 40]. Future studies are needed to investigate the role of gene expression associated with immune responses in ccRCC prognosis.
MiRNAs are essential regulators of RCC development and progression, playing either a promoting role as oncomirs or a suppressive role as anti-oncomirs [41–44]. More than 20 prognostic miRNAs in RCC have been identified with the majority associated with poor prognosis, none of which supplemented existing RCC prognostic nomograms [41]. One possible explanation is that single miRNA does not have enough predictive power and a miRNA panel may be more effective and can compensate for the unreliability of individual miRNAs in estimating prognosis [43, 44]. In addition, conflicting results have been reported for the role of the same miRNAs in RCC prognosis. For example, Samaan et al. reported that higher miR-210 expression is associated with a statistically higher chance of disease recurrence and shorter overall survival in a cohort of 276 ccRCC patients [45], while McCormick et al. observed in 69 ccRCC patients that those with high miR-210 expression had an improved overall survival post nephrectomy compared to those with medium and low levels of miR-210 [46]. Similarly, conflicting results on the role of miR-221 in predicting cancer-specific survival in RCC has also reported by others previously [47], underscoring the importance of using a panel of miRNAs rather than a single miRNA for RCC prognostication.
We identified 26 master regulator miRNAs that are prognostic by themselves and also regulate transcriptional programs that contribute to ccRCC patient outcomes using the TCGA ccRCC dataset. Six of these miRNAs are associated with good overall survival including miR-143, miR-23b, miR-144, miR-204, miR-126 and miR-27b, while the rest predict poor survival. Half of these 26 miRNAs have been annotated in the miRNA Cancer Association Database (miRCancer) [48]. Four of the 6 miRNAs (miR-143, miR-23b, miR-144 and miR-204) associated with improved survival in the TCGA dataset are also annotated as anti-oncomirs in miRCancer as of December 2017. In addition, 4 of the 20 miRNAs associated with poor survival in the TCGA dataset (miR-21, miR-183, miR-155 and miR-221) are annotated as oncomirs by miRCancer. MiR-126 and miR-27a (oncogenic in TCGA dataset) are controversial in terms of whether they are tumor suppressive or promoting in RCC according to miRCancer, suggesting that the role of a particular miRNA in cancer is highly context-dependent. Indeed, miR-22, miR-182 and miR-34a are associated with poor survival in the TCGA dataset but are annotated as anti-oncomirs by miRCancer.
There is no doubt that miR-22 plays a central role in the development and progression of various cancers through different mechanisms. However, it is highly controversial whether it serves as a oncomir or an anti-oncomir even within the same cancer type. For example, Xin et al. showed that miR-22 inhibits tumor growth and metastasis of prostate cancer by targeting the proto-oncogene ATP citrate lyase [49], while Budd et al. demonstrated that miR-22 promotes proliferation, migration and metastasis in prostate cancer by directly repressing tumor suppressor phosphatase and tensin homolog (PTEN) [50]. In addition, Dhar et al. revealed that miR-22 promotes prostate cancer cell invasiveness and migration by targeting E-cadherin and metastasis-associated protein 1, resulting in epithelial-to-mesenchymal transition [51]. Similarly, several studies have shown that miR-22 down-regulates ATP citrate lyase and Sirt1 to inhibit the growth and metastasis of breast cancer cells [52], while others claimed that miR-22 promotes stemness and metastasis in breast cancer cells by downregulating TIP60, a lysine acetyl-transferase, and correlates with poor survival in patients [53].
In ccRCC, it was reported that miR-22 inhibited cell proliferation, migration and invasion in vitro by targeting Sirt1 [54], suggesting a tumor suppressive role of miR-22. In addition, Fan et al. showed that miR-22 was downregulated in ccRCC tumor tissue and lower miR-22 expression was associated with higher histological grade, tumor stage and lymph node metastasis in a cohort of 68 patients [55]. However, Fan et al. also showed that PTEN is a direct target gene of miR-22 in ccRCC cells and miR-22 upregulation led to downregulation of PTEN protein in RCC cell lines, indicating an oncogenic effect of miR-22 overexpression [55]. Consistent with this observation, overexpression of miR-22 in primary ccRCC cells led to a 12% decrease of PTEN transcript level at 48 hours after transfection of miR-22 mimics in our study. In addition, miR-22 expression is associated with poor survival in the TCGA dataset, suggesting a tumor promoting role of miR-22. The discrepancy of miR-22 expression in predicting survival could be due to differences in patient populations as the patient cohort used in the study by Fan et al. is of Chinese ethnicity while the TCGA patients are of western origin.
We identified 308 genes that are either upregulated or downregulated by overexpression of miR-22 in primary ccRCC cells at both 24 and 48 hours. Thirty of these 308 genes were among the 2,621 genes that overlapped between 3,674 unique prognostic genes differentially expressed in a previous cohort of 177 ccRCC patients and those represented in expression profiles of 480 ccRCC patients from TCGA. However, these 30 genes didn’t overlap with the 96 miR-22 targets identified by TargetScan, suggesting that miR-22 may regulate distinct transcriptional programs in cultured cells compared to tumor tissues. Alternatively, these 30 genes may be indirectly regulated by miR-22. In addition, we identified 594 and 997 genes that were upregulated or downregulated by miR-22 in the primary RCC cells at 24 hours, respectively, and 75 and 86 of these 594 and 997 genes, respectively, were among the 2,621 genes. Similarly, of the 1130 and 1293 genes that were up- or down-regulated by miR-22 at 48 hours, 131 and 142, respectively, were found in the 2,621 genes, confirming a minimal overlapping of genes regulated by miR-22 in cultured cells and tumor tissues. Interestingly, the classification of TCGA patients using expression levels of miR-22 target genes identified in cultured primary cells largely overlaps with the classification using prognostic genes previously identified using a different patient cohort, demonstrating the robustness of miR-22 as a functional regulator of ccRCC prognosis. These gene lists may serve as valuable resources to further investigate the mechanisms of miR-22 actions in ccRCC.
One of the underlying mechanisms of action of miR-22 in cancer progression is through regulating cellular adhesion, which in turn affects migration and invasion [56]. Our study showed that adhesion is one of the top pathways that contributes to ccRCC prognosis using gene expression profiles of tumor tissues. In addition, miR-22 downregulates genes that positively regulate cell adhesion including CHL1 [28, 29], PSEN1 [30, 31] and TMEM8B [32, 33] in cultured primary cells consistently over the time course of 48 hours when miR-22 is overexpressed. Moreover, a number of positive regulators of cell adhesion that suppress cell invasion were downregulated at 48 hours but not 24 hours. For example, SERPINA5 (protein C inhibitor) [57] and SERPINB5 (maspin) [58] prevent invasion by inhibiting tissue plasminogen activator, which in turn prevents extracellular matrix degradation. Both were downregulated by miR-22 at 48 hours, suggesting that one of the mechanisms by which miR-22 promotes invasion is through activating plasminogen. Finally, our in vitro study using primary ccRCC cells demonstrated that miR-22 overexpression indeed promoted cell invasion. Further experiments are needed to pinpoint the mechanisms by which miR-22 promotes cell invasion in ccRCC.
CONCLUSIONS
In conclusion, we have identified master regulator miRNAs associated with survival of patients with ccRCC. Further investigation of these miRNAs may shed light on the mechanisms of ccRCC progression. In particular, miR-22 acts as an oncogenic miRNA that regulates gene expression programs associated with survival, at least in part by promoting cellular invasion in ccRCC.
CONFLICT OF INTEREST
The authors have no conflict of interest to report.
SUPPLEMENTARY MATERIAL
[1] The supplementary material is available in the electronic version of this article: http://dx.doi.org/10.3233/KCA-190051.
ACKNOWLEDGMENTS
The authors thank Dr. Pollack for helpful discussions. This study was partially supported by NIH/NCI (U01 CA152737 to JDB and U01 CA217456 to DMP). This work used the Genome Sequencing Service Center by Stanford Center for Genomics and Personalized Medicine Sequencing Center, supported by the grant award NIH S10OD020141.
REFERENCES
[1] | Wong MCS , Goggins WB , Yip BHK , Fung FDH , Leung C , Fang Y , et al. . Incidence and mortality of kidney cancer: Temporal patterns and global trends in 39 countries. Sci Rep. (2017) ;7: (1):15698. |
[2] | Siegel RL , Miller KD , Jemal A . Cancer statistics, 2018. CA Cancer J Clin. (2018) ;68: (1):7–30. |
[3] | Hsieh JJ , Purdue MP , Signoretti S , Swanton C , Albiges L , Schmidinger M , et al. . Renal cell carcinoma. Nat Rev Dis Primers. (2017) ;3: :17009. |
[4] | Ravaud A , Motzer RJ , Pandha HS , George DJ , Pantuck AJ , Patel A , et al. . Adjuvant Sunitinib in High-Risk Renal-Cell Carcinoma after Nephrectomy. N Engl J Med. (2016) ;375: (23):2246–54. |
[5] | Frank I , Blute ML , Cheville JC , Lohse CM , Weaver AL , Leibovich BC , et al. . A multifactorial postoperative surveillance model for patients with surgically treated clear cell renal cell carcinoma. J Urol. (2003) ;170: (6 Pt 1):2225–32. |
[6] | Patard JJ , Kim HL , Lam JS , Dorey FJ , Pantuck AJ , Zisman A , et al. . Use of the University of California Los Angeles integrated staging system to predict survival in renal cell carcinoma: An international multicenter study. J Clin Oncol. (2004) ;22: (16):3316–22. |
[7] | Sorbellini M , Kattan MW , Snyder ME , Reuter V , Motzer R , Goetzl M , et al. . A postoperative prognostic nomogram predicting recurrence for patients with conventional clear cell renal cell carcinoma. J Urol. (2005) ;173: (1):48–51. |
[8] | Hsieh JJ , Le V , Cao D , Cheng EH , Creighton CJ . Genomic classifications of renal cell carcinoma: A critical step towards the future application of personalized kidney cancer care with pan-omics precision. J Pathol. (2018) ;244: (5):525–37. |
[9] | Zhao H , Ljungberg B , Grankvist K , Rasmuson T , Tibshirani R , Brooks JD . Gene expression profiling predicts survival in conventional renal cell carcinoma. PLoS Med. (2006) ;3: (1):e13. |
[10] | Verbiest A , Couchy G , Job S , Caruana L , Lerut E , Oyen R , et-al. Molecular Subtypes of Clear-cell Renal Cell Carcinoma are Prognostic for Outcome After Complete Metastasectomy. Eur Urol. (2018) . |
[11] | Chen F , Zhang Y , Senbabaoglu Y , Ciriello G , Yang L , Reznik E , et al. . Multilevel Genomics-Based Taxonomy of Renal Cell Carcinoma. Cell Rep. (2016) ;14: (10):2476–89. |
[12] | Cancer Genome Atlas Research N. Comprehensive molecular characterization of clear cell renal cell carcinoma. Nature. (2013) ;499: (7456):43–9. |
[13] | Paul P , Chakraborty A , Sarkar D , Langthasa M , Rahman M , Bari M , et al. . Interplay between miRNAs and human diseases. J Cell Physiol. (2018) ;233: (3):2007–18. |
[14] | Kurozumi A , Goto Y , Okato A , Ichikawa T , Seki N . Aberrantly expressed microRNAs in bladder cancer and renal cell carcinoma. J Hum Genet. (2017) ;62: (1):49–56. |
[15] | Schubert M , Junker K , Heinzelmann J . Prognostic and predictive miRNA biomarkers in bladder, kidney and prostate cancer: Where do we stand in biomarker development? J Cancer Res Clin Oncol. (2016) ;142: (8):1673–95. |
[16] | Valente MJ , Henrique R , Costa VL , Jeronimo C , Carvalho F , Bastos ML , et al. . A rapid and simple procedure for the establishment of human normal and cancer renal primary cell cultures from surgical specimens. PLoS One. (2011) ;6: (5):e19337. |
[17] | Jiao X , Sherman BT , Huang da W , Stephens R , Baseler MW , Lane HC , et al. . DAVID-WS: A stateful web service to facilitate gene/protein list analysis. Bioinformatics. (2012) ;28: (13):1805–6. |
[18] | Ciccarese C , Brunelli M , Montironi R , Fiorentino M , Iacovelli R , Heng D , et al. . The prospect of precision therapy for renal cell carcinoma. Cancer Treat Rev. (2016) ; 49: :37–44. |
[19] | Mallikarjuna P , Sitaram RT , Landstrom M , Ljungberg B . VHL status regulates transforming growth factor-beta signaling pathways in renal cell carcinoma. Oncotarget. (2018) ;9: (23):16297–310. |
[20] | Schutte U , Bisht S , Heukamp LC , Kebschull M , Florin A , Haarmann J , et al. . Hippo signaling mediates proliferation, invasiveness, and metastatic potential of clear cell renal cell carcinoma. Transl Oncol. (2014) ;7: (2):309–21. |
[21] | Lin A , Piao HL , Zhuang L , Sarbassov dos D , Ma L , Gan B . FoxO transcription factors promote AKT Ser473 phosphorylation and renal tumor growth in response to pharmacologic inhibition of the PI3K-AKT pathway. Cancer Res. (2014) ;74: (6):1682–93. |
[22] | Matsuda H , Campion CG , Fujiwara K , Ikeda J , Cossette S , Verissimo T , et al. . HCaRG/COMMD5 inhibits ErbB receptor-driven renal cell carcinoma. Oncotarget. (2017) ;8: (41):69559–76. |
[23] | Lee SH , Lee WK , Kim N , Kang JH , Kim KH , Kim SG , et al. . Renal Cell Carcinoma Is Abrogated by p53 Stabilization through Transglutaminase 2 Inhibition. Cancers (Basel). (2018) ; 10: (11). |
[24] | Higgins JP , Wang L , Kambham N , Montgomery K , Mason V , Vogelmann SU , et al. . Gene expression in the normal adult human kidney assessed by complementary DNA microarray. Mol Biol Cell. (2004) ;15: (2):649–56. |
[25] | Zhao H , Zongming M , Tibshirani R , Higgins JP , Ljungberg B , Brooks JD . Alteration of gene expression signatures of cortical differentiation and wound response in lethal clear cell renal cell carcinomas. PLoS One. (2009) ; 4: (6):e6039. |
[26] | Buttner F , Winter S , Rausch S , Reustle A , Kruck S , Junker K , et al. . Survival Prediction of Clear Cell Renal Cell Carcinoma Based on Gene Expression Similarity to the Proximal Tubule of the Nephron. Eur Urol. (2015) ;68: (6):1016–20. |
[27] | Krabbe LM , Margulis V , Lotan Y . Prognostic Role of Cell Cycle and Proliferative Markers in Clear Cell Renal Cell Carcinoma. Urol Clin North Am. (2016) ;43: (1):105–18. |
[28] | Chu Y , Ouyang Y , Wang F , Zheng A , Bai L , Han L , et al. . MicroRNA-590 promotes cervical cancer cell growth and invasion by targeting CHL1. J Cell Biochem. (2014) ;115: (5):847–53. |
[29] | Ognibene M , Pagnan G , Marimpietri D , Cangelosi D , Cilli M , Benedetti MC , et al. . CHL1 gene acts as a tumor suppressor in human neuroblastoma. Oncotarget. (2018) ;9: (40):25903–21. |
[30] | Waschbusch D , Born S , Niediek V , Kirchgessner N , Tamboli IY , Walter J , et al. . Presenilin 1 affects focal adhesion site formation and cell force generation via c-Src transcriptional and posttranslational regulation. J Biol Chem. (2009) ;284: (15):10138–49. |
[31] | Baki L , Marambaud P , Efthimiopoulos S , Georgakopoulos A , Wen P , Cui W , et al. . Presenilin-1 binds cytoplasmic epithelial cadherin, inhibits cadherin/p120 association, and regulates stability and function of the cadherin/catenin adhesion complex. Proc Natl Acad Sci U S A. (2001) ;98: (5):2381–6. |
[32] | Peng SP , Li XL , Wang L , Ou-Yang J , Ma J , Wang LL , et al. . The role of NGX6 and its deletion mutants in the proliferation, adhesion and migration of nasopharyngeal carcinoma 5-8F cells. Oncology. (2006) ;71: (3-4):273–81. |
[33] | Ma J , Zhou J , Fan S , Wang L , Li X , Yan Q , et al. . Role of a novel EGF-like domain-containing gene NGX6 in cell adhesion modulation in nasopharyngeal carcinoma cells. Carcinogenesis. (2005) ;26: (2):281–91. |
[34] | Wozniak MB , Le Calvez-Kelm F , Abedi-Ardekani B , Byrnes G , Durand G , Carreira C , et al. . Integrative genome-wide gene expression profiling of clear cell renal cell carcinoma in Czech Republic and in the United States. PLoS One. (2013) ;8: (3):e57886. |
[35] | Tan MH , Rogers CG , Cooper JT , Ditlev JA , Maatman TJ , Yang X , et al. . Gene expression profiling of renal cell carcinoma. Clin Cancer Res. (2004) ; 10: (18 Pt 2):6315S–21S. |
[36] | Takahashi M , Rhodes DR , Furge KA , Kanayama H , Kagawa S , Haab BB , et al. . Gene expression profiling of clear cell renal cell carcinoma: Gene identification and prognostic classification. Proc Natl Acad Sci U S A. (2001) ;98: (17):9754–9. |
[37] | Liou LS , Shi T , Duan ZH , Sadhukhan P , Der SD , Novick AA , et al. . Microarray gene expression profiling and analysis in renal cell carcinoma. BMC Urol. (2004) ;4: :9. |
[38] | Li X , Meng X , Wei C , Zhou Y , Chen H , Huang H , et al. . Dissecting LncRNA Roles in Renal Cell Carcinoma Metastasis and Characterizing Genomic Heterogeneity by Single-Cell RNA-seq. Mol Cancer Res. (2018) ;16: (12):1879–88. |
[39] | Chevrier S , Levine JH , Zanotelli VRT , Silina K , Schulz D , Bacac M , et al. . An Immune Atlas of Clear Cell Renal Cell Carcinoma. Cell. (2017) ; 169: (4):736–49 e18. |
[40] | Senbabaoglu Y , Gejman RS , Winer AG , Liu M , Van Allen EM , de Velasco G , et al. . Tumor immune microenvironment characterization in clear cell renal cell carcinoma identifies prognostic and immunotherapeutically relevant messenger RNA signatures. Genome Biol. (2016) ;17: (1):231. |
[41] | Mytsyk Y , Dosenko V , Skrzypczyk MA , Borys Y , Diychuk Y , Kucher A , et al. . Potential clinical applications of microRNAs as biomarkers for renal cell carcinoma. Cent European J Urol. (2018) ;71: (3):295–303. |
[42] | He YH , Chen C , Shi Z . The biological roles and clinical implications of microRNAs in clear cell renal cell carcinoma. J Cell Physiol. (2018) ;233: (6):4458–65. |
[43] | Ran L , Liang J , Deng X , Wu J . miRNAs in Prediction of Prognosis in Clear Cell Renal Cell Carcinoma. Biomed Res Int. (2017) ;2017: :4832931. |
[44] | Chen Z , Zhan Y , Chi J , Guo S , Zhong X , He A , et-al. Using microRNAs as Novel Predictors of Urologic Cancer Survival: An Integrated Analysis. EBioMedicine. (2018) ; 34: :94–107. |
[45] | Samaan S , Khella HW , Girgis A , Scorilas A , Lianidou E , Gabril M , et al. . miR-210 is a prognostic marker in clear cell renal cell carcinoma. J Mol Diagn. (2015) ;17: (2):136–44. |
[46] | McCormick RI , Blick C , Ragoussis J , Schoedel J , Mole DR , Young AC , et al. . miR-210 is a target of hypoxia-inducible factors 1 and 2 in renal cancer, regulates ISCU and correlates with good prognosis. Br J Cancer. (2013) ;108: (5):1133–42. |
[47] | Gu L , Li H , Chen L , Ma X , Gao Y , Li X , et al. . MicroRNAs as prognostic molecular signatures in renal cell carcinoma: A systematic review and meta-analysis. Oncotarget. (2015) ;6: (32):32545–60. |
[48] | Xie B , Ding Q , Han H , Wu D . miRCancer: A microRNA-cancer association database constructed by text mining on literature. Bioinformatics. (2013) ;29: (5):638–44. |
[49] | Xin M , Qiao Z , Li J , Liu J , Song S , Zhao X , et al. . miR-22 inhibits tumor growth and metastasis by targeting ATP citrate lyase: Evidence in osteosarcoma, prostate cancer, cervical cancer and lung cancer. Oncotarget. (2016) ;7: (28):44252–65. |
[50] | Budd WT , Seashols-Williams SJ , Clark GC , Weaver D , Calvert V , Petricoin E , et al. . Dual Action of miR-125b As a Tumor Suppressor and OncomiR-22 Promotes Prostate Cancer Tumorigenesis. PLoS One. (2015) ;10: (11):e0142373. |
[51] | Dhar S , Kumar A , Gomez CR , Akhtar I , Hancock JC , Lage JM , et al. . MTA1-activated Epi-microRNA-22 regulates E-cadherin and prostate cancer invasiveness. FEBS Lett. (2017) ;591: (6):924–33. |
[52] | Zou Q , Tang Q , Pan Y , Wang X , Dong X , Liang Z , et al. . MicroRNA-22 inhibits cell growth and metastasis in breast cancer via targeting of SIRT1. Exp Ther Med. (2017) ;14: (2):1009–16. |
[53] | Pandey AK , Zhang Y , Zhang S , Li Y , Tucker-Kellogg G , Yang H , et al. . TIP60-miR-22 axis as a prognostic marker of breast cancer progression. Oncotarget. (2015) ;6: (38):41290–306. |
[54] | Zhang S , Zhang D , Yi C , Wang Y , Wang H , Wang J . MicroRNA-22 functions as a tumor suppressor by targeting SIRT1 in renal cell carcinoma. Oncol Rep. (2016) ;35: (1):559–67. |
[55] | Fan W , Huang J , Xiao H , Liang Z . MicroRNA-22 is downregulated in clear cell renal cell carcinoma, and inhibits cell growth, migration and invasion by targeting PTEN. Mol Med Rep. (2016) ;13: (6):4800–6. |
[56] | Wang J , Li Y , Ding M , Zhang H , Xu X , Tang J . Molecular mechanisms and clinical applications of miR-22 in regulating malignant progression in human cancer (Review). Int J Oncol. (2017) ;50: (2):345–55. |
[57] | Wakita T , Hayashi T , Nishioka J , Tamaru H , Akita N , Asanuma K , et al. . Regulation of carcinoma cell invasion by protein C inhibitor whose expression is decreased in renal cell carcinoma. Int J Cancer. (2004) ;108: (4):516–23. |
[58] | Sheng S , Carey J , Seftor EA , Dias L , Hendrix MJ , Sager R . Maspin acts at the cell membrane to inhibit invasion and motility of mammary and prostatic cancer cells. Proc Natl Acad Sci U S A. (1996) ;93: (21):11669–74. |


