
Diagnostic Imaging for Solid Renal Tumors: A Pictorial Review
Abstract
The prognosis of renal tumors depends on histologic subtype. The increased use of abdominal imaging has resulted in an increase in the number of small renal incidentaloma in recent decades. Of these incidentally discovered tumors, 20% are benign lesions warranting conservative management, but most are renal cell carcinomas that warrant a more aggressive therapeutic approach due to their malignant potential. Dedicated diagnostic renal imaging is important for characterization of renal tumors to facilitate treatment planning. This review discusses the ability to detect and differentiate renal cell carcinoma subtypes, angiomyolipoma and oncocytoma based on ultrasound imaging, computed tomography, multiparametric magnetic resonance, and nuclear imaging.
INTRODUCTION
The increased use of abdominal imaging has resulted in an increase in the number of small renal incidentaloma in recent decades. In a study evaluating 3000 patients undergoing computed tomography (CT) for screening colonography, 14% were found to have an incidental renal lesion >1 cm [1]. Overall, up to 66% of the small renal masses <4 cm are incidentally found [2]. Because up to 20% of the solid small renal masses <4 cm are benign, warranting conservative management, preoperative imaging should aim to differentiate benign from malignant tumors [3]. Dedicated diagnostic renal imaging aids in the appropriate treatment planning for renal tumors and may avoid an unnecessary operation.
Of the malignant renal tumors, 90% are renal cell carcinomas (RCCs), of which 75% are clear cell (ccRCC), 7% to 15% are papillary (pRCC), and 5% are chromophobe (chrRCC) subtypes. Collecting duct and medullary carcinomas are rare and account for <1% of the renal tumors. The other 10% of renal tumors consist of metanephric, nephroblastic and mesenchymal tumors. The group of mesenchymal tumors includes a wide variety of sarcomas. More rare tumors, such as neuroendocrine, hematopoietic, lymphoid, germ-cell tumors, and others are also found. Each RCC subtype harbors a different prognosis underlining the importance of differentiation of these entities.
There are two benign renal tumors that should be differentiated from RCC. The most common benign renal tumor is the oncocytoma (3% –7%), known for mimicking RCC on imaging. The second most common benign tumor is an angiomyolipoma, which does not derive from renal epithelial cells. Angiomyolipoma is a mesenchymal tumor composed of blood vessels, smooth muscle, and adipose tissue and accounts for 3% of the renal tumors [6]. The amount of fat varies between angiomyolipomas, and up to 5% are classified as fat poor [7]. The diagnosis of this latter subtype based on imaging alone can be challenging.
This review discusses the tumor detection and differentiation capabilities of ultrasound (US), computed tomography (CT), magnetic resonance imaging (MRI), and nuclear imaging modalities for RCC subtypes, angiomyolipoma, and oncocytoma.
ULTRASOUND
When US became available for the detection of renal masses, other imaging techniques, such as intravenous pyelography, slowly became obsolete [8, 9]. Nowadays, US is considered a feasible first-imaging option for screening renal tumors [10]. The main advantages of US are the lack of ionizing radiation and no need for nephrotoxic contrast agents. In most hospitals, US is a relatively low-cost and easily available imaging modality, and no specific preparations of the patient are necessary.
Scanning protocol
For regular transabdominal grey-scale B-mode (2-dimensional) US, a 3–6 MHz transducer is used. The patient is positioned supine or in lateral decubitus, and the kidneys are scanned in the longitudinal and transverse planes through the flanks. When imaging is obscured by intestinal air, repositioning of the patient can be considered. Breath hold after inspiration may improve inadequate imaging of the kidneys [11].
Tumor detection
Renal masses are recognized on US by a distortion of the normal tissue architecture. Besides technical aspects and patient body habitus, the performance of US in detecting renal tumors depends on tumor echogenicity, size, and location [12]. Solid renal tumors can grossly be categorized as completely solid, multifocal, or partially cystic tumors. The latter are mostly due to necrosis. The appearance of solid (parts of) renal tumors on US can vary between isoechoic-, hypoechoic, and hyperechoic compared with the normal renal parenchyma [11]. Although they appear more isoechoic- or hypoechoic, larger tumors are likely to be detected by US due to distortion of the anatomical architecture. Up to 77% of RCCs ≤30 mm are described as hyperechoic [13] and the rest are isoechoic- or hypoechoic compared with normal renal parenchyma and is more challenging to detect. Up to 18% of tumors ≤20 mm and 21% of tumors between 20 and 25 mm are not detected using US [14, 15]. In conclusion, the most challenging tumors to detect using grey-scale US are small isoechoic renal tumors, especially those with an endophytic growth pattern.
Differentiation of subtypes
Several studies have investigated differentiation of renal tumor subtypes using US [16, 17]. Despite most RCCs <3 cm being hyperechoic, this finding is not pathognomic because it mimics the appearance of an angiomyolipoma. Angiomyolipoma mainly appears as strongly hyperechoic on US due to its fatty content [17, 18] (Figs. 1 and 2). Also the US characteristics found in case of oncocytoma, which can vary greatly, cannot reliably distinguish oncocytoma from RCC. The typical oncocytoma central scar has only sporadically been described on US [19]. Overall, the echogenicity of the tumor does not differentiate between histologic subtypes and cannot reliably distinguish benign from malignant conditions [16, 17].
Fig. 1
A 63-year-old women was referred for follow up of an angiomyolipoma previously diagnosed on CT scan. Ultrasound during follow up indeed showed a 25 mm large, strong hyperechoic tumor (marked with an asterix) in the upperpole of the left kidney consistent with an angiomyolipoma. The echogenicity corresponds with a composition of fat, also when compared to fat in the renal hilum.
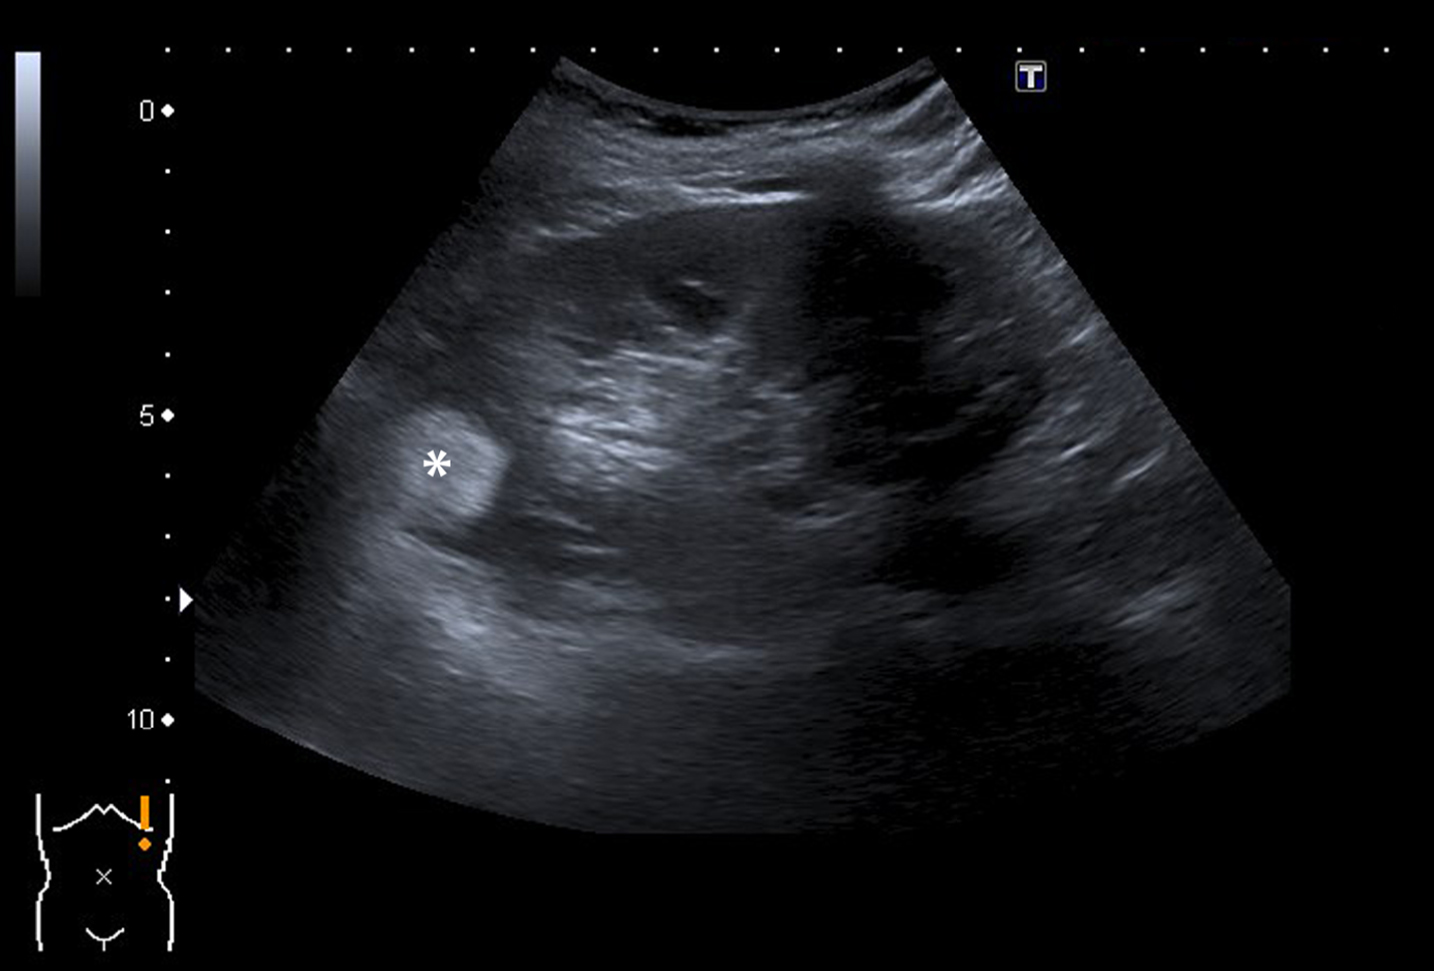
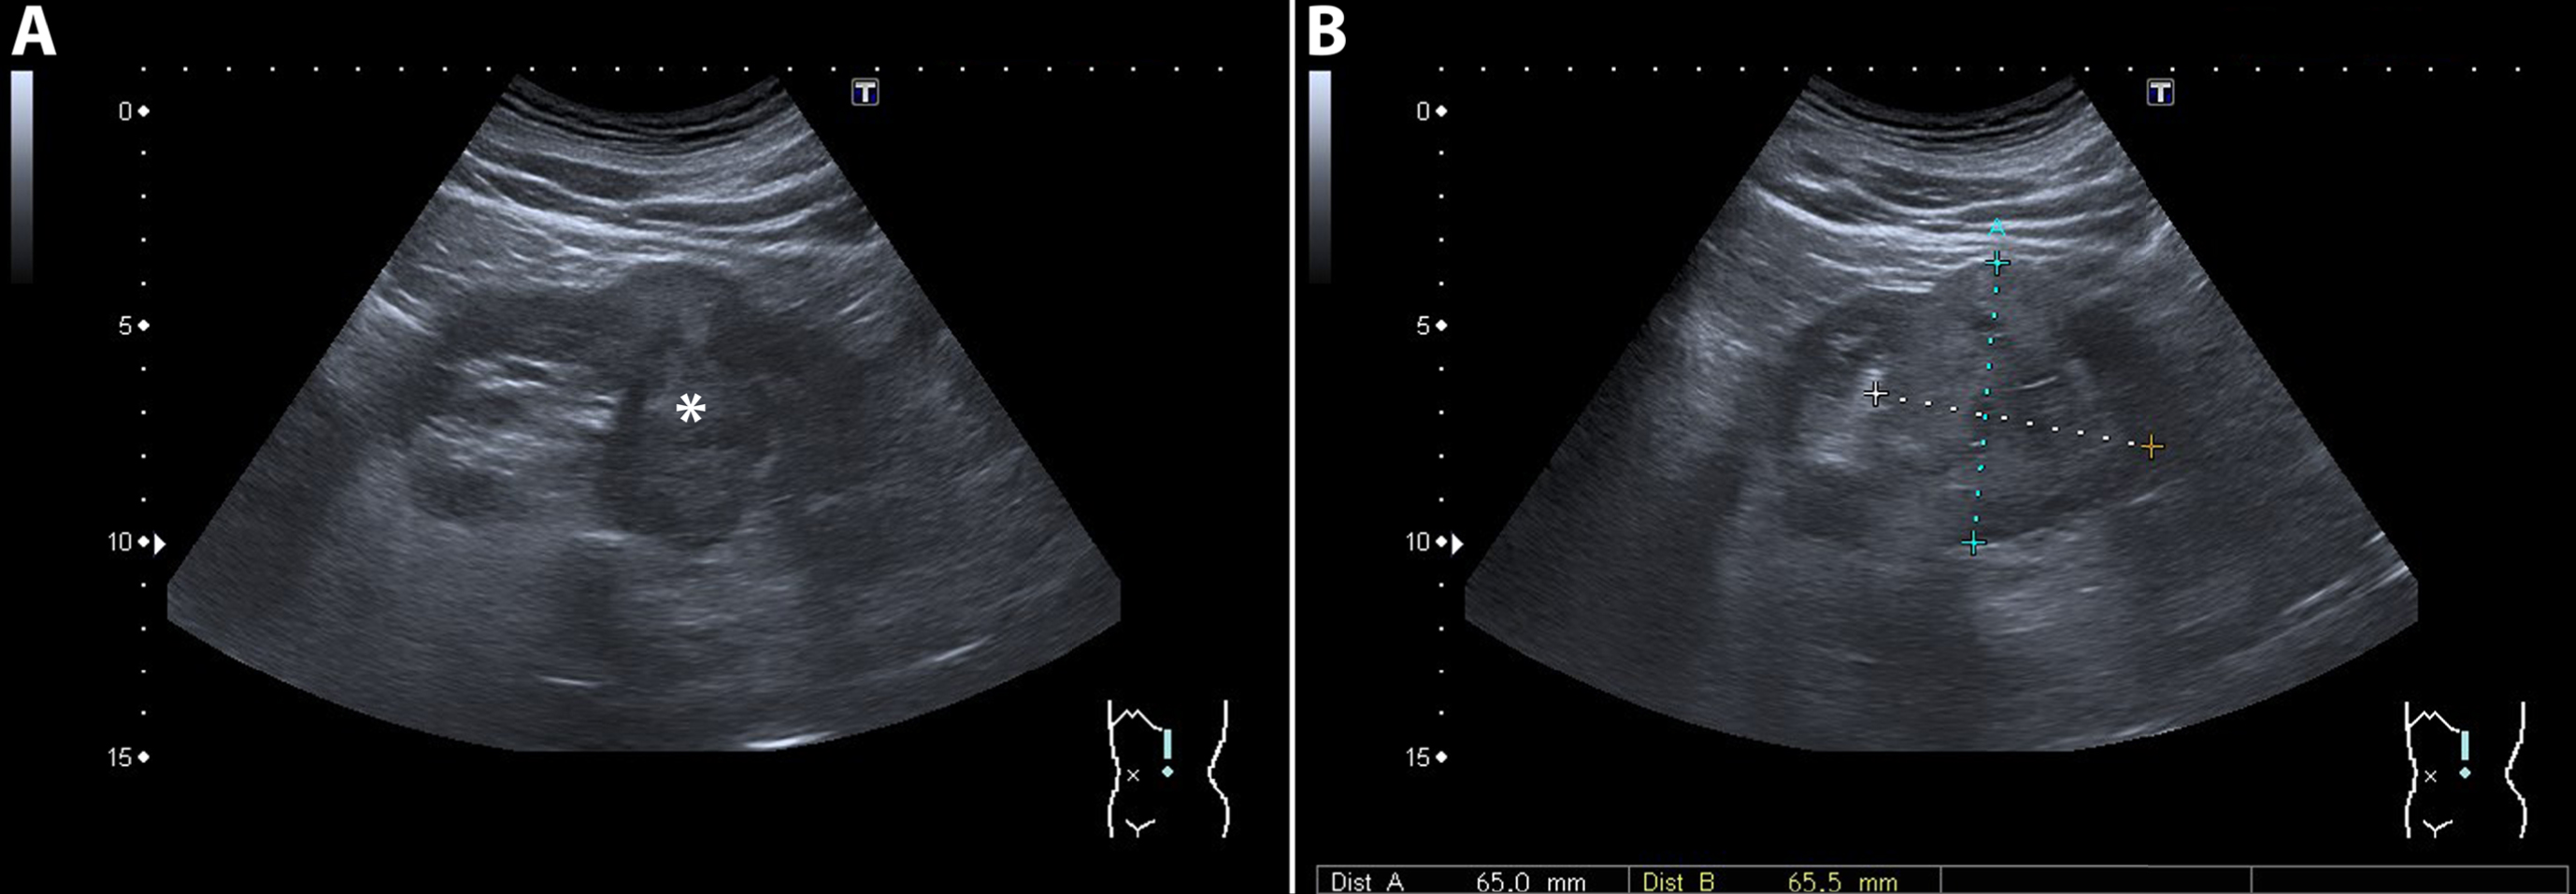
Fig. 2
A 78-year-old man underwent ultrasound of the kidneys because of progressive renal function impairment. On the ultrasound a 65 mm large tumor (marked with an asterix) was detected in the middle/lower pole of the left kidney. The tumor was heterogeneous on ultrasound with mixed isoechoic and hyperechoic areas. A subsequent CT confirmed the presence of a renal tumor with a heterogeneous aspect and strong contrast enhancement suspect for RCC. Pathology report showed a 120 mm large Fuhrman grade II clear cell RCC.
New techniques
Additional techniques to conventional gray-scale US have been studied more recently to support detection and characterization of renal tumors. Color Doppler US is a technique in which the Doppler effect is used to image the movement of fluids. This flow can be combined with conventional B-mode US to image the blood flow relative to the surrounding anatomical structures. This technique showed added value in case of isoechoic endophytic tumors, which can be hard to detect using grey-scale US alone. Doppler US can show vessels with high velocity due to neovascularization in case of RCC. In tumors ≤30 mm, the additional use of Doppler US has been described to aid in differentiating subtypes based on the vascular distribution pattern, especially in case of angiomyolipoma. One study found up to 78% of the 64 tumors investigated (26 RCC, 34 angiomyolipoma, 2 oncocytoma, 2 pseudotumors) were correctly diagnosed using a combination of grey-scale and Doppler US [20]. This study proposed a scoring system for the vascular distribution pattern of renal tumors that could aid information in assessing the nature of renal tumors. A validation study for this scoring system failed to show the ability to predict malignancy of renal tumors [21].
Contrast-enhanced US (CEUS) is a technique in which a contrast medium consisting of gas microbubbles is administered intravenously. This contrast changes renal parenchyma into brighter tones on the grey-scale images [22]. This technique provides information on the micro-circulation, unlike Doppler US, which concerns macro-circulation. The contrast agents used for CEUS are not nephrotoxic [23]. CEUS is more sensitive in detecting hypovascular solid lesions (e.g. pRCC) not distinguishable with Doppler US, and in which CT may show no vascularisation [24]. In case of inconclusive grey-scale or Doppler US, pseudotumors, such as prominent columns of Bertin, persistent fetal lobulation, or dromedary hump, can be differentiated from renal tumors because they show the same enhancing pattern as adjacent renal tissue [25]. One large CEUS diagnostic performance study, including 265 patients with a histological confirmed diagnosis, is available. This study showed a negative and positive predictive value of 100% and 94.7% for characterization of renal tumors as benign or malignant based on enhancement pattern [26]. However, the majority of the lesions were cystic. The enhancing pattern of angiomyolipoma and oncocytoma on CEUS does not differentiate these entities from RCC [27]. In conclusion, additional Doppler US or CEUS can be used to identify smaller isoechoic, hypoechoic, and hypovascular tumors and can be used to correctly identify pseudotumors. The ability of CEUS to characterize a lesion as benign or malignant is undetermined.
COMPUTED TOMOGRAPHY
CT is considered the gold standard for the characterization of renal tumors [28]. Due to its superiority over US and the lesser extent of MRI availability, CT is often the first choice of imaging for evaluation of a renal tumor. Most hospitals have CT scanners available with sufficient capabilities to characterize renal tumors. The great advantage over MRI is the rapid acquisition time. General limitations of CT are the use of ionizing radiation and nephrotoxic iodine contrast agents; however, a recently published meta-analysis suggests that not the administration of contrast agents, but other patients- and illness-level factors contribute to the development of AKI after CT [29]. In a prospective randomised controlled trial including 603 patients with an estimated glomerular filtration rate (eGFR) of 30–59 mL per min/1·73 m2, administration of iodinated contrast agents without prophylaxis was not inferior compared with intravenous hydration for prevention of contrast-induced nephropathy [30]. This may make the use of contrast-enhanced CT available for patients with impaired renal function in whom the characterization of a renal mass previously posed a diagnostic dilemma.
Scanning protocol
For optimal detection and characterization of renal cortical tumors, a contrast-enhanced CT scan consisting of an unenhanced, corticomedullary phase (CMP; 25–40 seconds after injection) and nephrogenic phase (NP; 100–200 seconds after injection) should be acquired. Several studies describe the use of an alternative split bolus scanning protocol to reduce radiation. With this technique the patient receives 2 administrations of intravenous contrast with an interval of several minutes after the unenhanced CT. Approximately 60 to 120 seconds after the second dose is administered, the NP and excretory phase are acquired in 1 image acquisition. This technique has a sensitivity of 90% to 99% and a specificity of 99% to 100% to detect upper urinary tract tumors [31, 32].
This protocol, however, has not been widely adopted, and its value for the characterization of renal tumors is not clear; therefore, the following results are based on the use of a 3-phase CT scan. In the unenhanced phase, calcifications, fat, cystic hemorrhages, and proteineous fluids can be detected through measuring the Hounsfield units (HU) in the lesion. The CMP is used to assess tumor enhancement. During the NP, the tumor contrast washout becomes visible and provides information on possible tumor thrombus in the renal and caval vein. The minimal slice thickness for adequate scanning is 3 mm combined with multiplanar reconstructions [33, 34].
Tumor detection
Because most studies consider CT the gold standard for detection of renal tumors, accuracy in detecting renal tumors is hard to determine from the literature. Findings in a study concerning the accuracy of CT for detecting renal tumors were based on a scoring system varying from “definitely not cancer” to “definitely solid cancer”. That study reported an accuracy of 79% for detection of benign and malignant renal masses [35]. The detection of smaller tumors can especially pose a challenge [36, 37].
Differentiation of subtypes
Through a 3-phase CT scan most renal tumors can be detected and several histologic subtypes can be characterized based on studies comparing the CT diagnosis to the final histopathology report after surgery/biopsy.
Angiomyolipoma
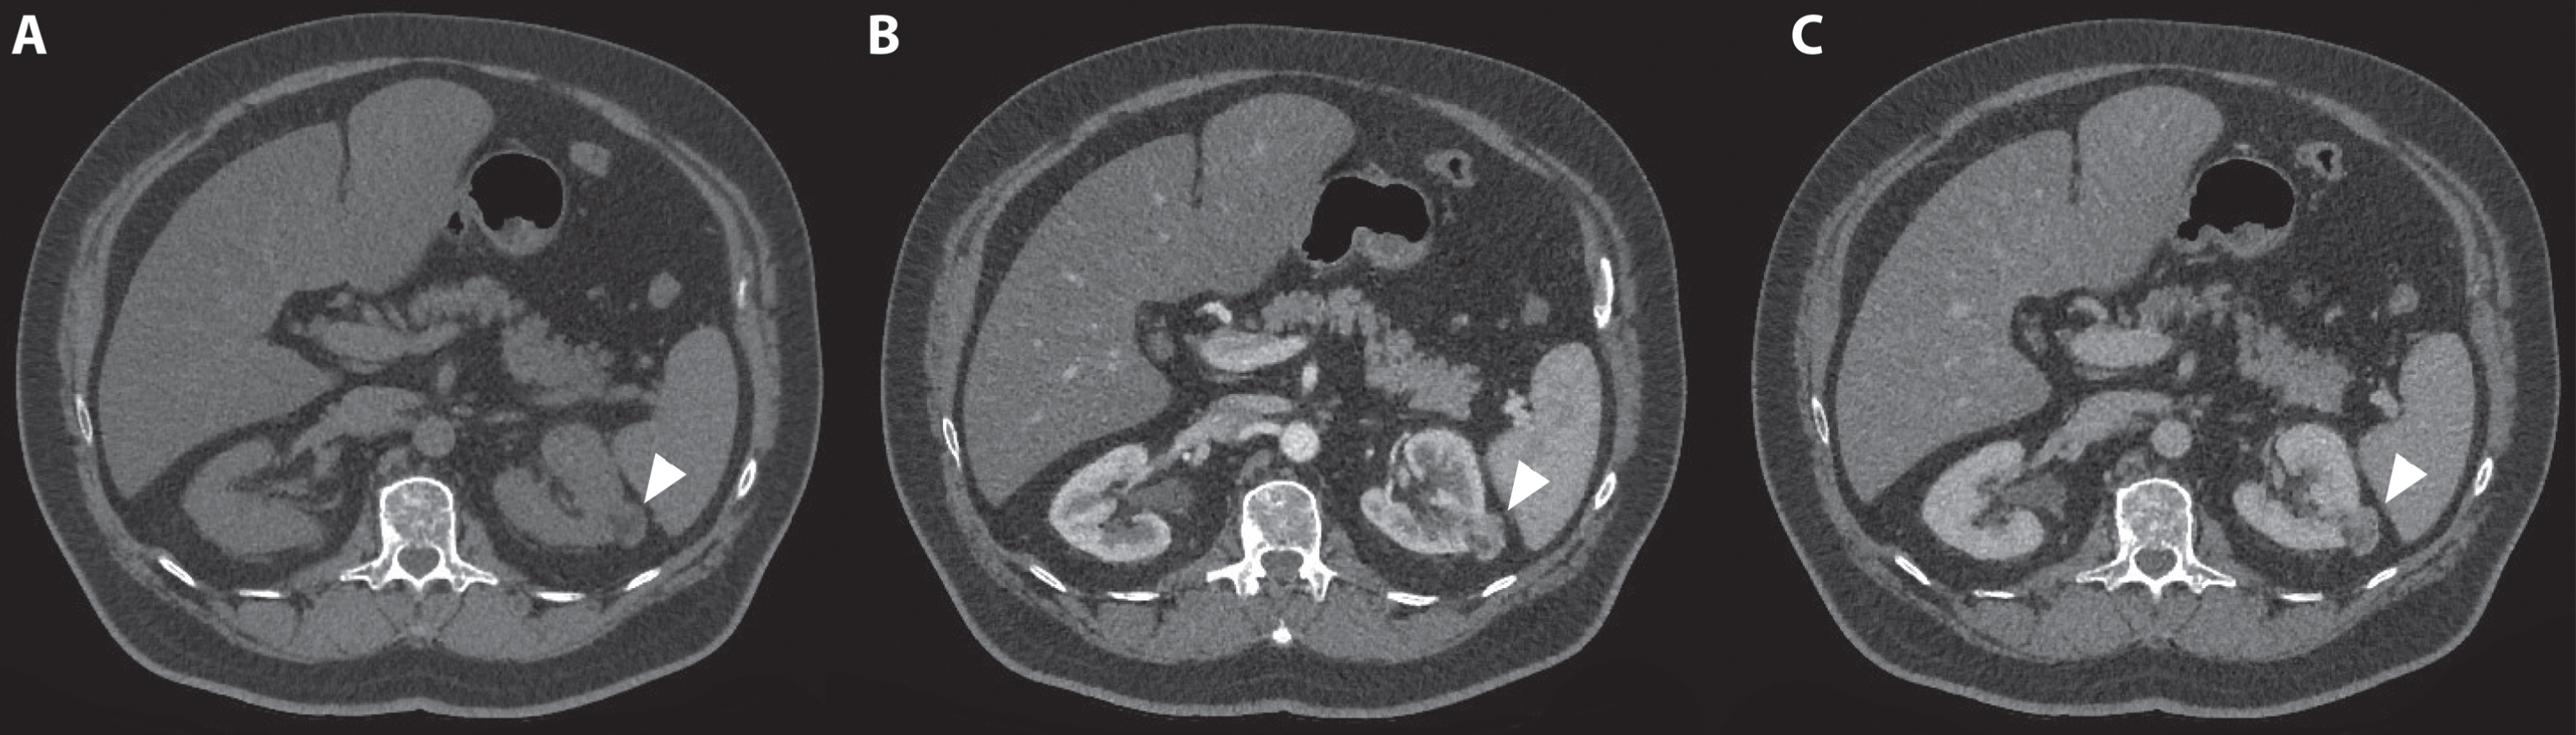
Angiomyolipoma is a typical diagnosis based on unenhanced CT findings. An attenuation of –10 HU or less is pathognomic for angiomyolipoma; however, calcifications should raise the suspicion for RCC [38] (Fig. 3). The absence of fat does not rule out the possibility of an angiomyolipoma because 5% are fat-poor/invisible angiomyolipomas [7]. A tumor that is also enhanced on contrast-enhanced CT cannot be differentiated from RCC by CT imaging alone, and additional MRI, biopsy, or surgical resection might be warranted [39, 40].
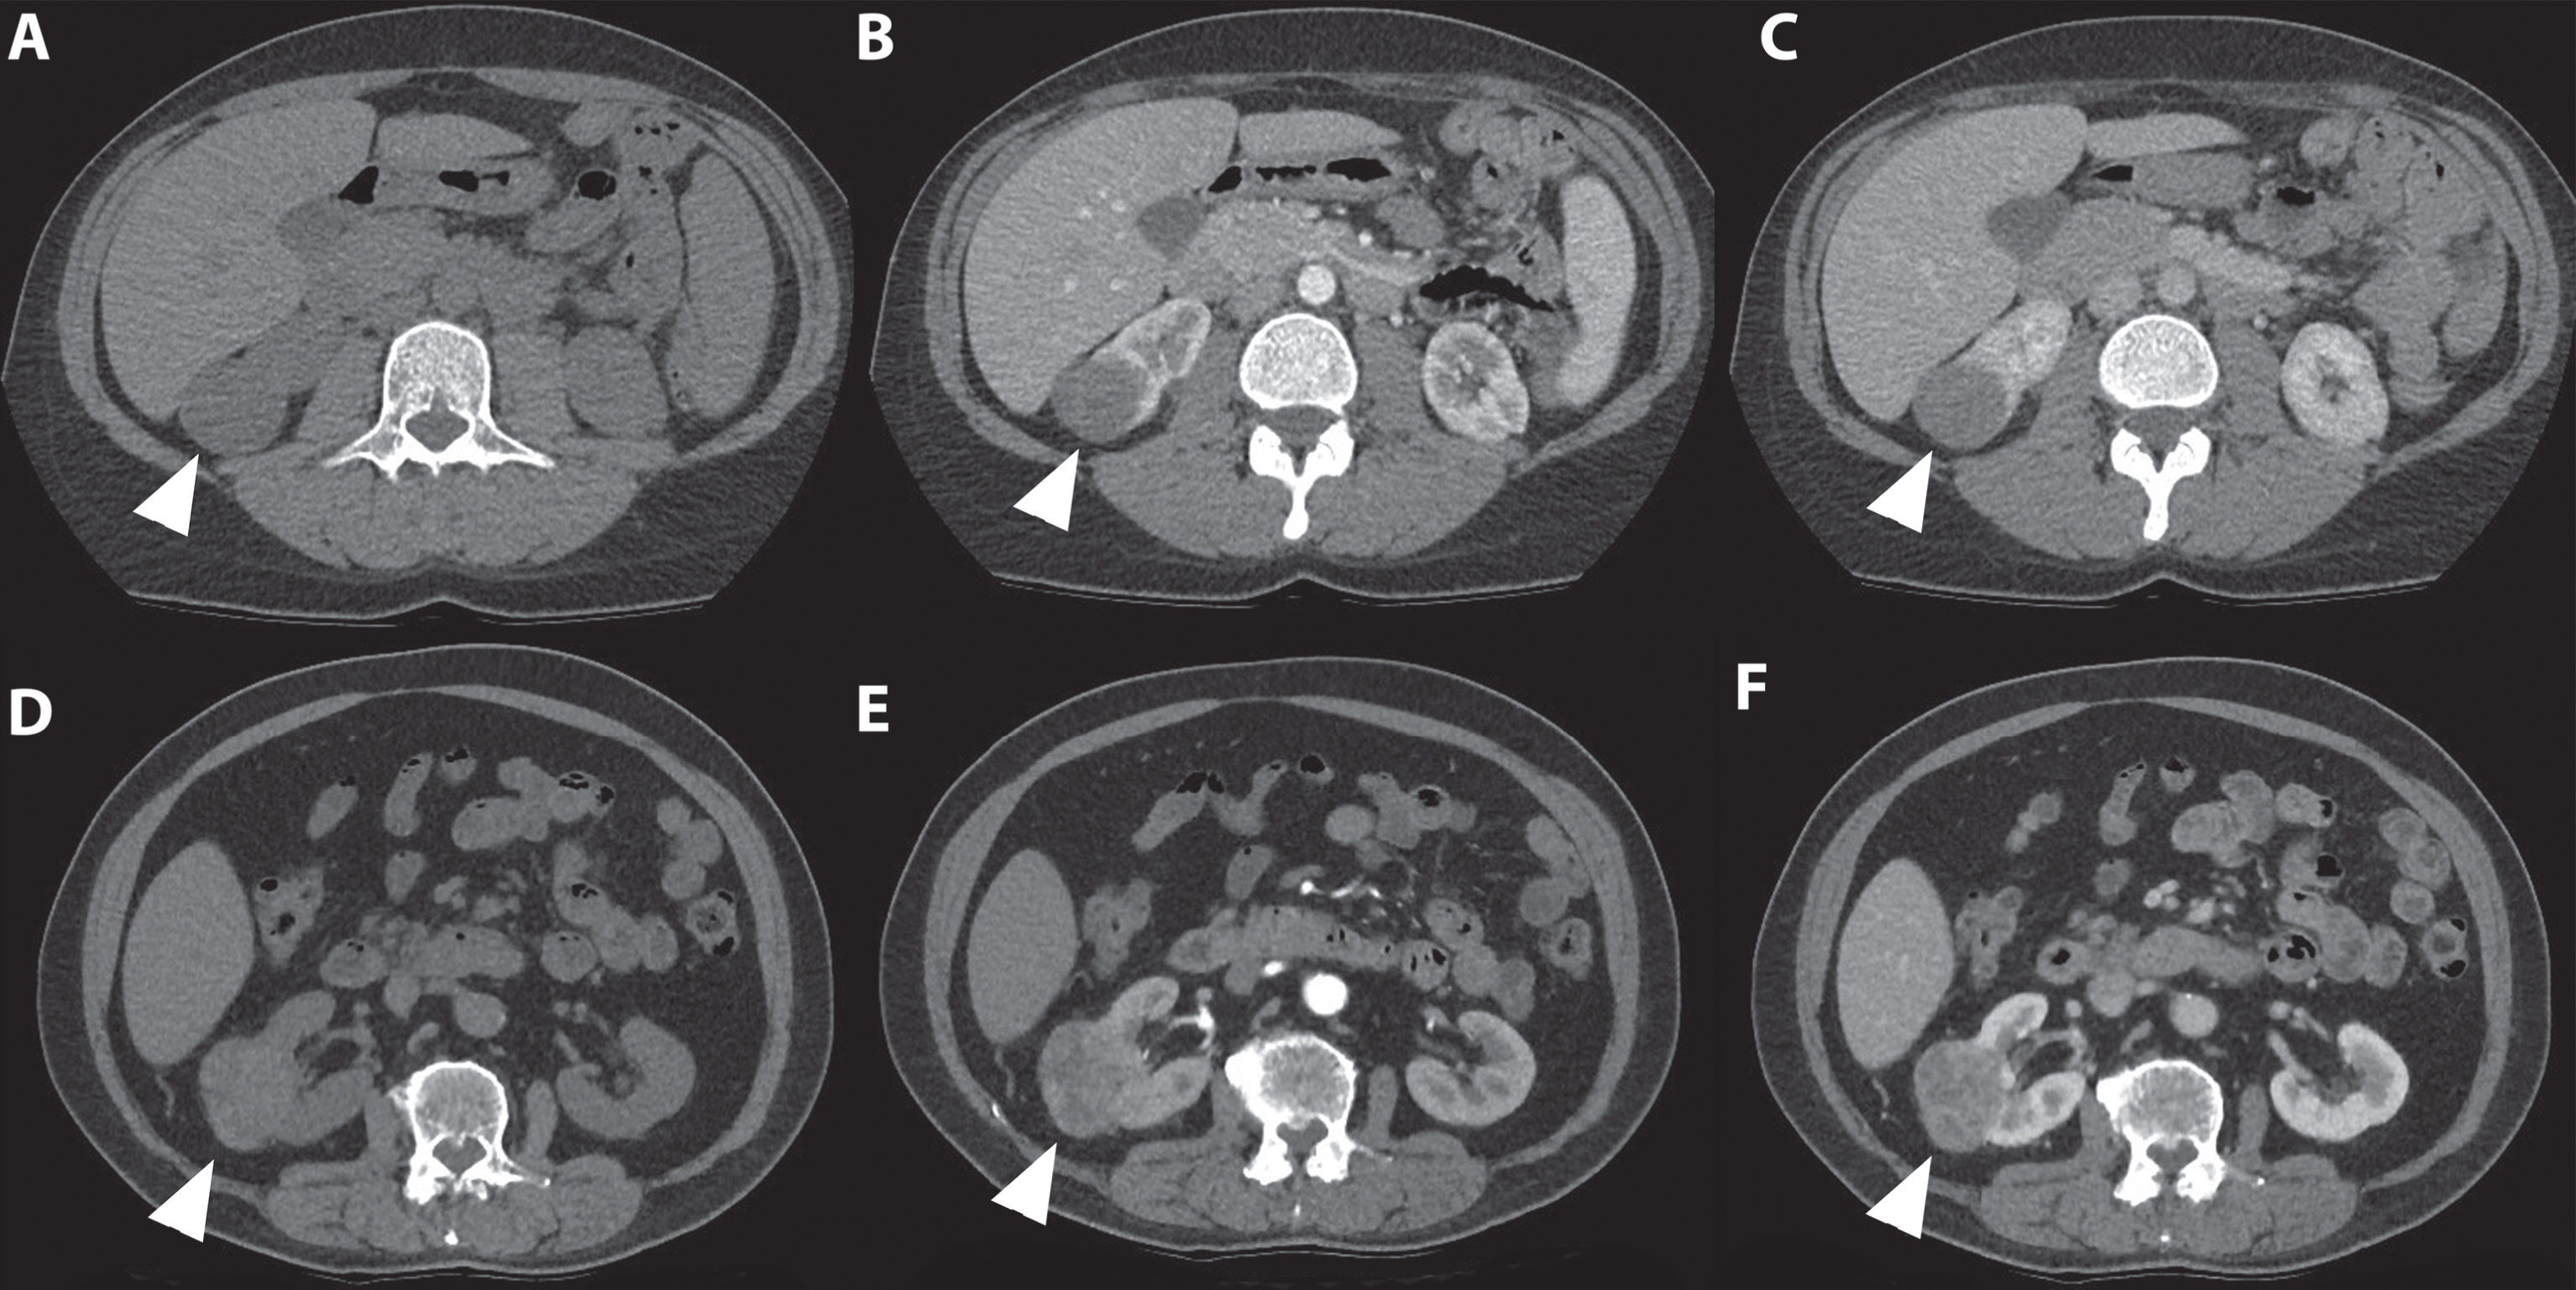
Fig. 3
A 72-year-old man was referred for an incidentaloma found on a CT scan of the thorax, which included a part of the kidneys. A 3-phase CT scan showed a 28-mm×24-mm large interpolar tumor of the left kidney (marked with white arrowhead). On unenhanced CT, the lesion had areas of fat with an attenuation of –36 Hounsfield units (HU). (A) In the corticomedullary phase, avid tumor enhancement is seen (B) with a moderate washout effect in the nephrogenic phase (C). These CT findings are consistent with an angiomyolipoma. However, fat-containing renal cell carcinoma (RCC) cannot be entirely excluded as a diagnosis, and this lesion will be monitored with imaging.
Cysts and enhancement
A homogeneous lesion with a smooth wall, no septa, no calcifications, and an attenuation between –10 and +20 HU on unenhanced CT corresponds with a simple cyst. An attenuation of >70 HU indicates a hemorrhagic cyst. In case of less attenuation (an attenuation of >20 HU may concern an RCC) causing doubt in the diagnosis, a contrast-enhanced series should be checked for tumor enhancement. A lack of enhancement confirms the lesion to be cystic [41]. After contrast administration, an enhancement of >20 HU measured in the CMP compared with the unenhanced phase marks a tumor as indeterminate and suspicious for RCC [41]. Optimal sensitivity and specificity for RCC detection are reported when a cut off value of 84 HU in the CMP and 44 in the NP are used for the tumor [42].
Clear cell RCC
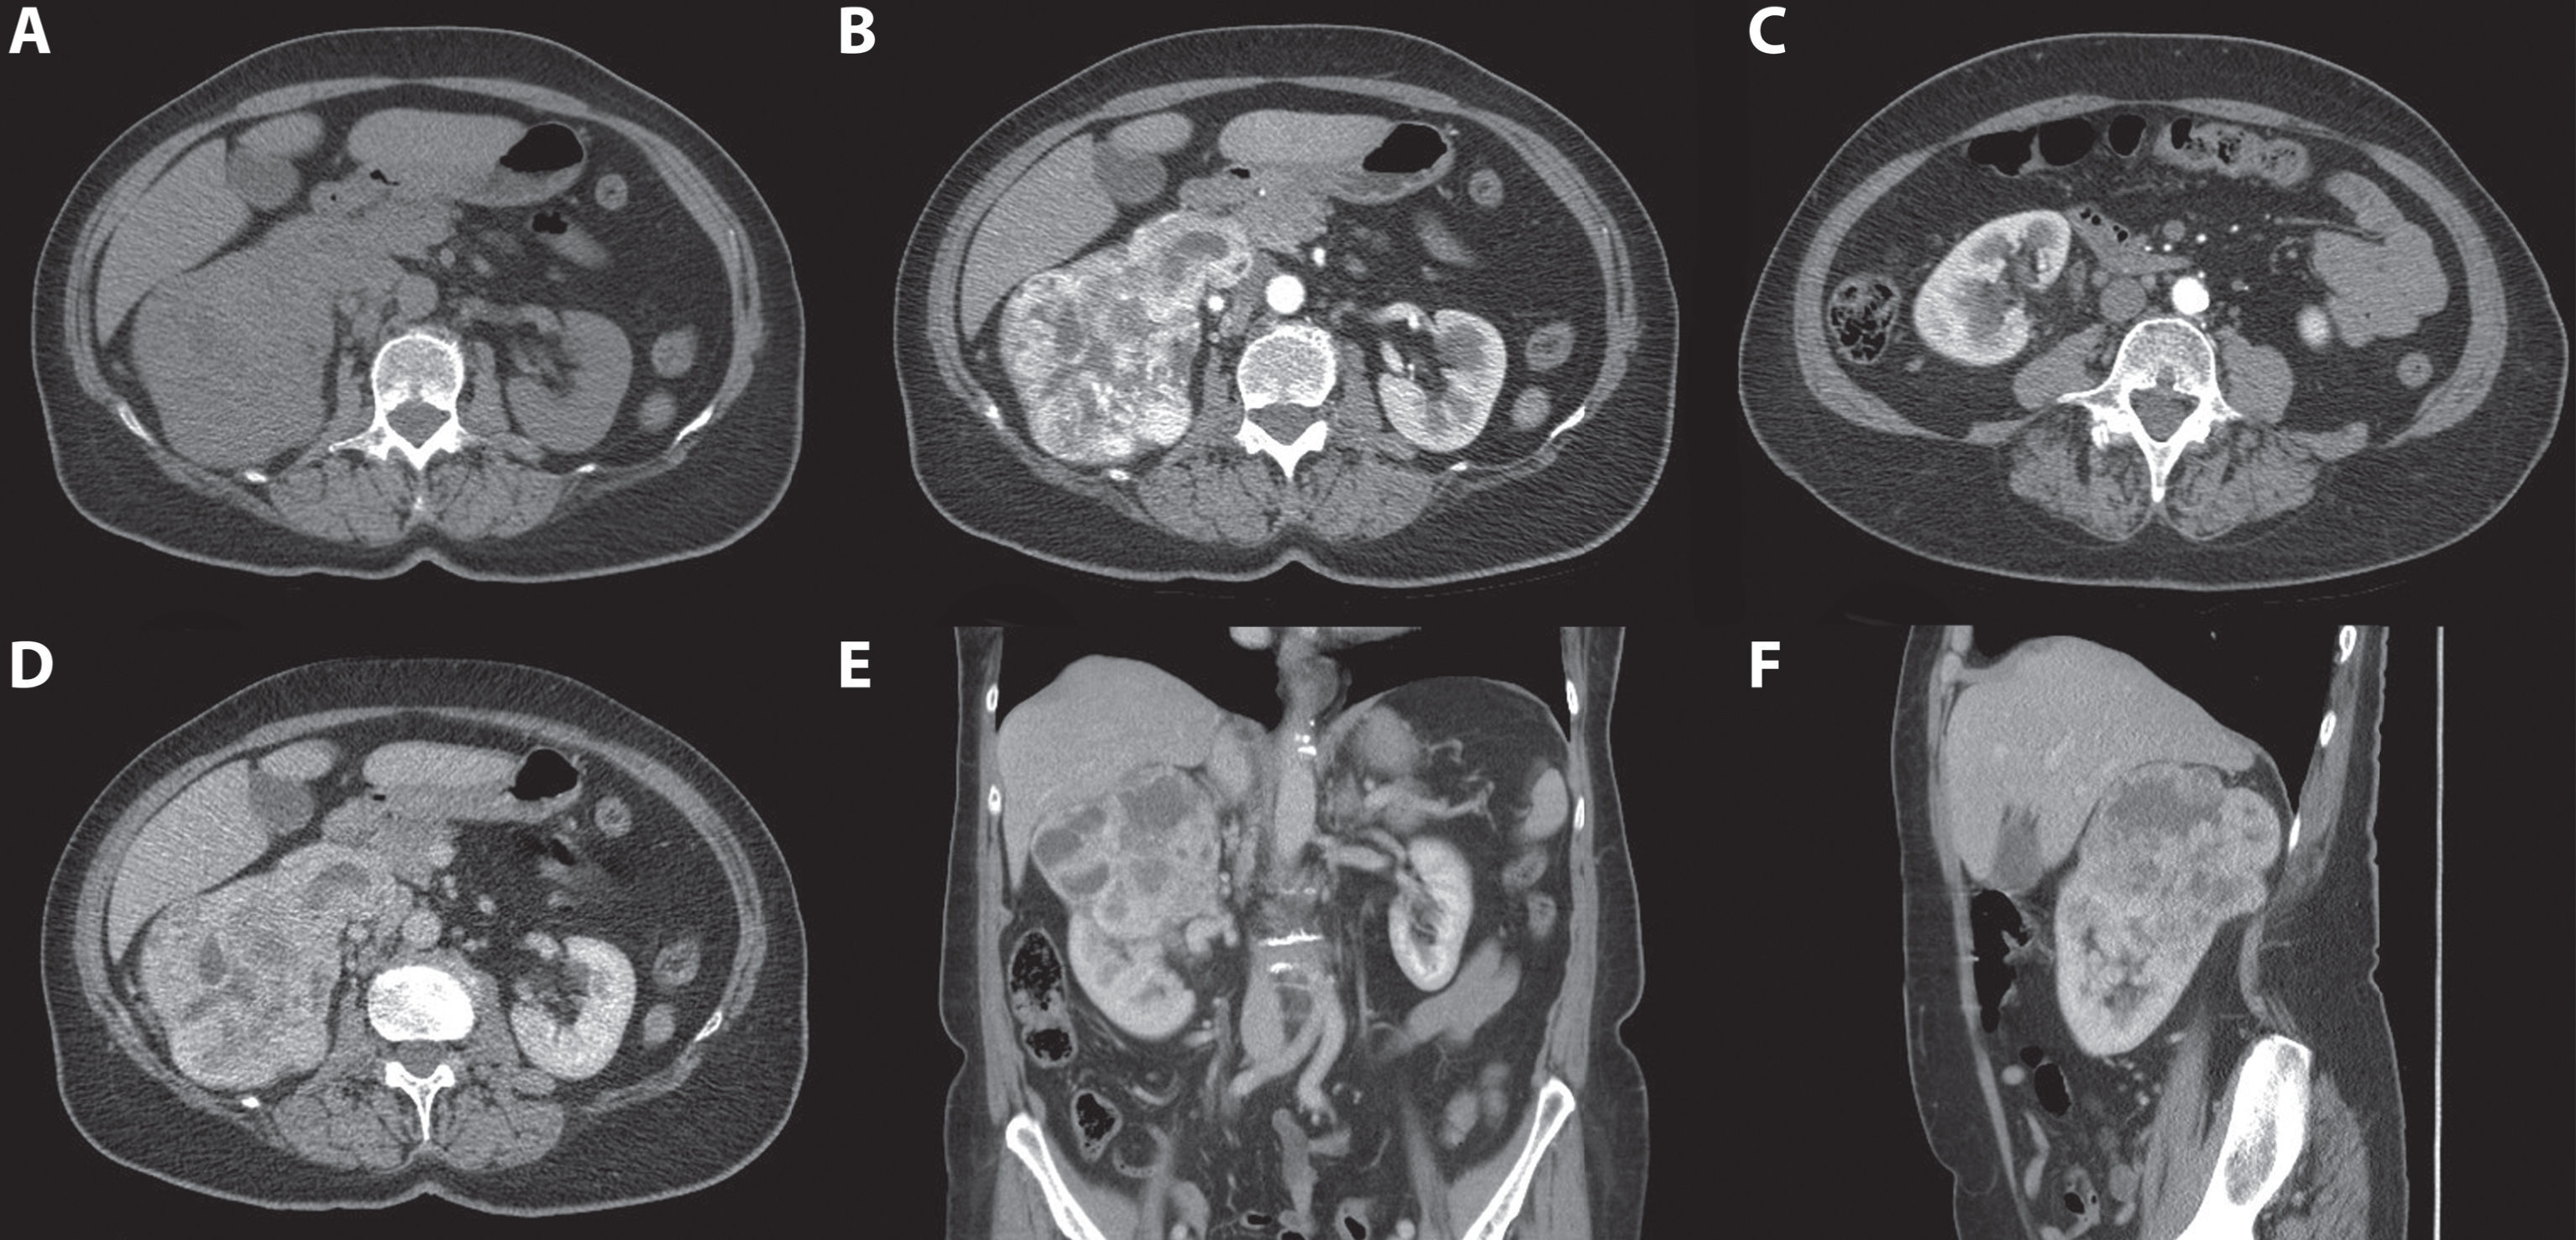
Clear cell RCC shows strong enhancement in the CMP (mean 114±44 HU) due to hypervascularization and has a wash-out effect during the NP (mean 66±24 HU) [42] (Fig. 4). Larger ccRCCs have a typical heterogeneous aspect due to necrosis, hemorrhage, and cystic parts [43]. After the CMP, the NP can aid additional diagnostic information, because in this phase, the renal parenchyma enhances more homogeneously and intensely than renal tumors due to tumor wash out. This especially contributes to the detection of smaller tumors [36, 37].
Fig. 4
A 70-year-old women was evaluated for flank pain and hematuria. A screening ultrasound showed a hypervascular and hyperechoic renal mass of the right kidney. A 3-phase CT scan showed a tumor originating from the upper pole of the right kidney which measured approximately 124 mm×77 mm×95 mm. During the non-contrast phase the tumor showed a heterogeneous aspect with mixed attenuation consistent with parts of central tumor necrosis. (A) Strong enhancement of the solid parts is seen in the corticomedullary phase. (B) The lower pole of the right kidney was unaffected. (C) In the nephrogenic phase, a clear washout effect is seen. (D) Coronal (E) and saggital (F) reconstructions in the nephrogenic phase confirm the tumor to be located mainly in the upper pole with growth toward the liver and centrally towards the renal hilum. Histopathology after open radical nephrectomy confirmed the diagnosis of a 120 mm large, Furhman grade 3, clear cell renal cell carcinoma.
Papillary RCC
Papillary RCC can have a heterogeneous presentation just like ccRCC, but smaller tumors are usually more homogenous and hypovascular. Therefore, the contrast enhancement is usually more subtle compared with ccRCC and is measured up to 20 HU in the CMP compared with the unenhanced phase [43] (Fig. 5). No enhancement is seen in up to 25% of the pRCCs [44]. The wash-out effect is also not as distinct as in ccRCC. Because enhancement up to 20 HU can be mistaken with pseudo-enhancement most commonly seen in endophytic cysts, further characterization with CEUS or MRI is advised [41].
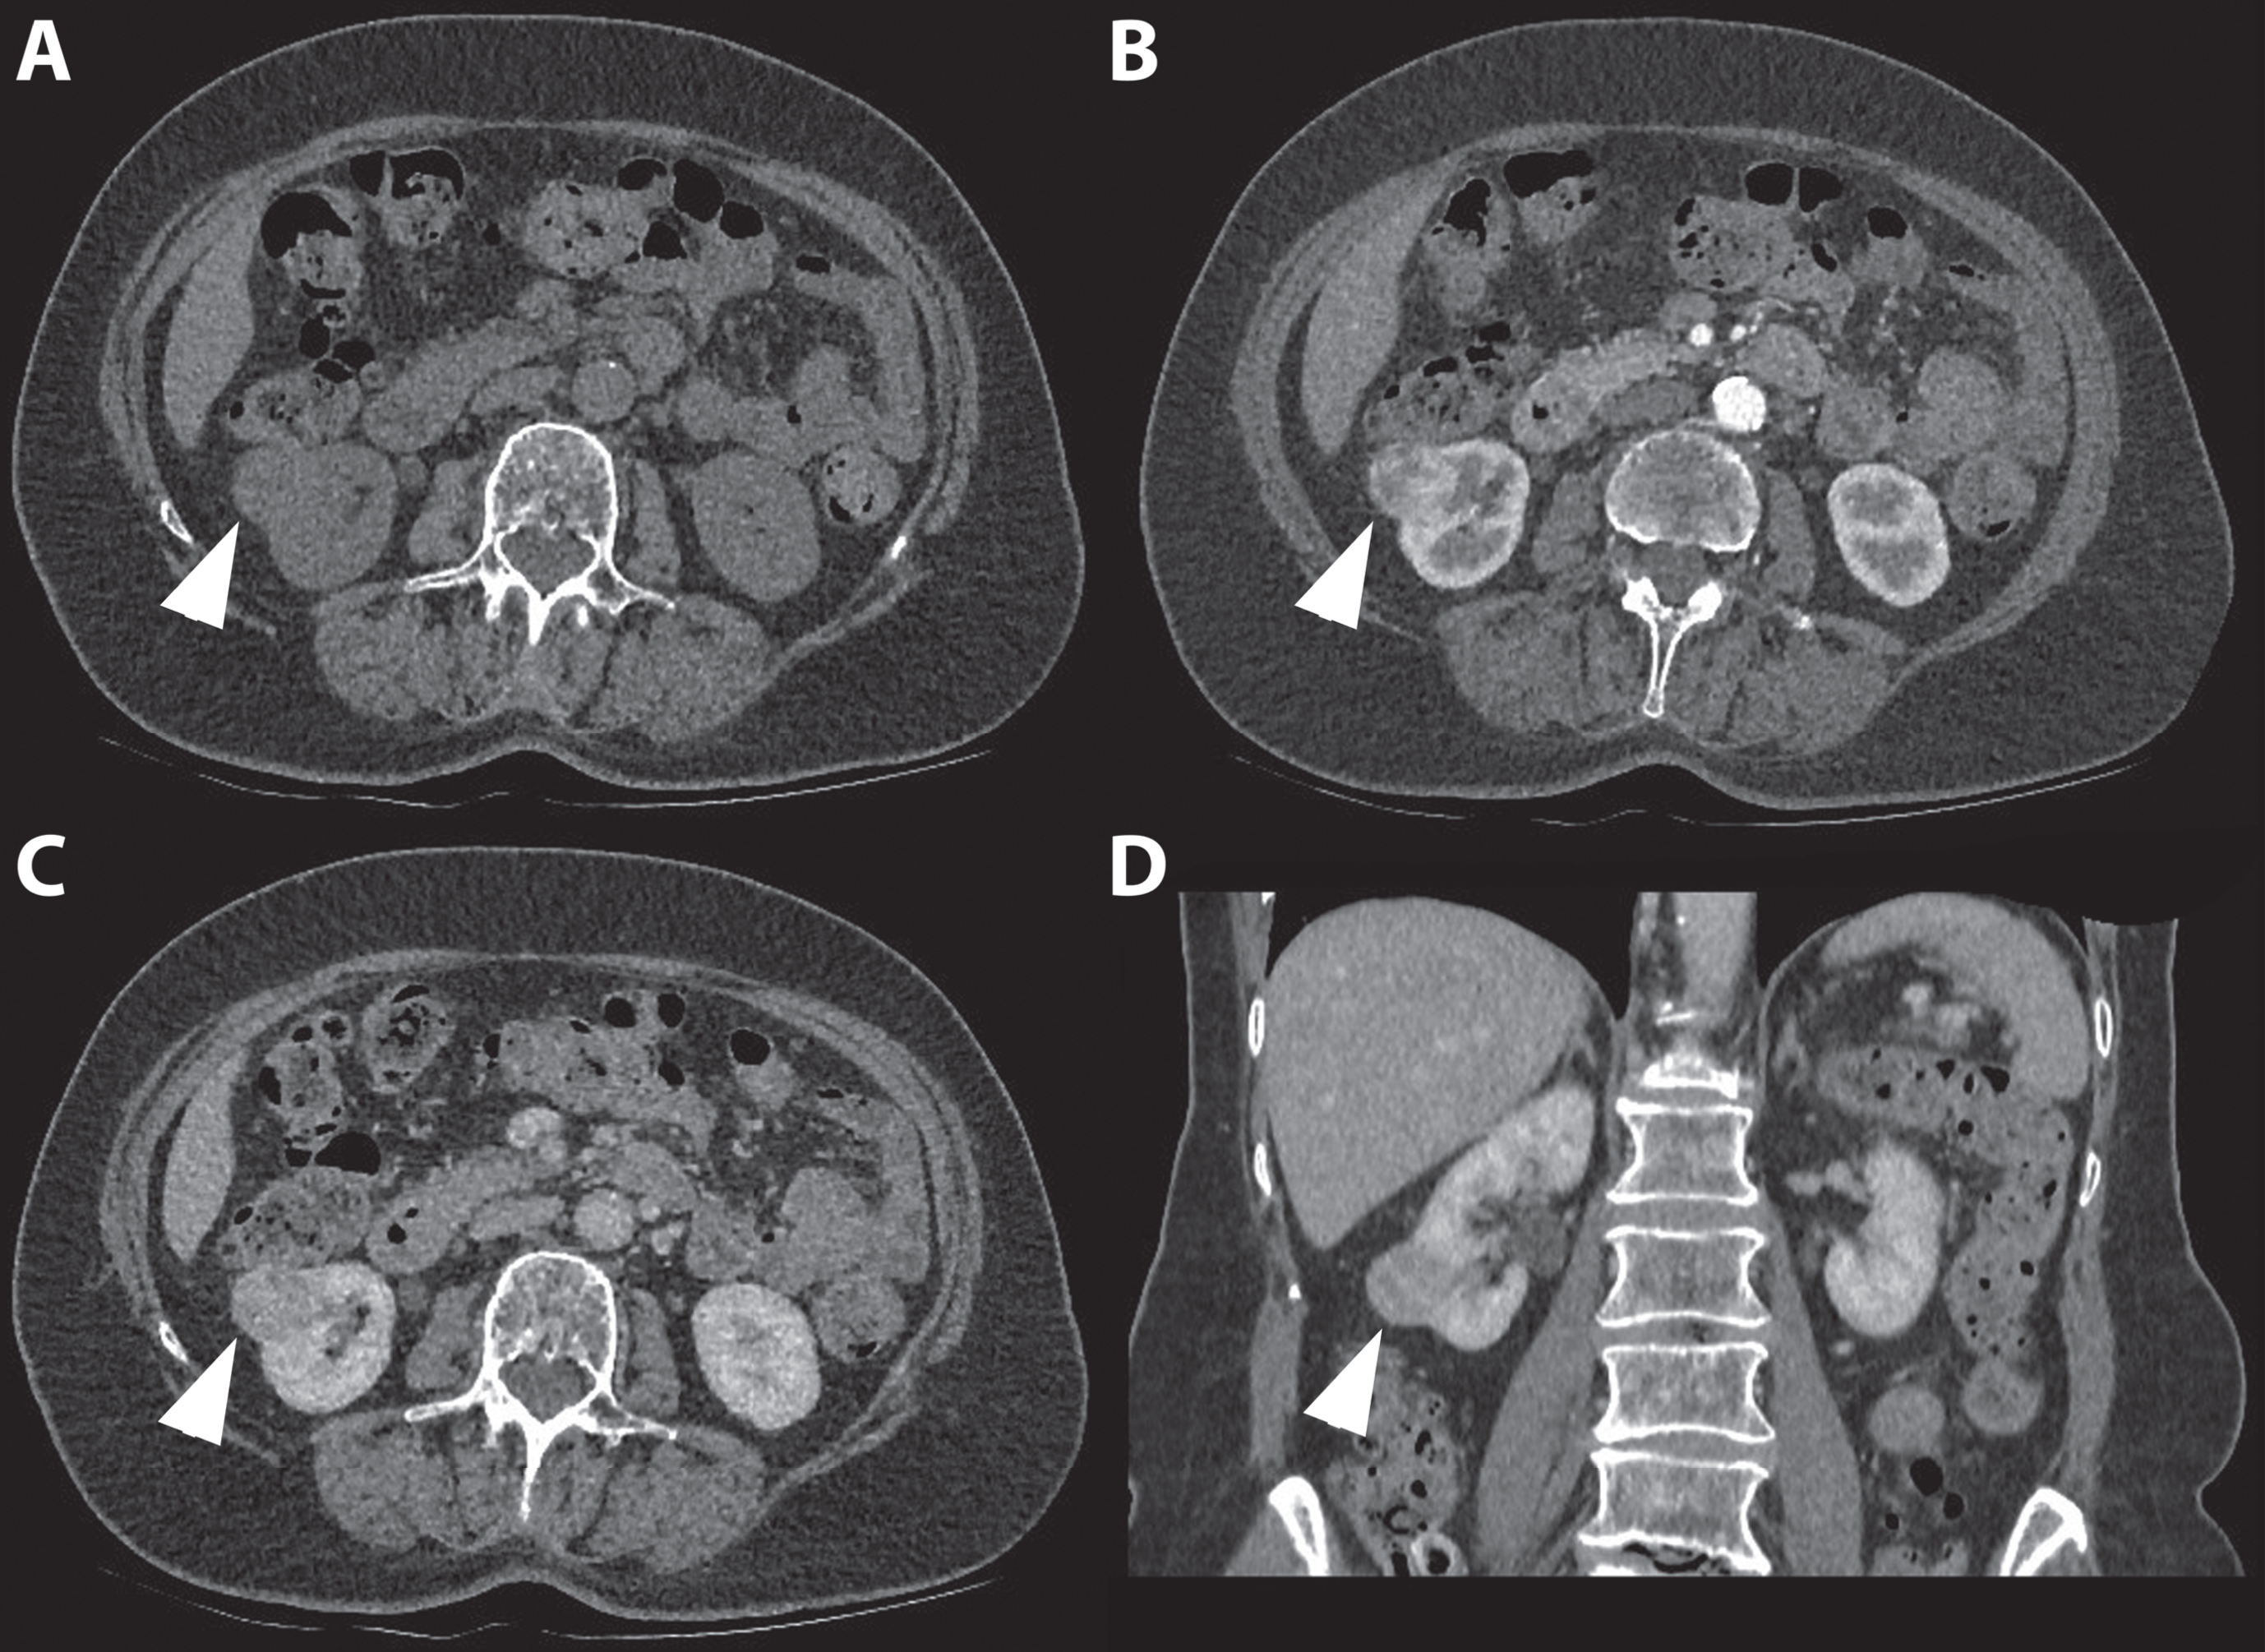
Fig. 5
In this figure the difference in appearance and enhancing pattern of clear cell and papillary renal cell carcinoma are shown. The first case (A-C) concerns a 41-year-old women referred for analysis of an incidentaloma of the right kidney detected on ultrasound. A 3-phase CT scan showed a 36-mm large tumor of the lower pole of the right kidney with a typical gradual enhancement pattern with, as opposed to the clear cell RCC case, no washout in the nephrogenic phase. On unenhanced CT, the tumor appears homogeneous and the Hounsfield unit value of the tumor was 31. (A) The corticomedullary (B) and nephrogenic phase (C) showed homogeneous enhancement of the tumor with Hounsfield unit values of 31 and 68, respectively. Histopathology after robot-assisted partial nephrectomy confirmed the diagnosis of a 38-mm large, Furhman grade 4 papillary renal cell carcinoma. The second case (D-F) concerns a 67-year-old man in whom an incidentaloma in the right kidney was found on MRI of the spinal canal. The tumor was evaluated through a CT scan which showed a 67 mm large, interpolar tumor of the right kidney. The non-contrast phase showed a heterogeneous aspect with mixed attenuation (A), in the corticomedullary phase strong enhancement of the solid parts is seen (B) with subsequent washout in the nephrogenic phase (C). The latter is best seen when comparing the enhancement with the renal cortex.
Chromophobe RCC and oncocytoma
As a result of comparable presentation on unenhanced CT varying from more homogeneous to heterogeneous and a comparable enhancement pattern, chrRCC and oncocytoma cannot be differentiated from ccRCC based on CT findings [45] (Fig. 6).
Fig. 6
An 80-year-old women was referred for an incidentaloma of the right kidney detected on ultrasound. A 3 phase CT scan showed an isoattenuating, exophytic growing renal tumor of the right lower pole on the non-contrast phase. (A) An inhomogeneous avid enhancement pattern is seen in the corticomedullary phase (B) followed by wash out during the nephrogenic phase (C and D). The patient was treated with percutaneous image-guided cryoablation. Intraoperative biopsy specimens showed an oncocytoma.
Accuracy
The sensitivity and specificity for prediction of RCC in case of a renal tumor from CT findings has been described as 60% to 79% and 44% to 100%, respectively [35, 42]. Although these findings may be influenced by tumor size, because a 1 cm increase in tumor size is associated with a 16% increase in the odd of malignancy [46]. In conclusion, only the diagnosis of angiomyolipoma can be made base based on CT alone. Although larger tumors can usually be identified as ccRCC and, when appearing as typical lesions, pRCC may be differentiated from ccRCC, a biopsy or surgical treatment is warranted for renal tumors suggestive for RCC on CT.
New techniques
Several new CT techniques have been used to characterize renal malignancies. Contrast-enhanced dual-energy CT, in which 2 CT data sets are acquired with different x-ray spectra allowing the differentiation of the 2 materials, showed improved specificity for characterization of small renal tumors compared with conventional CT imaging [47–49]. However, this technique is not widely available.
CT perfusion is a novel technique that allows quantitative evaluation of tissue perfusion using contrast-enhanced scans. This technique showed promising preliminary results in the differentiation of RCC subtypes and oncocytoma. One study found sensitivity and specificity were 100% and 66.7% for perfusion CT compared with 93% and 50% for multiphase CT [50, 51].
MAGNETIC RESONANCE IMAGING
MRI is often used as a tool for characterization of indeterminate renal tumors on US and CT, mainly concerning lesions suspected to be angiomyolipoma or moderate to non-enhancing tumors suspected for pRCC. MRI is also often used in patient in whom contrast CT is contraindicated because of impaired renal function [52]. MRI has several advantages over CT, including no exposure to radiation and a superior soft-tissue contrast, and may be a feasible initial imaging option for characterization of renal tumors. Limitations in the use of MRI are a long acquisition time and incompatibility with metallic implants such as pacemakers. The latter concern, however, seems to be overestimated based on most recent literature [53]. In most clinics, MRI availability is also a limiting factor compared with CT.
Scanning protocol
Multiparametric MRI (mpMRI) protocols for dedicated renal imaging include dynamic contrast-enhanced (DCE) and diffusion-weighted (DW) sequences as a supplement to T1- and T2-weighted anatomical imaging [54]. The mpMRI protocol in our institution consists of anatomical T1-weighted VIBE (volumetric interpolated breath-hold examination), with and without fat suppression and before and after administration of gadolinium-based contrast agent, and T2-weighted fat suppressed HASTE (Half-Fourier-Acquired Single-shot Turbo spin Echo) sequences. Additional chemical shift imaging (in-phase and opposed-phase) to detect microscopic fat is performed. Subsequent DWI sequences and DCE T1-weighted CMP, NP, and excretory phase are acquired. For DWI we use b-values of 50, 400, and 800 s/mm2, but there is no general consensus on which values to use [55]. Field strengths of 1.5 and 3T are most commonly used.
Tumor detection
Previous studies comparing CT and MRI suggested comparable capabilities for detecting renal tumors requiring surgery [56]. However, for tumors sized ≤20 mm in diameter, gadolinium-enhanced sequences with fat saturation have been shown to be more sensitive than contrast-enhanced CT [57].
Differentiation of subtypes
Clear cell RCC
On T1-weighted MRI, ccRCC is isointense compared with surrounding renal parenchyma [58]. On T2-weighted imaging, ccRCC is hyperintense, but a heterogeneous signal intensity can be present in large tumors in with necrosis and hemorrhage [59] Necrosis appears homogeneous hypointense on T1-weighted imaging and moderate to hyperintense on T2-weighted imaging [54] (Fig. 7). In 60% of ccRCCs, microscopic fat is present and can be seen as a drop in signal intensity on opposed-phase chemical shift images compared with in-phase imaging [54]. Because ccRCCs are hypervascular tumors, a heterogeneous enhancement is seen after contrast administration that causes a greater change in signal intensity compared with pRCC or chrRCC in the CMP [60] (Fig. 7). Whether ccRCC and non-ccRCC subtypes can be differentiated by apparent diffusion coefficient (ADC) values obtained with DW imaging is unclear due to conflicting results in the literature. Several studies have shown that decreasing ADC values are found with increasing Fuhrman grade. This may be helpful in detecting high-grade ccRCCs [54, 61].
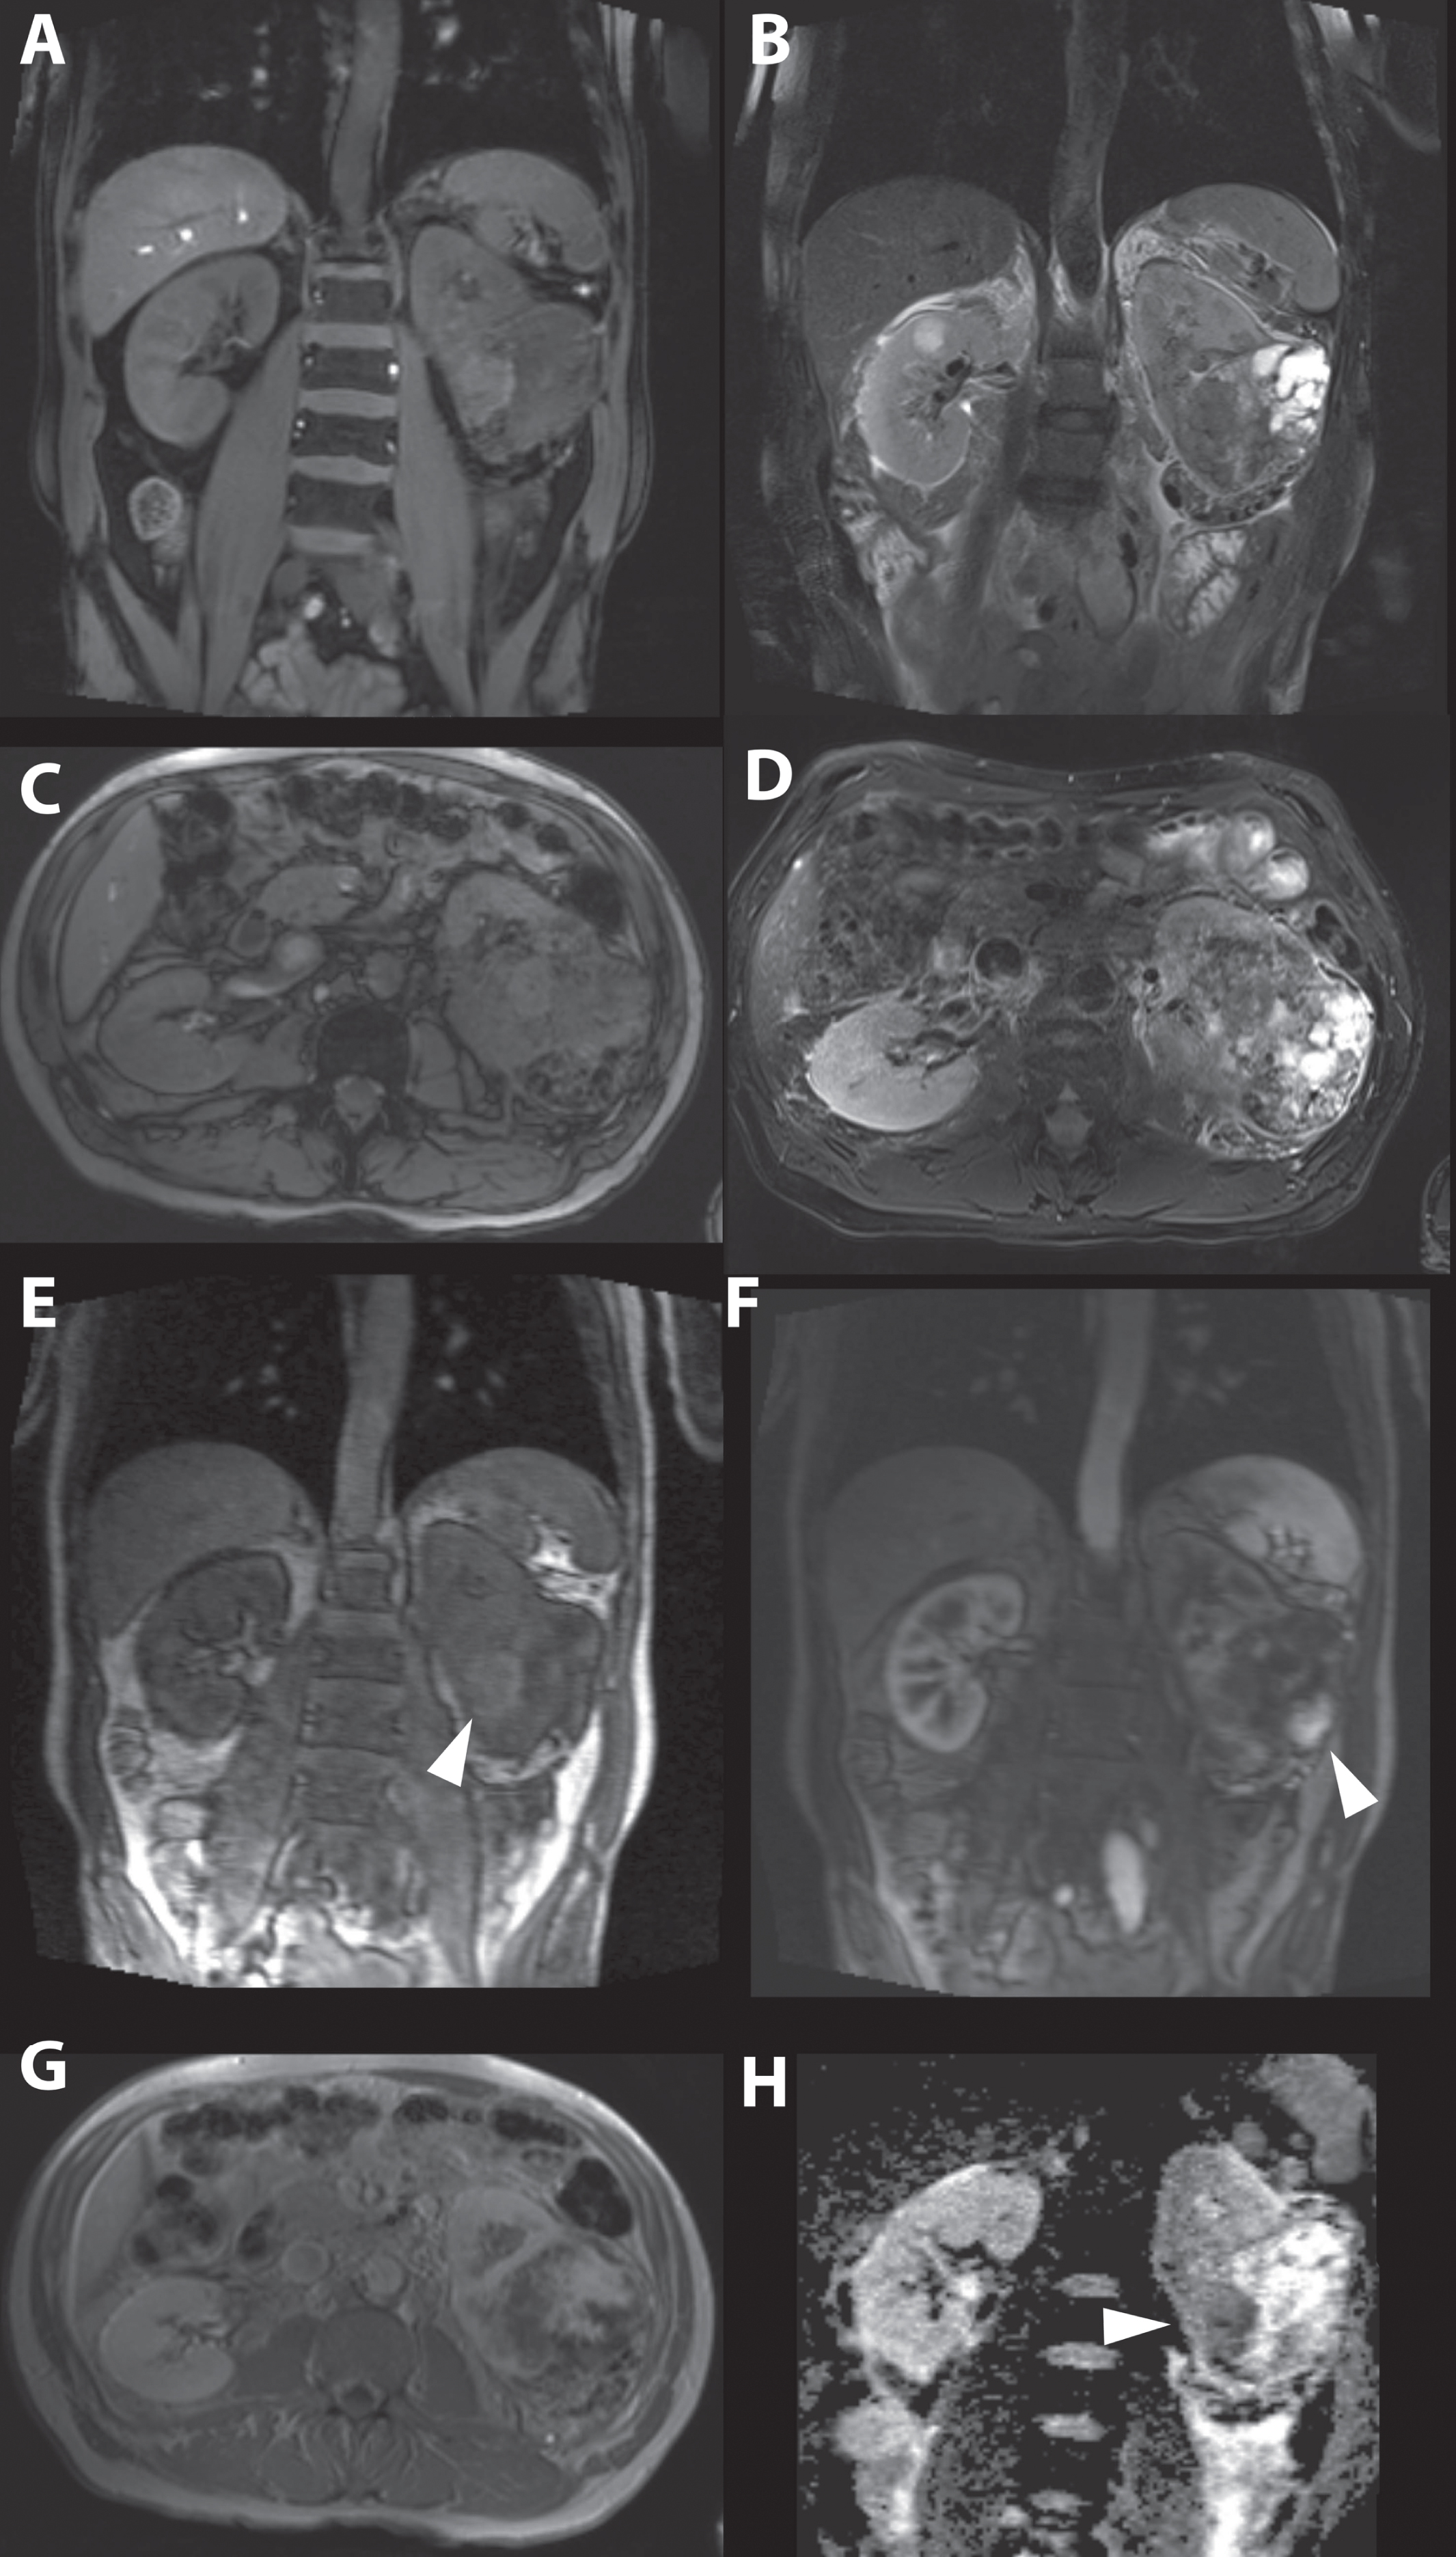
Fig. 7
A 63-year-old women was referred for a renal mass detected during analysis of hematuria. Magnetic resonance imaging showed a generally isointense tumor on T1-weighted imaging (A and C), and heterogeneous mainly hypertintense signal intensity on T2-weighted imaging (B and D) consisting of a mixture of tumor and cystic areas and areas with necrosis. Early enhancement is seen in solid parts of the tumor more centrally located. (E) In a later phase the solid parts in the peripheral tumor also enhanced strongly. (F and G). The apparent diffusion coefficient (ADC) map showed diffusion restriction mainly in the more central and solid part of the tumor (H). Consistent with the highly suggestive findings of the MRI, pathology report after open radical nephrectomy showed a 90 mm large Furhman grade III, clear cell renal cell carcinoma.
Papillary RCC
Compared with ccRCC, pRCC is well circumscribed and appears more homogeneous, although larger tumors may be more heterogeneous because of hemorrhage or necrosis [4]. The tumors demonstrate low signal intensity on T2-weighted imaging, which corresponds with a predominant papillary architecture at pathology. Compared with ccRCC, a less avid and slower enhancement pattern is seen because pRCC is hypovascular [59, 62] (Fig. 8). From the enhancement pattern, pRCC can be differentiated from ccRCC with 93% sensitivity and 96% specificity [60]. ADC values are described to be higher compared with ccRCC [63]. Based on MR imaging findings, type 1 and 2 pRCCs cannot be differentiated [44].
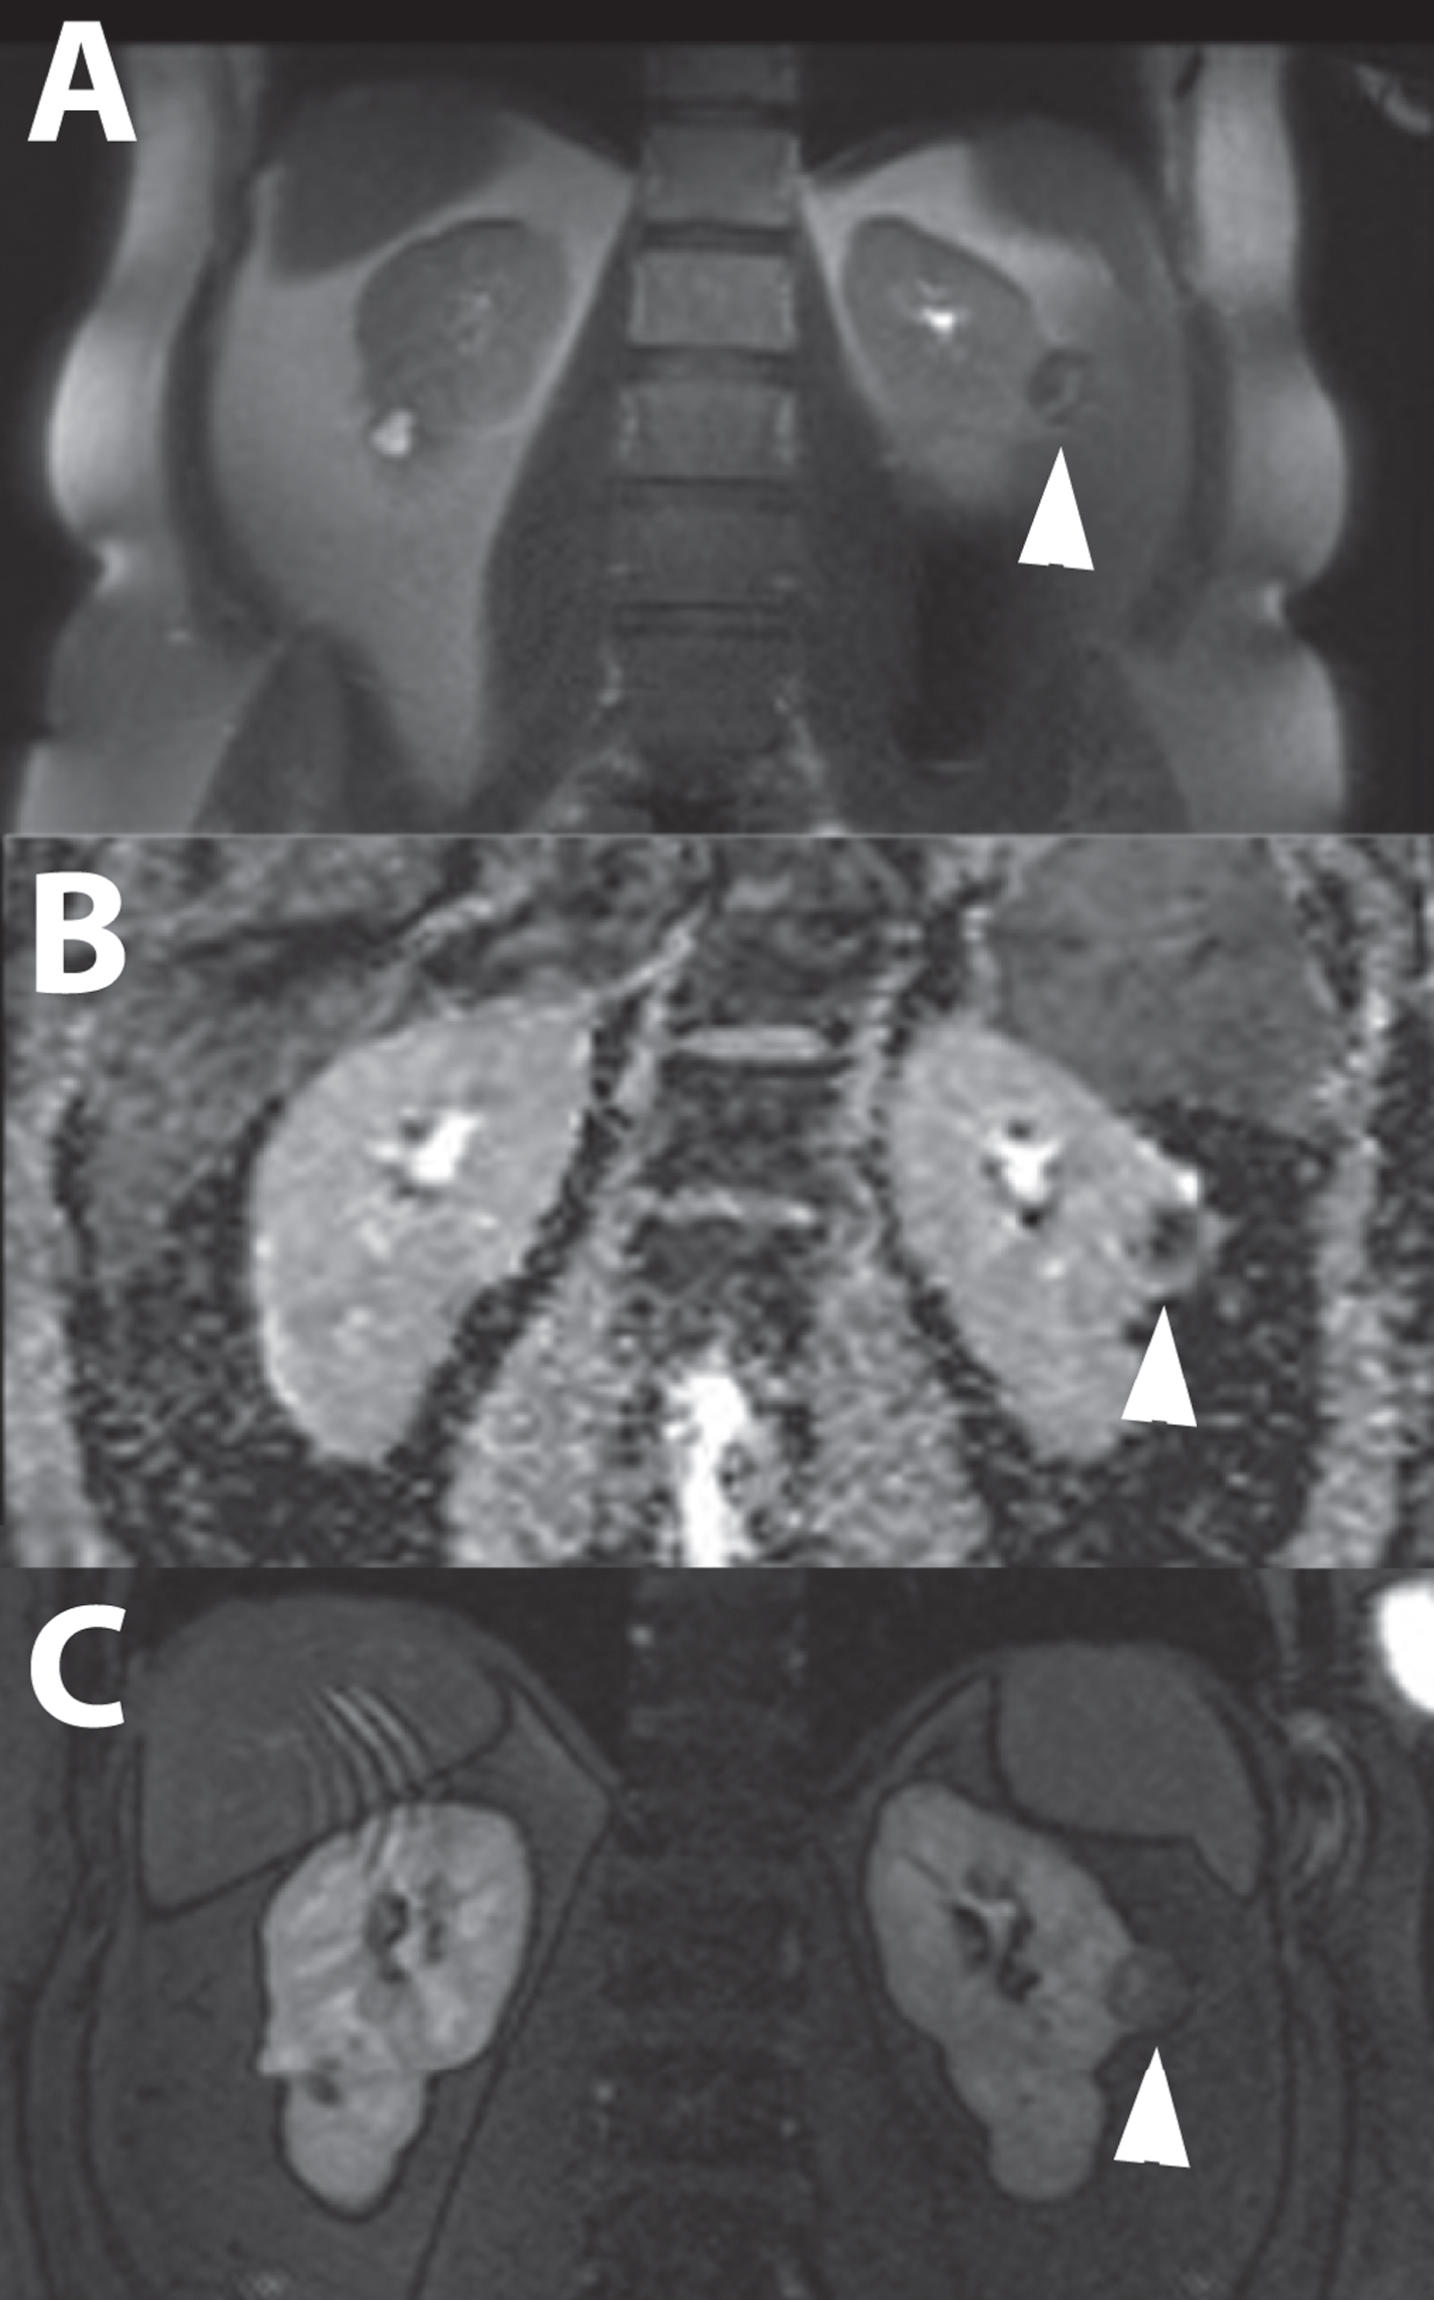
Fig. 8
A 49-year-old women was referred for work-up of an incidentaloma of the left kidney found on ultrasound that was performed for progressive renal function impairment. T2-weighted fat suppressed magnetic resonance images acquired in the coronal plane showed an inhomogeneous renal tumor (marked with white arrow head) with predominantly low signal intensities. (A) The apparent diffusion coefficient map calculated from diffusion-weighted sequences using b-values of 50, 400, and 800 showed mild diffusion restriction. (B) The enhancement pattern was very slow, with only mild enhancement 120 seconds after administration of gadolinium-based contrast agent. (C) The patient was treated with percutaneous image-guided cryoablation. Biopsy specimens taken during the procedure showed a type 2 papillary renal cell carcinoma.
Chromophobe RCC
Central necrosis is an uncommon finding in chrRCC; thus, it appears well circumscribed and homogeneous on MRI. T2-weighted imaging shows intermediate to low signal intensity [64]. The enhancement pattern of chrRCC is more avid than in pRCC and less avid compared with ccRCC [65]. ADC values cannot be used to differentiate chrRCC from ccRCC or pRCC. Overall, the differentiation of chrRCC based on MRI remains challenging due to its overlap with other subtypes.
Angiomyolipoma
As a results of the fatty content of angiomyolipoma, the classic angiomyolipoma signal intensity is high on T1-weighted and low on fat-suppressed MRI sequences. T2-weighted images show signal intensities dependent on the amount of fat. With low fat content, the tumor appears hypointense. With increasing fat content, the signal intensity on T2-weighted images rises [54]. A low-signal intensity rim at the interface between an angiomyolipoma and the renal parenchyma can be seen when opposed-phase MRI is used. This is caused by the presence of fat and water protons within the same imaging voxel resulting in signal loss and is called the “India ink artifact” (chemical shift artifact) and is typical for angiomyolipoma [66]. The classic angiomyolipoma enhances quickly with a fast wash out effect [67].
It is the fat-poor angiomyolipoma that poses a challenge to differentiate from RCC. The low fat content and similarity to smooth muscle on MRI cause it to appear hypointense on T1- and T2-weighted imaging. Fat-poor angiomyolipoma shows an early homogeneous enhancement pattern with rapid wash out. No signal loss on fat suppression is seen, and no chemical shift artifacts are expected [68, 69]. Although being T2 hypointense may mimic a pRCC, the specificity and accuracy for discriminating angiomyolipoma from RCC using T2 hypointensity combined with the enhancement pattern has been described as 99% and 96%, respectively [70]. However, in case of the aforementioned findings, a subsequent biopsy to confirm the diagnosis is advised [7, 39]. DW MRI showed the ability to differentiate ccRCC and fat-poor angiomyolipoma, with the latter having the lowest ADC values [40, 71]. However, lower ADC values are not pathognomic for angiomyolipoma.
Oncocytoma
The imaging characteristics of oncocytoma are variable and overlap greatly with RCC, especially with those of chrRCC, making their identification cumbersome. They appear as well-circumscribed lesions with a low signal intensity on T1-weighted imaging and high and heterogeneous signal intensity on T2-weighted imaging [54]. A central scar appears in about 50% to 60%, but is not a specific finding for oncocytoma. The tumors are hypovascular and show less contrast enhancement in all phases compared with the renal cortex [64]. Although conflicting results have been reported, a meta-analysis showed that differentiation of oncocytoma from RCC based on ADC values is feasible [55, 63]. However, great heterogeneity exists in the scanning protocols and b-values, making these results hard to reproduce.
New techniques
A drawback in the use of renal DW MRI is that it detects motion of water along 3 axes. Because the main function of the kidney is to transport water and anatomically the transport routes, such as tubules, are organized in a radial fashion, the diffusion properties are anisotropic. Diffusion tensor imaging aims to overcome this issue by featuring diffusion measurement along at least 6 directions, enabling calculation of the full diffusion tensor and thereby the main diffusion direction [72]. Diffusion tensor imaging has shown promising result in the assessment of ccRCC [73]. ADC values obtained from DW MRI techniques not only reflect diffusion characteristics based on tissue cellularity but are also a combined effect of diffusion, capillary perfusion, and renal fluid flows [74]. The effect of the latter two are referred to as intravoxel incoherent motion effects. The use of intravoxel incoherent motion can reduce these effects in the analysis and may provide a more accurate assessment of the histologic features of renal tumors [75, 76].
The third novel technique to be assessed in analysis of renal tumors is arterial spin labeling, a completely non-invasive quantitative tissue perfusion technique [77]. This technique showed the ability to distinguish RCC subtypes by perfusion level, and RCC could also be separated from oncocytoma. A possible limitation to this technique is the lower sensitivity for detection of pRCC due to lower perfusion levels [78].
NUCLEAR IMAGING
Positron emission tomography
The use of (18)F-fluorodeoxyglucose positron emission tomography(PET)/CT is not recommended as a primary diagnostic imaging modality for RCC due to low sensitivity (62%) and specificity for detection and characterization [28].
Immuno-imaging using Girentuximab
Girentuximab is a molecular antibody recognizing carbonic anhydrase IX (CAIX), a specific antibody present in 94% of ccRCCs [79, 80]. Single-photon emission computed tomography-CT (SPECT-CT) using indium-111-labeled-girentuximab as a tracer is a feasible diagnostic tool for ccRCC, with a positive and negative predictive value of 94% and 100%, respectively [81] (Fig. 9). These findings were concordant with another study that used iodine-124-labeled girentuximab PET-CT [82]. This latter imaging modality showed a sensitivity and specificity of 86%, both in a larger trial [83]. A study with 30 patients with suspected ccRCC undergoing zirconium-89-labeled girentuximab immunoPET was closed recently, and results are expected soon (NCT02883153). One in vitro study showed that conjugation of iron oxide nanoparticles and girentuximab as a molecular MRI probe for the detection ccRCC is feasible [84].
Fig. 9
A 74-year-old male patient was evaluated for flank pain and hematuria. A screening ultrasound showed a hypervascular and hyperechoic renal mass of left kidney. A 3-phase CT scan showed an interlobular heterogeneous mass with a maximum diameter of 56 mm in the left renal cortex. Avid enhancement of the solid parts is seen in the corticomedullary phase, especially in the solid tumor parts, making this tumor suggestive for renal cell carcinoma.(A) An additional MRI with T2-weighted fat saturated sequences acquired in the coronal plane showed a heterogeneous renal mass with growth towards the renal pelvis. Note the simple cysts in the lower pole. (B) Additional SPECT/CT 5 days after administration of 111-Indium-Girentuximab shows targeting of the renal tumor making a clear cell subtype highly likely. A second hot spot in the renal pelvis was noted. (C) Histopathology after laparoscopic radical nephrectomy confirmed the diagnosis of a 50 mm large, Furhman grade 3, clear cell renal cell carcinoma.
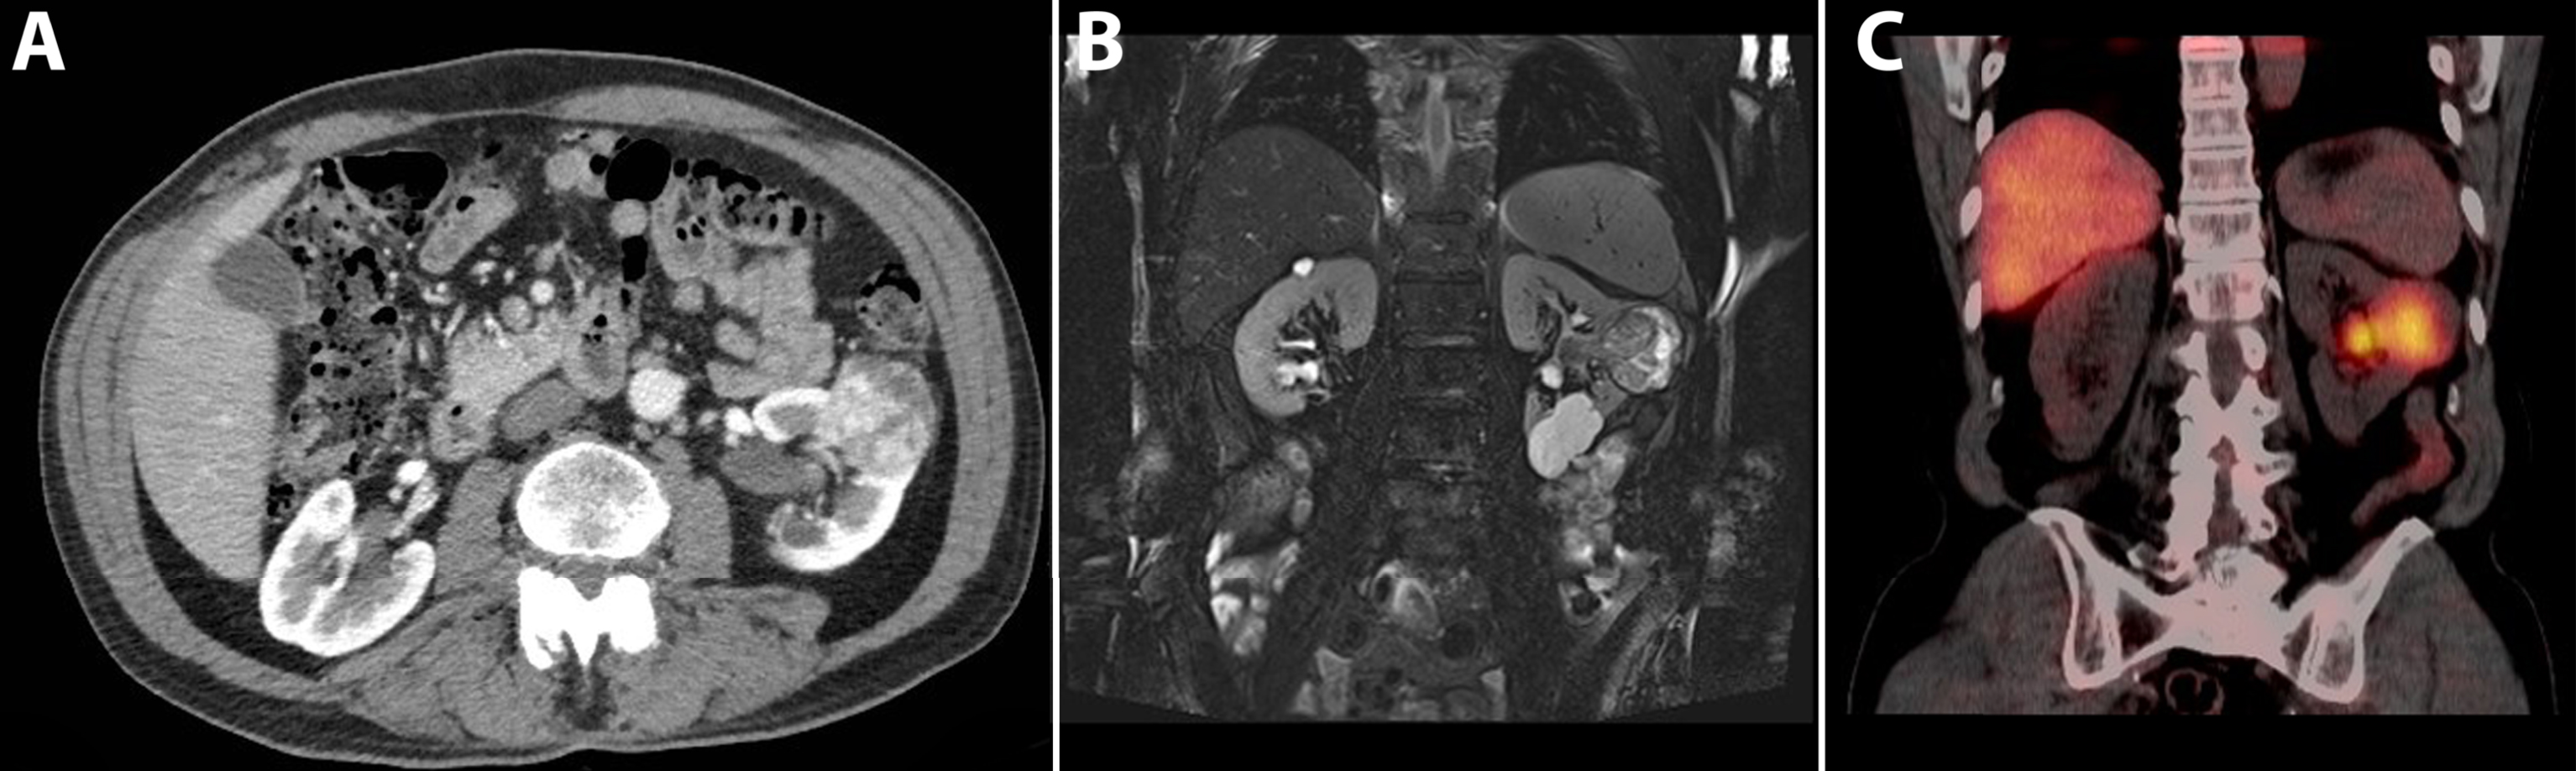
Table 1
Sensitivity and specificity for differential diagnosis of renal masses per imaging modality. Shown as sensitivity% /specificity%
| Imaging modality | Contrast-enhanced ultrasound | CT | MRI | Nuclear imaging |
| Malignant versus benign | 100/9526 | 60-90/44-10035,42,50 | 80-100/9665,70 | 88/9585 |
| Clear cell versus non-clear cell RCC | 94/4624 | 80/4435,42 | 88-93/33-9635,60 | 86/8683 |
Table 2
Summarize of CT characteristics of the most common causes for renal mass
| Histologic Subtype | Non-contrast phase | Corticomedullary phase | Nephrogenic phase | Other characteristics |
| Classic AML | Solid and homogeneous, attenuation < –10HU. | Homogeneous enhancement. | Persistent and gradual enhancement, dependent on tumor composition more rapid enhancement with washout. | 4–5% of RCC may demonstrate macroscopic fat. |
| fp-AML | Homogeneous, hyperattenuating. | Homogeneous enhancement. | Mostly contrast washout effect is seen. | |
| Oncocytoma | Homogeneous, solid, iso- or hypoattenuating. | Moderate enhancement, attenuation >20 HU. | Washout can be observed. | Central scar only in 25%. |
| ccRCC | Heterogeneous aspect (due to necrosis, hemorrhage, and cystic parts). Calcifications may be present. | Solid parts show a fast and strong enhancing (hypervascular) pattern, attenuation >20 HU. | Contrast washout effect. | 4–5% of RCC may demonstrate macroscopic fat. |
| pRCC | Heterogeneous, smaller tumors may appear homogeneous. May have calcification. | Mild (hypovascular) and slow enhancement pattern, attenuation up to 20 HU. | Persistent and gradual enhancement, no clear washout effect. | No enhancement is seen in up to 25% of the pRCCs. |
| chrRCC | Heterogeneous and well circumscribed. Generally no calcifications. | Moderate degree of enhancement, attenuation >20HU. | Contrast washout can be observed. |
[i] AML = angiomyolipoma; fp-AML = fat poor angiomyolipoma, ccRCC = clear cell renal cell carcinoma, pRCC = papillary RCC, chrRCC = chromophobe RCC, HU = Hounsfield unit.
Technetium-99m-sestamibi SPECT-CT
Technetium-99m-sestamibi SPECT-CT has been shown to allow for accurate differentiation of oncocytomas and hybrid oncocytic/chromophobe tumors from other RCC subtypes. Oncocytomas/hybrid oncocytic/chromophobe tumors show higher uptake compared with RCC [85]. Quantitative SPECT-CT reconstruction models can be used to achieve improved separation between uptake ratios of renal masses [86].
CONCLUSIONS
Dedicated diagnostic renal imaging is important for characterization of renal tumors to facilitate treatment planning. In this review, we described the ability to detect and differentiate RCC subtypes, angiomyolipoma, and oncocytoma, based on US, CT, multiparametric MRI, and nuclear imaging modalities.
US can be used as a screening tool for renal tumors, with the understanding that smaller endophytic tumors can be missed during screening. Additional Doppler or CEUS can be used to identify smaller isoechoic, hypoechoic, and hypovascular tumors and can be used to correctly identify pseudotumors. CEUS can differentiate endophytic cysts from solid renal tumors marked as indeterminate lesions on CT with enhancement up to 20 HU. Differentiation between benign and malignant tumors and different RCC subtypes is not reliably possible, but results for CEUS are promising.
As the most used diagnostic modality, CT is able to differentiate the most common type of angiomyolipoma from malignant entities. Larger tumors can usually be identified as ccRCC, and when appearing as typical lesions, pRCC may be differentiated from ccRCC. Despite well-described imaging appearances and enhancement patterns, the sensitivity for CT to discriminate RCC subtypes, fat-poor angiomyolipoma, and oncocytoma is modest.
Multiparametric MRI is able to discriminate classic angiomyolipoma from RCC and differentiate RCC subtypes. The differentiation of fat-poor angiomyolipoma is feasible but challenging and often still warrants a biopsy. Oncocytoma cannot reliably be distinguished from RCC, but techniques such as DW MRI show promising results. MRI is the most emerging field among the conventional imaging modalities harboring future potential. However, standardization of reporting criteria and imaging protocols is needed to improve interobserver reliability.
The availability of nuclear imaging for renal tumors is very limited. Although mostly considered experimental, these imaging modalities show promising results for the differentiation of ccRCC and oncocytoma.
A renal tumor always warrants dedicated cross sectional imaging for further characterization. Only the diagnosis fat-rich angiomyolipoma can be made based on CT or MRI alone. In smaller tumors, appearing typically as pRCC on imaging, a watchful waiting policy can be justified. In case of other renal tumors suggestive for RCC on imaging a biopsy or surgical treatment is warranted because the chance is still highly likely that it concerns a malignancy. A biopsy prior to surgery may be best suitable for smaller renal tumors because of the relatively high incidence of benign lesions among this group which cannot be discriminated by imaging.
CONFLICTS OF INTEREST
None.
ACKNOWLEDGMENTS
The authors would like to thank Jan Heidkamp for his significant contribution to obtain and edit all images used in this manuscript.
REFERENCES
[1] | O’Connor SD , Pickhardt PJ , Kim DH , Oliva MR , Silverman SG. Incidental finding of renal masses at unenhanced CT: Prevalence and analysis of features for guiding management. Am J Roentgenol. (2011) ;197: (1):139-45. |
[2] | Nguyen MM , Gill IS , Ellison LM. The evolving presentation of renal carcinoma in the United States: Trends from the surveillance, epidemiology, and end results program. J Urology. (2006) ;176: (6):2397-400. |
[3] | Frank I , Blute ML , Cheville JC , Lohse CM , Weaver AL , Zincke H. Solid renal tumors: An analysis of pathological features related to tumor size. J Urology. (2003) ;170: (6):2217-20. |
[4] | Renshaw AA. Subclassification of renal cell neoplasms: An update for the practising pathologist. Histopathology. (2002) ;41: (4):283-300. |
[5] | Moch H HP , Ulbright TM , Reuter V. WHO Classification of Tumours of the Urinary System and Male Genital Organs. Lyon, France: International Agency for Research on Cancer; (2016) . |
[6] | Koo KC , Kim WT , Ham WS , Lee JS , Ju HJ , Choi YD. Trends of presentation and clinical outcome of treated renal angiomyolipoma. Yonsei Med J. (2010) ;51: (5):728-34. |
[7] | Jinzaki M , Silverman SG , Akita H , Nagashima Y , Mikami S , Oya M. Renal angiomyolipoma: A radiological classification and update on recent developments in diagnosis and management. Abdom Imaging. (2014) ;39: (3):588-604. |
[8] | Goldberg BB , Pollack HM. Differentiation of renal masses using a-mode ultrasound. J Urology. (1971) ;105: (6):765-771. |
[9] | Smith EH , Bennett AH. The usefulness of ultrasound in the evaluation of renal masses in adults. The Journal of Urology. (1975) ;113: (4):525-9. |
[10] | Siemer S , Uder M , Humke U , Lindenmeier T , Moll V , Rudenauer E , Maurer J , Ziegler M. Value of ultrasound in early diagnosis of renal cell carcinoma. Urologe A. (2000) ;39: (2):149-53. |
[11] | Rumack CMSRW , Charboneau JW. Diagnostic ultrasound. St Louis, MO, USA: Elsevier Health Sciences; (2005) . |
[12] | Helenon O , Correas JM , Balleyguier C , Ghouadni M , Cor-nud F. Ultrasound of renal tumors. European Radiology. (2001) ;11: (10):1890-901. |
[13] | Forman HP , Middleton WD , Melson GL , Mcclennan BL. Hyperechoic renal-cell carcinomas - increase in detection at us. Radiology. (1993) ;188: (2):431-4. |
[14] | Warshauer DM , Mccarthy SM , Street L , Bookbinder MJ , Glickman MG , Richter J , Hammers L , Taylor C , Rosenfield AT. Detection of renal masses - sensitivities and specificities of excretory urography-linear tomography, ultrasound, and Ct. Radiology. (1988) ;169: (2):363-5. |
[15] | Jamis-Dow CA , Choyke PL , Jennings SB , Linehan WM , Thakore KN , Walther MM. Small (< or=3-cm) renal masses: Detection with CT versus US and pathologic correlation. Radiology. (1996) ;198: (3):785-8. |
[16] | Cokkinos DD , Antypa EG , Skilakaki M , Kriketou D , Tav- ernaraki E , Piperopoulos PN. Contrast enhanced ultrasound of the kidneys: What is it capable of? BioMed Research International. (2013) ;2013: :595873. |
[17] | Sidhar K , McGahan JP , Early HM , Corwin M , Fanana- pazir G , Gerscovich EO. Renal cell carcinomas sonographic appearance depending on size and histologic type. J Ultras Med. (2016) ;35: (2):311-20. |
[18] | Hartman DS , Goldman SM , Friedman AC , Davis CJ , Madewell JE , Sherman JL. Angiomyolipoma - ultrasonic-pathologic correlation. Radiology. (1981) ;139: (2):451-8. |
[19] | Goiney RC , Goldenberg L , Cooperberg PL , Charboneau JW , Rosenfield AT , Russin LD , Mccarthy S , Zeman RK , Gordon PB , Rowley BA. Renal oncocytoma - sonographic analysis of 14 cases. Am J Roentgenol. (1984) ;143: (5):1001-4. |
[20] | Jinzaki M , Ohkuma K , Tanimoto A , Mukai M , Hiramatsu K , Murai M , Hata J. Small solid renal lesions: Usefulness of power Doppler US. Radiology. (1998) ;209: (2):543-50. |
[21] | Hsiao W , Shrewsberry AB , Moses KA , Malek- Jones M , Baumgarten D , Master VA , Ogan K. Intra-tumor Doppler flow patterns do not predict malignancy of renal masses in a United States population. Can J Urol. (2011) ;18: (4): 5831-5. |
[22] | Jakobsen J. Echo-enhancing agents in the renal tract. Clin Radiol. (1996) ;51: :40-3. |
[23] | Setola SV , Catalano O , Sandomenico F , Siani A. Contrast-enhanced sonography of the kidney. Abdom Imaging. (2007) ;32: (1):21-8. |
[24] | Tamai H , Takiguchi Y , Oka M , Shingaki N , Enomoto S , Shiraki T , Furuta M , Inoue I , Iguchi M , Yanaoka K , Arii K , Shimizu Y , Nakata H , Shinka T , Sanke T , Ichinose M. Contrast-enhancedultrasonography in the diagnosis ofsolid renal tumors. J Ultras Med. (2005) ;24: (12):1635-40. |
[25] | Ascenti G , Zimbaro G , Mazziotti S , Gaeta M , Lamberto S , Scribano E. Contrast-enhanced power Doppler US in the diagnosis of renal pseudotumors. European Radiology. (2001) ;11: (12):2496-9. |
[26] | Barr RG , Peterson C , Hindi A. Evaluation of indeterminate renal masses with contrast-enhanced US: A diagnostic performance study. Radiology. (2014) ;271: (1):133-42. |
[27] | Kazmierski B , Deurdulian C , Tchelepi H , Grant EG. Applications of contrast-enhanced ultrasound in the kidney. Abdom Radiol (NY); (2017) . |
[28] | Ljungberg B , Bensalah K , Canfield S , Dabestani S , Hofmann F , Hora M , Kuczyk MA , Lam T , Marconi L , Merseburger AS , Mulders P , Powles T , Staehler M , Volpe A , Bex A. EAU guidelines on renal cell carcinoma: 2014 update. European Urology. (2015) ;67: (5):913-24. |
[29] | Aycock RD , Westafer LM , Boxen JL , Majlesi N , Schoenfeld EM , Bannuru RR. Acute kidney injury after computed tomography: A meta-analysis. Ann Emerg Med. (2018) ;71: (1):44-53 e4. |
[30] | Nijssen EC , Rennenberg RJ , Nelemans PJ , Essers BA , Janssen MM , Vermeeren MA , Ommen VV , Wildberger JE. Prophylactic hydration to protect renal function from intravascular iodinated contrast material in patients at high risk of contrast-induced nephropathy (AMACING): A prospective, randomised, phase 3, controlled, open-label, non-inferiority trial. Lancet. (2017) ;389: (10076):1312-22. |
[31] | Chow LC , Kwan SW , Olcott EW , Sommer G. Split-bolus MDCT urography with synchronous nephrographic and excretory phase enhancement. Am J Roentgenol. (2007) ;189: (2):314-22. |
[32] | Maheshwari E , O'Malley ME , Ghai S , Staunton M , Massey C. Split-bolus MDCT urography: Upper tract opacification and performance for upper tract tumors in patients with hematuria. Am J Roentgenol. (2010) ;194: (2):453-8. |
[33] | Dyer R , DiSantis DJ , McClennan BL. Simplified imaging approach for evaluation of the solid renal mass in adults. Radiology. (2008) ;247: (2):331-43. |
[34] | Israel GM , Bosniak MA. How I do it: Evaluating renal masses. Radiology. (2005) ;236: (2):441-50. |
[35] | Kim JH , Sun HY , Hwang J , Hong SS , Cho YJ , Doo SW , Yang WJ , Song YS. Diagnostic accuracy of contrast-enhanced computed tomography and contrast-enhanced magnetic resonance imaging of small renal masses in real practice: Sensitivity and specificity according to subjective radiologic interpretation. World J Surg Oncol. (2016) ;14: . |
[36] | Birnbaum BA , Jacobs JE , Ramchandani P. Multiphasic renal CT: Comparison of renal mass enhancement during the corticomedullary and nephrographic phases. Radiology. (1996) ;200: (3):753-8. |
[37] | Cohan RH , Sherman LS , Korobkin M , Bass JC , Francis IR. Renal masses - assessment of corticomedullary-phase and nephrographic-phase CT scans. Radiology. (1995) ;196: (2):445-51. |
[38] | Park BK. Renal Angiomyolipoma: Radiologic classification and imaging features according to the amount of fat. Am J Roentgenol. (2017) ;209: (4):826-35. |
[39] | Jeong CJ , Park BK , Park JJ , Kim CK. Unenhanced CT and MRI parameters that can be used to reliably predict fat-invisible angiomyolipoma. Am J Roentgenol. (2016) ;206: (2):340-7. |
[40] | Lim RS , Flood TA , McInnes MDF , Lavallee LT , Schieda N. Renal angiomyolipoma without visible fat: Can we make the diagnosis using CT and MRI? European Radiology. (2018) ;28: (2):542-53. |
[41] | Krishna S , Murray CA , McInnes MD , Chatelain R , Siddaiah M , Al- Dandan O , Narayanasamy S , Schieda N. CT imaging of solid renal masses: Pitfalls and solutions. Clin Radiol. (2017) ;72: (9):708-21. |
[42] | Heidenreich A , Ravery V. Preoperative imaging in renal cell cancer. World J Urol. (2004) ;22: (5):307-15. |
[43] | Zhang J , Lefkowitz RA , Ishill NM , Wang L , Moskowitz CS , Russo P , Eisenberg H , Hricak H. Solid renal cortical tumors: Differentiation with CT. Radiology. (2007) ;244: (2):494-504. |
[44] | Egbert ND , Caoili EM , Cohan RH , Davenport MS , Francis IR , Kunju LP , Ellis JH. Differentiation of papillary renal cell carcinoma subtypes on CT and MRI. AJR American Journal of Roentgenology. (2013) ;201: (2):347-55. |
[45] | Bhatnagar A , Rowe SP , Gorin MA , Pomper MG , Fishman EK , Allaf ME. Computed tomography appearance of renal hybrid oncocytic/chromophobe tumors. Journal of Computer Assisted Tomography. (2016) ;40: (4):513-6. |
[46] | Thompson RH , Kurta JM , Kaag M , Tickoo SK , Kundu S , Katz D , Nogueira L , Reuter VE , Russo P. Tumor size is associated with malignant potential in renal cell carcinoma cases. The Journal of Urology. (2009) ;181: (5):2033-6. |
[47] | McCollough CH , Leng SA , Yu LF , Fletcher JG. Dual- and multi-energy CT: Principles, technical approaches, and clinical applications. Radiology. (2015) ;276: (3):637-53. |
[48] | Johnson TRC. Dual-energy CT: General principles. Am J Roentgenol. (2012) ;199: (5):S3-S8. |
[49] | Marin D , Davis D , Choudhury KR , Patel B , Gupta RT , Mileto A , Nelson RC. Characterization of small focal renal lesions: Diagnostic accuracy with single-phase contrast-enhanced dual-energy CT with material attenuation analysis compared with conventional attenuation measurements. Radiology. (2017) ;284: (3):737-47. |
[50] | Mazzei FG , Mazzei MA , Squitieri NC , Pozzessere C , Righi L , Cirigliano A , Guerrini S , D' Elia D , Ambrosio MR , Barone A , del Vecchio MT , Volterrani L. CT perfusion in the characterisation of renal lesions: An added value to multiphasic CT. BioMed Research International; (2014) . |
[51] | Chen C , Kang Q , Xu B , Shi Z , Guo H , Wei Q , Lu Y , Wu X. Fat poor angiomyolipoma differentiation from renal cell carcinoma at 320-slice dynamic volume CT perfusion. Abdom Radiol (NY); (2017) . |
[52] | Rofsky NM , Weinreb JC , Bosniak MA , Libes RB , Birnbaum BA. Renal lesion characterization with gadolinium-enhanced mr imaging - efficacy and safety in patients with renal-insufficiency. Radiology. (1991) ;180: (1):85-9. |
[53] | Nazarian S , Hansford R , Rahsepar AA , Weltin V , McVeigh D , Ipek EG , Kwan A , Berger RD , Calkins H , Lardo AC , Kraut MA , Kamel IR , Zimmerman SL , Halperin HR. Safety of magnetic resonance imaging in patients with cardiac devices. New Engl J Med. (2017) ;377: (26):2555-64. |
[54] | Vendrami CL , Villavicencio CP , DeJulio TJ , Chatterjee A , Casalino DD , Horowitz JM , Oberlin DT , Yang GY , Niko- laidis P , Miller FH. Differentiation of solid renal tumors with multiparametric MR imaging. Radiographics: A Review Publication of the Radiological Society of North America, Inc. (2017) ;37: (7):2026-2042. |
[55] | Lassel EA , Rao R , Schwenke C , Schoenberg SO , Michaely HJ. Diffusion-weighted imaging of focal renal lesions: A meta-analysis. European Radiology. (2014) ;24: (1):241-9. |
[56] | Beer AJ , Dobritz M , Zantl N , Weirich G , Stollfuss J , Rummeny EJ. Comparison of 16-MDCT and MRI for characterization of kidney lesions. Am J Roentgenol. (2006) ;186: (6):1639-50. |
[57] | Semelka RC , Hricak H , Stevens SK , Finegold R , Tomei E , Carroll PR. Combined gadolinium-enhanced and fat-saturation Mr imaging of renal masses. Radiology. (1991) ;178: (3):803-9. |
[58] | Prasad SR , Humphrey PA , Catena JR , Narra VR , Srigley JR , Cortez AD , Dalrymple NC , Chintapalli KN. Common and uncommon histologic subtypes of renal cell carcinoma: Imaging spectrum with pathologic correlation. Radiograph-ics: A review publication of the Radiological Society of North America, Inc. (2006) ;26: (6):1795-U13. |
[59] | Oliva MR , Glickman JN , Zou KH , Teo SY , Mortele KJ , Rocha MS , Silverman SG. Renal cell carcinoma: T1 and T2 signal intensity characteristics of papillary and clear cell types correlated with pathology. Am J Roentgenol. (2009) ;192: (6):1524-30. |
[60] | Sun MRM , Ngo L , Genega EM , Atkins MB , Finn ME , Rofsky NM , Pedrosa I. Renal cell carcinoma: Dynamic contrast-enhanced MR imaging for differentiation of tumor subtypes-correlation with pathologic findings. Radiology. (2009) ;250: (3):793-802. |
[61] | Mytsyk Y , Dutka I , Borys Y , Komnatska I , Shatynska- Mytsyk I , Farooqi AA , Gazdikova K , Caprnda M , Rodrigo L , Kruzliak P. Renal cell carcinoma: Applicability of the apparent coefficient of the diffusion-weighted estimated by MRI for improving their differential diagnosis, histo-logic subtyping, and differentiation grade. Int Urol Nephrol. (2017) ;49: (2):215-24. |
[62] | Ramamurthy NK , Moosavi B , McInnes MDF , Flood TA , ieda N. Multiparametric MRI of solid renal masses: 'earls and pitfalls. Clin Radiol. (2015) ;70: (3):304-16. |
[63] | Hotker AM , Mazaheri Y , Wibmer A , Zheng JT , Moskowitz CS , Tickoo SK , Russo P , Hricak H , Akin O. Use of DWI in the differentiation of renal cortical tumors. Am J Roentgenol. (2016) ;206: (1):100-5. |
[64] | Rosenkrantz AB , Hindman N , Fitzgerald EF , Niver BE , Melamed J , Babb JS. MRI features of renal oncocytoma and chromophobe renal cell carcinoma. Am J Roentgenol. (2010) ;195: (6):W421-W7. |
[65] | Kay FU , Pedrosa I. Imaging of solid renal masses. Radiol Clin North Am. (2017) ;55: (2):243-58. |
[66] | Israel GM , Hindman N , Hecht E , Krinsky G. The use of opposed-phase chemical shift MRI in the diagnosis of renal angiomyolipomas. Am J Roentgenol. (2005) ;184: (6):1868-72. |
[67] | Hosokawa Y , Kinouchi T , Sawai Y , Mano M , Kiuchi H , Meguro N , Maeda O , Kuroda M , Usami M. Renal angiomy-olipoma with minimal fat. International Journal of Clinical Oncology. (2002) ;7: (2):120-3. |
[68] | Jinzaki M , Tanimoto A , Narimatsu Y , Ohkuma K , Kurata T , Shinmoto H , Hiramatsu K , Mukai M , Murai M. Angiomy-olipoma: Imaging findings in lesions with minimal fat. Radiology. (1997) ;205: (2):497-502. |
[69] | Catalano OA , Samir AE , Sahani DV , Hahn PF. Pixel distribution analysis: Can it be used to distinguish clear cell carcinomas from angiomyolipomas with minimal fat? Radiology. (2008) ;247: (3):738-46. |
[70] | Sasiwimonphan K , Takahashi N , Leibovich BC , Carter RE , Atwell TD , Kawashima A. Small (< 4cm) renal mass: Differentiation of angiomyolipoma without visible fat from renal cell carcinoma utilizing MR imaging. Radiology. (2012) ;263: (1):160-8. |
[71] | Tanaka H , Yoshida S , Fujii Y , Ishii C , Tanaka H , Koga F , Saito K , Masuda H , Kawakami S , Kihara K. Diffusion-weighted magnetic resonance imaging in the differentiation of angiomyolipoma with minimal fat from clear cell renal cell carcinoma. International Journal of Urology. (2011) ;18: (10):727-30. |
[72] | Notohamiprodjo M , Glaser C , Herrmann KA , Dietrich O , Attenberger UI , Reiser MF , Schoenberg SO , Michaely HJ. Diffusion tensor imaging of the kidney with parallel imaging: Initial clinical experience. Investigative Radiology. (2008) ;43: (10):677-85. |
[73] | Feng Q , Fang W , Sun XP , Sun SH , Zhang RM , Ma ZJ. Renal clear cell carcinoma: Diffusion tensor imaging diagnostic accuracy and correlations with clinical and histopathologi-cal factors. Clin Radiol. (2017) ;72: (7):560-4. |
[74] | Squillaci E , Manenti G , Cova M , Di Roma M , Miano R , Palmieri G , Simonetti G. Correlation of diffusion-weighted MR imaging with cellularity of renal tumours. Anticancer research. (2004) ;24: (6):4175-9. |
[75] | Zhang JL , Sigmund EE , Chandarana H , Rusinek H , Chen Q , Vivier PH , Taouli B , Lee VS. Variability of renal apparent diffusion coefficients: Limitations of the mono-exponential model for diffusion quantification. Radiology. (2010) ;254: (3):783-92. |
[76] | Taouli B , Thakur RK , Mannelli L , Babb JS , Kim S , Hecht EM , Lee VS , Israel GM. Renal lesions: Characterization with diffusion-weighted imaging versus contrast-enhanced MR imaging. Radiology. (2009) ;251: (2):398-407. |
[77] | Nery F , Gordon I , Thomas DL. Non-invasive renal perfusion imaging using arterial spin labeling MRI: Challenges and opportunities. Diagnostics (Basel). (2018) ;8: (1). |
[78] | Lanzman RS , Robson PM , Sun MR , Patel AD , Mentore K , Wagner AA , Genega EM , Rofsky NM , Alsop DC , Pedrosa I. Arterial spin-labeling MR imaging of renal masses: Correlation with histopathologic findings. Radiology. (2012) ;265: (3):799-808. |
[79] | Leibovich BC , Sheinin Y , Lohse CM , Thompson RH , Cheville JC , Zavada J , Kwon ED. Carbonic anhydrase IX is not an independent predictor of outcome for patients with clear cell renal cell carcinoma. Journal of Clinical Oncology. (2007) ;25: (30):4757-64. |
[80] | Oosterwijk E , Ruiter DJ , Hoedemaeker PJ , Pauwels EKJ , Jonas U , Zwartendijk J , Warnaar SO. Monoclonal-Antibody G-250 recognizes a determinant present in renal-cell carcinoma and absent from normal kidney. International Journal of Cancer. (1986) ;38: (4):489-94. |
[81] | Muselaers CHJ , Boerman OC , Oosterwij kE , Langenhuijsen JF , Oyen WJG , Mulders PFA. Indium-111-labeled girentux-imab immunospect as a diagnostic tool in clear cell renal cell carcinoma. European urology. (2013) ;63: (6):1101-6. |
[82] | Divgi CR , Pandit-Taskar N , Jungbluth AA , Reuter VE , Gonen M , Ruan S , Pierre C , Nagel A , Pryma DA , Humm J , Larson SM , Old LJ , Russo P. Preoperative characterisation of clear-cell renal carcinoma using iodine-124-labelled antibody chimeric G250 (I-124-cG250) and PET in patients with renal masses: A phase I trial. Lancet Oncology. (2007) ;8: (4):304-10. |
[83] | Divgi CR , Uzzo RG , Gatsonis C , Bartz R , Treutner S , Yu JQ , Chen D , Carrasquillo JA , Larson S , Bevan P , Russo P. Positron emission tomography/computed tomography identification of clear cell renal cell carcinoma: Results from the REDECT trial. Journal of Clinical Oncology. (2013) ;31: (2):187-94. |
[84] | Lu CL , Li JJ , Xu K , Yang C , Wang JL , Han CP , Liu XH. Fabrication of mAb G250-SPIO molecular magnetic resonance imaging nanoprobe for the specific detection of renal cell carcinoma in vitro. Plos One. (2014) ;9: (7). |
[85] | Campbell SP TA , Javadi MS , Karlsson M , Solnes LB , Axels- son R , Allaf ME , Gorin MA , Rowe SP. 99mTc-Sestamibi SPECT/CTforthe characterization of renal masses: Apicto-rial guide. British Journal of Radiology; (2017) ; [Epub ahead of print] |
[86] | Jones KM SL , Rowe SP , Gorin MA , Sheikhbahaei S , Fung G , Frey EC , Allaf ME , Du Y , Javadi MS. Use of quantitative SPECT/CT reconstruction in 99mTc-sestamibi imaging of patients with renal masses. Ann Nucl Med; (2017) ; [Epub ahead of print]. |


