Can AI generate diagnostic reports for radiologist approval on CXR images? A multi-reader and multi-case observer performance study
Abstract
BACKGROUND:
Accurately detecting a variety of lung abnormalities from heterogenous chest X-ray (CXR) images and writing radiology reports is often difficult and time-consuming.
OBJECTIVE:
To access the utility of a novel artificial intelligence (AI) system (MOM-ClaSeg) in enhancing the accuracy and efficiency of radiologists in detecting heterogenous lung abnormalities through a multi-reader and multi-case (MRMC) observer performance study.
METHODS:
Over 36,000 CXR images were retrospectively collected from 12 hospitals over 4 months and used as the experiment group and the control group. In the control group, a double reading method is used in which two radiologists interpret CXR to generate a final report, while in the experiment group, one radiologist generates the final reports based on AI-generated reports.
RESULTS:
Compared with double reading, the diagnostic accuracy and sensitivity of single reading with AI increases significantly by 1.49% and 10.95%, respectively (P < 0.001), while the difference in specificity is small (0.22%) and without statistical significance (P = 0.255). Additionally, the average image reading and diagnostic time in the experimental group is reduced by 54.70% (P < 0.001).
CONCLUSION:
This MRMC study demonstrates that MOM-ClaSeg can potentially serve as the first reader to generate the initial diagnostic reports, with a radiologist only reviewing and making minor modifications (if needed) to arrive at the final decision. It also shows that single reading with AI can achieve a higher diagnostic accuracy and efficiency than double reading.
1Introduction
Chest X-ray (CXR) imaging is a commonly used low-cost imaging modality to detect a variety of lung abnormalities. However, due to the great heterogeneity of lung abnormalities, reading and correctly interpreting CXR images is often a difficult and time-consuming task for radiologists. Misinterpretation of CXR images can have negative impact on patient care and may lead to serious treatment outcomes. It has been reported that 33% diagnostic errors with relevant imaging occurred due to misinterpretation and 22% of all errors in diagnostic radiology were made in CXR images [1, 2]. One way to reduce errors and increase diagnostic sensitivity in radiology is double reading between peers [3, 4], and they are often conducted in different approaches such as two readers with the same degree of sub-specialization reading the same image at different times; and a preliminary junior reader report followed by subsequent reading of subspecialists with a higher level of sub-specialization [5]. However, both approaches have a problem due to the scarcity of radiologists, especially in the rural aeras where the shortage of radiologists is much of a concern. Moreover, cost increase is another important financial factor to hinder the double reading process.
To overcome the challenge of double reading, developing artificial intelligence (AI) has been attracting broad research interest recently and many studies have reported encouraging technical results in medical imaging analysis such as detecting tuberculosis on CXR images [6, 7], classifying benign and malignant lung nodules from CT images [8] and detecting skin cancer from skin photographs [9]. Some laboratory studies have also reported that AI can perform comparably to humans in detecting diabetic retinopathy and malignant melanoma [9, 10]. The commercialized computer-aided detection (CAD) system has been already approved to be used as a second reader in the United States to help detect lung nodules that may be missed by the radiologists [11].
Most current research in CAD or AI of medical images focuses on detecting or diagnosing one specific abnormality or disease such as tuberculosis [12], pneumonia [13], and pulmonary nodules [14], however, the detection of a single abnormality may not reflect the complexity of real-world cases. Although some recent studies have addressed the simultaneous classification of multiple abnormalities, performance evaluation of these AI models is still limited to region of interest (ROI)-level, which only contains one positive ROI per CXR case [6, 15]. In addition, radiologists still need to confirm the AI results and write a diagnostic report, which is time-consuming.
In this research effort, we have developed a unique AI system named as MOM-ClaSeg (Multi-task, Optimal-recommendation, and Max-predictive Classification and Segmentation), which aims to automatically detect multiple lung abnormalities and generate diagnostic reports [16]. A radiologist only needs to review an AI-generated diagnostic report and then either approves it or makes minor modifications (if needed). Our hypothesis is that if successful, using MOM-ClaSeg AI system will help increase not only the accuracy (i.e., sensitivity) in detecting lung abnormalities, but also the efficiency of abnormality diagnosis (reducing image reading and report writing time). To test our hypothesis, we conduct a multi-reader and multi-case (MRMC) type observer performance study using a large and diverse CXR image dataset including images acquired from 12 hospitals. This MRMC study will analyze and compare diagnostic accuracy and efficiency between double reading (the second radiologist reviewing initial report from the first radiologist to generate final reports) and single reading with MOM-ClaSeg (the first radiologist reviewing initial report from MOM-ClaSeg to generate final reports) in reading and interpreting CXR images depicting different or multiple lung abnormalities. Specifically, accuracy, sensitivity and specificity and review time for double and single readings are assessed to evaluate a radiologist’s performance. To the best of our knowledge, it is the first study to explore whether single reading with AI would obtain a comparable performance to double reading. Further, it is also the first study to detect different multiple pulmonary abnormalities to evaluate the radiologist’s diagnostic performance on case report conclusion level (namely, combination of different multiple abnormalities per image) instead of ROI level (namely, single abnormality per image), which might be benefit for work routines where double reading is obligatory or not, as it allows for improved diagnosis efficiency but little extra cost increases.
2Methods
2.1Review of MOM-ClaSeg system
As reported in our previous paper [16], the MOM-ClaSeg AI system was originally developed by applying augmented Mask-R-CNN based Generative Pre-trained Text content generation networks using a large dataset involving 310,333 confirmed adult CXR images that were collected from multiple hospitals. This image dataset contains 243,262 abnormal images depicting 65 different abnormalities and 67,071 normal images. Unlike traditional CAD models that only detect a single type of abnormality, MOM-ClaSeg is optimally trained to detect and segment multiple abnormalities of different classes of abnormalities visible on CXR images and then generates diagnostic reports of radiological impression for all detected abnormalities.
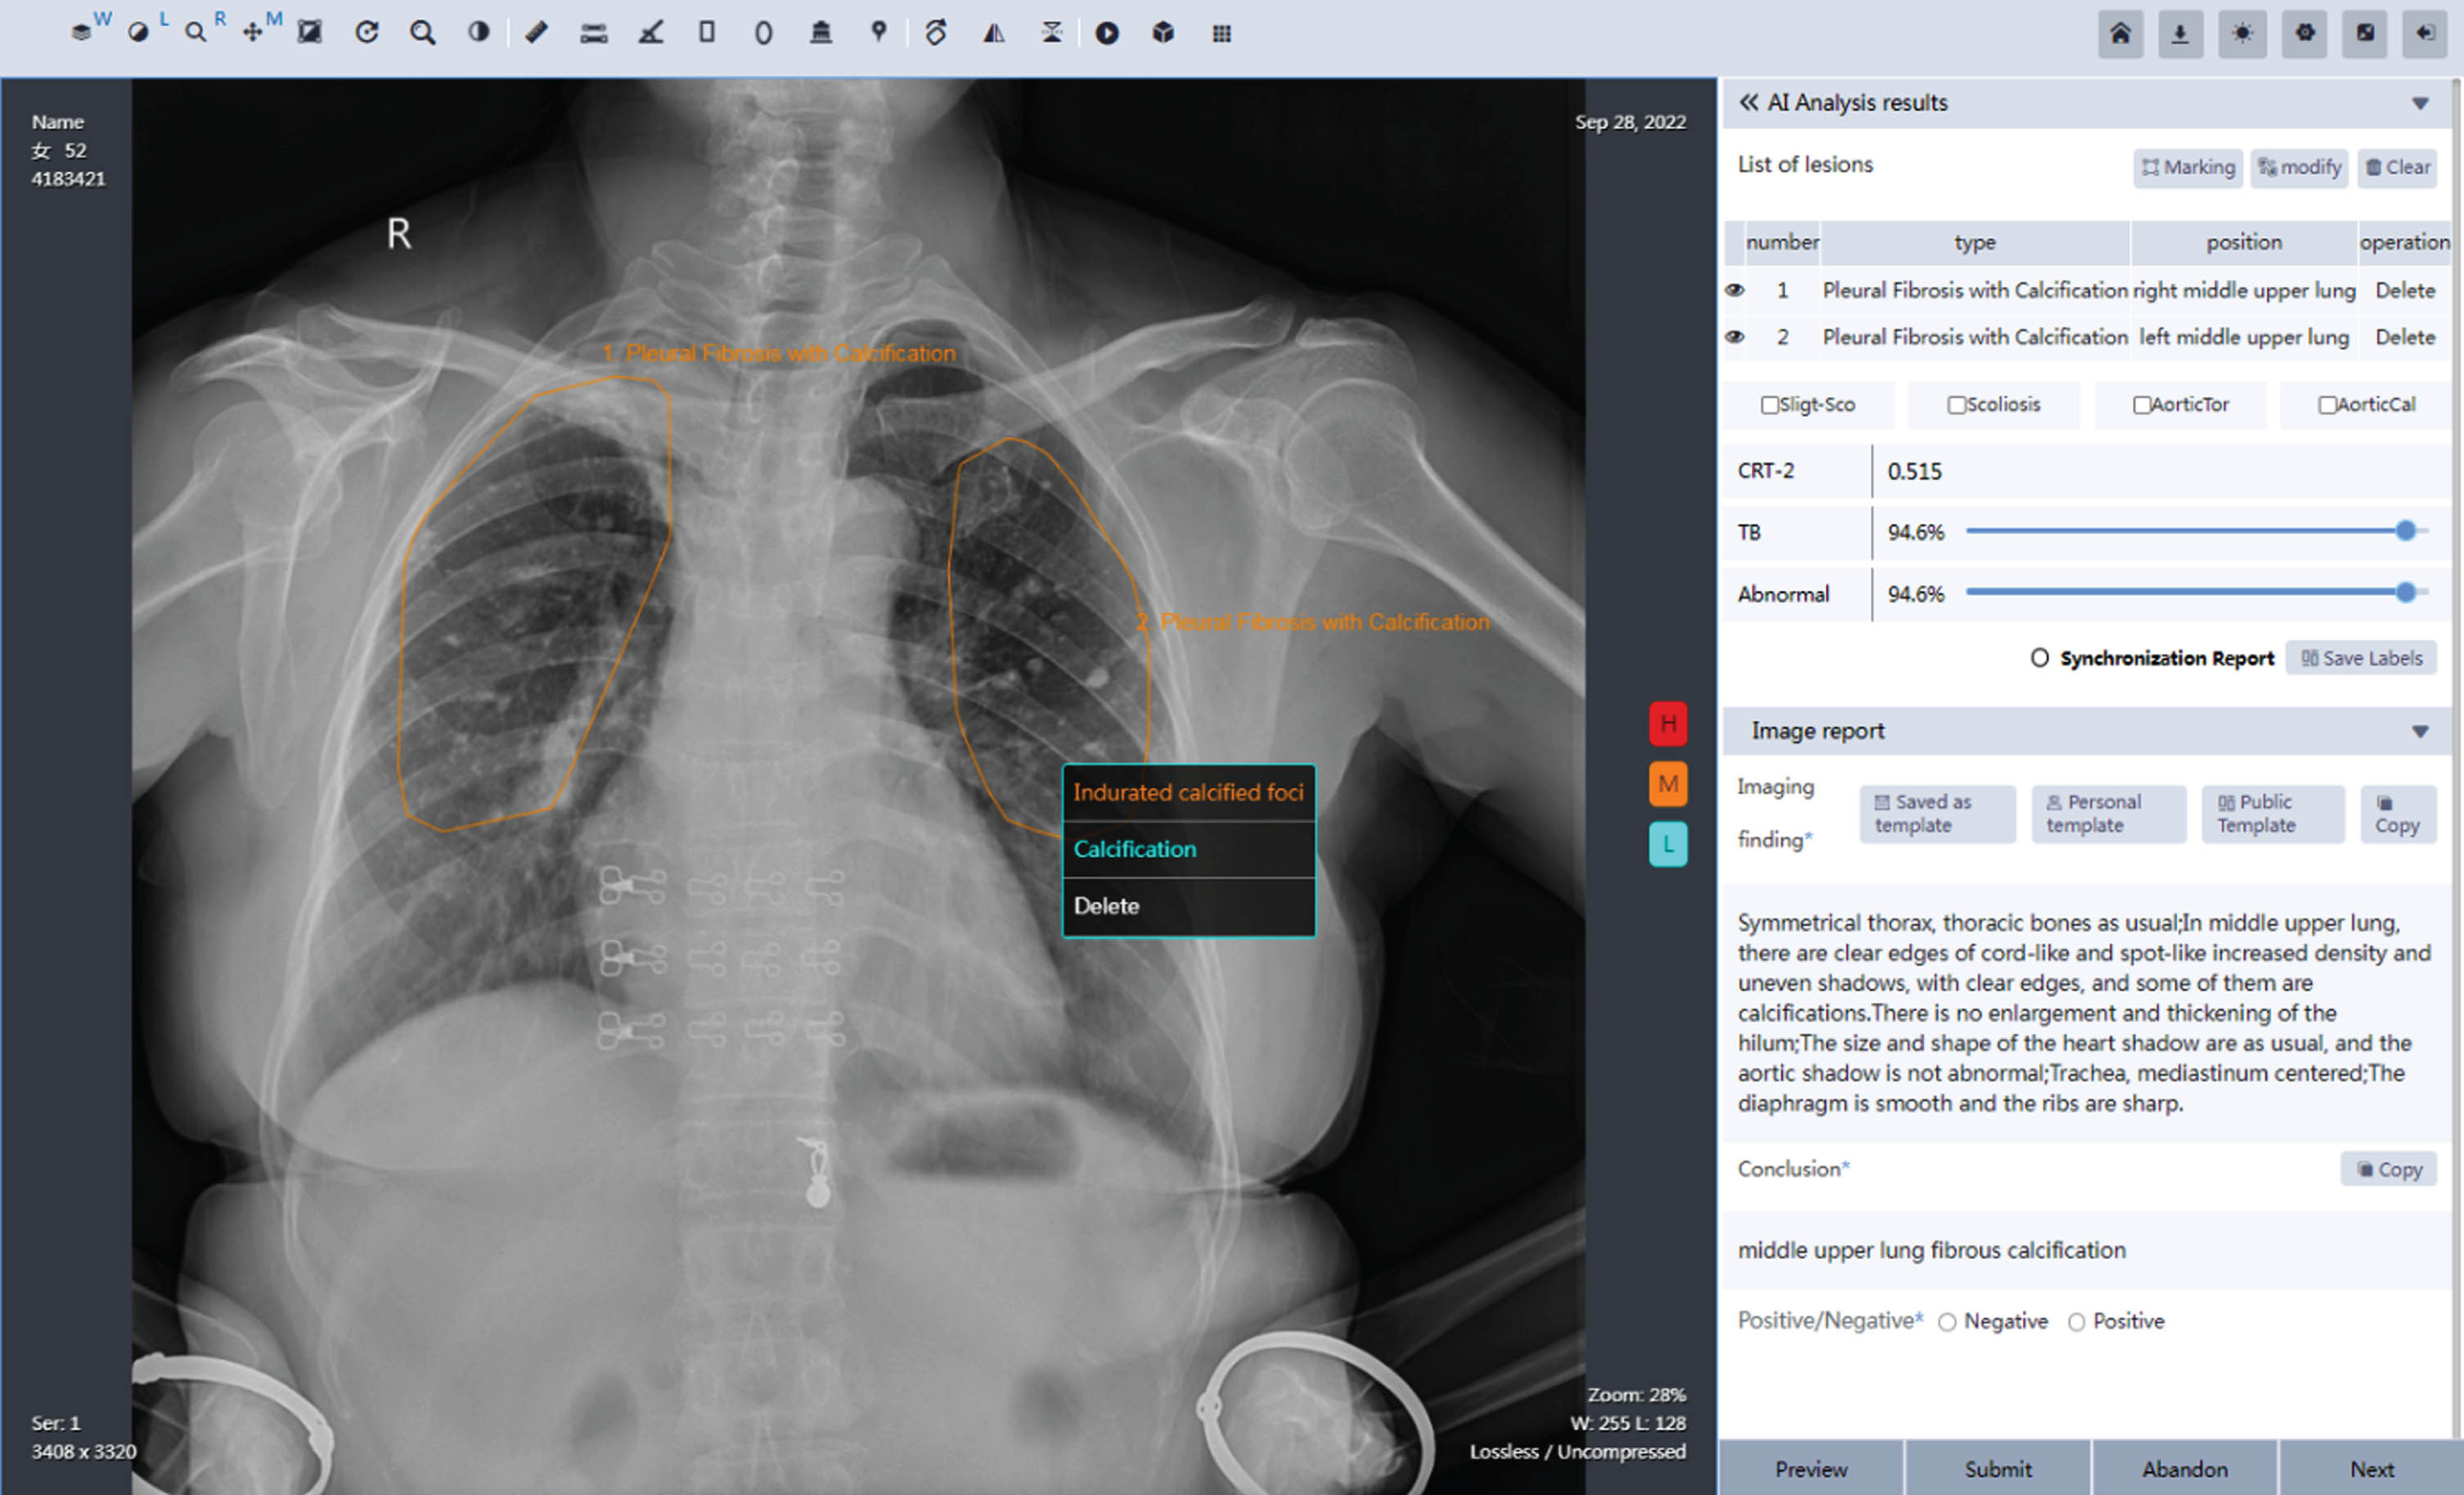
In brief, Fig. 1 illustrates the graphical user interface (GUI) of MOM-ClaSeg. As shown in Fig. 1, an image report panel (located in the middle) delineates the boundary contour of the detected and segmented abnormal ROIs. A text report panel provides classification recommendations with three levels of confidence (blue for low, orange for middle, and red for high), as well as an automatically generated report that includes the image impression description and diagnostic conclusion. The image impression description section provides a brief summary of the radiologic manifestation observed on the image in a short paragraph. The image impression description serves as a guide for the radiologist’s interpretation and helps to identify potential abnormalities that require further evaluation. The diagnostic conclusion section is the final summary of the CXR interpretation and includes the class and location information of each detected abnormality (or ROI). It typically includes a statement on the presence or absence of any abnormalities. Conclusion includes multiple different abnormalities, their locations on CXR, as well as disease progression, and recommendation for potential intervention for follow-up, treatment, etc.
Fig. 1
Visual representation of the graphical user interface (GUI) of the MOM-ClaSeg system.
2.2Study cohorts
This study was conducted in accordance with the Declaration of Helsinki (as revised in 2013) and this retrospective study was also approved by the Shenzhen Center for Chronic Disease Control Institutional Review Board ([2019]SZCCC-2019-014-01) with a waiver of informed consent. The MOM-ClaSeg AI system is installed in a central hospital to automatically screen and diagnose multiple abnormalities on CXR images received from different general hospitals in rural areas via a secured internet connection, and the patient identification was removed before image review and diagnosis. From May 22 to July 22, 2022, a total of 28,526 CXR images were retrospectively collected and used as the experiment group (single reading based on AI-generated reports), and from July 22 to September 22, 2022, a total of 7,845 CXR images were collected as the control group (double reading involving two radiologists). The experiment group includes 5,756 abnormal images and 22,770 normal images, while the control group includes 936 abnormal images and 6,909 normal images. All cases were representatives of outpatients referred by primary care physicians, self-referral, TB screening program, etc. The data distribution of 12 hospitals is provided in Table 1. In summary, this study includes reading the total 36,374 posterior anterior/anterior posterior CXR images.
Table 1
Distribution of CXR images from 12 different hospitals
| Control group | Experiment group | |
| Hospitals | CXR images | CXR images |
| 1 | 2,260 | 6,558 |
| 2 | 2,109 | 4,183 |
| 3 | 992 | 3,572 |
| 4 | 522 | 2,835 |
| 5 | 413 | 2,488 |
| 6 | 379 | 2,141 |
| 7 | 362 | 1,866 |
| 8 | 310 | 1,780 |
| 9 | 233 | 1,224 |
| 10 | 213 | 734 |
| 11 | 35 | 675 |
| 12 | 17 | 470 |
| Total | 7,845 | 28,526 |
| χ2/P | 1,175.637/< 0.001 | |
2.3A double blinded MRMC study design
In preparing the proposed MRMC study, 3 expert panel radiologists (>25 years of experience in imaging) serve as gold standard to read all 36,374 CXR images and classify them as normal and abnormal cases, during which further determination about the class and location of abnormalities was also made based on the pathology/diagnostic reports. A consensus principle was implemented where 3 expert radiologists reviewed together to make a consensus if inter-reader variability was detected.
Description of different types of radiologists, reports and readings are summarized in Table 2. Specifically, a panel of 8 radiologists participated in this blind MRMC observer performance study. Among them 6 are first radiologists with average CXR image reading experience of 5∼10 years, while 2 are second radiologists with average CXR image reading experience > 15 years. The MRMC study includes two image reading and diagnosis modes or groups namely, control mode or group G1 and experimental mode or group G2. Figure 2 illustrates the study design for G1 and G2 modes. As shown in Fig. 2, each CXR image is first read by either one radiologist (G1) or MOM-ClaSeg (G2), and then reviewed by a G1 or G2 radiologist to correct and approve the final diagnostic report. Hence, mode 1 (G1) involves two radiologists (one first and one second radiologist), while mode 2 (G2) involves the MOM-ClaSeg AI system and one radiologist. In the study, the second readers in both control group and experiment group were blind to identifying information about the first reader (either one radiologist or MOM-ClaSeg), and and neither were they aware of which group they belonged to. The time of image reading and report writing/generating of radiologists for diagnosis of each case in two reading modes are also recorded for comparison of efficiency.
Table 2
Summarized description of different types of radiologists, reports, and readings
| Subject | Type | Definition | Involved Group |
| Radiologists | Study radiologist | 8 radiologists who perform diagnosis and generate the final diagnostic reports with or without AI aid, including 6 first radiologists for initial review and 2 second radiologists for final review. | G1, G2 |
| Panel radiologist | 3 radiologists who judge the correctness and difference of diagnosis and “final diagnostic reports” generated by study radiologists. | G1, G2 | |
| Diagnostic reports | Initial diagnostic report | The diagnostic report generated by the first radiologist during the double reading practice | G1 |
| AI-generated diagnostic report | The diagnostic report generated by the AI system | G2 | |
| Final double-reading diagnostic report | Final approved diagnostic report by the second radiologist during double reading | G1 | |
| Final single-reading diagnostic report | Final approved diagnostic report by the first radiologist during single reading using AI | G2 | |
| Readings | Double reading | The first radiologist reads CXR image to perform the diagnosis and generates the “initial diagnostic report”. The second radiologist reviews the initial diagnostic report generated by the first radiologist to approve or edit the report to generate the “final double-reading diagnostic report.”. | G1 |
| Single reading | The first radiologist reviews, approves, and edits “AI-generated diagnostic report” to generate the “final single-reading diagnostic report.” | G2 |
Fig. 2
Study design for the retrospective double blinded study. (a) CXR image interpretation flowchart: In the control group (G1), the first radiologist reads the CXR images, and the second radiologist reviews the initial report to make the final decision. In the experiment group (G2), MOM-ClaSeg is used as a first reader to automatically analyze CXR images and generate diagnostic reports, then a radiologist reviews and possibly modifies AI-generated diagnostic reports. (b) Study protocol and measurements: Expert panel sets up gold standard to evaluate the accuracy of final double-reading diagnostic reports in G1 and final single-reading diagnostic reports in G2.
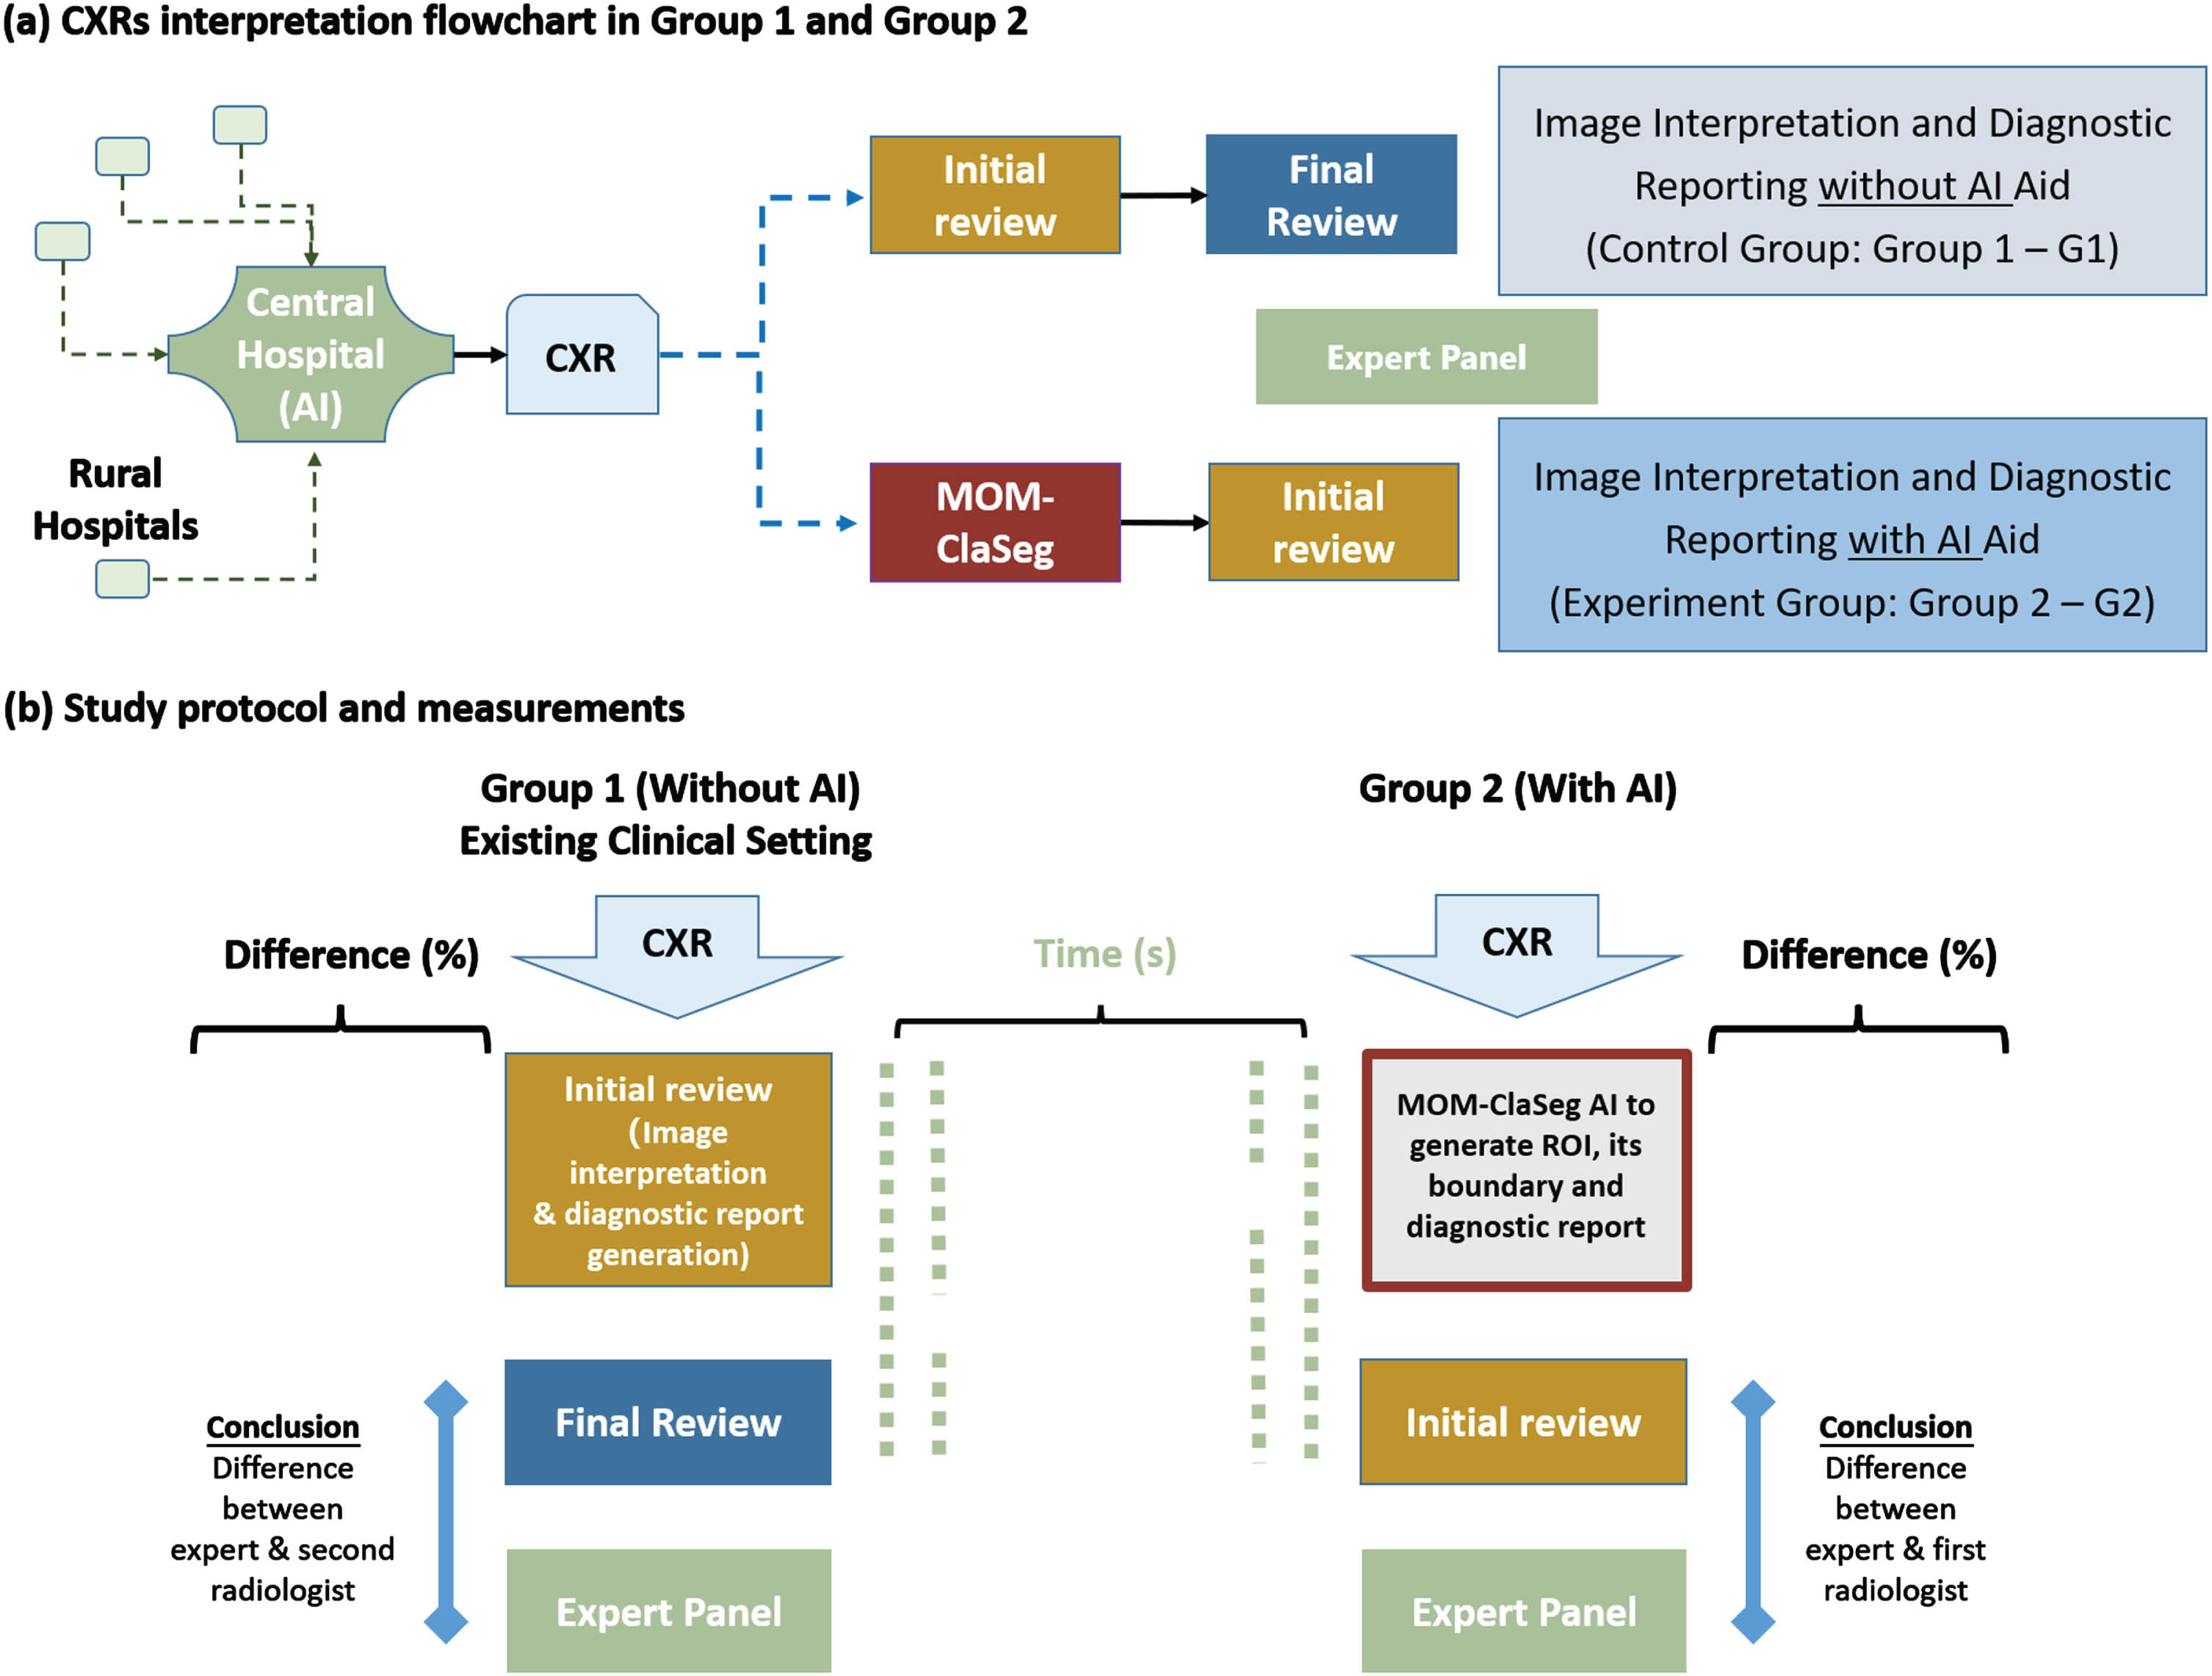
A radiological report typically includes two sections. The first section includes the description (or impression) of image manifestation and radiological conclusion of specific findings or abnormalities. The second conclusion section typically includes multiple different abnormalities, their locations on the CXR image, as well as disease progression, recommendation for potential intervention for follow-up, treatment, etc. Since the types of abnormalities and locations are the crucial diagnostic information from a radiological report, this study evaluates (1) the detection performance based on class of abnormalities and their corresponding locations on CXR images, and (2) overall performance of radiologists based on the conclusion made in the final diagnostic reports in two reading modes or groups (G1 vs. G2).
2.4Evaluation metrics and data analysis
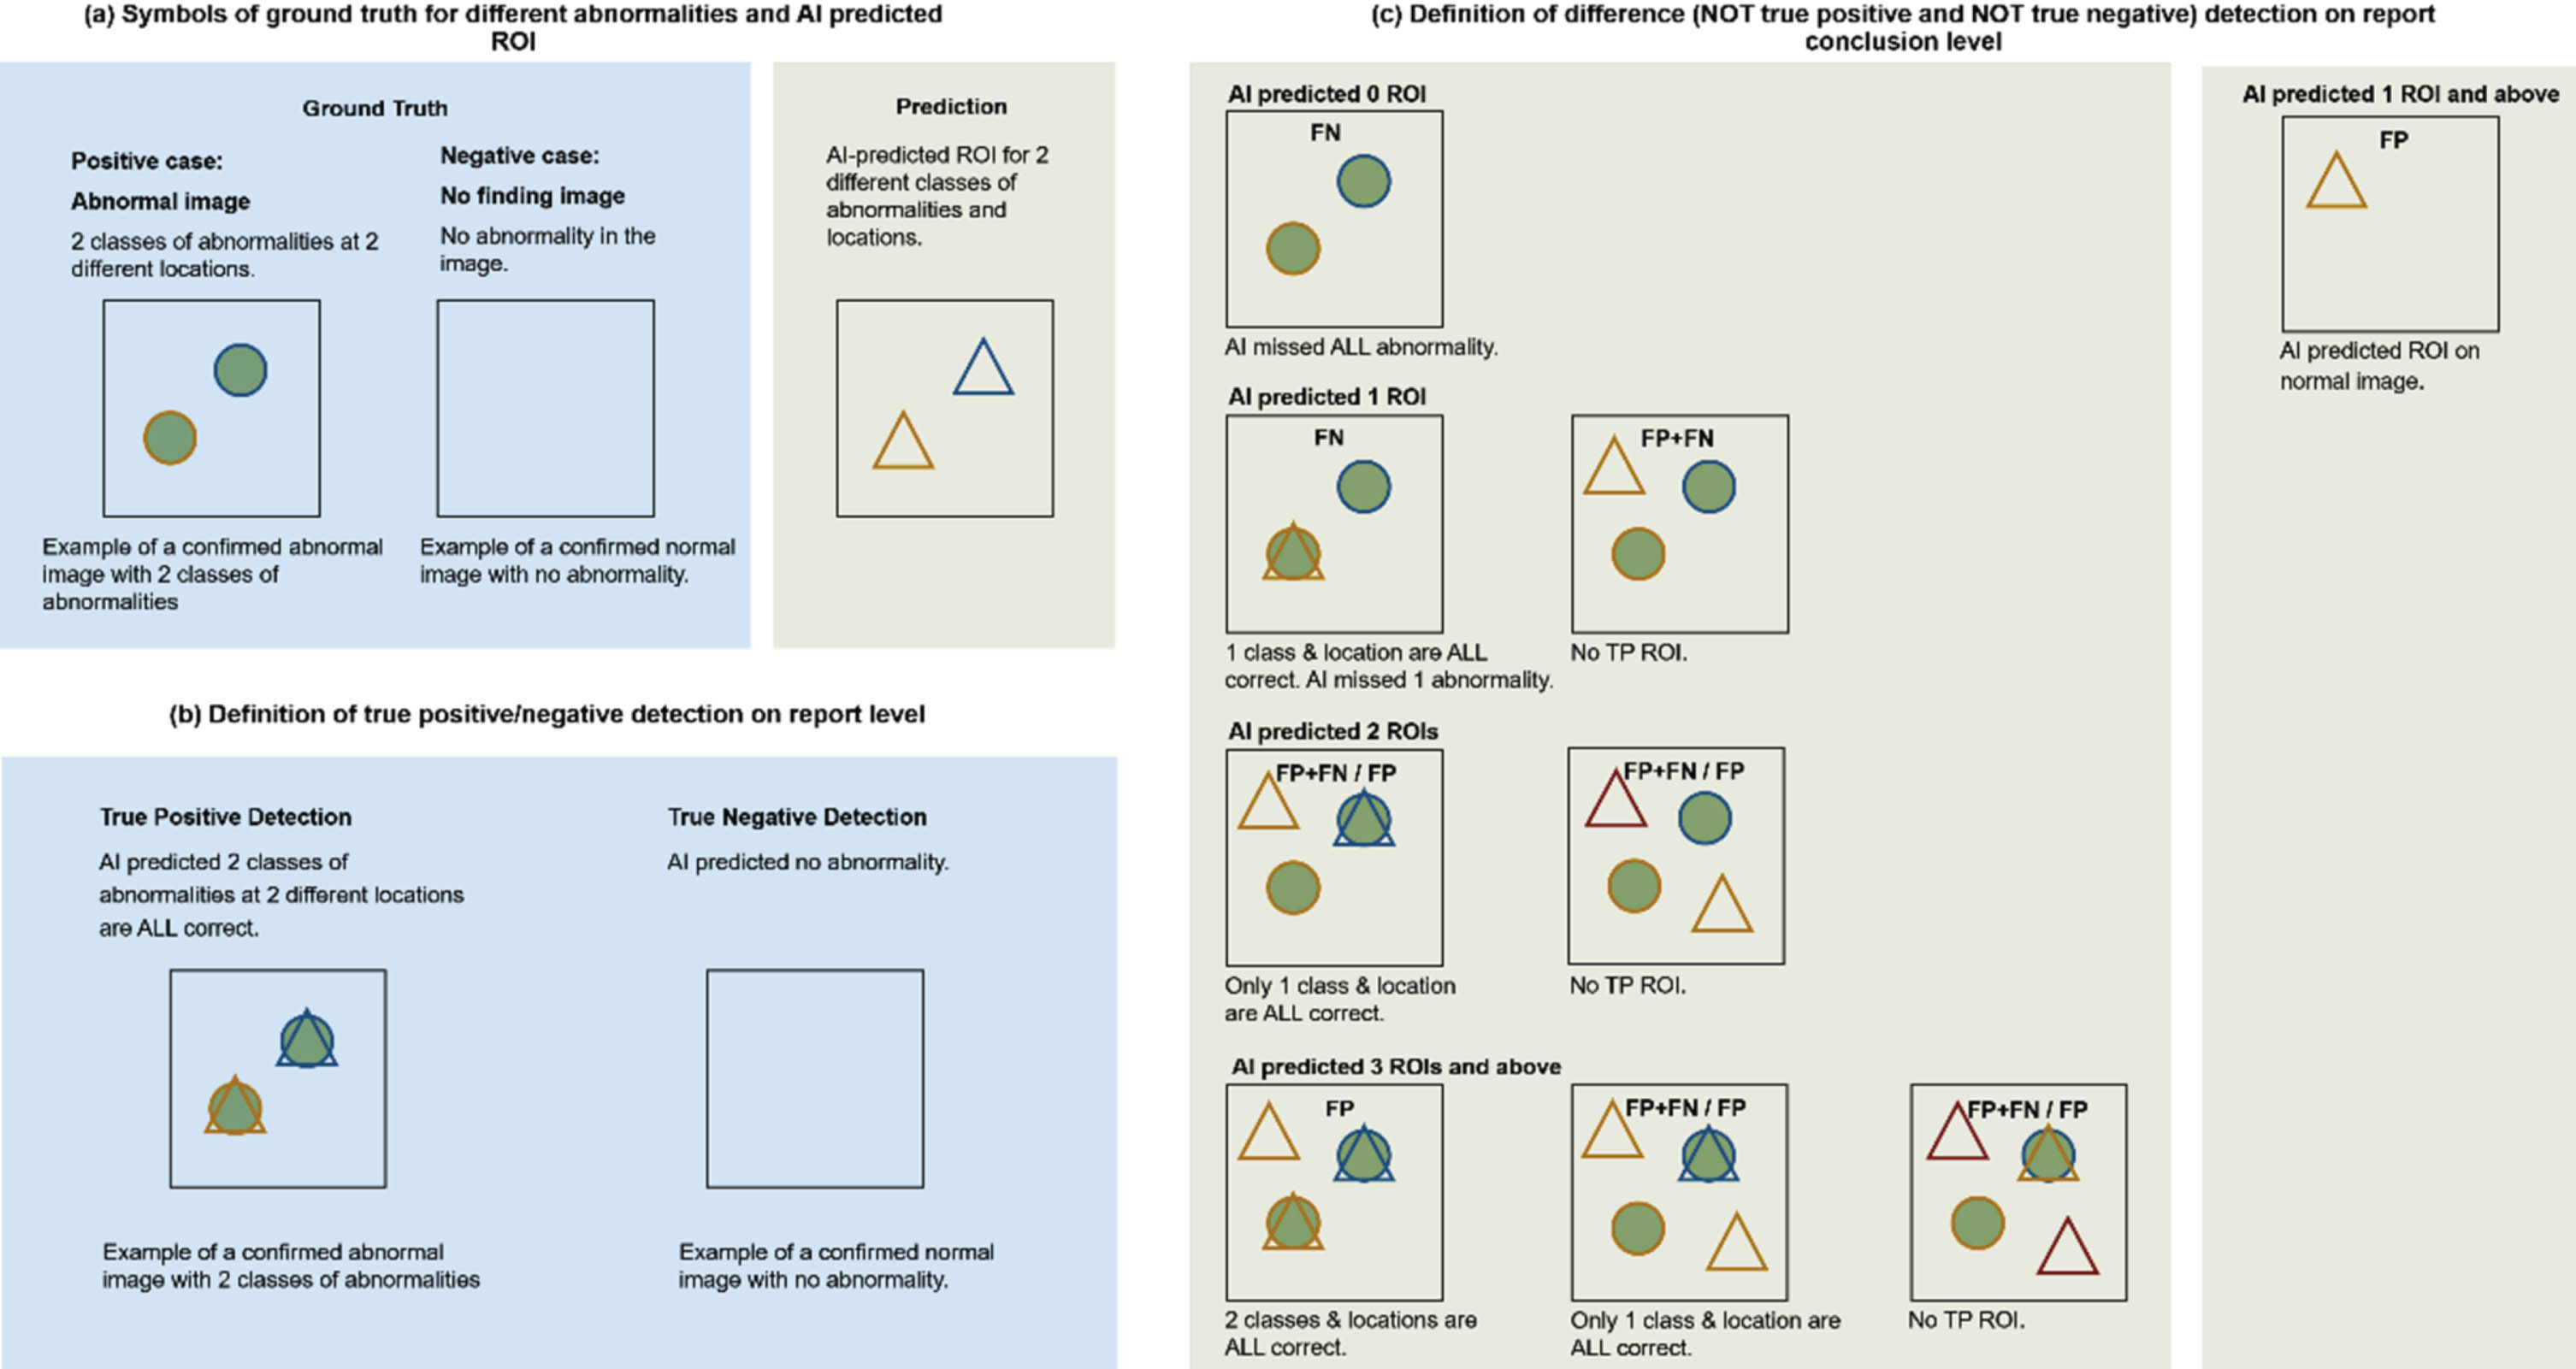
In this MRMC observer performance study, either a radiologist (in G1 mode) or MOM-ClaSeg AI system (in G2 mode) can mark/segment ROIs of different types of lung abnormalities on each CXR image, and then they could appear in report conclusion. In theory, a single conclusion on one CXR image can potentially consist of 0 to 65 different abnormalities and one conclusion can have the same abnormality appearing in multiple locations. For example, one case conclusion on CXR image by MOM-ClaSeg or radiologist may include 2 nodules at different locations and 1 pneumonia ROI. Another case conclusion consisting of 3 nodules at different locations and 1 pneumonia ROI will be treated as a different type of conclusion. Instead of evaluating the performance on detecting each abnormality (ROI level), we evaluate the performance at report conclusion level which means (1) class of abnormality, (2) number of abnormalities, and (3) locations of each abnormality need to be considered. By comparing with the “gold standard” defined by a panel of 3 expert radiologists, the marked/segmented ROIs are categorized into one of the following classes namely, true-positive (TP), true-negative (TN), or difference (NOT TP or NOT TN) ROIs or cases. Figure 3 illustrates how to determine these classes.
Fig. 3
Illustration of defined symbols. (a) and (b) definitions of TP and TN for performance evaluation in ROI and report conclusion-level of this study, respectively. (c) definition of difference (NOT true positive and NOT true negative). For the TP detection, number of total lesions as well as class and location of each lesion need to be identical between ground truth and predicted lesions.
(1) Symbols of ground truth for different abnormalities and AI predicted ROI.
As shown in Fig. 3a, the circle represents ground truth ROI, and the triangle represents AI-predicted ROI. The different color outline represents different classes of abnormalities. An abnormal image with 2 classes of abnormalities is used as an example of positive case.
(2) Definition of TP, TN and their difference (NOT TP or NOT TN) detection on report conclusion level.
Since each image can contain multiple lesions, only if all lesions and their corresponding locations (ROIs) are correctly detected and reported in the conclusion section of the diagnostic report is considered the correct conclusion. For images that do not contain lesions, the report conclusion is considered correct (TN) only when no lesion is reported in the final diagnostic report.
Thus, following the stated symbol explanation in Fig. 3, we define TP, TN and difference (NOT TP or NOT TN) to evaluate the performance at report conclusion level of the MOM-ClaSeg AI system and radiologists. Specifically, a TP is defined as a positive case where all lesions, including the total number, class(es) and location(s), are correctly detected and identified on the image. A TN is defined as a negative case where the final diagnostic report correctly predicts the absence of any lesions on the image (no finding). These definitions provide a standardized and objective approach for evaluating diagnostic performance in the context of two reading modes of this MRMC observer performance study. Note that false positive (FP) and false negative (FN) are not defined and used in this study because when multiple lesions exist on one single image, miss detection at ROI level can be counted simultaneously as FP and FN ROI which will confuse the evaluation of the report conclusion level performance as shown in Fig. 3c.
2.5Quantification and statistical analysis
Although the area under operating characteristics curve (AUC-ROC) is a common index to evaluate performance of radiologists in MRMC observer performance studies, this study is different, it does not require radiologists to rate the probability scores of the detected lesions or abnormalities. Also, traditional AUC-ROC analysis only considers a single abnormality on an image. The study only makes a binary decision of either detection or no detection of the lesions. Therefore, based on the above categorization process and the binary decision, we compute the following three evaluation indices, namely, the detection accuracy (all detected TP and TN cases divided by all reading cases in each mode, G1 or G2), as well as the detection sensitivity and specificity, to perform the evaluation and comparison. Besides, the consumed average time of image reading and report writing, generating and approval in each case is computed and compared between the two reading modes. The statistical data analysis is performed using Python 3.8 and SPSS 20 software tools. In the statistical tests, P < 0.05 is defined as an indicator of statistically significant difference between two compared evaluation index values in both reading modes.
3Results
3.1Clinical characteristics
The main characteristics including age and gender of the patients are shown in Table 3. The control group included 7,845 patients in which 45.1% are male and 54.9% are female with an average age of 38.97±14.98 years, while the experimental group includes 28,526 patients in which 53.3% are male and 46.7% are female with an average age of 36.88±12.86 years. The difference is statistically significant in the patient age (P < 0.001) and gender (P < 0.001) of the two groups.
Table 3
Patient demographics and top 25 report conclusions of the control and experiment groups
| Demographics | Control group (n = 7,845) | Experiment group (n = 28,526) | T/χ2 | P value |
| Age (yr, mean±sd.) | 38.97±14.98 | 36.88±12.86 | 11.239 | < 0.001 |
| Sex (n male) | 3,540 (45.1%) | 15,211 (53.3%) | 166.0 | < 0.001 |
3.2Report conclusion and abnormality distribution analysis on report conclusion level and ROI level
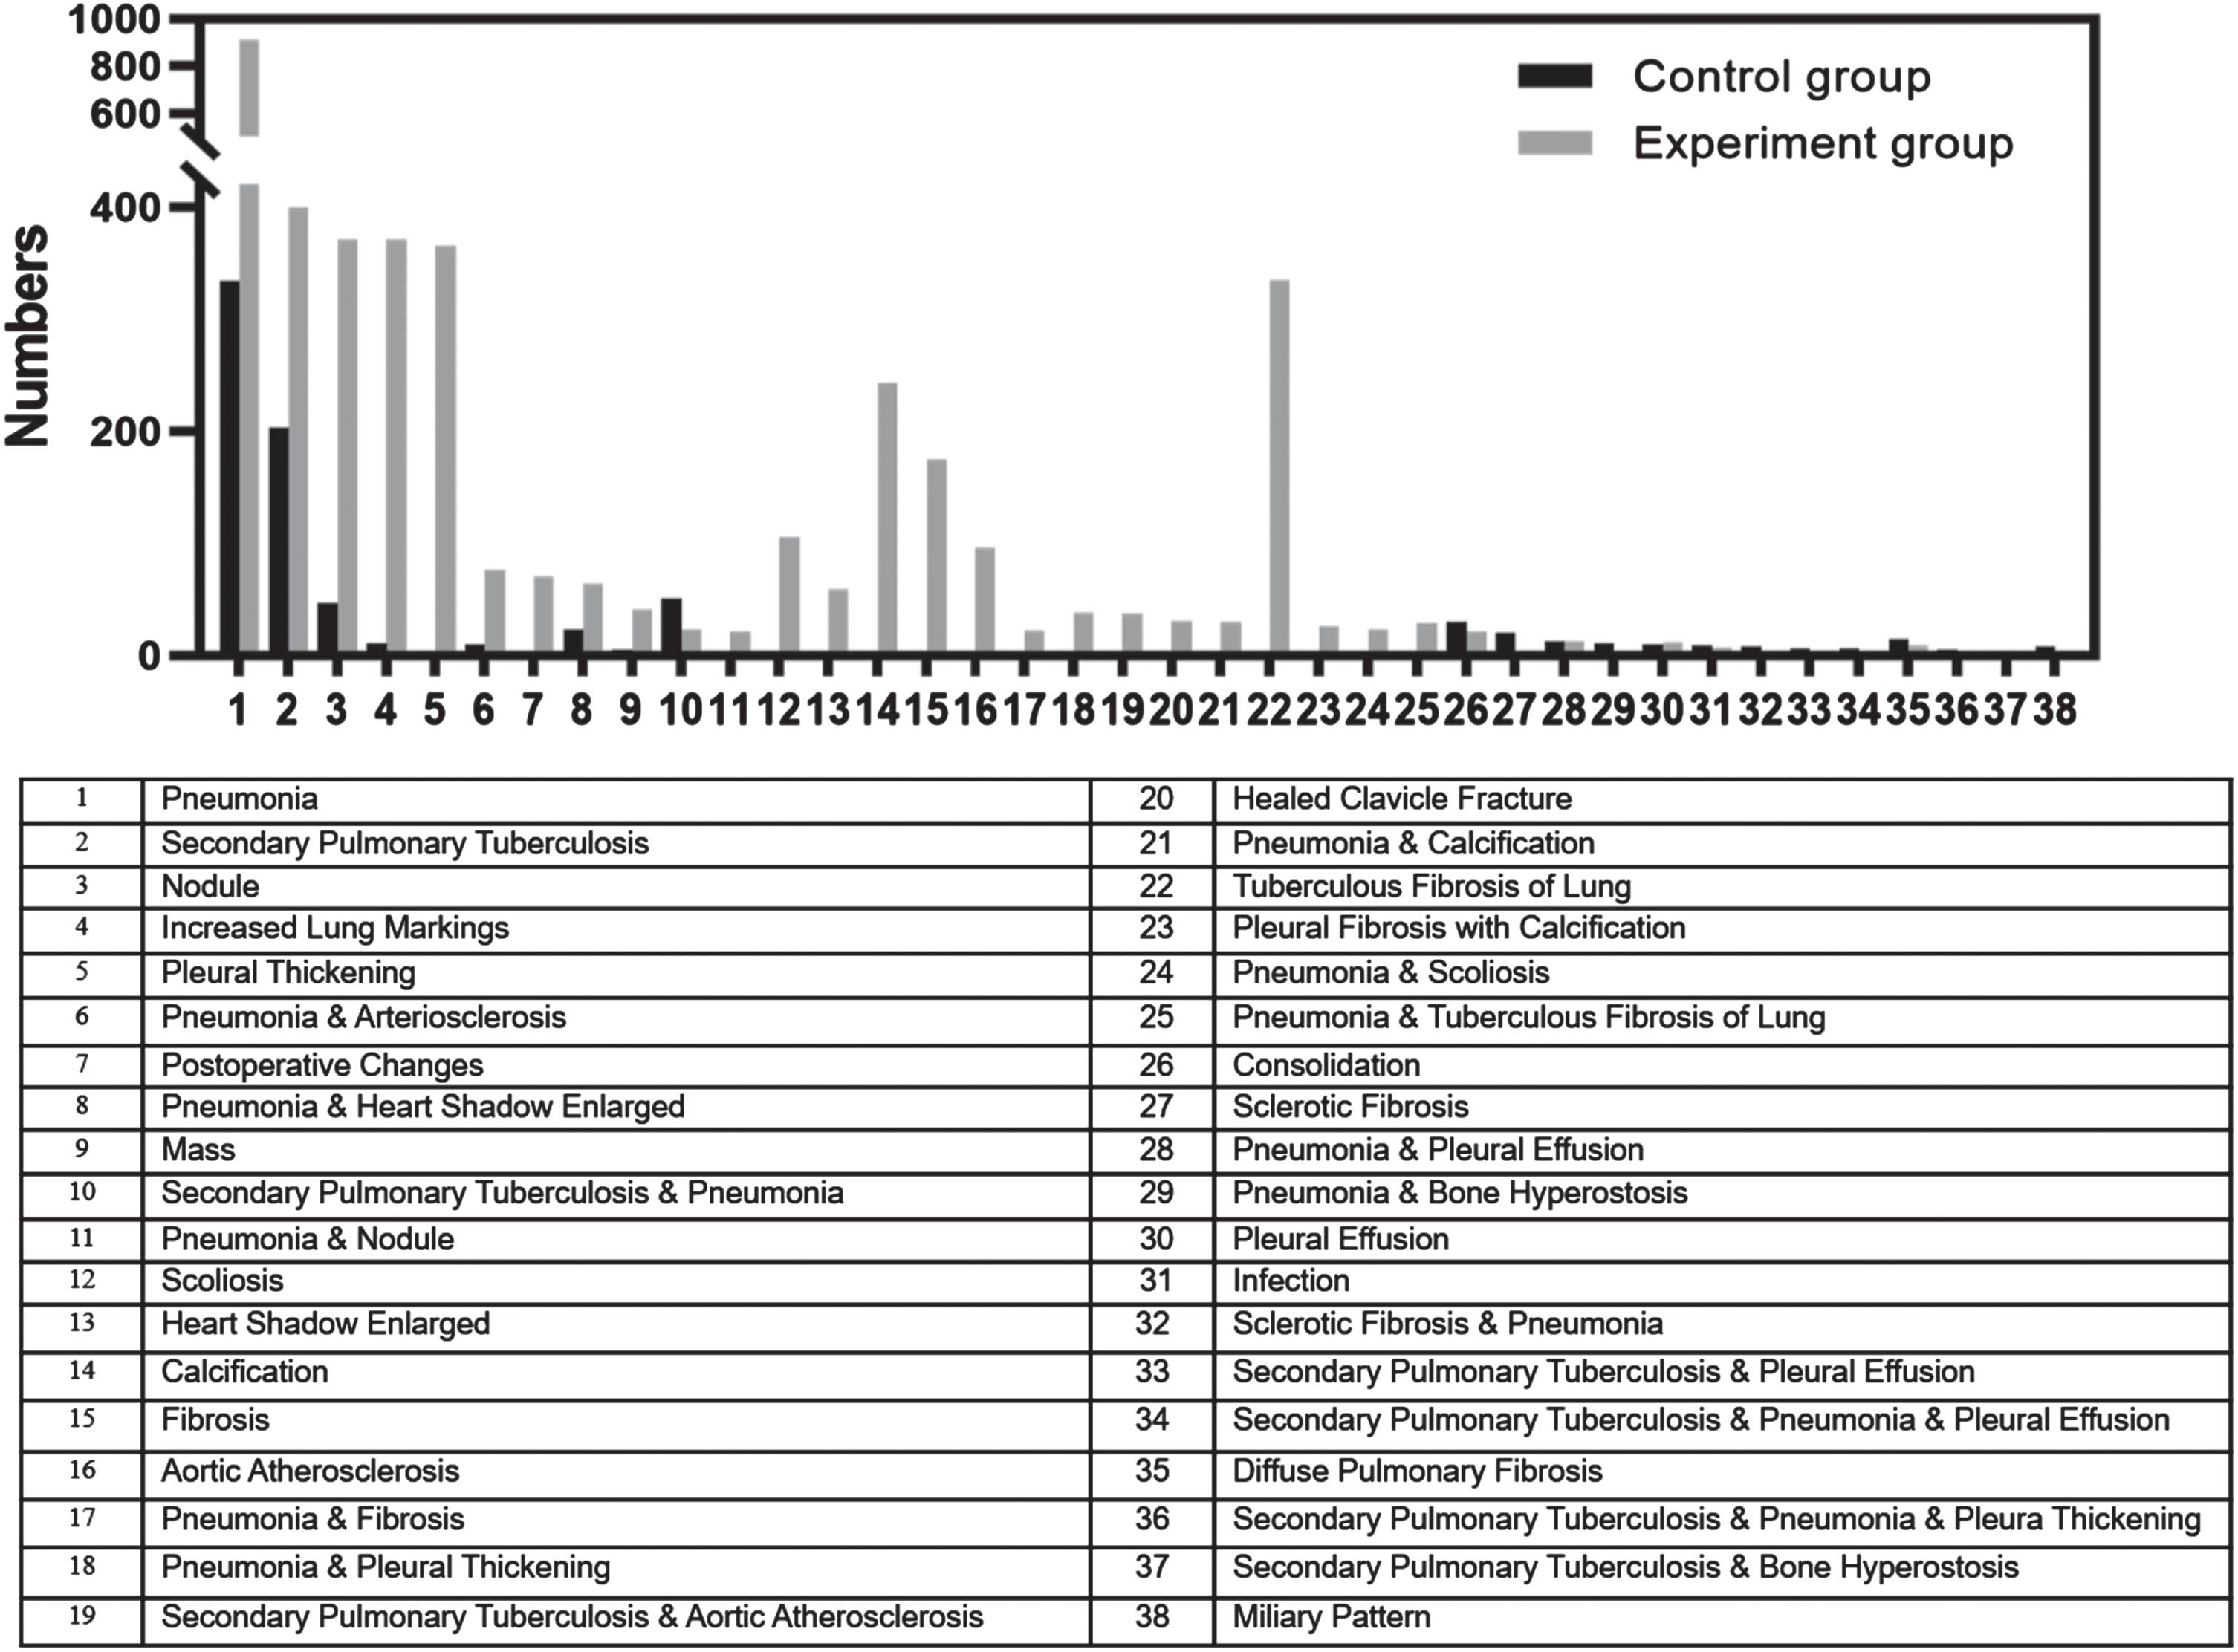
This section analyzes the detection performance for each abnormality at ROI level and at report conclusion level, which means (1) class of abnormality, (2) number of abnormalities, and (3) location of each abnormality need to be considered. As MOM-ClaSeg was evaluated and compared on report conclusion level where a report conclusion on a single CXR image may contain multiple abnormalities as stated earlier, a total of 119 and 420 different classes of report conclusions were eventually generated from the control group and the experiment group, respectively. Different classes of report conclusion are formed based on the combination of multiple different abnormalities. Each class of conclusion is the combination of several abnormalities from a total of 65 abnormalities. For example, one class of conclusion can be tuberculosis, nodule, and pneumonia; while another different class of conclusion can be just tuberculosis and pneumonia. In the analysis, the 25 top report conclusions from 119 and 420 classes of conclusions of each group of two groups were selected. Among those 50 classes of conclusion from two groups, there are 12 common classes of conclusions (overlapped gray and black bars), which results in a total of 38 classes of different report conclusions (38 = 25*2–12) listed in Fig. 4. For both the control and experiment groups, pneumonia, secondary pulmonary tuberculosis and nodule ranked within the top 3 report conclusions (Fig. 4). It happens to be that each class of conclusion only has one abnormality. The remaining report conclusions were different between the two groups. The distribution of all 38 report conclusions and the 12 common report conclusions were found to be significantly different between the two groups (all P < 0.001).
Fig. 4
Distribution of top 25 classes of abnormalities on report conclusion-level for both the control and experiment groups. The two groups had 12 common conclusions (overlapped gray and black bars), resulting in a total of 38 classes of abnormalities (38 = 2*25–12). Among those 38 classes, class 34 and 36 consist of three different abnormalities (secondary pulmonary tuberculosis, pneumonia, and pleural effusion for class 34 and secondary pulmonary tuberculosis, pneumonia, and pleural thickening for class 36) and the rest of the 36 classes consist of either 1 or 2 abnormalities.
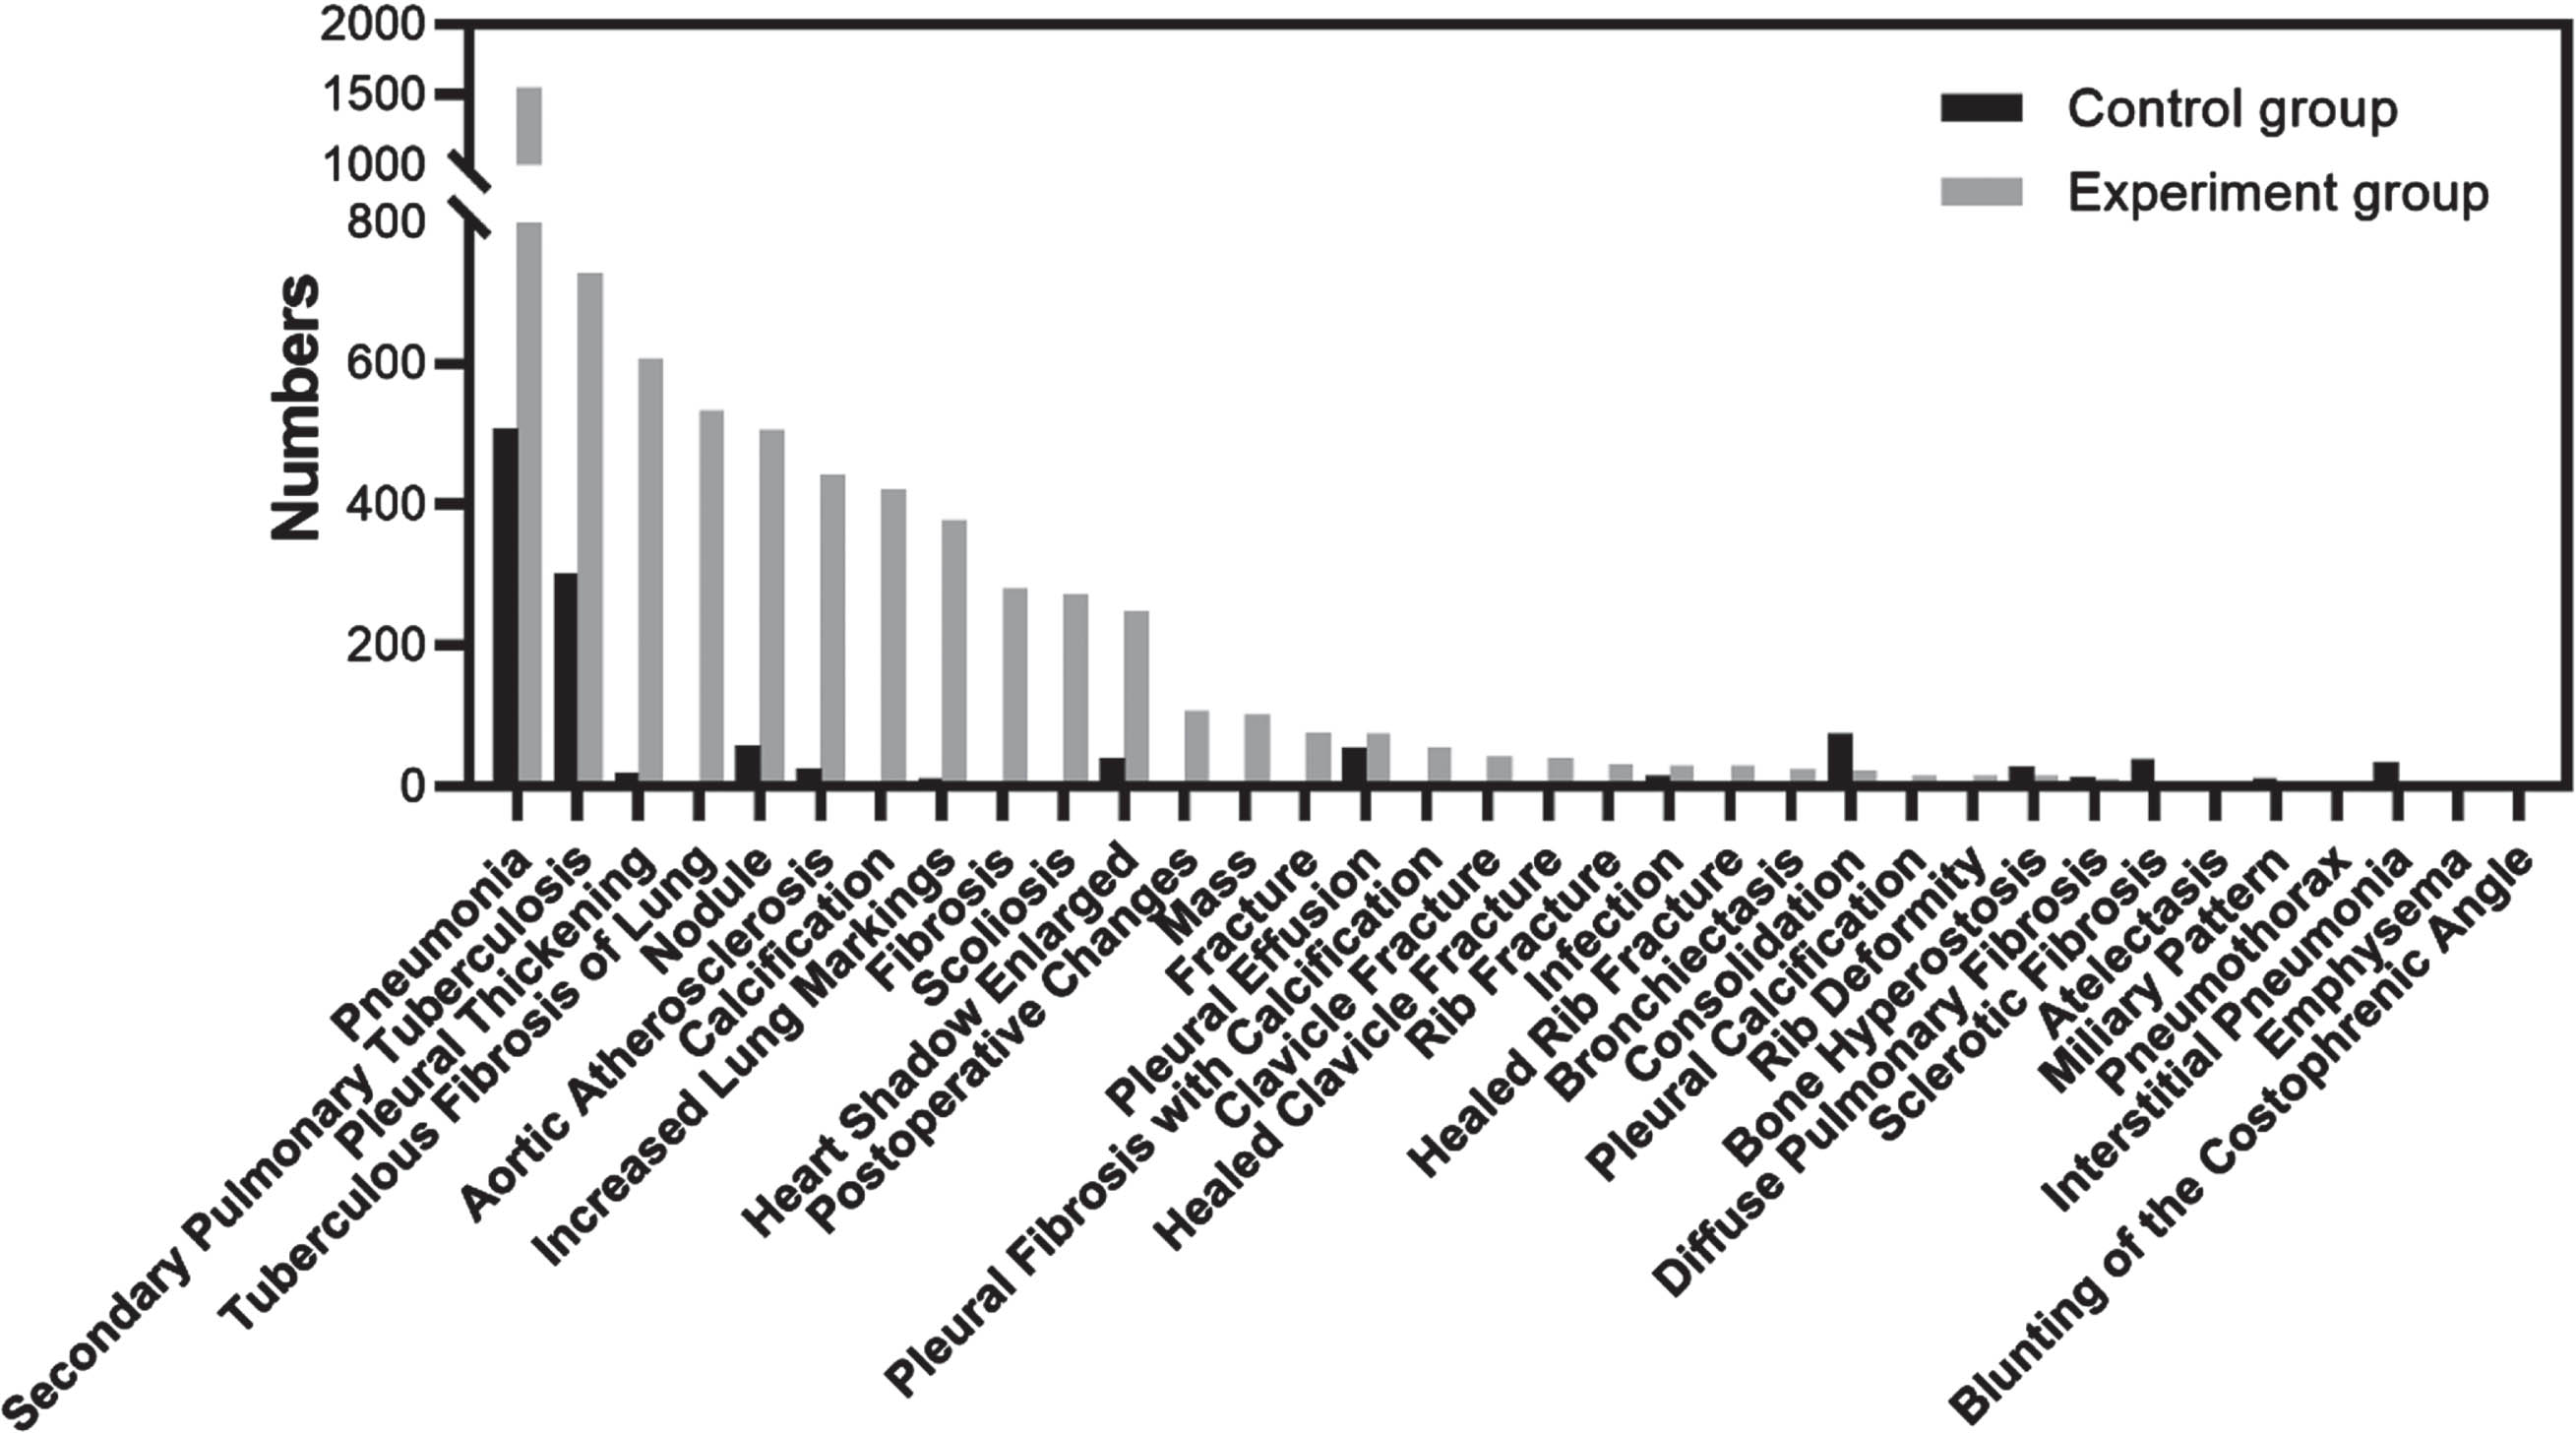
Although MOM ClaSeg is capable of detecting 65 different abnormalities, a total of 48 and 61 classes of abnormalities were eventually generated from the control group and the experiment group, respectively. Similar to report conclusion level, the category of the top 25 classes of abnormalities on ROI level for both the control and experiment groups was also calculated and ranked. Fig. 5 displays the distribution of the top 25 classes for both the control and experiment groups. Among these 50 categories of abnormalities, there are 16 of common abnormalities (overlapped gray and black bars) between the two groups, leading to a cumulative number of 34 classes of abnormalities (34 = 2*25–16). At the ROI level, pneumonia and secondary pulmonary tuberculosis are the top 2 abnormalities in both groups, consistent with the report conclusion level list. However, pleural thickening ranked third on the ROI level list, rather than nodules.
Fig. 5
Distribution of the top 25 classes of abnormalities on ROI-level for both the control and experiment groups. The two groups had 16 common abnormalities (overlapped gray and black bars), resulting in a total of 34 classes of abnormalities (34 = 2*25–16).
3.3Performance comparison between double reading without AI and single reading with AI
Differences on report conclusion level, between expert panel as ground truth and final diagnostic report from the study radiologists were evaluated. Compared with double reading in the control group, the conclusion difference between the gold standard and detection results in the experiment group (single reading with AI-assistance) decreases 43.82% (from 3.40% to 1.91%), 84.69% (from 12.93% to 1.98%) and 9.95% (from 2.11% to 1.90%) in all three scenarios, which included the total cases, abnormal positive cases, and normal negative cases, respectively (Fig. 6). The results suggested that AI was more helpful in interpreting abnormal cases than normal findings for posterior anterior/anterior posterior CXR images in outpatient settings.
Fig. 6
The image review comparison testing flowchart and results for all cases, abnormal positive cases, and normal negative cases.
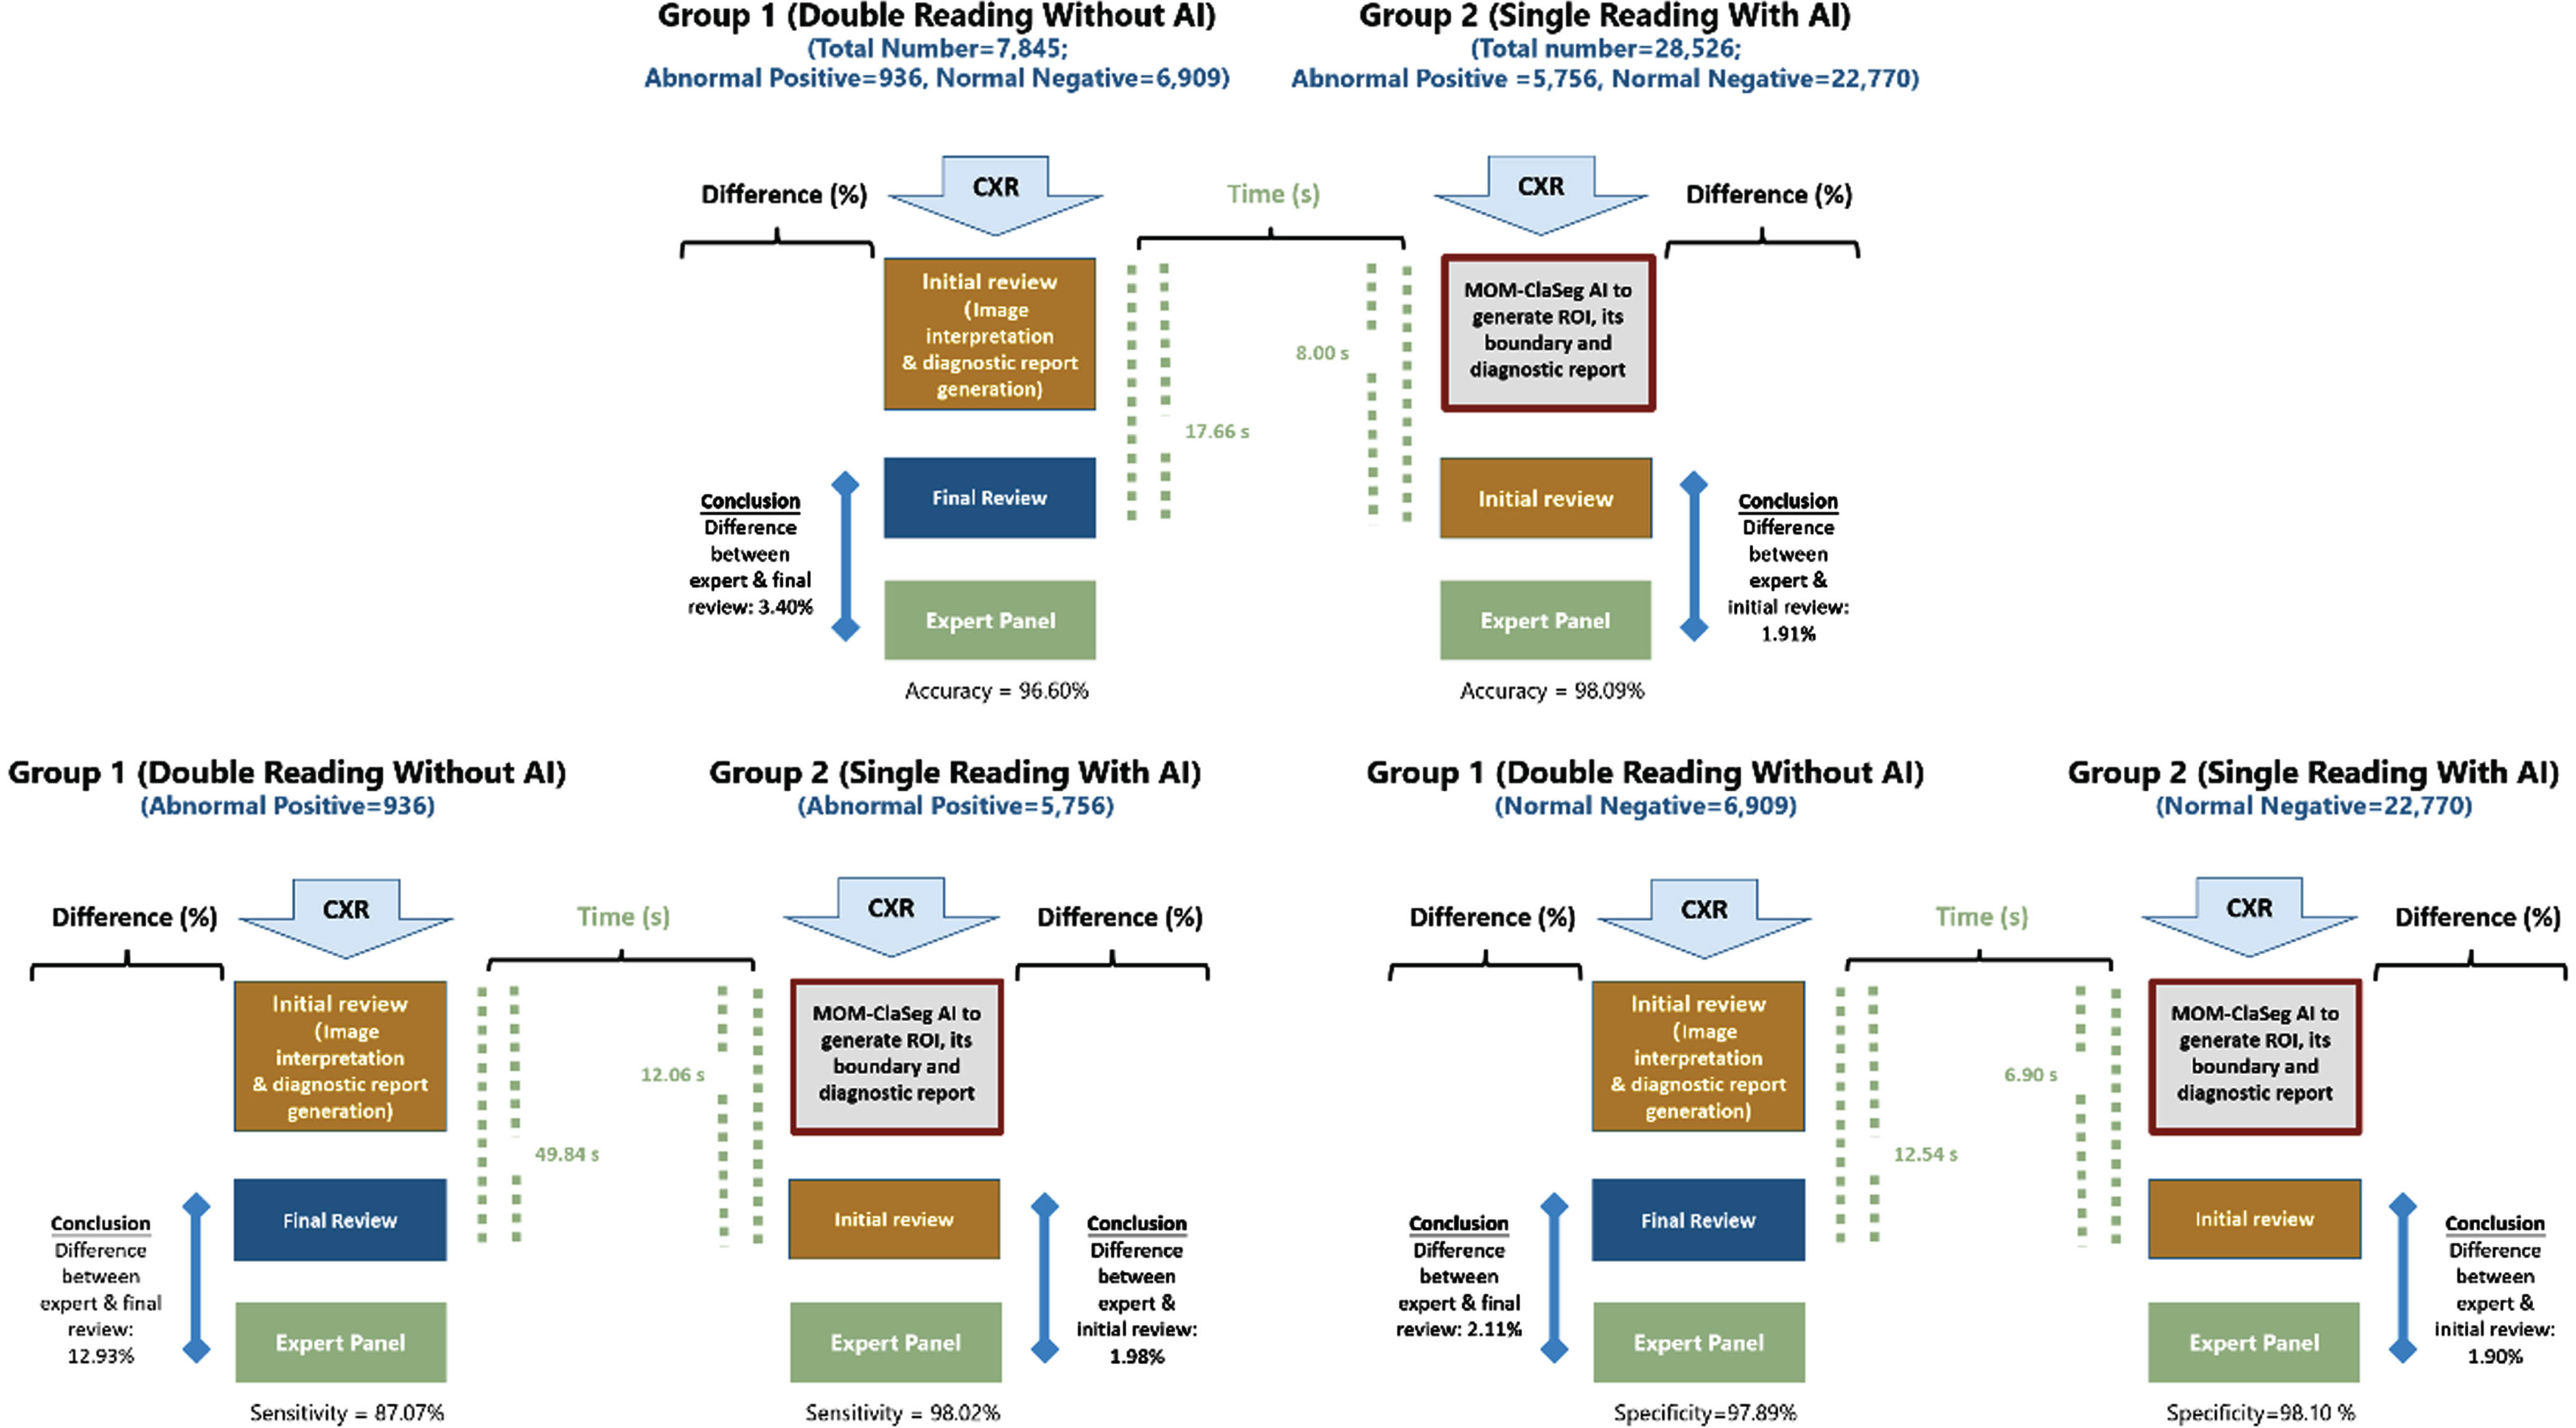
Table 4 demonstrates that the use of MOM-ClaSeg in single reading significantly improves the accuracy and sensitivity when compared to double reading. The accuracy improved by 1.49% (from 96.60% to 98.09%, P < 0.001) and sensitivity by 10.95% (from 87.07% to 98.02%, P < 0.001). The specificity also improved by 0.22%, which is not significantly different (from 97.89% to 98.10%, P = 0.255). Moreover, using MOM-ClaSeg is also found to be effective in reducing radiologists’ overall imaging reading and report review or approval time. The average time for the first radiologist to review a MOM-ClaSeg AI-generated report in the experiment group was 8.00 s, which is much less than that of the second radiologist to review the diagnostic reports generated by the first junior radiologist in the control group (17.66 s) (Table 5). These results suggest that using MOM-ClaSeg has potential as the first reader in pulmonary abnormality triaging, which could improve the efficiency of the final reviewer.
Table 4
Performance comparison of the control and experiment groups
| Performance index (including 95% CI – confidence interval) | Control group | Experiment group | Difference | P value |
| Accuracy | 96.60% (95.02% –97.64%) | 98.09% (95.84% –99.37%) | 1.49% | < 0.001 |
| Sensitivity | 87.07% (84.77% –89.08%) | 98.02% (96.35% –98.85%) | 10.95% | < 0.001 |
| Specificity | 97.89% (96.42% –98.71%) | 98.10% (94.82% –99.21%) | 0.22% | 0.255 |
Table 5
Review time comparison of the control and experiment groups
| Control group | Experiment group | Change rate | P value | |
| Average time of abnormal cases | 49.84±40.77 s | 12.06±21.08 s | 75.80% | < 0.001 |
| Average time of normal cases | 12.54±17.85 s | 6.90±13.77 s | 44.98% | < 0.001 |
| Total average time | 17.66±21.78 s | 8.00±15.76 s | 54.70% | < 0.001 |
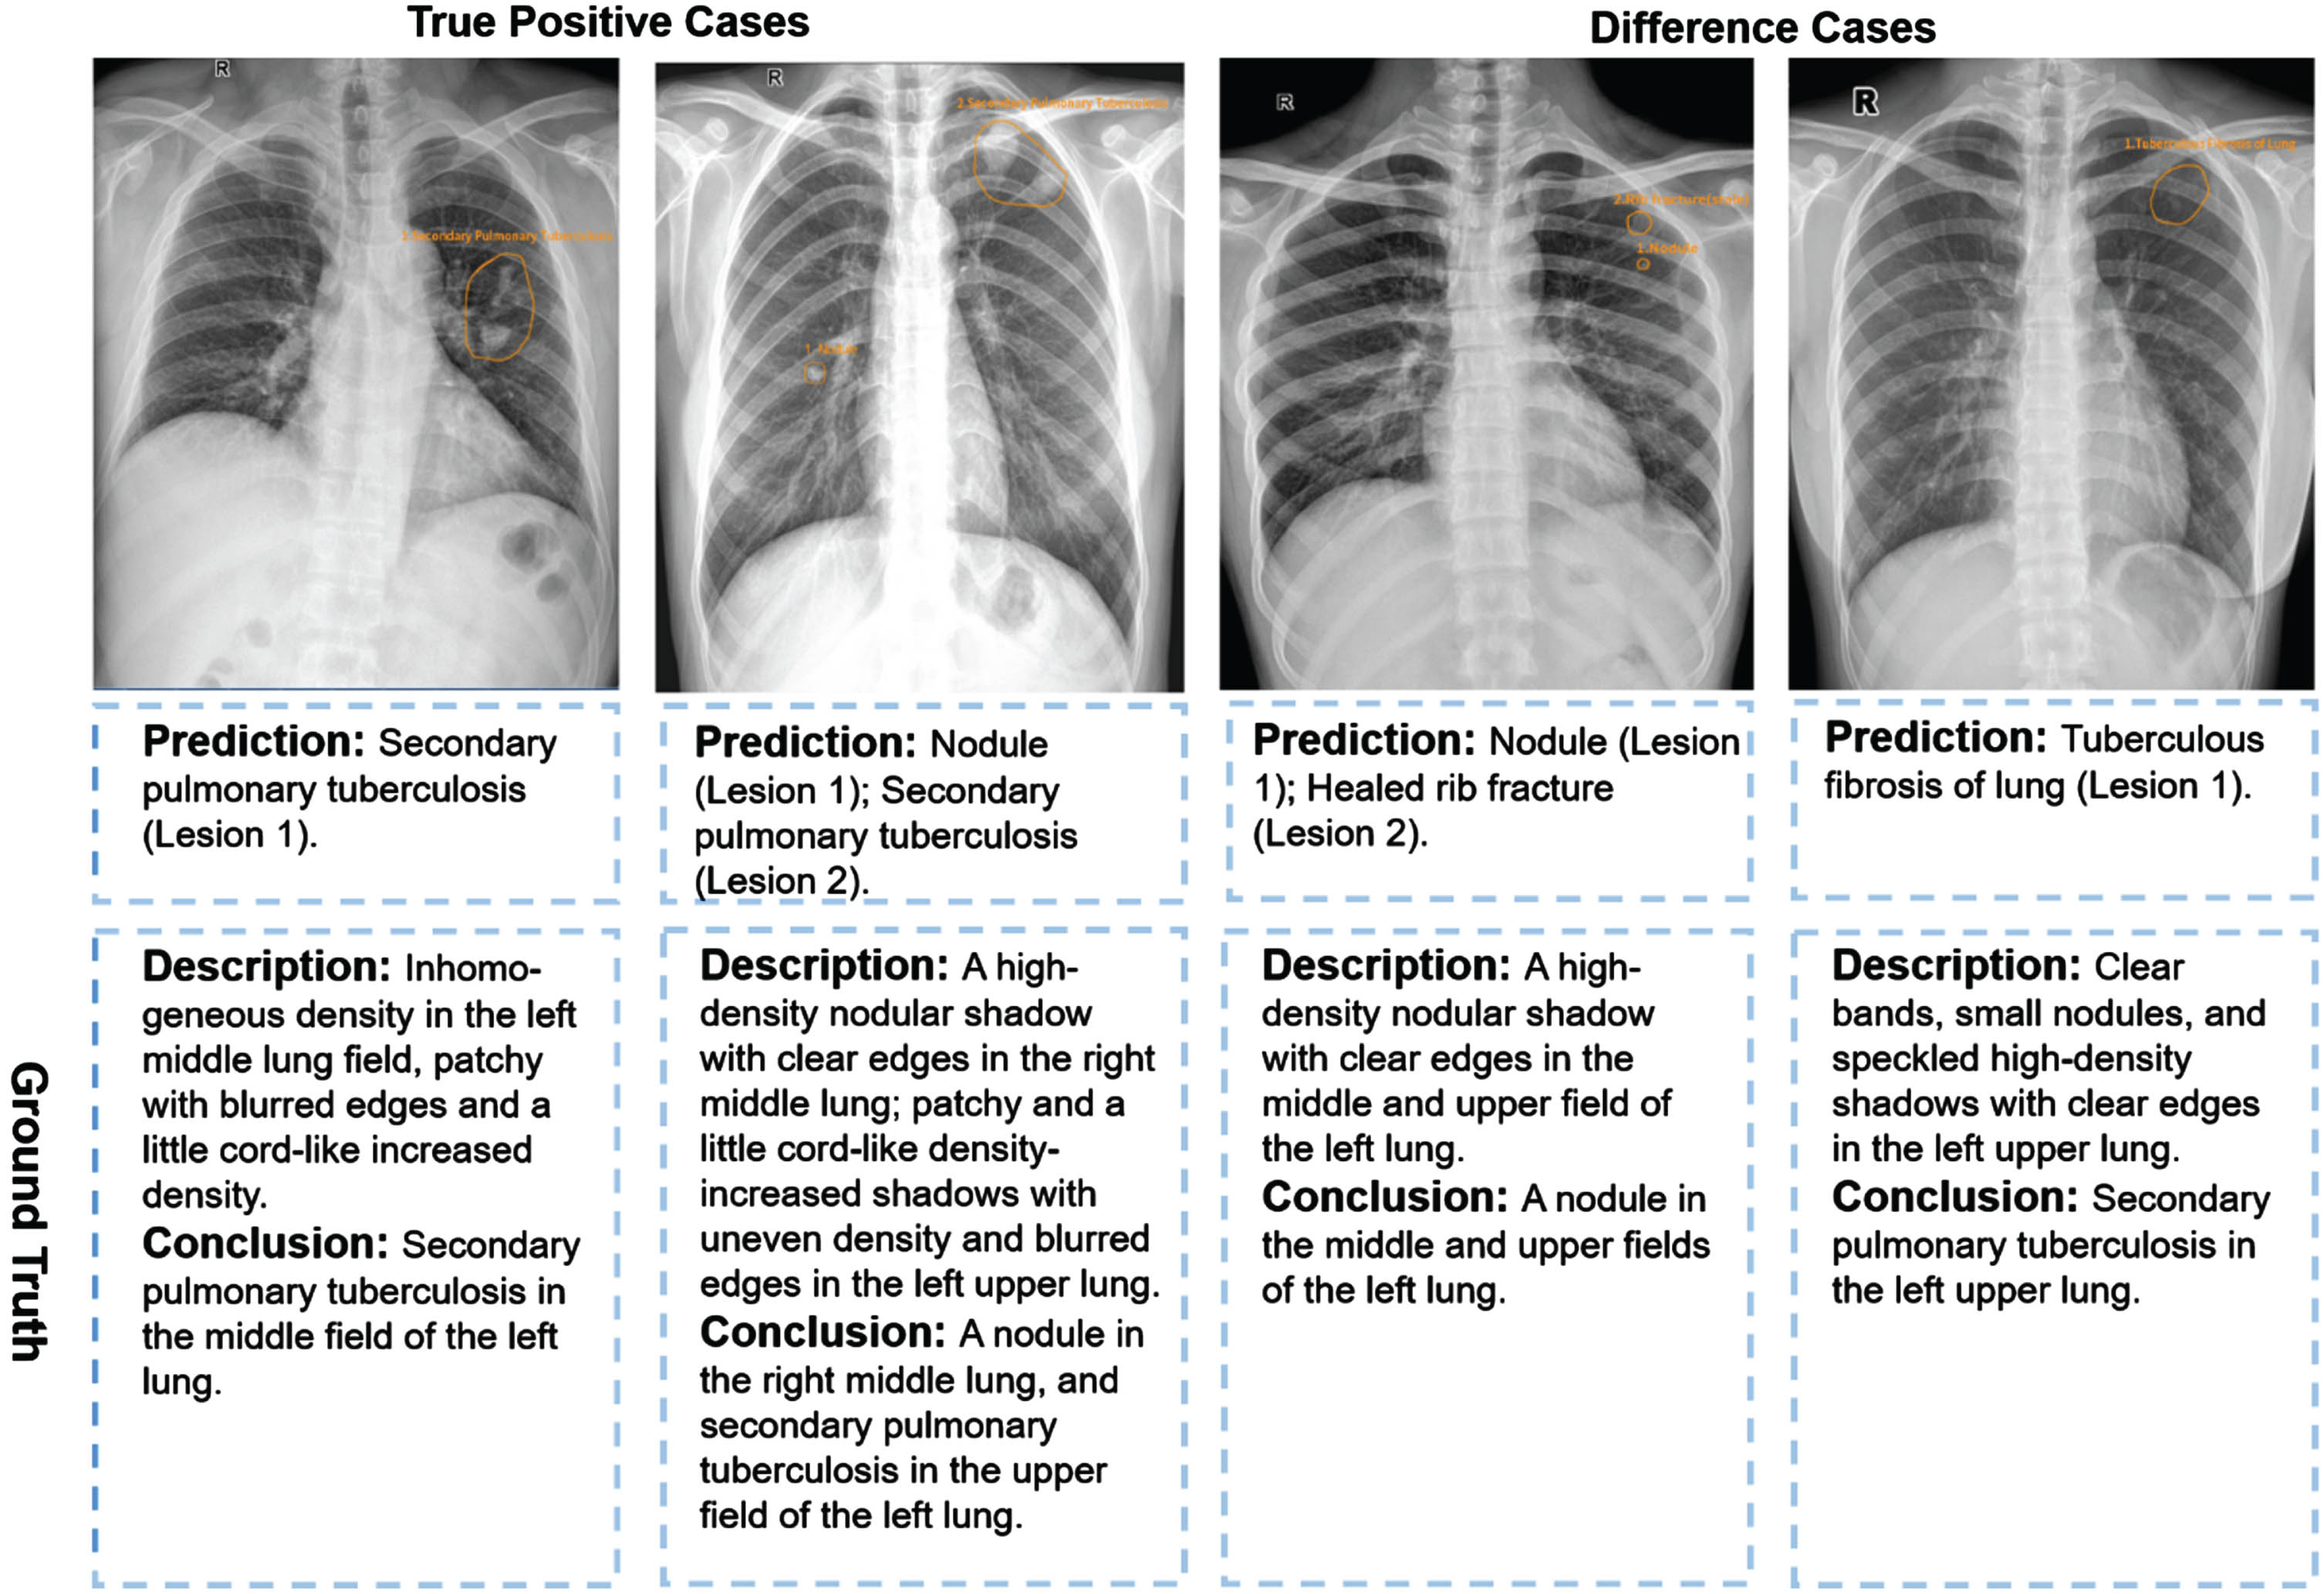
It is worth noting that the MOM-ClaSeg is particularly helpful in identifying abnormalities, both in terms of accuracy and efficiency. The degree of decrease in conclusion difference for abnormal cases is more than 8 times (84.69% /9.95% =8.51) that of normal cases. We present representative cases of accuracy and difference results detected by MOM-ClaSeg in Fig. 7. In terms of the efficiency of diagnosis time, the improvement for abnormal cases is also nearly twice that of normal cases. These findings suggest that MOM-ClaSeg can significantly improve the detection accuracy and reduce the review time in identifying abnormalities, making it a potentially useful tool for assisting radiologists in future clinical settings.
Fig. 7
Examples of two true positive cases and two difference cases for the experiment group. Yellow outlines were annotated by the MOM-ClaSeg AI system.
4Discussion
Reading and interpreting CXR images depicting possibly multiple lung abnormalities or diseases and then writing diagnostic reports is a challenging and time-consuming task for radiologists, which requires a high level of expertise. Therefore, the development of an effective and robust AI system that can assist radiologists in detecting multiple abnormalities and generating diagnostic reports for CXRs could significantly improve the efficiency and accuracy of radiology reporting. In this paper, we report a unique and successful MRMC observer performance study that demonstrates the feasibility and advantages of using our recently developed MOM-ClaSeg AI system to assist radiologists in reading CXR images and generating final diagnostic reports.
In the medical imaging or informatics field, the application of AI has been increasingly studied aiming to assist radiologists in their diagnostic work. However, most of the current research in this field has focused on specific abnormalities or diseases, such as pulmonary nodules, tuberculosis, and pneumonia, separately, which limits the generalizability of these approaches [6, 13, 14, 17], as they may not reflect the complexity and diversity of real-world cases. Although a small number of studies and existing commercial solutions addressed the simultaneous classification of multiple CXR abnormalities recently, the involved classes of abnormalities were often less than ten [18, 19]. Moreover, the performance evaluation of AI model still focuses on ROI level where each CXR case only contains one positive ROI. However, in real-world practice, a CXR image without identification of the targeted ROIs cannot be interpreted as a normal case. Radiologists need to interpret CXR images to identify as many types of abnormalities as possible [19, 20], and relying on existing AI to assist in detecting only specific types of abnormalities independently is insufficient. Additionally, radiologists still need to confirm the AI results and write a diagnostic report, which is a time-consuming task. This highlights the need for an AI system that can assist radiologists in detecting multiple abnormalities simultaneously in each CXR image and generating diagnostic reports, thus improving their efficiency and accuracy.
The MOM-ClaSeg AI system used in this study has several major advantages, which can make new contributions to this research field. First, the MOM-ClaSeg AI system detects multiple abnormalities in CXR images, which is a significant departure from previous studies that focused on individual abnormalities or diseases. Second, the MOM-ClaSeg AI system allows to automatically generate diagnostic reports. Writing diagnostic reports is a tedious and time-consuming task for radiologists. The MOM-ClaSeg’s automatic report generation feature reduces the workload of radiologists and ensures accurate reports. It is a significant breakthrough as it can help in the early detection and diagnosis of pulmonary abnormalities or diseases, ultimately leading to better patient outcomes. Third, MOM-ClaSeg AI has an easy-to-use, interactive GUI, which can show both ROI level and case or image-level detection and diagnostic results. Thus, the MOM-ClaSeg AI system provides much more explainable information of the detection or diagnostic results to radiologists than many previous AI systems that use “black-box” approaches. As a result, by utilizing this new AI system, radiologists can save time and effort on routine tasks, allowing them to focus on more complex cases that require their expertise. MOM-ClaSeg can enhance diagnostic sensitivity by detecting more abnormalities that may have been missed by traditional interpretation methods.
Our MRMC observer performance study also has several unique characteristics aiming to more effectively test and demonstrate the potential clinical utility of the MOM-ClaSeg AI system, which focuses on detecting multiple abnormalities and the evaluation at the report conclusion level. The evaluation methodology commonly used for assessing AI algorithms involves popular AI metrics like AUC-ROC or F-scores for label-based precision and recall evaluations. However, when it comes to actual clinical workflow, minimizing the number of overall errors or misses on a per-image basis is more important. Multiple abnormalities may co-exist in one final diagnostic report, and the number of types of abnormalities present in a single CXR image may be quite large. This suggests that the evaluation methods used for AI algorithms should better be evaluated for clinical purposes based on image-level sensitivity and specificity instead of ROI level evaluations. To address this issue, we redefine the terms true positive, true negative, and difference (NOT true positive or NOT true negative) in our study with both the class and location of each AI-predicted ROI involved. This is in contrast to traditional studies that focus on a specific type of abnormality or disease and rely on single-level evaluation methods. By taking the more comprehensive approach, we believe that this MRMC observer performance study can more effectively mimic future clinical application of the MOM-ClaSeg AI system to significantly improve the accuracy and efficiency of radiology diagnosis. In addition, the distribution of abnormalities is displayed on both report conclusion level and ROI level, which allows radiologists to not only assess the probability of occurrence of each abnormality but also examine the correlation among different types of pulmonary abnormalities present in a single CXR image. This comprehensive evaluation is an advantage of our approach in this MRMC study, as it provides a more detailed understanding of the relationships among abnormalities and can aid radiologists in making an accurate diagnosis.
Overall, this is a unique MRMC observer performance study with a quite large and diverse CXR image dataset. To the best of our knowledge, no similar studies have been conducted and reported in the literature to date. Data analysis results of this study are encouraging and demonstrate that the MOM-ClaSeg AI system has the potential to add value to many clinical application. For example, in rural or resource-limited areas, access to specialized medical professionals and advanced technology may be limited, leading to delayed diagnoses and treatments. The results of this MRMC study indicate that single reading with AI outperforms double reading in detecting heterogenous and multiple lung abnormalities, which may alleviate the scarcity of radiologists in such areas and improve the quality and accessibility of CXR image diagnosis. Therefore, MOM-ClaSeg’s ability to assist radiologists in automatically detecting multiple abnormalities and generating diagnostic reports on CXR images may help overcome many existing clinical barriers, potentially leading to faster and more accurate diagnoses and improved patient outcomes.
Despite our encouraging results, we also recognize several limitations in this study. First, it is an unpaired and unbalanced study, with two consecutive months of control group data (double reading) and another two consecutive months of experimental group data (single reading with MOM-ClaSeg) for retrospective comparison tests. We, however, still consider this as a major distinction of our study since the results have demonstrated the feasibility of MOM-ClaSeg’s assistance in detecting multiple abnormalities on CXR images with statistically significant improvement in efficacy. Second, our performance evaluation methods differ from many previous MRMC observer performance studies, with only accuracy, sensitivity, and specificity used since we defined only TP, TN, and difference. False positive and false negative ROI may co-exist in one CXR image, as our approach focuses on multiple abnormalities, so that we were unable to provide F1 score and AUC-ROC measurements. Third, AI reading time including loading, operation, analyzing and report generation time was not presented separately, and the justification time of the AI tool. As the objective of the research is to access the role of AI as an aid tool in the double reading process, the reading time of the AI (first reader) and radiologist (second reader) was calculated together to compare with the time spent in the traditional double reading routine. In future work, we plan to conduct a paired study and calculate the time AI spent at each process to further evaluate the clinical potential of this new AI system, investigate radiologists with different levels of experience using MOM-ClaSeg, and include lateral CXR images in the analysis.
5Conclusion
This research paper presents a unique MRMC observer performance study using the AI-based system MOM-ClaSeg, which can detect multiple abnormalities simultaneously and generate diagnostic reports automatically, to assist radiologists in CXR image interpretation and diagnostic report generation. The study demonstrates the feasibility of using this new AI system as the first reader to help improve diagnostic accuracy and efficiency of a single radiologist. This is an important and promising step toward applying AI systems to help improve diagnostic performance and productivity of radiologists in future clinical practice. Particularly, the MOM-ClaSeg AI system could be a valuable tool in rural or underdeveloped areas where there is a shortage of radiologists. To fully achieve this goal, additional clinical evaluation studies are needed using new image databases and involving other radiologists from different medical institutions in the future.
Acknowledgments
Authors would like to acknowledge the support of the Lister Hill National Center for Biomedical Communications of the National Library of Medicine (NLM), National Institutes of Health.
Funding
This work was supported by the Shenzhen Science and Technology Program [Grant No.: KQTD2017033110081833; JCYJ20220531093817040], the Guangzhou Science and Technology Planning Project [Grant No.: 2023A03J0536; 2024A03J0583], the 2020 Annual Project of National Science and Technology Major Project on Prevention and Treatment of AIDS and Viral Hepatitis [Grant No.: 2020ZX10001013], and the Beijing You’an Hospital Affiliated to Capital Medical University 2022 In-hospital Incubator Project for Young and Middle-aged Talents [Grant No.: BJYAYY-YN2022-24].
Conflict of interest
The authors declare that the research was conducted in the absence of any commercial or financial relationships that could be construed as a potential conflict of interest. Authors LG and LX are employed by the company Shenzhen Zhiying Medical Imaging. Author FYML is a stockholder of the company Shenzhen Zhiying Medical Imaging. The other authors have no conflicts of interest to declare.
References
[1] | Heriot G.S. , McKelvie P. , Pitman A.G. Diagnostic errors in patients dying in hospital: radiology’s contribution, J. Med. Imaging Radiat. Oncol. 53: (2) ((2009) ), 188–193. |
[2] | Donald J.J. , Barnard S.A. Common patterns in 558 diagnostic radiology errors, J. Med. Imaging Radiat. Oncol. 56: (2) ((2012) ), 173–178. |
[3] | Dinnes J. , Moss S. , Melia J. et al. Effectiveness and cost-effectiveness of double reading of mammograms in breast cancer screening: findings of a systematic review, Breast (Edinburgh, Scotland) 10: (6) ((2001) ), 455–463. |
[4] | Anderson E.D. , Muir B.B. , Walsh J.S. et al. The efficacy of double reading mammograms in breast screening, Clin Radiol 49: (4) ((1994) ), 248–251. |
[5] | Lindgren E.A. , Patel M.D. , Wu Q. et al. The clinical impact of subspecialized radiologist reinterpretation of abdominal imaging studies, with analysis of the types and relative frequency of interpretation discrepancies, Abdom. Imaging 39: (5) ((1119) ), 1119–1126. |
[6] | Zhou W. , Cheng G. , Zhang Z. et al. Deep learning-based pulmonary tuberculosis automated detection on chest radiography: large-scale independent testing, Quant Imag Med Surg 12: (4) ((2344) ), 2344–2355. |
[7] | Jin H.E. , Sunggyun P. , Kwang-Nam J. et al. Development and Validation of a Deep Learning–based Automatic Detection Algorithm for Active Pulmonary Tuberculosis on Chest Radiographs, Clin Infect Dis 69: (5) ((2019) ), 739–747. |
[8] | Zhang G. , Yang Z. , Gong L. et al. Classification of benign and malignant lung nodules from CT images based on hybrid features, Phys Med Biol 64: (12) ((2019) ), 125011. |
[9] | Esteva A. , Kuprel B. , Novoa R.A. et al. Dermatologist-level classification of skin cancer with deep neural networks, Nature 542: (7639) ((2017) ), 115–118. |
[10] | Gulshan V. , Peng L. , Coram M. et al. Development and validation of a deep learning algorithm for detection of diabetic retinopathy in retinal fundus photographs, JAMA 316: (22) ((2402) ), 2402–2410. |
[11] | Liang M. , Tang W. , Xu D.M. et al. Low-Dose CT Screening for Lung Cancer: Computer-aided Detection of Missed Lung Cancers, Radiology 281: (1) ((2016) ), 279–288. |
[12] | Nijiati M. , Zhang Z. , Abulizi A. et al. Deep learning assistance for tuberculosis diagnosis with chest radiography in low-resource settings, J X-Ray Sci Technol 29: (5) ((2021) ), 785–796. |
[13] | Gupta A. , Sheth P. , Xie P. Neural architecture search for pneumonia diagnosis from chest X-rays, Sci Rep 12: (1) ((2022) ), 11309. |
[14] | Schultheiss M. , Schmette P. , Bodden J. et al. Lung nodule detection in chest X-rays using synthetic ground-truth data comparing CNN-based diagnosis to human performance, Sci Rep 11: (1) ((2021) ), 15857. |
[15] | Pasa F. , Golkov V. , Pfeiffer F. et al. Efficient deep network architectures for fast chest X-Ray tuberculosis screening and visualization, Sci Rep 9: (1) ((2019) ), 6268. |
[16] | Guo L. , Hong K. , Xiao Q. et al. Developing and assessing an AI-based multi-task prediction system to assist radiologists detecting lung diseases in reading chest x-ray images, SPIE 12467: ((2023) ), 1–18. |
[17] | Cai J. , Guo L. , Zhu L. et al. Impact of localized fine tuning in the performance of segmentation and classification of lung nodules from computed tomography scans using deep learning, Front. Oncol. 13: ((2023) ), 1140635. |
[18] | Park S. , Lee S.M. , Lee K.H. et al. Deep learning-based detection system for multiclass lesions on chest radiographs: comparison with observer readings, Eur Radiol 30: (3) ((2020) ), 1359–1368. |
[19] | Sung J. , Park S. , Lee S.M. et al. Added value of deep learning–based detection system for multiple major findings on chest radiographs: A randomized crossover study, Radiology 299: (2) ((2021) ), 450–459. |
[20] | WHO, International Classification of Diseases, Eleventh Revision (ICD-11), (2021) . |


