
Photothermal effect in X-ray images for computed tomography of metallic parts: Stainless steel spheres
Abstract
BACKGROUND:
The environmental impact on industrial X-ray tomography systems has gained its attention in terms of image precision and metrology over recent years, yet is still complex due to the variety of applications.
OBJECTIVE:
The current study explores the photothermal repercussions of the overall radiation exposure time. It shows the emerging dimensional uncertainty when measuring a stainless steel sphere by means of circular tomography scans.
METHODS:
The authors develop a novel frame difference method for X-ray radiographies to evaluate the spatial changes induced in the projected absorption maps on the X-ray panel. The object of interest has a simple geometry for the purpose of proof of concept. The dominant source of the observed radial uncertainty is the photothermal effect due to high-energy X-ray scattering at the metal workpiece. Thermal variations are monitored by an infrared camera within the industrial tomography system, which confines that heat in the industrial grade X-ray system.
RESULTS:
The authors demonstrate that dense industrial computed tomography programs with major X-ray power notably affect the uncertainty of digital dimensional measurements. The registered temperature variations are consistent with dimensional changes in radiographies and hence form a source of error that might result in visible artifacts within the 3D image reconstruction.
CONCLUSIONS:
This contribution is of fundamental value to reach the balance between the number of projections and radial uncertainty tolerance when performing analysis with X-ray dimensional exploration in precision measurements with industrial tomography.
1Introduction
X-ray computer tomography (CT) has become an ideal measuring method for industrial components to measure inner contours nondestructively, becoming accepted as a metrology tool [1]. Nonetheless, no reference measurements of high accuracy for internal geometry, e.g., a coordinate measuring machine (CMM), are available to compensate for systematic errors of CT; hence, for the case of difficult-to-reach part features, easy-to-deform or flexible structures, under- and overuncertainty measurements have been reported [2].
The measurement process and analysis of CT data for dimensional measurements involve various factors, as described by Villarága Gómez et al., which may be resumed by the overall CT measurement uncertainty uCT as
(1)
where one distinguishes between the specific uncertainty contributed by the system usys., dependent on the resolution of the industrial CT device, the uncertainty of the proper object of interest invoking its uncertainty uobj. due to its position, material, dimensions and surfaces, of course the uncertainty induced by the environment uenv., the practical knowledge of the operator, and the uncertainty manipulated by the process parameters uproc., such as the photon energy introduced on the workpiece every CT scan. All aspects can further be distinguished between those uncertainties that determine the precision of X-ray radiography uX and those inherent to the tomographic process:
(2)
Currently, only two aspects are considered for internal CT measurement uncertainty analysis [2], the systematic maximal permissible error of the CT machine under usys., and the environmental temperature instability uT incorporated within uenv..
Following the fundamental principles of dimensional metrology, it is standard practice to operate measurements at the 20°C reference temperature as a natural way to prevent dimensional changes related to temperature fluctuations and then possible thermal expansion [3].
Hence, in a rigid workpiece, measurement variations are associated with thermal changes. When neglecting changes in the workpiece form, elasticity or roughness, significant uncertainty is introduced by thermal expansion and the indirect dimensional measurement method [4], resulting from the planar projection onto a rectangular distribution. Then, all values of error have as source the fluctuation
(3)
Here, l is the average measured dimension of the workpiece (e.g., its length) at 20°C, δT is the temperature fluctuation with respect to the mean temperature T over the volume, and β is the coefficient of thermal expansion of the workpiece with its uni-dimensional form
Recent insights of thermal impacts in dimensional metrology with X-ray CT have been developed by Villarraga et al. [2] on internal features. In [6], they offer an analysis of environmental uncertainty contributors, with special attention to the CT system temperature of the X-ray source and the scanning position. However, reported temperature inferences on the CT system are related to general heating aspects rather than being induced by the high-energy photon beam. Others [7] show that a rectangular distribution of heat within industrial CT is prone to errors: the larger the distance to the X-ray source; this covers the magnitude of the radiation fluence or the power density per area unit and thus may represent a approximation to a thermally induced dimensional error. Bircher et al. [8] characterized the displacement of a transmission X-ray tube target due to thermal effects. All observations clearly add up to the dimensional error. Nevertheless, the conversion of X-ray energy to thermal energy, that is the photothermal effect, has not been reported previously.
To improve the resolution with CT scans, it is important to position the workpiece close to the X-ray source and increase the number of projections. Under these conditions, the source induces temperature variations that may influence the precision of the dimensional measurement [9]; the X-ray beam scattering correlates with heat conduction according to the ballistic-diffusive heat-conduction equation in [10]. Moreover, high-resolution CT demands correction due to time-dependent electron beam drift and focal spot movement due to thermal deformation of the X-ray tube [8, 11, 12]. The quality of tomographic reconstruction can be significantly improved by digital inverse spot movement, therefore achieving better accuracy of dimensional CT measurements and ameliorating the design of transmission X-ray tubes.
For X-ray CT with high photon energy (max. 225 keV), photoelectric emission in metals is likely to occur. In metals with a low atomic number, it will be accompanied by Compton scattering: detachment of electrons from the innermost orbitals, which collide either with other electrons or the bulk. These interactions are the source for energy conversion from high-energy radiation to heat after electron-electron, electron-phonon, and phonon-phonon collisional interactions. The photoelectric component diminishes and becomes negligible for field radiation higher than 50 kV [1, 13–15]. Since the field energy for the CT of metallic parts is commonly obtained at approximately 200 kV, energy transfer mechanisms related to the Compton effect are treated macroscopically as transport phenomena. Within this scope, the sample’s density ρ is a determinant of the amount of heat Q induced in the sample, while its thermal conductivity κ is related to the thermal diffusivity σ through the bulk in heat transfer analysis. According to the first law of thermodynamics, the change in internal energy
(4)
where cp is the specific heat capacity at constant pressure p and V is the volume of the workpiece. The heat dissipation across the sample-surrounding interface depends on the roughness of the surface (i.e., the effective surface area) and the effusivity. Under all these conditions, the induced heat would change in magnitude, depending on the sample material properties, and its rise shall not be instantaneous, nor will its dissipation. Consequently, volumetric elastic incrementation is expected, albeit with no plastic or chemical alteration of the sample.
Industrial X-ray radiographies represent a two-dimensional intensity map of the line integrals according to the Lambert-Beer law [1]. Since radiation from X-ray tubes is not monochromatic and it has an energy distribution, integrations over the distribution of the X-ray energy E need to be conducted according to
(5)
where μ is the corresponding X-ray energy absorption coefficient and I0 is the initial intensity, at the point of interaction on the sample, while L is the thickness of the sample (monomaterial).
X-ray CT inspection of metal parts is typically prone to ill tomographic imaging related to complex photon scattering causing image artifacts within the reconstruction volume. In CT for metal applications, the augmentation of energy by denser CT scans and the number of photons prompting the photothermal effect increase the probability of image artifacts, which results in reducing the dimensional precision of CT as a metrological tool [16, 17]. The amount of energy radiated during the X-ray CT scanning process is likely to increase the temperature over the metallic parts under inspection with industrial tomography. The uncertainty generated by this phenomenon should be studied and quantified to improve the accuracy of dimensional measurements with CT technology.
All physical systems at room temperature radiate thermal energy. Infrared (IR) cameras capture radiation in the long-IR range of the electromagnetic spectrum and produce images of that radiation, called thermograms. Combined X-ray CT and IR thermography have been implemented for different purposes, mainly biomedical implementations; the concept was introduced in 2018 for ink-dying studies [18]. Other recent contributions to this interdisciplinary field include mechanical tests [19], preclinical research [20], cancer therapy [21], etc., but the metrologic importance of digital dimensional measurements for CT has not yet been identified. In the following, an IR camera is implemented in a CT system to monitor possible photothermal effects in metal parts.
2Scope
This work develops a bimodal analysis to improve estimations of the dimensional uncertainty for high-energy industrial X-ray CT combined with IR imaging. The scope of this analysis concerns dimensional changes trackable in radiographies of metal parts, monitoring the environmental temperature within the CT system. In particular, the authors evaluate the dependency of the number of projections, consequently the photon-energy accumulation in the sample’s bulk, on volumetric changes related to heat. As a central contribution, dimensional changes within radiographies are related to the photothermal energy of the bulk caused by massive photon scattering. The proposed methodology is independent of reference measurements but confirms by two image modalities the importance of thermic considerations for dimensional uncertainty considerations for industrial X-ray CT. The objects of interest in this report are 304 stainless steel spheres. Stainless steel is a common material in industrial applications, spanning diverse fields from automotive to medical. Its versatility has led to a widespread demand for computed tomography (CT) as an inspection and metrological tool [22–24]. The authors consider two different diameters of spheres for reproducibility and consistency aspects. The simplest 3D geometry is key to attain general implications by the results of this contribution, since photothermal transport aspects are highly dependent on properties of the matter and shape. Stainless steel is a dense material with a high number of free electrons and a relatively low heat transfer coefficient, which makes it a good example to start a case study of metal parts and the proposed methodology for monitoring photothermal effects in CT systems. Furthermore, CT image artifacts of metal samples are very common and treated frequently with image (post-)processing on computational 3D reconstruction.
3Materials and methods
The proposed methodology is structured in the following three subsections: 3.1. The bimodal experimental setup with an IR camera within the X-ray CT system, 3.2. the radiography difference method for the detection of dimensional changes, and 3.3. the theoretical volume expansion in projection on the CT panel as an orientation for the expected results.
3.1The bimodal experimental setup
The current investigation involved sampling radiographies of a single stainless steel sphere with an industrial X-ray CT system and simultaneously monitoring the thermal energy radiated from the surface of the workpiece during the acquisition of CT images.
3.1.1The object of interest
The sample is a stainless steel 304 sphere of diameter that was measured with a MITUTOYO dial calliper at a controlled room temperature of 20°C. This sphere was allocated 50 ± 0.01 mm distant to the X-ray target, according to the CT positioning system. In the experimental system we report, this sphere is positioned on an acrylic hollow acrylic (mylar foil) cylinder with an inner diameter of 10.34 ± 0.01 mm. Special care was taken to ensure that the cylinder axis and the sphere center were aligned and that their relative positions with respect to the source were the same for every CT scanning performed in these tests. For repeatability of the proposed methodology, the following radiographies CT program of four sets of tomographies was reiterated the procedure with a smaller sphere of 7.90 ± 0.01 mm diameter at 30 ± 0.005 mm distance from the target within the X-ray cone, on top of a cylinder with an inner diameter of 7.39 ± 0.01 mm, on a different day. The experimental inspection of the workpiece conforms to the general aspects for dimensional measurements with an X-ray CT system and follows recommendations with respect to the industrial norm VDI/VDE [25]; ASTM [26] recommends length bars that coincide with the spheres in their circular section image. In summary, the spherical geometry, because of its symmetry, is the best geometry for displaying the distribution of the induced photothermal phenomena.
3.1.2X-ray image acquisition
Radiographic image acquisition was realized with NIKON’s microfocus CT system XT H 225 (max. 225 keV with reflection target), composed of four tomographic sets of the same stainless steel sphere, interrupted by a cooling break of 30 minutes. Although this CT system may not be the best for dimensional metrology and the inability to find a publicly reported maximum permissible error (MPE), the proposed methodology radiographies differences are invariant to the focal spot displacements (see further details of the method in Subsections 3.2 and 4.1). The present report is on considerably few projections to minimize the effects of heat of the CT system itself and possible thermomechanical movements. The photon energy generated by the system during CT image acquisition is determined by the X-ray settings and set at 200 ± 0.5 kV, with a current of 420 ± 0.5 μA and a 3.175 ± 0.01 mm thickness stainless steel plate as the X-ray filter to obtain a uniform and constant spectral distribution [27]. Every tomography distinguishes in their number of projections and hence the overall time of exposure for image acquisition: the first accumulated information from equidistant projections over a circular 360° scan; the angular uncertainty of the CT system is ±0.0005 degrees. These 180 radiographies, acquired within 8 minutes, serve as reference point evaluations of the larger tomographies, since fast tomographic image acquisitions are unlikely to affect the ambient temperature of the system. The second tomography had twice as many projections (360 projections in 16 minutes of X-ray exposure); the third set had three times as many projections (540 projections in 24 minutes of X-ray exposure); and finally, the fourth set was performed with 720 projections in 32 minutes of X-ray exposure. The imaging parameters were established to 3 s exposure for every projection image (radiography) and 1 x binning using the flat panel X-ray detector of PERKIN ELMER XRD 1611 [28] with a total sensing area of 409 . 62 mm2 producing radiographies of 4050 × 4060 pixel (height, width). When comparing the two sets of CT programs of spheres of different diameters with respect to the composition of their radiographies, the number of white pixels referring to the background within both sets is similar; hence, the magnification is proportional to the inverse of its diameter. The position of the turning table of every tomography was kept unchanged by the CT program. NIKON’S CT PRO 3D software was used when calculating the center of rotation about an offset in the x-axis correction of -0.338 ± 0.009 mm in the case of the large sphere, and -0.318 ± 0.008 mm in the case of the small sphere.
3.1.3IR radiation monitoring
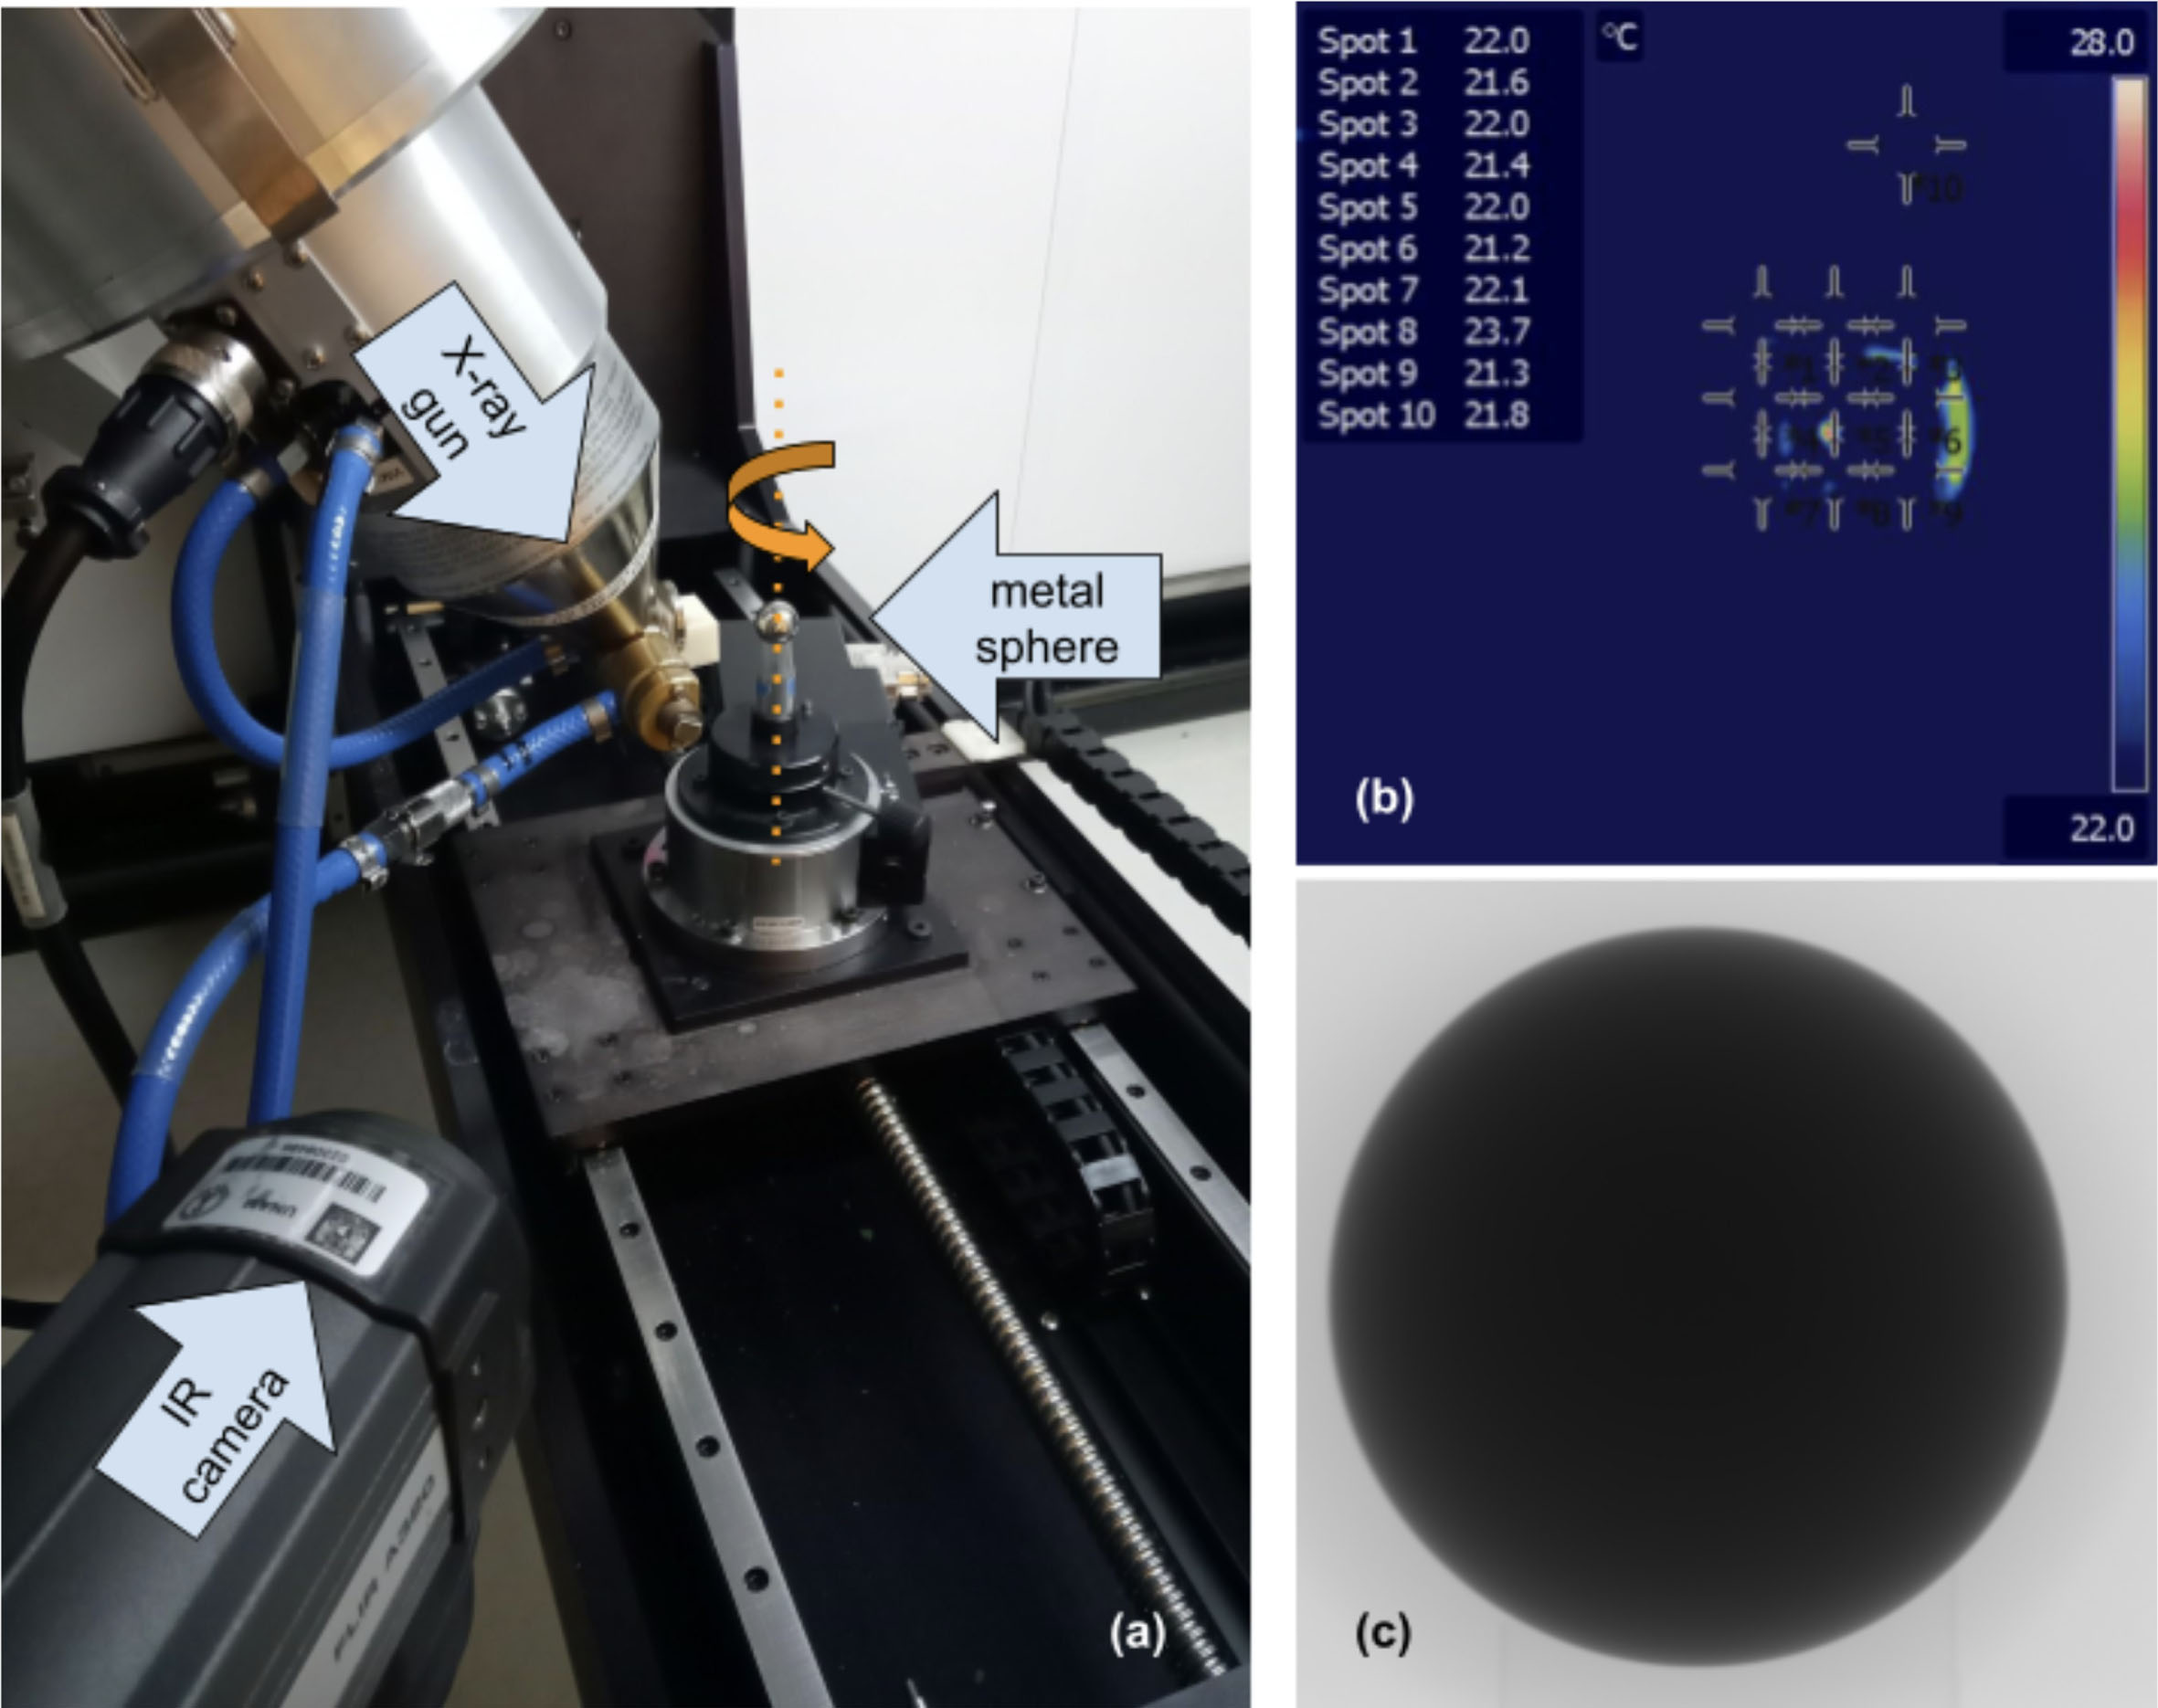
The IR camera FLIR A300 (30 Hz, 18 mm lens, 25° FoV, accuracy ±2%) [29], remotely controlled, as schematically shown in Fig. 1, is positioned at the same height as the CT target but with an almost perpendicular view as the CT system, monitoring temperatures of the scene and taking into account consistent emissivity values: some spots of the IR camera observe the temperature changes of the stainless steel 304 (with respect to its emissivity of 0.85), and some other spots monitor the background temperature at the painted wall within the cabin of the CT system (emissivity of 0.95) within the cabin of the CT system. The ideal setup to capture IR images of the metal sphere is either thermally isolated from the surroundings or with a uniform gauge to dissipate thermal energy by radiation, diffusion, or convection of energy. The workpiece is placed on a hollow cylinder, whose axis, the sphere itself and the CT rotation coincide. The workpiece interface with the surroundings is under the temperature control of the CT chamber. The thermal conditions of the sphere surface in contact with the cylinder differ from those of the remainder of the surface.
Fig. 1
(a) The bimodal experimental setup with the industrial CT system, the rotation axis for the object of interest on the rotation stage, as well as its rotatory orientation is marked in orange; (b) IR image of the scene from the point of view of the thermal camera, and (c) a radiography of the stainless steel ball by the industrial CT.
3.2The radiography difference method
Here, the authors envisaged that with the successive process of image subtraction, namely, the frame difference method, one can make apparent the dimensional differences between the initial projection and any number of successive CT projections [30, 31]. Because the workpiece is rotating around a fixed axis within the programmed four tomographies in a row, every two images for the same view-point at the same rotation angle can be compared. The angular precision at the rotation stage of NIKON’s CT system XT H 225 can be reviewed at [32]. The proposed radiography difference (RD) method estimates dimensional fluctuations of the object of interest caused by the projection image acquisition itself, independent of the choice of 3D image reconstruction and further data processing. For a given CT beam energy, the corresponding RD algorithm relates the incrementation of the projection count to dimensional differences in the projection plane of the panel. Indeed, the achievable dimensional uncertainty depends on the distance from the workpiece to the imaging screen and the number of pixels involved in imaging the CT projections.
Fig. 2
Polar graph of the RD comparison strategy: the first 180 projections, illustrated by 18 black circles, repeat in their angular position within the following CT sets. Note that the circles are a schematic representation of the number of projections while keeping constant the relative position between the radiation source, sample and imaging panel.
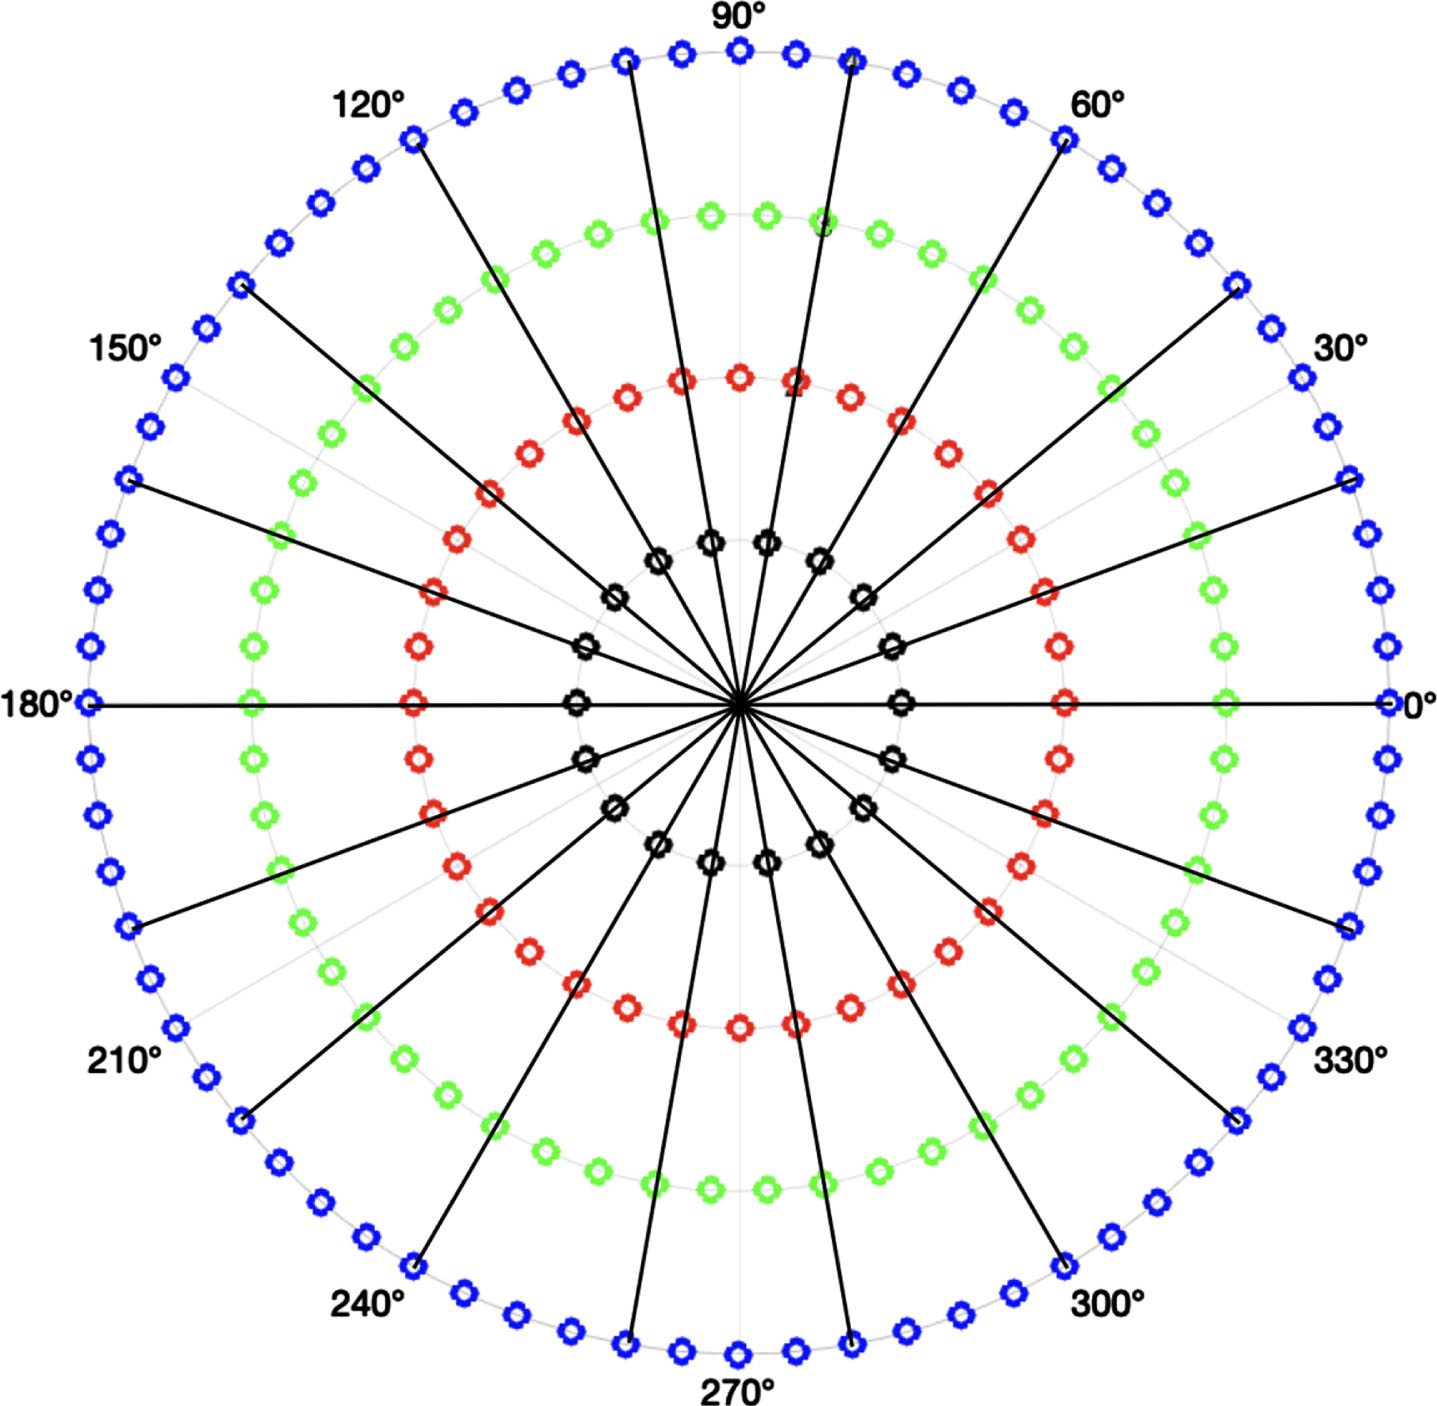
The 180 projections with common rotation angles in all sets are declared as the reference images. Furthermore, all longer tomographies repeat these 180 frames every second, every third, and every fourth radiation due to the total number of projections. Henceforth, the experimental setup allows to subtract information that is potentially the same unless thermal expansion has occurred. The RD comparison strategy is illustrated in a reduced form of the polar graph in Fig. 2, demonstrating that every rotation angle of the reference radiographies from the set of 180 projections (every group of 10 projections is depicted by one black circle) finds its pair within all three other sets of 360 (red circles), 540 (green circles) and 720 (blue circles) projections.
It is important to note that the RD method would detect any thermomechanical movements of the workpiece, e.g., due to focal spot drifts, although CT programs with under 1000 projections have not confirmed these effects. Environmental noise, which resembles salt-and-pepper-type noise in digital images, also affects the results of this strategy [30]. Therefore the computational routine involves 2D median filtering on the image difference. Finally, the outcome image, as a matrix of gray values, is summed.
3.3Theoretical volume expansion
Objects expand when heated; the current case of a sphere can be treated according to the linear thermal expansion β. For the current working conditions, β of stainless steel 304 is considered to be constant1: β = 17.2 × 10⁻⁶°C-1. Indeed, there are conditions at which it could be assumed as a variable, but those are outside the scope of this analysis. From its definition in Equation (3, for a measurable local increase in temperature ΔT = (T - 20°C) in the workpiece at 20°C reference temperature, the linear dimension is expected to change according to
(6)
where an object with length l changes by Δl when the temperature changes from T to T + ΔT; instantaneous fluctuations of are related to instrumental noise. The volumetric expansion of a stainless steel sphere corresponds to a multiple of β with factor
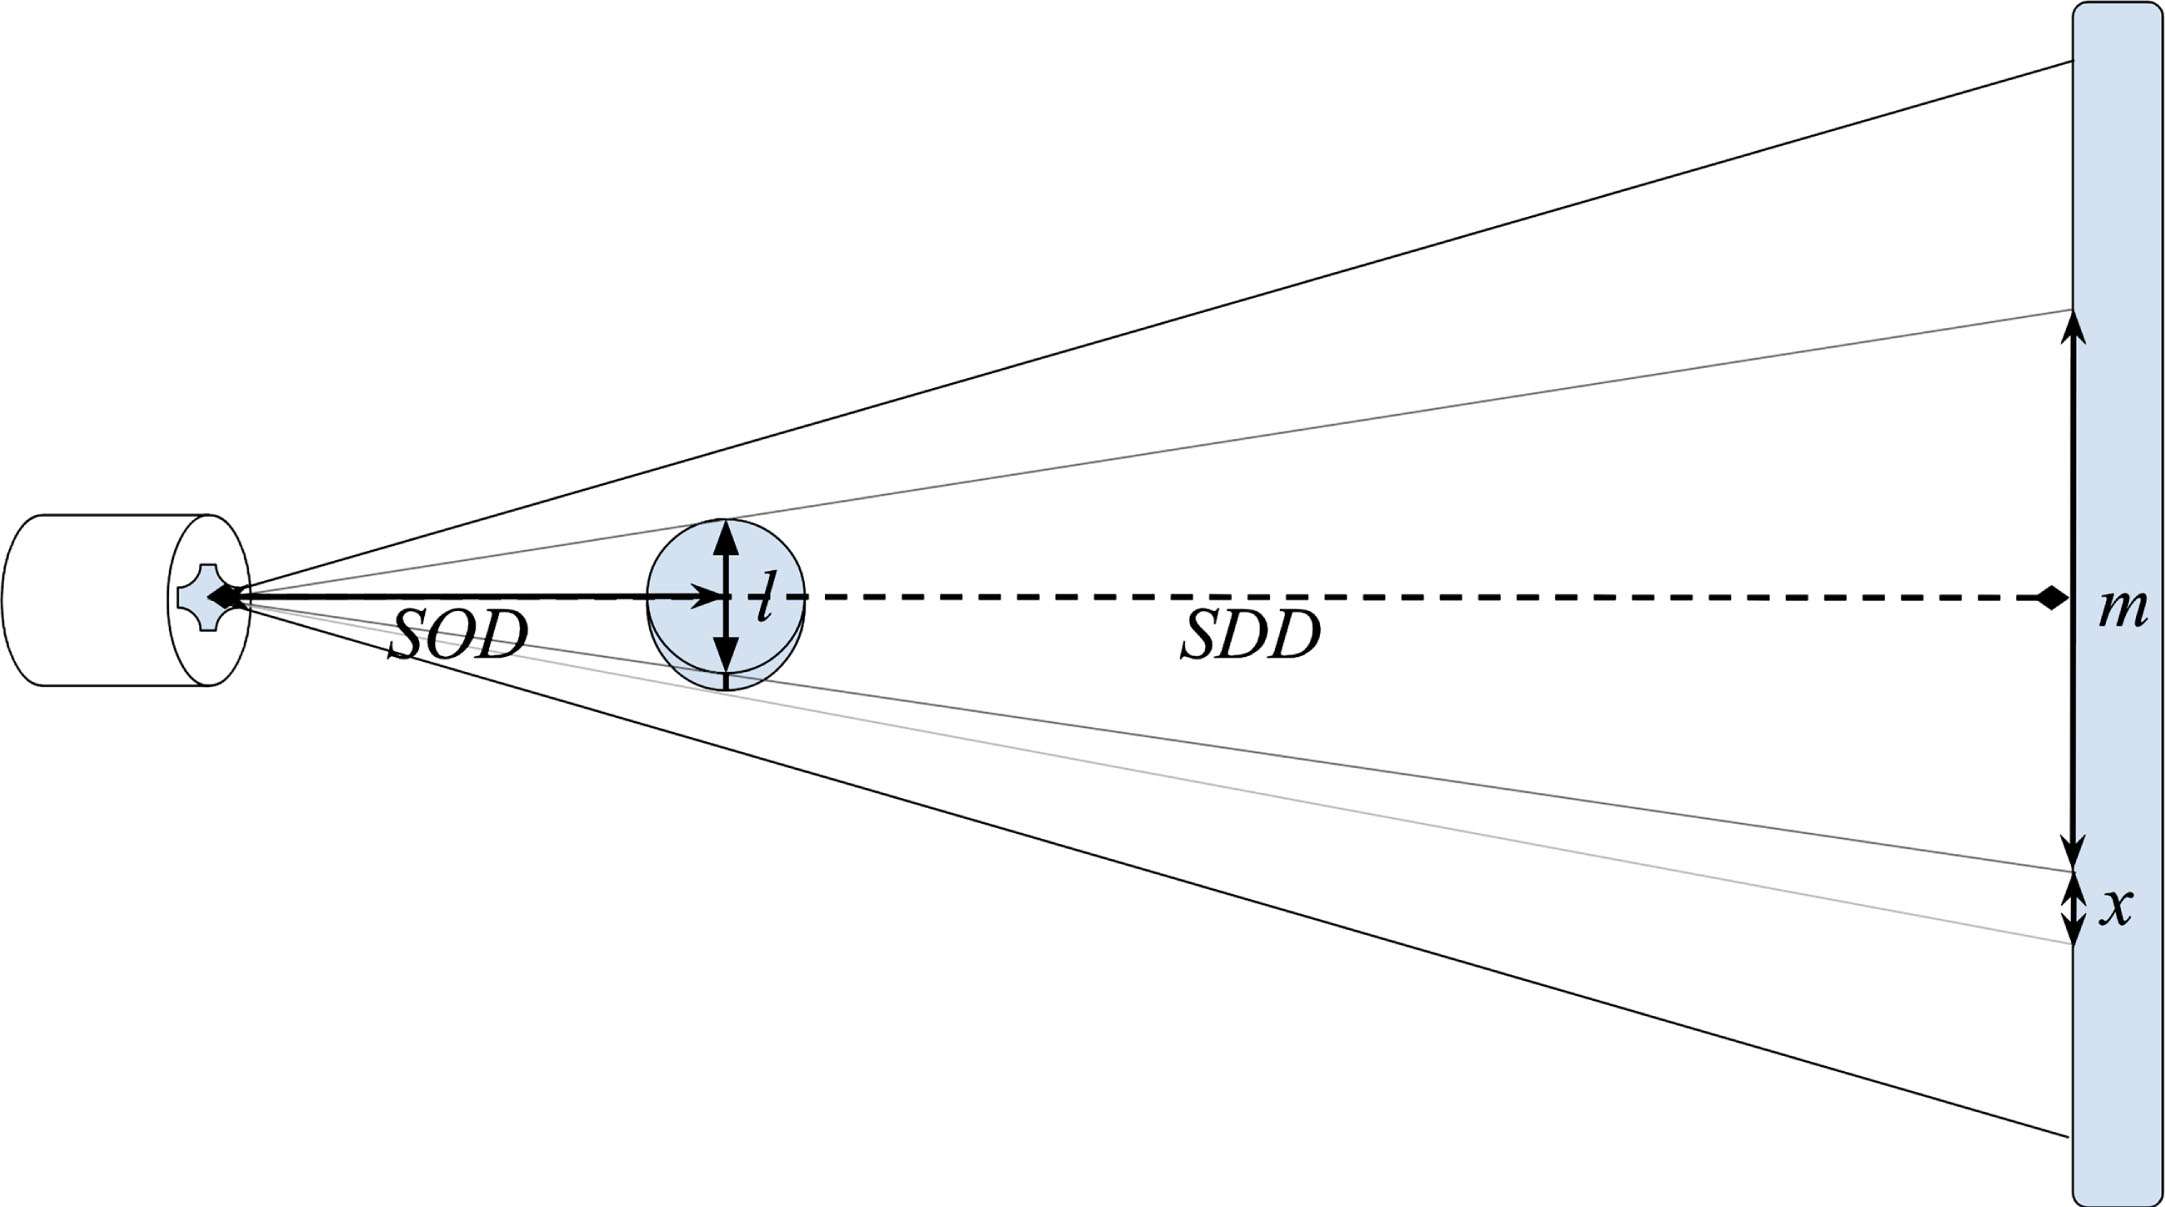
if the temperature rises by 6 ± 0 .4°C. Considering the source-to-object distance SOD = 50 mm and the source-to-detector distance SDD = 1045 mm, the magnification of the experimental setup equals
Fig. 3
Schematic dimensional relation between the target, the specimen and its projection on the panel.
As noted before, with each projection, a given amount of thermal energy is transferred to the sample as a byproduct from the Compton interactions. The dissipation of this thermal energy is not instantaneous; rather, it is cumulative [15]. Then, one should expect that after a given number of projections, made at near constant CT scan energy, the internal temperature of the workpiece would reach the threshold at which the photon-induced thermal energy will cause expansion of the workpiece volume.
4Results
The results of the proposed methodology are structured in three subsections consistent with the methodology in Section 3: 4.1. The compilation of X-ray measurements with the RD evaluation of the two spheres, 4.2. IR monitoring of the sample and CT system and 4.3. photothermal reference analysis data for the dimensional uncertainty approximation of the present case study with industrial CT.
4.1X-ray measurements with RD evaluations
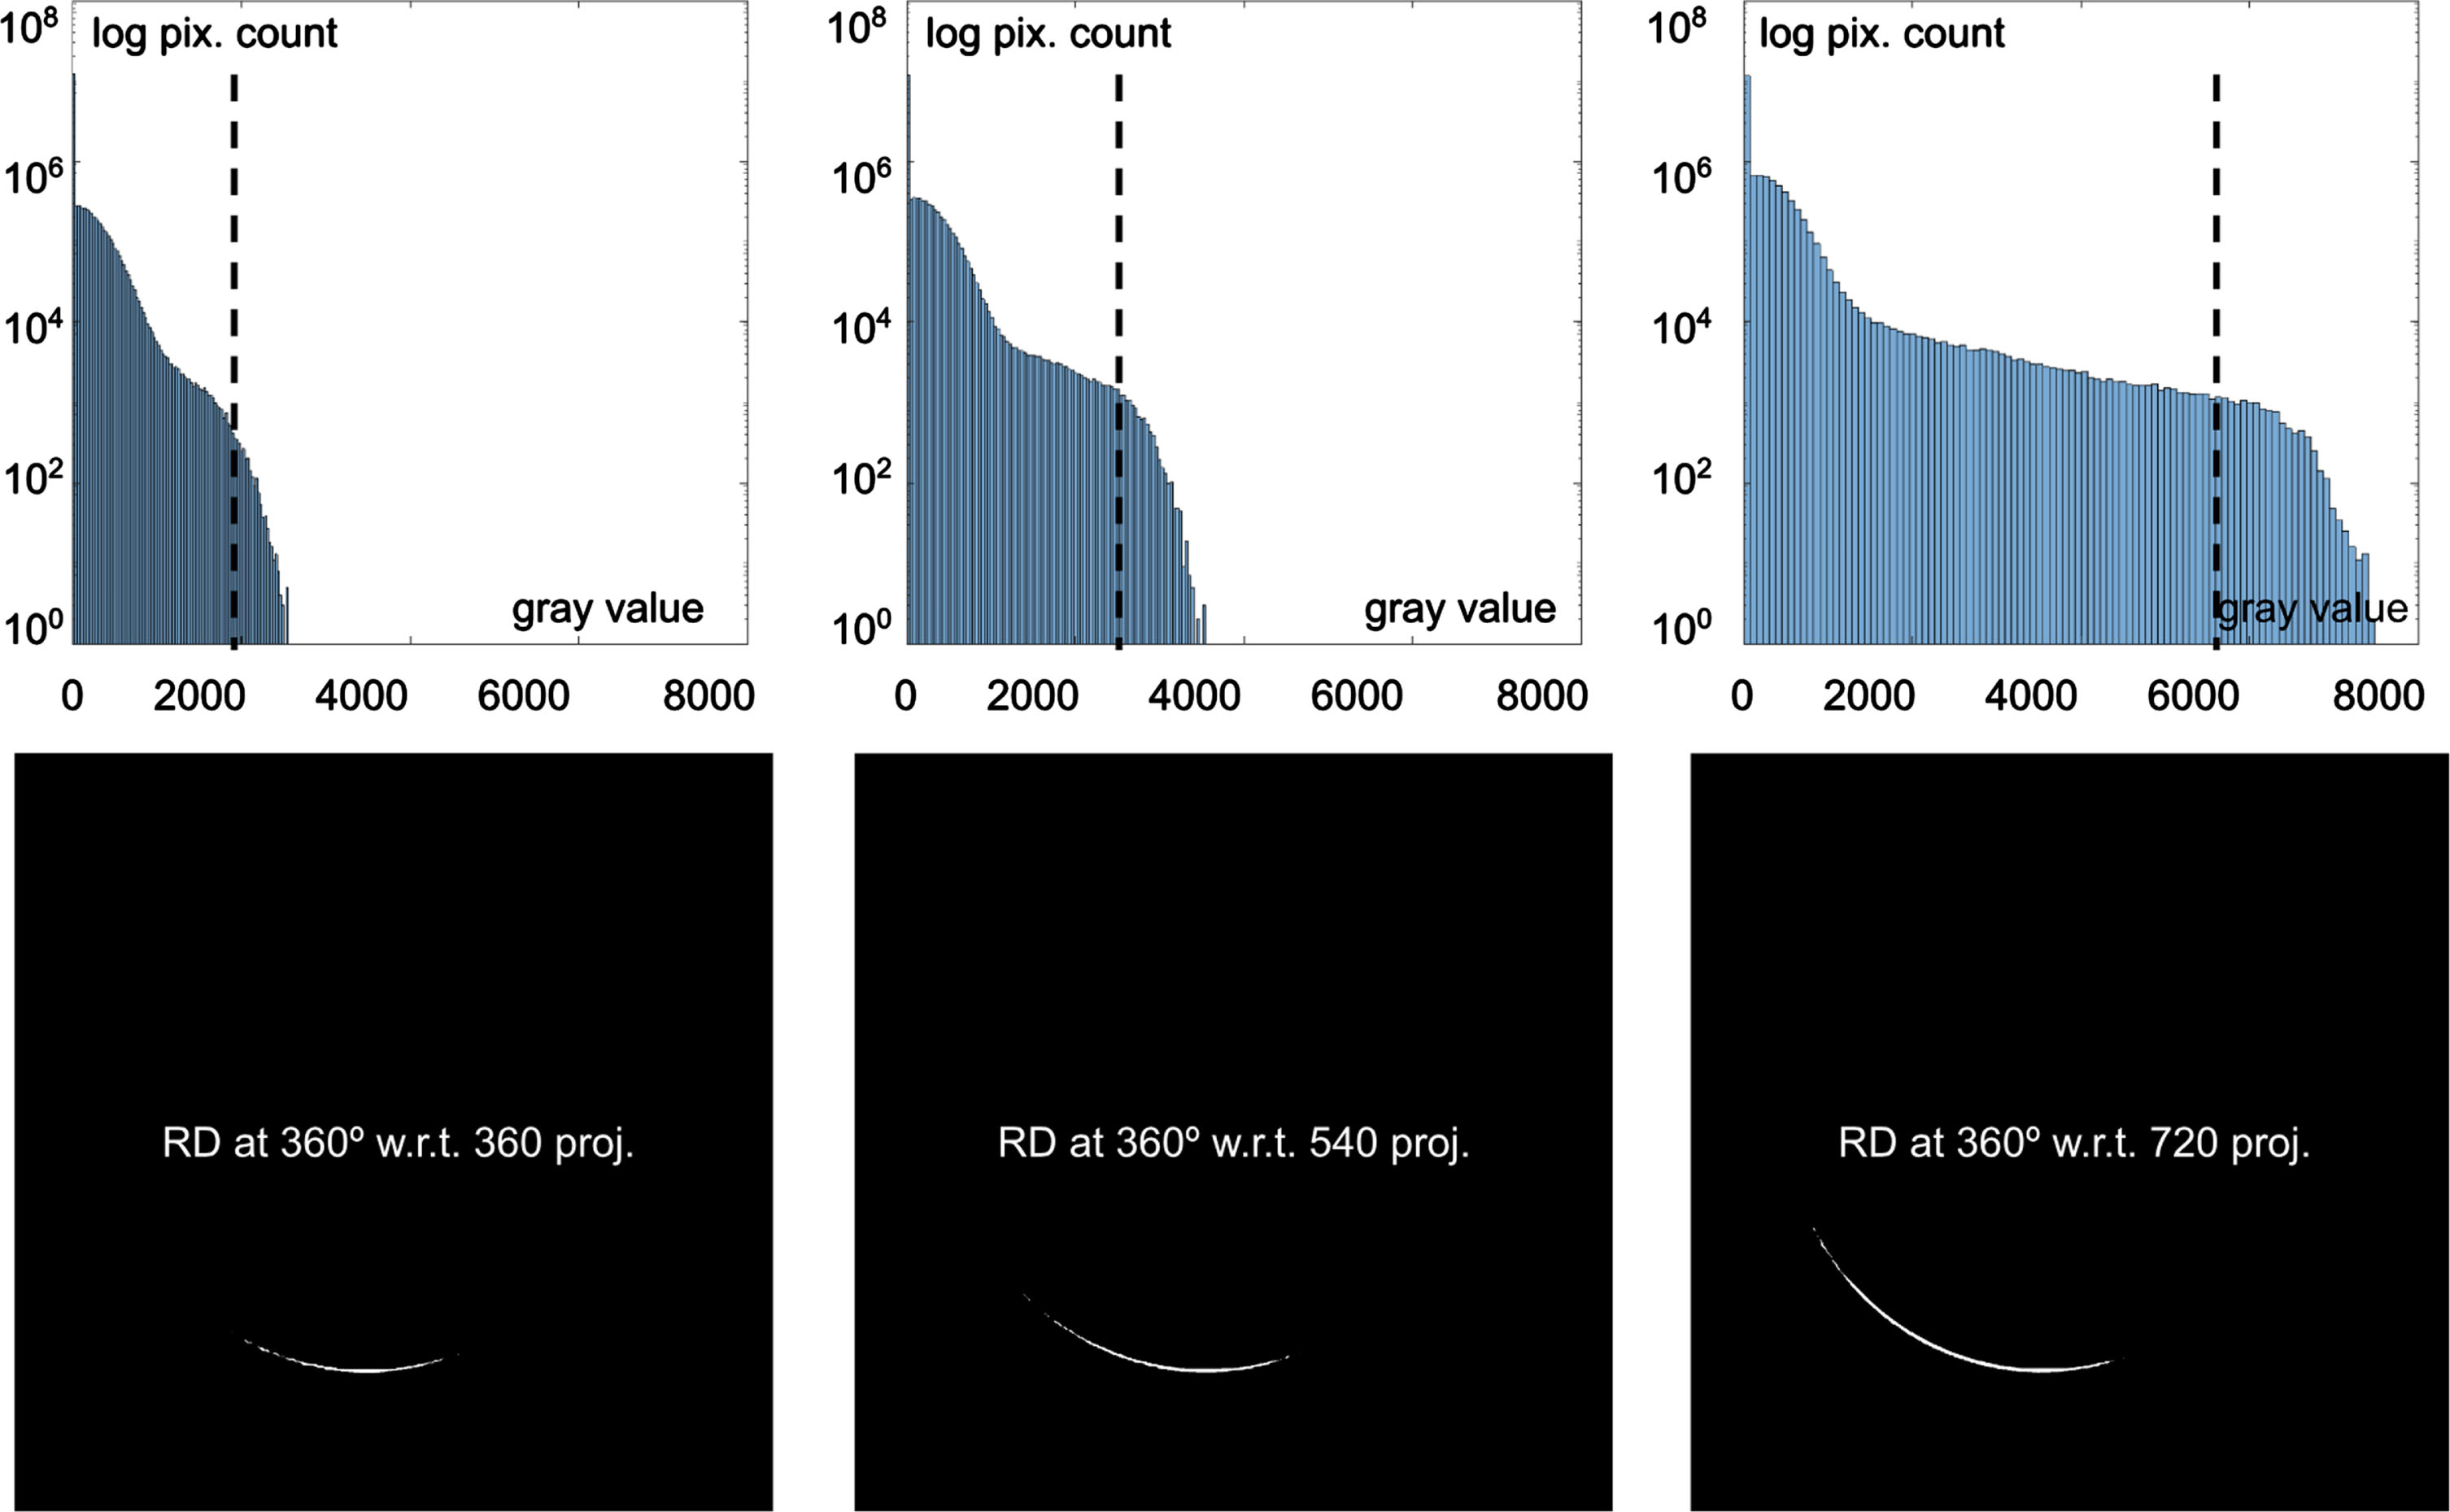
Essentially, the X-ray RD analysis focuses on variations in the image composition. The resulting difference image consists of black areas that sum up zero values with no variation or movements and white areas, regions of volume extension or movements. Clearly, the determination of the threshold is crucial. The authors find empirically that the uppermost quarter of the RD gray value spectrum is white, and the rest will be considered black. This dynamical threshold value aligns in the following numerical evaluation to the theoretical linear volume expansion presented earlier. The gray value distribution of the RD outcome essentially has its mean in the dark values. The more projections that are implemented during the scan, the brighter the mean gray value. Fig. 4 offers insight into the representative image logarithmic histogram (above), as well as its manual threshold determination. As a result, an increase in the number of projections within a tomography raises the median gray values. Furthermore, one can observe by means of the subtraction of images, that the radial dimension increases over specific directions with the increase in the number of projections. The presence of the crescent in all RD images confirms that no thermomechanical drift of the spot size or the workpiece took place in the described sets of CT programs. The RD method is invariant to positioning imperfections (miscentering).
Fig. 4
Example of the RD implementation between every two radiographies at one specific angle of rotation (here at 360 degrees) of the small sphere: (above) logarithmic histogram insight of the RD image; the threshold is set at the upper quarter of all present gray values (below) binarized RD image; at twice, triple and quadruple X-ray exposure time with respect to the reference tomography run of 180 projections.
The evaluation of the RD method includes two interpretations: first, a global measure where all pixel gray values of the 2D radiographs are taken into account and summed up; second, the local incrementation of the radius of the sphere is counted by the white pixels on a 1D centerline of the projected sphere, further evaluated in mm on the X-ray panel. Fig. 5 depicts both evaluations of the RD method for the two sphere sizes. Different imperfections influence the direct results, such as the influence of the surrounding air on the linear attenuation coefficient. Furthermore, the radial extension x is dependent on a global threshold setup; for the present implementation, the authors consider the same noise conditions throughout the CT program. With the increase in the number of projections, one can observe a gain in the sum of pixel differences: the RD algorithm of 720 projections (blue) tends to result in values above the 540 projections (green), which again tend to result in values above the 360 projections (red). The differentiation is even more noticeable if the object of interest is closer to the X-ray source, as is the case for the small sphere. This implemented measure is equivalent to the differentiation of the gray value distributions in the histogram of the RD outcome, as exemplified in Fig. 4 (above).
Fig. 5
The RD algorithm evaluates the sum of pixel differences in gray values (upper figures) and the radial extension (lower figures) with respect to the threshold (bold lines); the corresponding thin lines depict the ±1% threshold error consideration of the large (left) and the small (right) spheres.
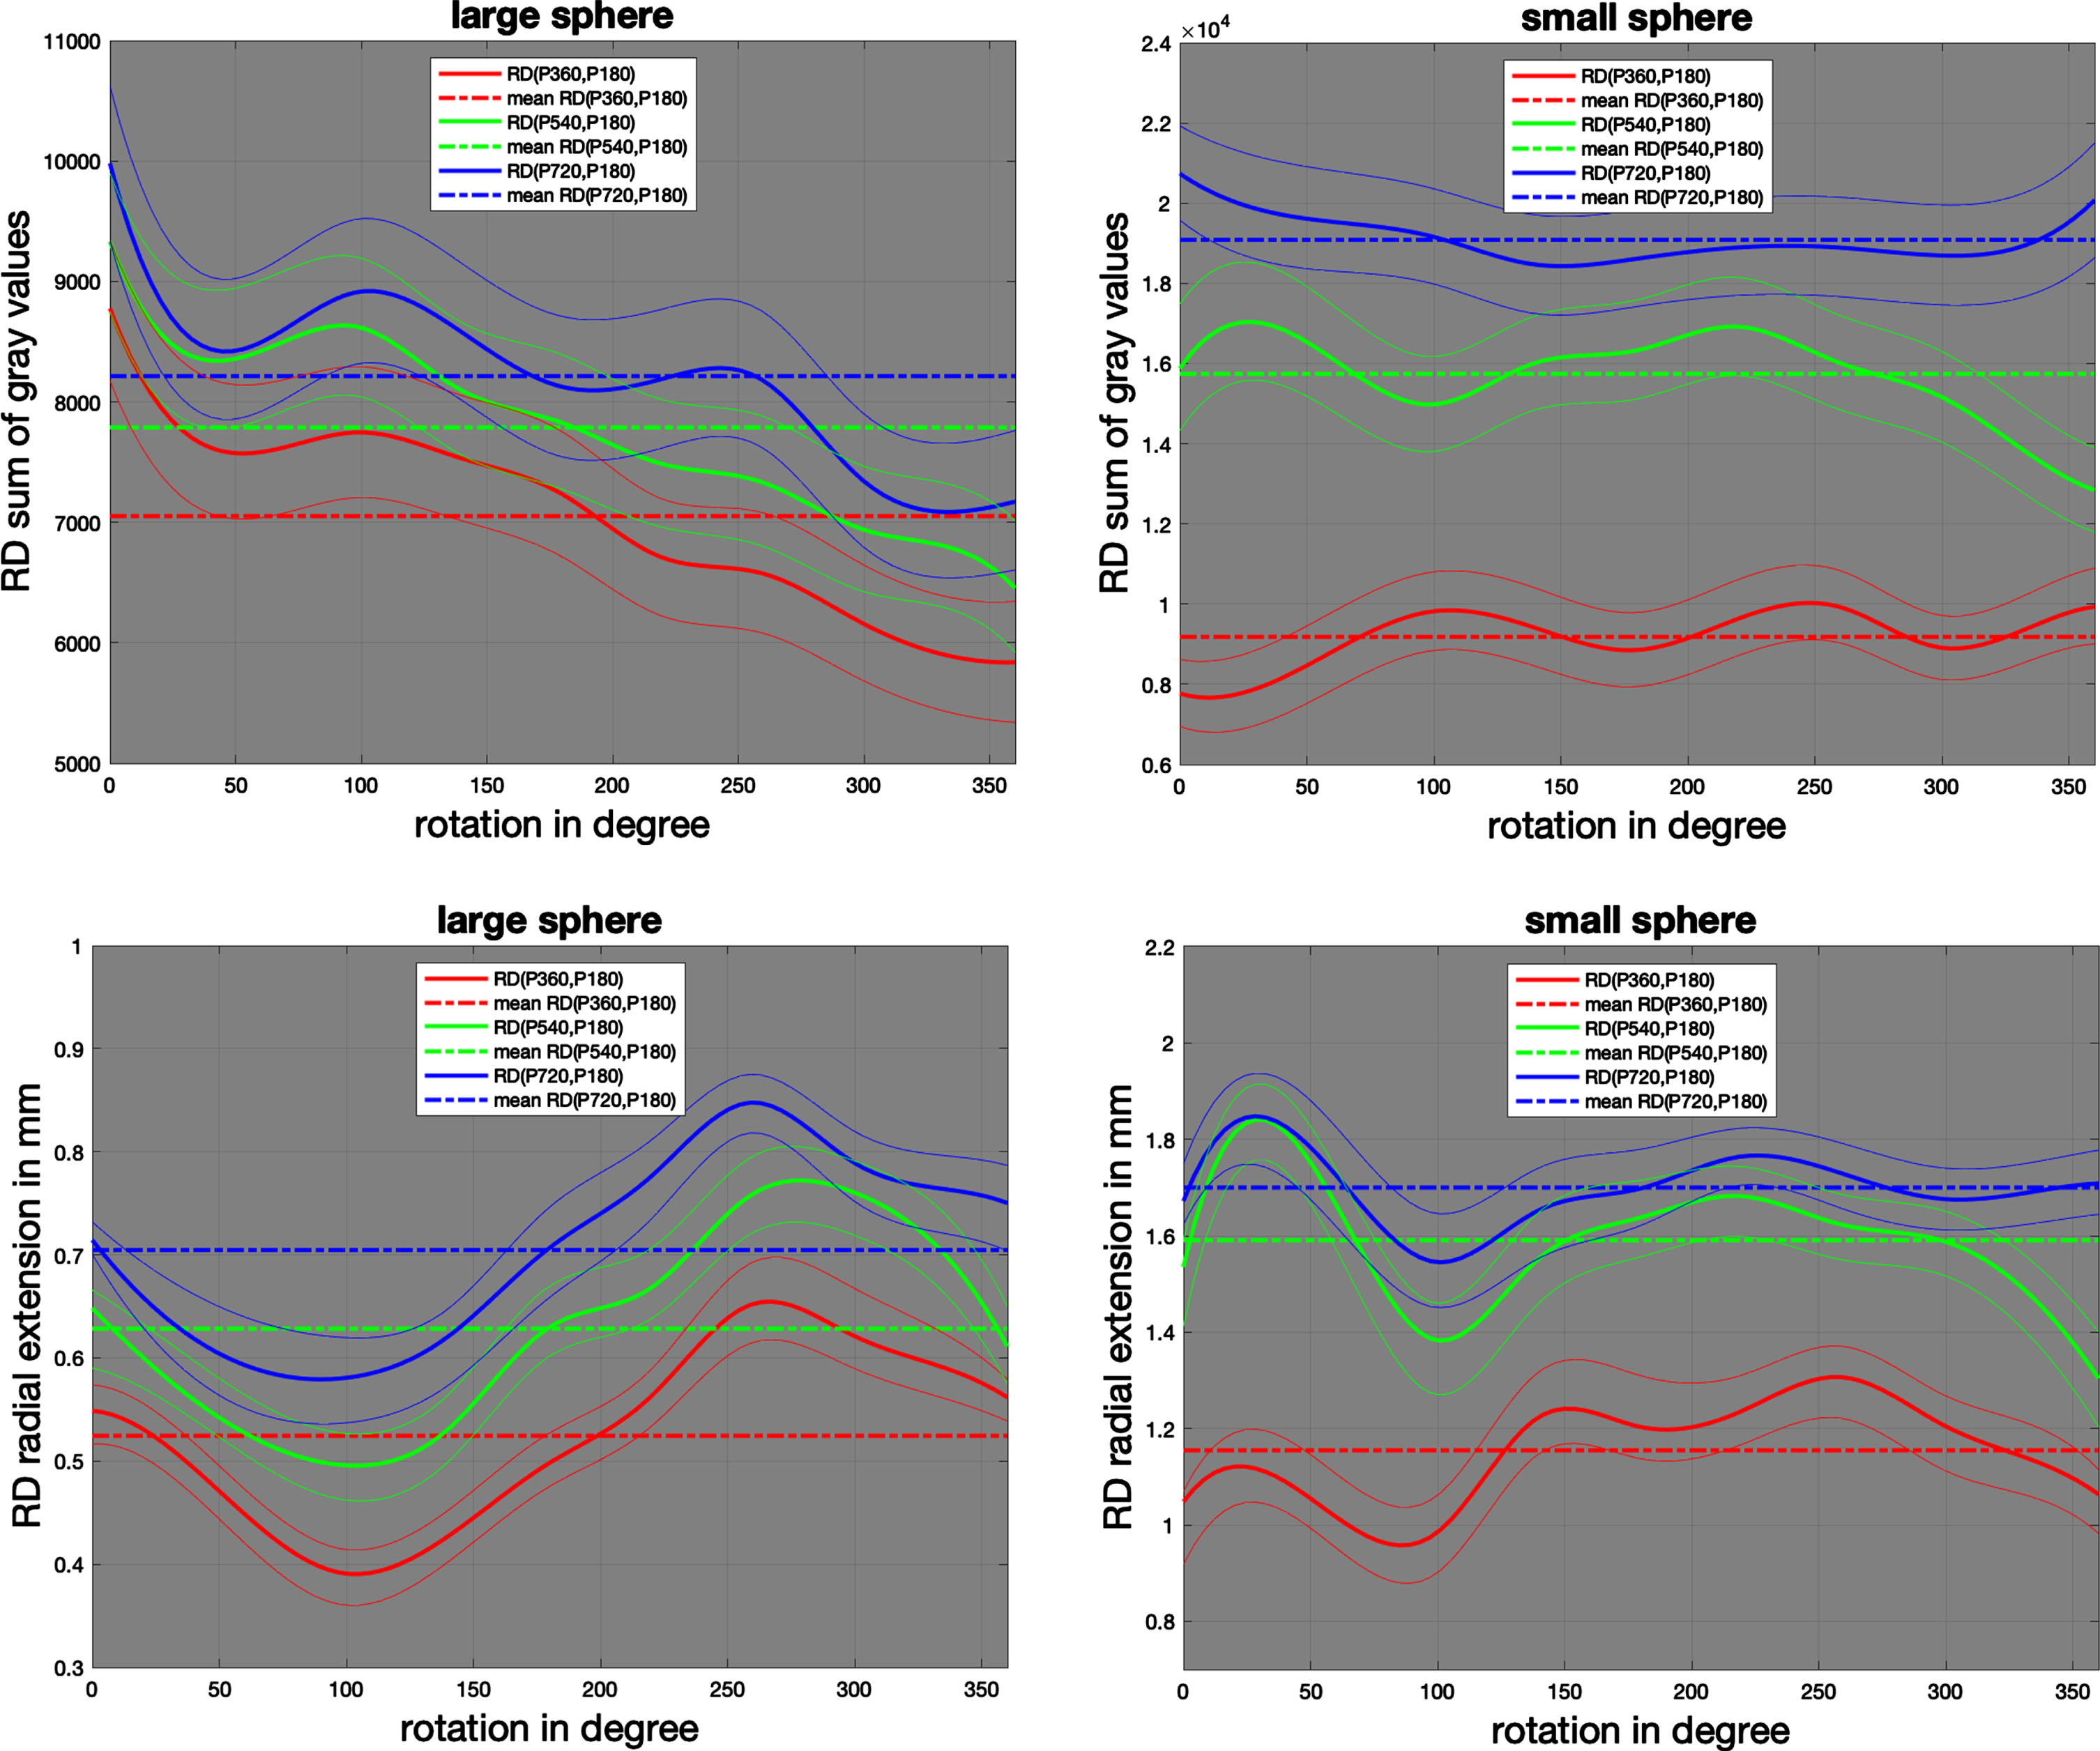
One may also take into account that l in Fig. 6 of the large sphere is mapped onto 3480 pixels, while in the case of the small sphere it is mapped onto 2772 pixels of the X-ray image panel of the system. Considering the projected area of the spheres π (l/2) 2, the large sphere is represented by approximately 9, 4 M pixels (57 % of the radiography capacity), and the small sphere has only 5, 9 M pixels (36 % of the 4050 × 4060 available pixel on the X-ray panel). To fulfil the task of dimensional uncertainty analysis with an industrial X-ray tomography system, the radial extension in pixels is more expressive.
4.2IR registrations
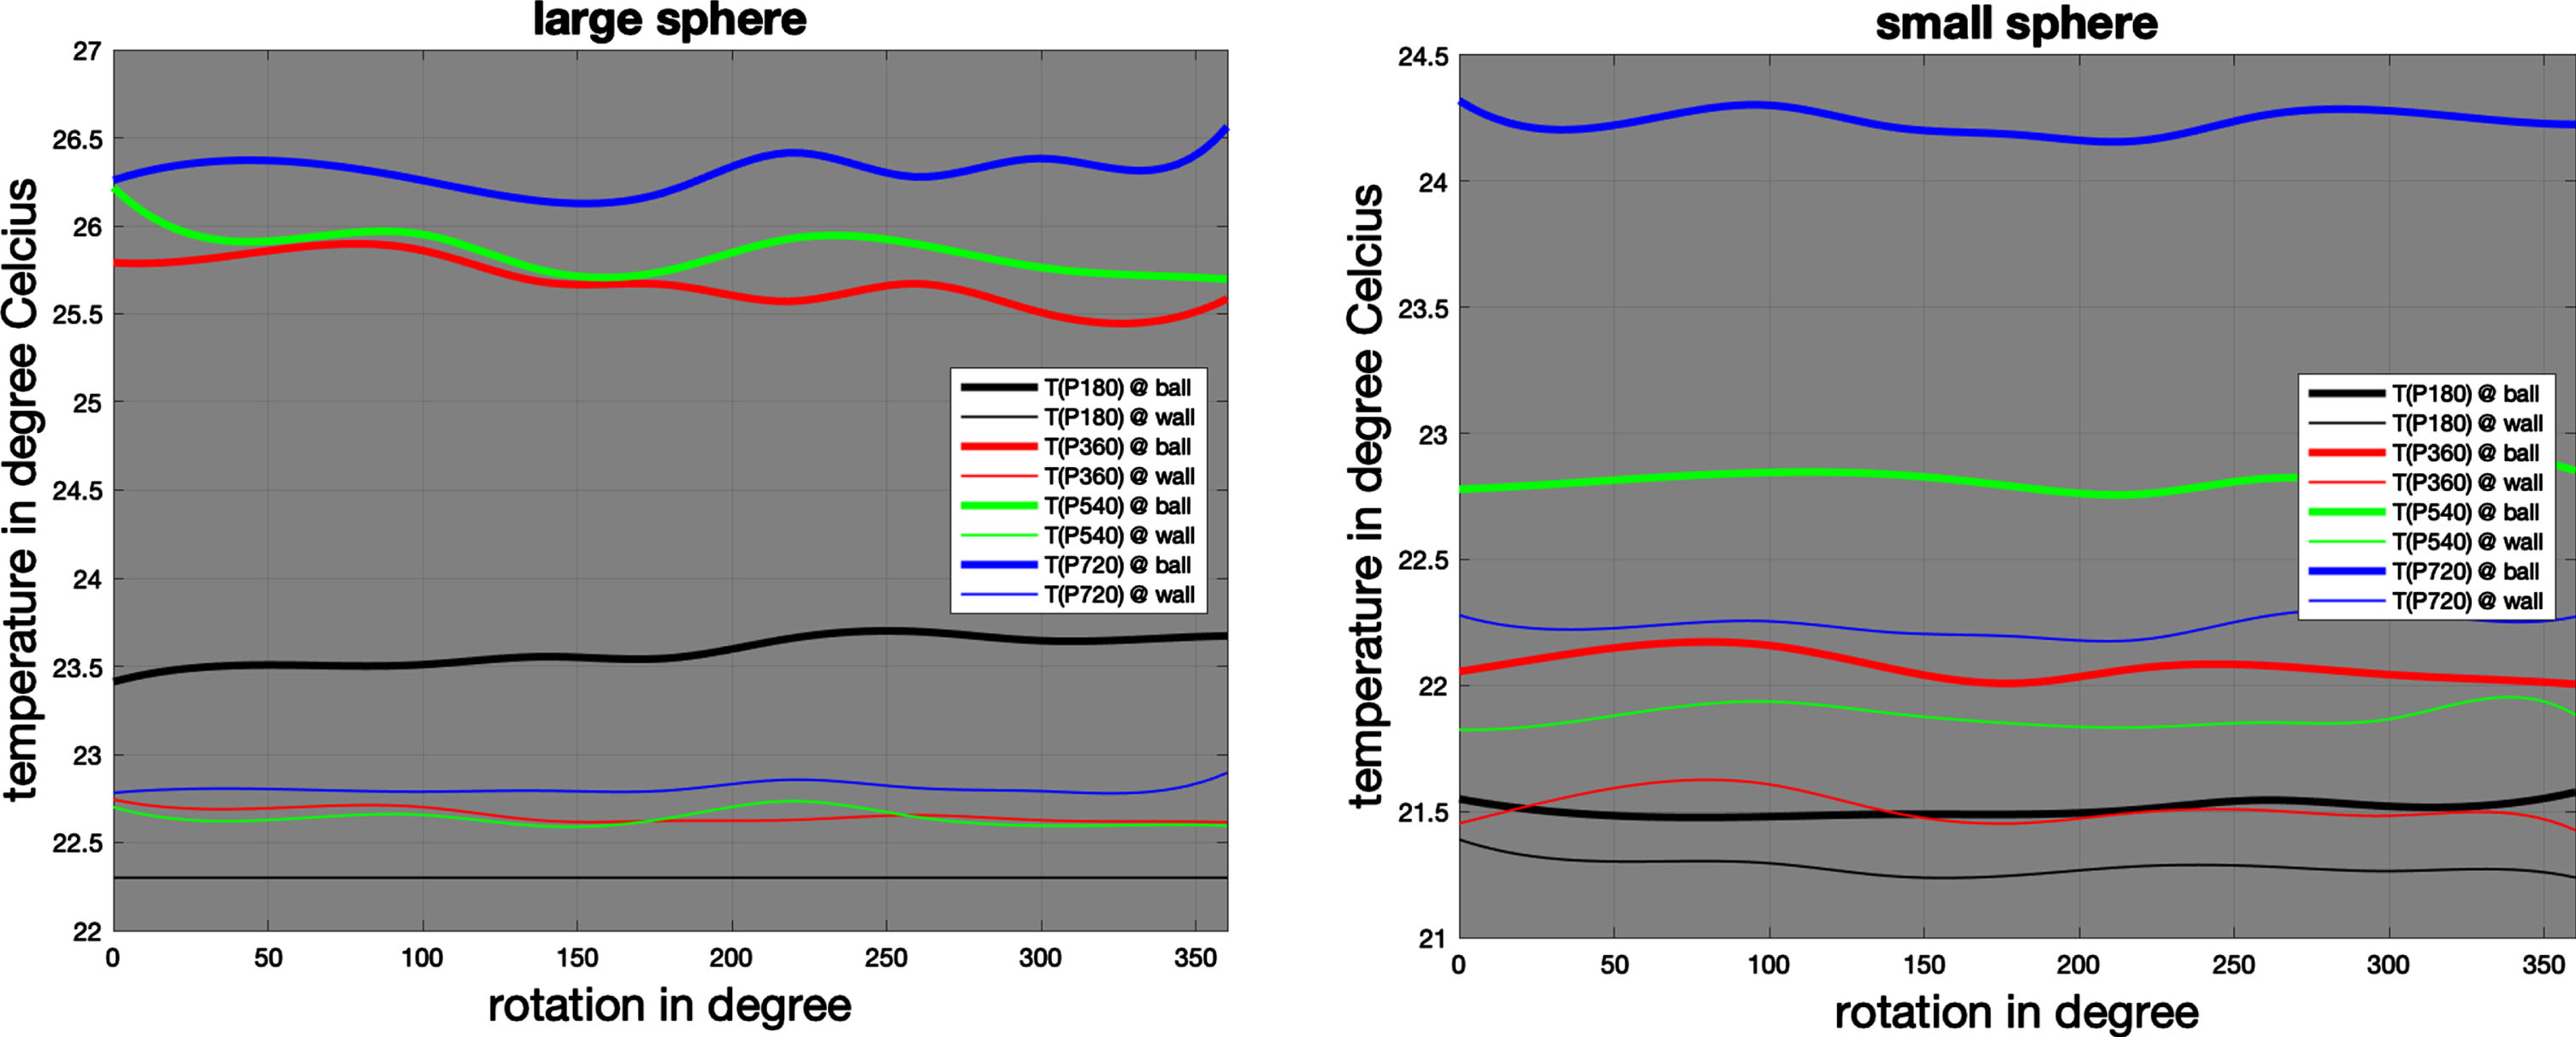
The central interest of the global linear tendencies of T of the metal workpiece over the time span covering all CT scans, without loss of general temperature changes (noise) of the environment. The IR camera detects contactless and measures IR energy of the metal object of interest for every 2 degrees of rotation of the CT turntable, as well as the inner wall of the X-ray system. The measurement accuracy of the FLIR camera is of 2 % according to [29], uT = ±0 . 5 ∘C for laboratory calibrated measurements. Throughout the four tomographic scanning procedures, a background heating of approximately 1°C was detected, whereas a mean temperature variation over the whole sphere of over 3°C was registered. This global temperature information throughout the tomography program of the four full turn scans is documented in Fig. 6, including noise B-spline filtering. Temperature variations between the two spheres during the fourfold CT scan can be related to their proximity to the cool target; therefore, one can expect a warmer temperature on the large sphere at 5 cm than on the small sphere at only 3 cm distance to the X-ray source. Nonetheless, the irregular temperature jumps within the set of the four tomographic scans demonstrate the instability of the CT system for dimensional metrology.
Fig. 6
Temperature measurements with the IR camera on the metal sphere (thick lines, “@ ball”) and on the inner wall of the CT system (thin lines, “@ wall”) within the X-ray system during the scanning procedures.
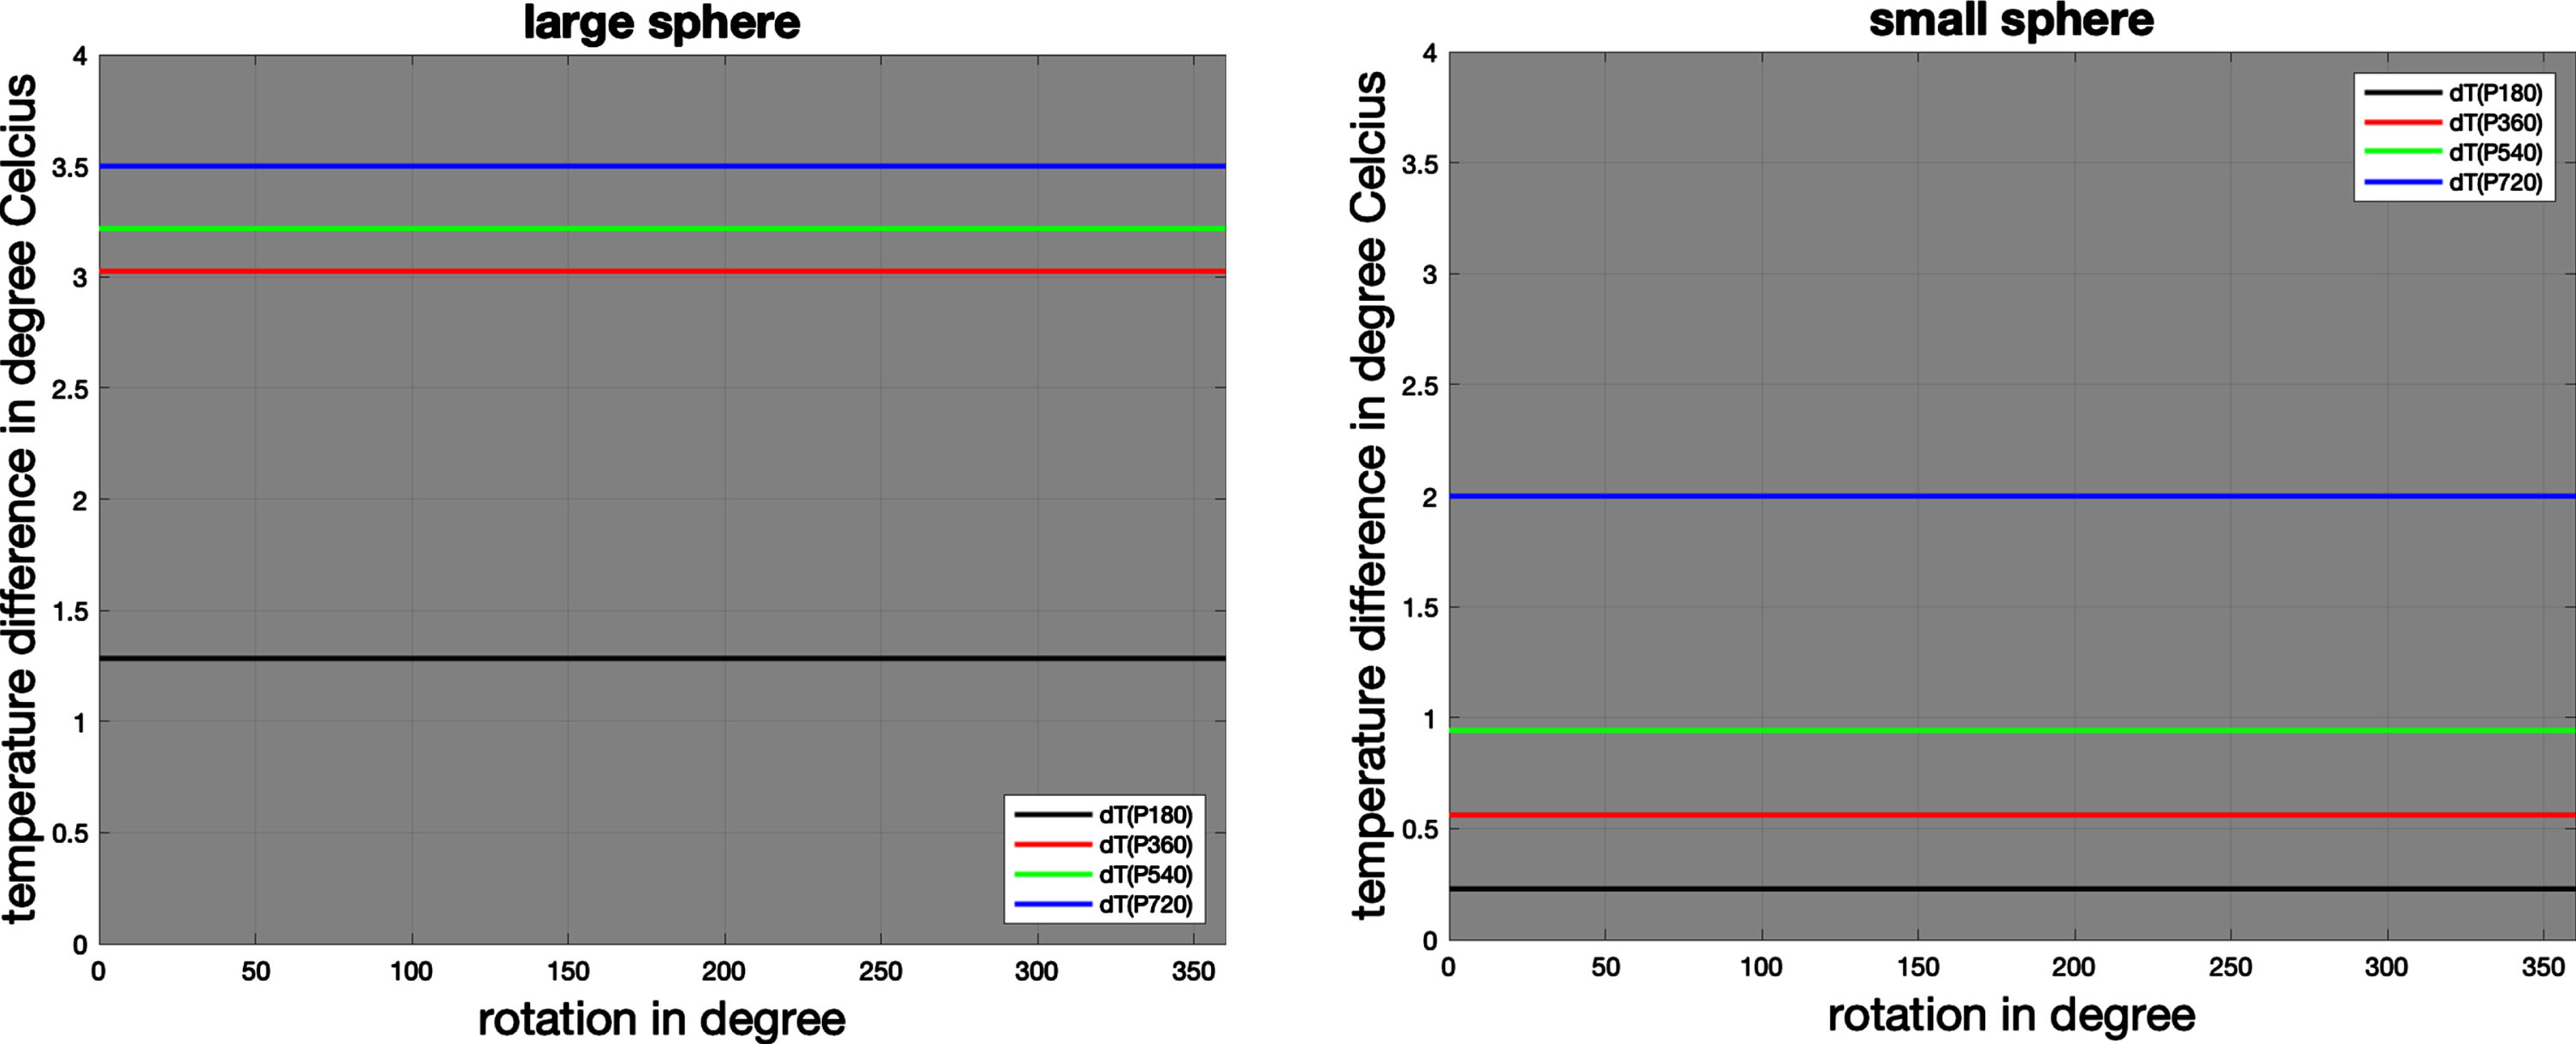
The temperature measurements in Fig. 6 lead to the following overview in Fig. 7, where the mean temperature variation during the CT scans with 180, 360, 540 and 720 projections (black, red, green and blue) over the rotation angle can be observed. The temperature difference between the sphere and the background remains almost constant during scanning. Furthermore, an increase in the number of projections generates an increase in the temperature registered with the IR camera for the metallic sphere with respect to the background. In addition, very different temperature measurements were observed for the same experimental setup (CT acquisition parameters), disregarding the positioning of the sphere.
Fig. 7
Mean temperature difference between the metal sphere and the background - black: reference CT of 180 projections, red: 360 / green: 540 / blue: 720 projections; (left) large sphere at 5 cm, (right) small sphere at 3 cm in front of the X-ray source.
4.3Photothermal analysis
Since both measurements of the dimensional expansion, the sum of the gray values of the RD image and the radial extension x in mm, are influenced by the number of projections in a quite similar way, Fig. 8 suggests the direct comparison of the two measurement techniques, taking into account the time of the scanning process: the duration of the three tomographies as well as the two 30-minute breaks, where no X-ray information is available. This proposal is in accordance with the strong relation between temperature variations and the histogram information taken from the RD image. The increasing mean gray value of the longer CT scans can be explained by the described energy dissipation, as the gray value weighted area of the histogram equals the amount of kinetic energy in the CT system. Energy dissipation is exhibited through the registered volume extension integrated as the RD sum of gray values or even as the approximated radial extension in pixels. Fig. 8 illustrates how the proposed RD analysis of radial extension for both spheres aligns with the mean temperature measurements: in the case of the global RD gray value evaluation, the temperature acts as an upper bound of the dimensional uncertainty within radiographies; for the case of local radial extension, the small sphere represents an upper bound for the temperature difference as well as the RD analysis of the large sphere. Hence, it is possible to conclude that IR mean temperature measurements taken on the flight during CT scanning are in close proximity to the volume expansion of the two or more stainless steel spheres registered with their radiographies by an industrial CT system.
Fig. 8
Mean temperature variations (left axis) vs. RD evaluation (right axis) for both spheres (large “L” and small “S”, respectively): sum of gray values (left) and radial extension in pixels (right).
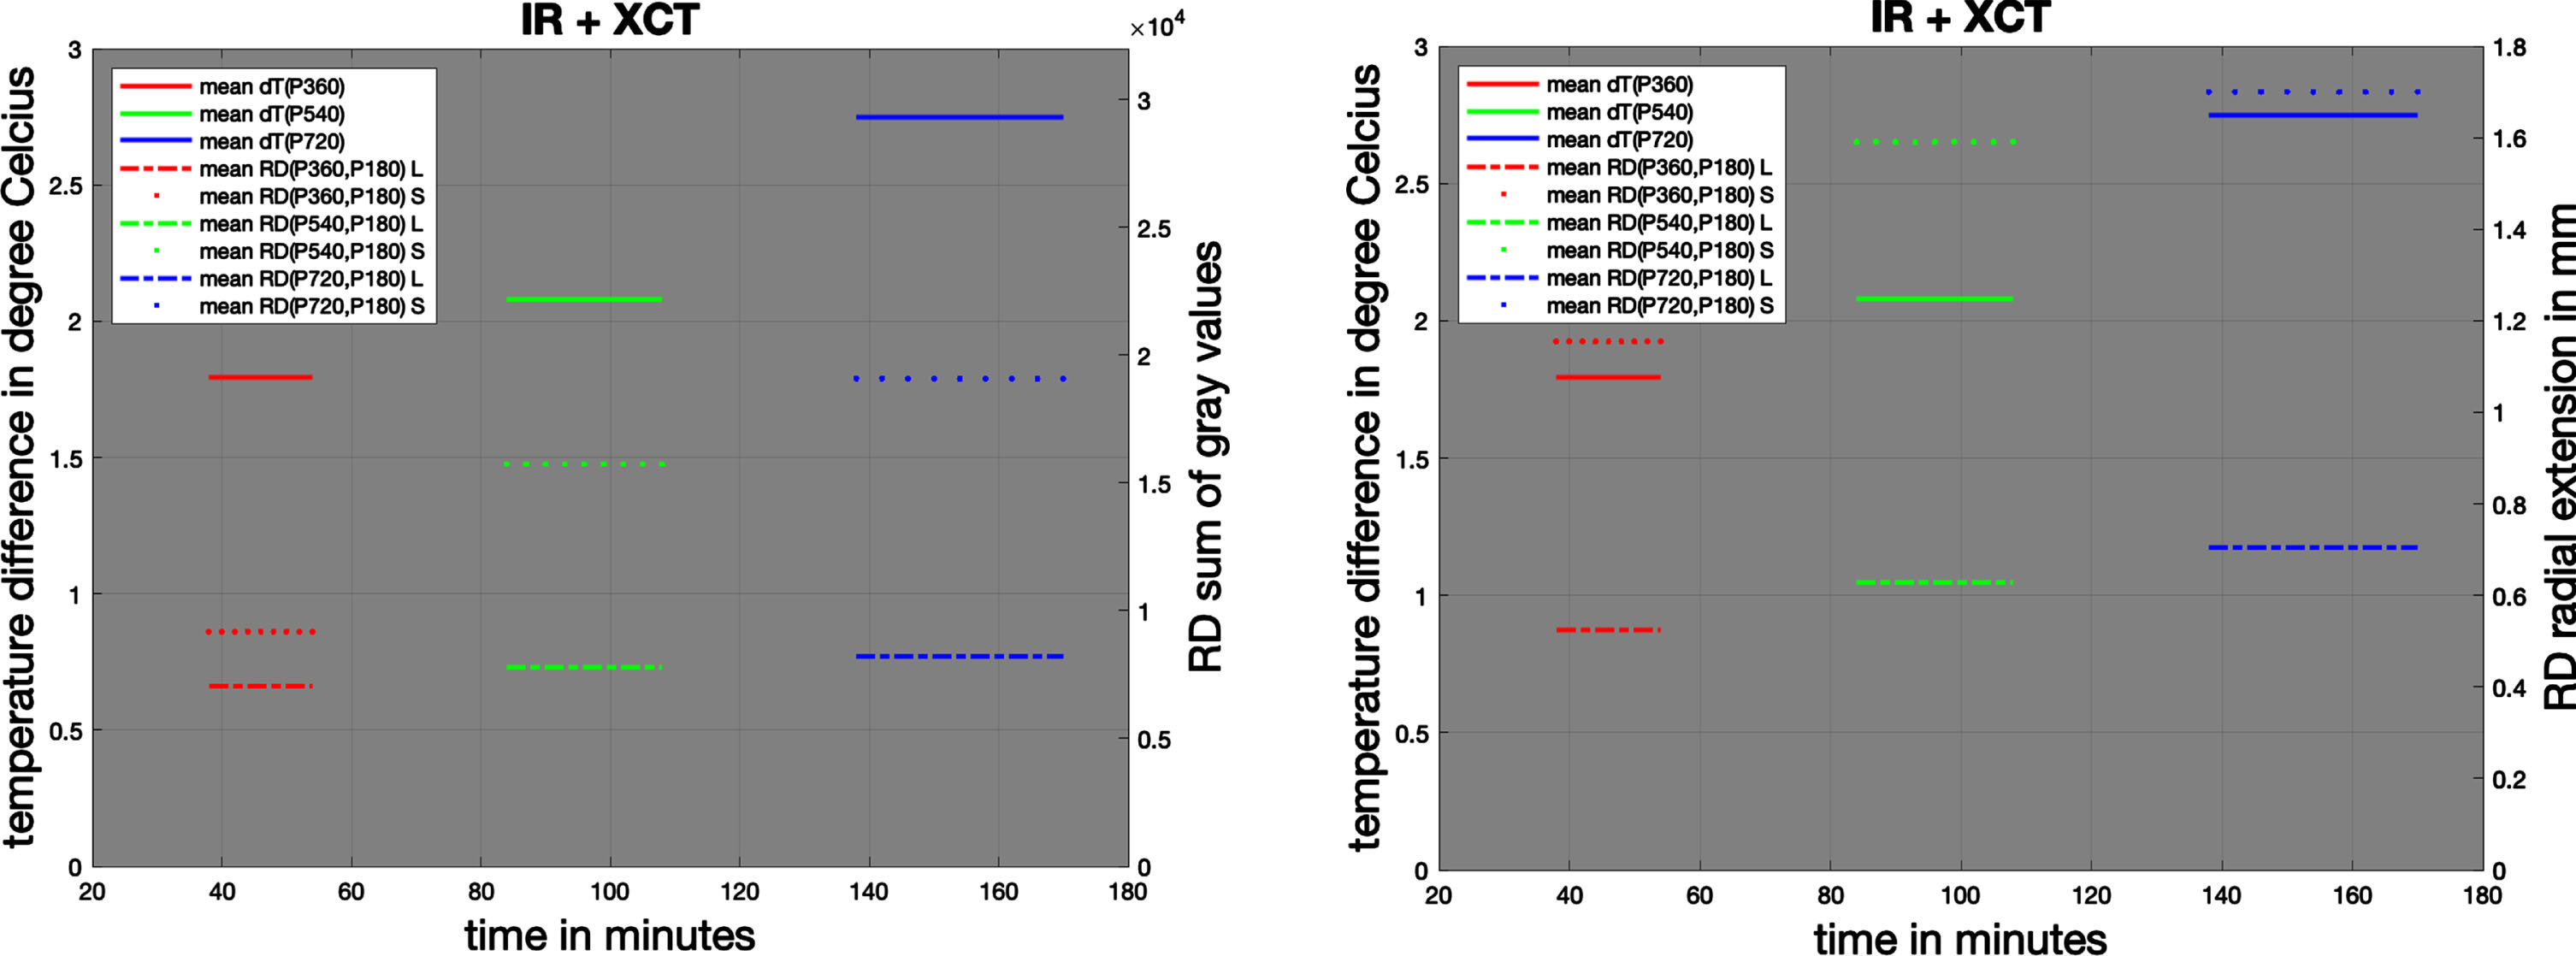
Based on the increasing step function shown in Fig. 8, for every 180 projections an approximate RD radial extension 0.15 mm appears. The estimation would approximate that after running the CT program of 720 projections, the RD radial extension would attain at most 0.6 mm on the panel, or physical sphere diameter extension 29.4 μm according to Fig. 3. This estimated result is in agreement with the prediction from the numerical evaluation of Equation (6)., for an approximated temperature difference of 6 ∘C, the IR image registration as shown in Fig. 1 b) reflect this temperature difference at the boundary (non-homogeneous heat transport), taking into account the geometry factor of
5Conclusions and future work
This study documents the importance of the photothermal effect in stainless steel spheres on dimensional uncertainty during industrial tomography. High-energy X-ray photon activity is observed in a series of repeated radiographs with a NIKON CT system XT H 225, and thermal differences are monitored with a FLIR A300 IR camera within the CT system. This bimodal methodology relates industrial measurements to quantum theories of solids and describes heat transfer in high-density and conductive materials, such as metallic alloys, that have not been considered before, especially in short-term tomographies with less than 1000 projections.
The combined X-ray RD method with IR thermography turns out to be a feasible and self-consistent strategy for a dimensional uncertainty analysis, although the available technologies metrological certificates. Under the present experimental conditions and scales, the photothermal results imply that the more projections there are for high-energy CT measurements, the less certain they become dimensional measurements based on X-ray radiographies. This conclusion should be taken into account for general CT image acquisition, which preferably requires a dense scanning procedure (⪢2000 projections), if one wants to avoid cone beam artifacts at the poles of this workpiece, when reconstructing the 3D volume with the Feldkamp-Davis-Kress (FDK) algorithm, implemented on most industrial CT systems.
This scientific contribution to the forward problem of CT imaging detects photothermal changes in the system: photon-based volume extensions became visible in the radiographies and thermal differences arose in IR images. The authors demonstrate the photothermal effect of high-energy CT on the dimensional uncertainty analysis and propose an extension of the concept of Villarraga et al. [2], where temperature variations on the scanned part as well as the CT system environment (boundary temperature radiation at the wall) are considered and increase with the number n of CT projections due to the photothermal impact. If one assigns the contribution of interactions between the process parameter that determines the X-ray photon source conditions and the object of interest with its specific material conditions to the environmental uncertainty, it is possible to resume at least for the present experimental setup
(7)
(8)
where δ is a scaling factor dependent on operational aspects such as the position of the object of interest. The above uncertainty description of type B is independent of the machine inherent imprecision. An approximate quantification of the novel parameter δ, here for the case of stainless steel 403, would affect uCT with
Most notably, to the best of the authors’ knowledge, this is the first study that investigates the perturbative nature of the number of projections in terms of its high-energy photon impact on the dimensional uncertainty; the correlations to beam hardening artefacts in metal CT scanning are close and will be investigated in further contributions of this field. The photothermal effect, resulting from the X-ray interaction, provides compelling evidence of its importance in CT imaging of metals. Here, the authors show the feasibility of acquiring key information from non contact temperature measurements in a nonintrusive manner. According to cutting edge contributions of the photothermal effect, e.g., in spectroscopy [34], it can picture relevant variations in qualitative and quantitative values for metrology.
Data availability statement
The data that support the findings of this study are included within the article. The underlying X-ray radiographies and IR images are available upon reasonable request from the authors.
Acknowledgements
The authors gratefully acknowledge partial financial support from DGAPA PAPIIT projects IA102922, IN113824, IT102423 and G100821. Furthermore, they recognize the orientation of metrological considerations for CT measurements by Gerardo Ruiz-Botello and Sergio Padilla from the group of Precision Engineering and Metrology at ICAT-UNAM.
Conflict of interest
There are no conflicts of interest to declare.
ORCID
V. M. Moock: https://orcid.org/0000-0003-1141-042x
D. E. Arce Chávez: https://orcid.org/0009-0001-3530-1642
C. García-Segundo: https://orcid.org/0000-0002-7450-0935
L. Ruiz Huerta: https://orcid.org/0000-0002-1783-3952
Author contribution
V. M. Moock: chief conceptualization, formal analysis, visualization, design and adjustments of the research, founding, writing and review
D. E. Arce Chávez: implementation of the methodology, data curation, review
C. García-Segundo: theoretical and conceptual analysis, design and adjustments of the research, writing and review
L. Ruiz Huerta: head of laboratory, conceptualization, founding, supervision, formal analysis, writing and review
References
[1] | Toda H. , X-Ray CT - Hardware and Software Techniques, Springer Singapore, 2021. |
[2] | Villarraga-Gómez H. , Lee C. , Smith S.T. , Dimensional metrology with x-ray CT: A comparison with CMM measurements on internal features and compliant structures, 2018. |
[3] | Doiron T. , 20°c — a short history of the standard reference temperature for industrial dimensional measurements, Journal of Research of the National Institute of Standards and Technology 112: (1), (2007) . |
[4] | Crowder S. , Delker C. , Forrest E. , Martin N. , Introduction to Statistics in Metrology, Springer International Publishing, 2020. |
[5] | ISO Guide to the expression of uncertainty in measurement (GUM 1995).pdf. |
[6] | Villarraga-Gómez H. , Thousand J.D. , Smith S.T. , Empirical approaches to uncertainty analysis of x-ray computed tomography measurements: A review with examples, Precision Engineering 64: ((2020) ), 249–268. |
[7] | Villarraga-Gómez H. , Smith S.T. , Effect of geometric magnification on dimensional measurements with a metrology-grade X-ray computed tomography system, volume 73. Elsevier Inc., 2022. |
[8] | Bircher B.A. , Neuhaus S. , Kung A. , Meli F. , Measurement of temperature induced x-ray tube transmission target displacements for dimensional computed tomography, Precision Engineering 72: ((2021) ), 409–416. |
[9] | Katić M. , Ferdelji N. , Sestan D. , Investigation of temperature-induced errors in xct metrology, International Journal of Automation Technology 14: ((2020) ), 484–490. |
[10] | Chen G. , Ballistic-diffusive heat-conduction equations, Physical Review Letters 86: (11), 2001. |
[11] | Vavrık D. , Jandejsek I. , Pichotka M. , Correction of the x-ray tube spot movement as a tool for improvement of the micro-tomography quality, Journal of Instrumentation 11: (01) ((2016) ), C01029. |
[12] | Yuki R. , Ohtake Y. , Suzuki H. , Acceleration of X-ray computed tomography scanning with high-quality reconstructed volume by deblurring transmission images using convolutional neural networks, volume 73. Elsevier Inc., 2022. |
[13] | Almond D.P. , Patel P.M. , Photothermal Science and Techniques, Springer Netherlands, 1996. |
[14] | Landau L.D. , Lifshitz E.M. , Theory of Elasticity, Pergamon Press, 1970. |
[15] | Peierls R.E. , Quantum Theory of Solids, Oxford Classic Texts in the Physical Sciences (2001) . |
[16] | Brierley N. , Nye B. , McGuinness J. , Mapping the spatial performance variability of an X-ray computed tomography inspection, volume 107. Elsevier Ltd, 2019. |
[17] | Villarraga-Gómez H. , Herazo E.L. , Smith S.T. , X-ray computed tomography: from medical imaging to dimensional metrology, Precision Engineering 60: ((2019) ), 544–569. |
[18] | Fournier R. , Shum A.D. , Liu J. , Sabarirajan D.C. , Xiao X. , Zenyuk I.V. , Combined infrared thermography, x-ray radiography, and computed tomography for ink drying studies, ACS Applied Energy Materials 1: (11) ((2018) ), 6101–6114. |
[19] | Turpin L. , Roux S. , Caty O. , Denneulin S. , Coupling tomographic and thermographic measurements for in-situ thermo-mechanical tests, Measurement Science and Technology 32: (3) 2020. |
[20] | Schollemann F. , Barbosa Pereira C. , Rosenhain S. , Follmann A. , Gremse F. , Kiessling F. , Czaplik M. , Abreu de Souza M. , An anatomical thermal 3D model in preclinical research: Combining CT and thermal images, Sensors 21: (4), 2021. |
[21] | Bai L. , Yi W. , Chen J. , Wang B. , Tian Y. , Zhang P. , Cheng X. , Si J. , Hou X. , Hou J. , Two-Stage targeted Bismuthene-Based composite nanosystem for multimodal imaging guided enhanced hyperthermia and inhibition of tumor recurrence, ACS Appl. Mater. Interfaces 14: (22) ((2022) ), 25050–25064. |
[22] | Essa K. , Jamshidi P. , Zou J. , Attallah M.M. , Hassanin H. , Porosity control in 316L stainless steel using cold and hot isostatic pressing, Mater. Des. 138: ((2018) ), 21–29. |
[23] | Vicente M.A. , González D.C. , Mınguez J. , Recent advances in the use of computed tomography in concrete technology and other engineering fields, Micron 118: ((2019) ), 22–34. |
[24] | Cacace S. , Pagani L. , Colosimo B.M. , Semeraro Q. , The effect of energy density and porosity structure on tensile properties of 316L stainless steel produced by laser powder bed fusion, Progress in Additive Manufacturing 7: (5) ((2022) ), 1053–1070. |
[25] | VDI / VDE 2630 Blatt 2.1 - Computed tomography in dimensional measurement Determination of the uncertainty of measurement and the test process suitability of coordinate measurement systems with CT sensors. |
[26] | ASTM E1695-20 - Standard Test Method for Measurement of Computed Tomography (CT) System Performance. |
[27] | Vopálenský M. , Sankot P. , Fort M. , Kumpová I. , Vavřik D. , Contribution of computed tomography to the investigation of early la tene culture iron artefacts. In Luca Pezzati and Piotr Targowski, editors, Optics for Arts, Architecture, and Archaeology VI. SPIE, 2017. |
[28] | Elmer P. , Flat Panel X-ray Detector XRD 1611 xP, 2012. |
[29] | FLIR Systems. User’s manual FLIRA3xx series, 2016. |
[30] | Gonzalez R.C. , Woods R.E. , Digital image processing Using MATLAB. Pearson, 2018. |
[31] | Zhang Y. , Wang X. , Qu B. , Three-Frame difference algorithm research based on mathematical morphology, Procedia Engineering 29: ((2012) ), 2705–2709. |
[32] | Baldo C.R. , Probst G.M. , Dewulf W. , Geometric errors of CT scanners and their estimation by imaging a reference object, eJNDT 27: (3), 2022. |
[33] | Praniewicz M. , Fox J.C. , Saldana C. , Toward traceable xct measurement of am lattice structures: Uncertainty in calibrated reference object measurement, Precision Engineering 77: ((2022) ), 194–204. |
[34] | Pitruzzello G. , Photothermal atogram spectroscopy, Nature Photonics 17: (837), 2023. |


