
Application of dose-gradient function in reducing radiation induced lung injury in breast cancer radiotherapy
Abstract
OBJECTIVE:
Try to create a dose gradient function (DGF) and test its effectiveness in reducing radiation induced lung injury in breast cancer radiotherapy.
MATERIALS AND METHODS:
Radiotherapy plans of 30 patients after breast-conserving surgery were included in the study. The dose gradient function was defined as
RESULTS:
On the premise of ensuring that the target dose met the clinical requirements, the trigger factor obtained based on DGF could further reduce the V5, V10, V20, V30 and mean lung dose (MLD) of the ipsilateral lung in breast cancer radiotherapy, P < 0.01. And the D2cc and mean heart dose (MHD) of the heart were also reduced, P < 0.01. Besides, the NTCPs of the ipsilateral lung and the heart were also reduced, P < 0.01.
CONCLUSION:
The trigger factor obtained based on DGF is efficient in reducing radiation induced lung injury in breast cancer radiotherapy.
1Introduction
Radiotherapy is the most important treatment for breast cancer after breast-conserving surgery, which has significant value in reducing the local recurrence rate and clinical mortality. Many studies have shown that volumetric modulated arc therapy (VMAT) is widely used in breast cancer after breast-conserving surgery, which can increase the target dose, improve the target dose distribution, significantly shorten the treatment time and reduce the dose of normal tissues [1–5].
Chest wall irradiation can affect the lung by exposing some of them to the radial and do harm to them, resulting various degrees of radiation-induced lung injury. In the era of three-dimensional radiotherapy, V20, V5 and mean dose of lung are commonly used to predict radiation-induced pneumonitis [6–9]. A prospective study [10] found that the volume of lung irradiated was closely related to the occurrence of radiation-induced lung injury, and was significantly related to the severity of radiation-induced lung injury. When V20≤20%, no radiation-induced lung injury occurred. Only 8% of the patients had radiation-induced lung injury when V20 is equal to 22% –31%, and no grade 3 radiation-induced lung injury occurred. Lind et al [11]. found that ipsilateral lung V20 < 30% could significantly reduce the incidence of radiation pneumonitis in postoperative radiotherapy for breast cancer. Zeng Yuanyuan et al [12]. found that the incidence of radiation-induced lung injury after radical mastectomy was 9.78%, and most of them were grade 1 injury. The lung volume ratio receiving more than 20Gy (V20) was an independent risk factor for radiation-induced lung injury after radical mastectomy. The V20 value can be used to predict and recommend radiotherapy, which can effectively reduce the incidence of radiation injury. Therefore, the irradiated volume and dose of the lung should be carefully evaluated to minimize the irradiation to the normal lung tissue before radiotherapy.
Doctors and physicists still rely on dose volume histogram (DVH) and traditional layer-by-layer visualization of isodose lines to evaluate plans. It is difficult for doctors to choose different plans that can generate almost the same dose distribution. Physicists are puzzled by how to quantitatively determine whether a parameter in a plan has the space for decline. In order to fully evaluate the quality of the plan, in addition to the commonly used indicators of conformity such as conformity index (CI) and heterogeneity index (HI), it is also necessary to evaluate the dose gradient to ensure an optimal dose attenuation around the target. Some studies [13–16] have introduced different gradient indices to achieve the degree of dose attenuation near the target. Sung et al. [17] proposed a new dose gradient curve (DGC) suitable for clinical practice, and they believed that DGC was a reasonable method to visualize the dose gradient as the average distance between two isodose planes. The shorter the distance, the steeper the dose gradient. In this study, a dose gradient function (DGF) was defined and a dose gradient evaluation tool based on the relative spatial relationship between isodose lines was introduced, in order to provide a basis for physicists to evaluate and further optimize the plan.
2Materials and methods
2.1Patient selection
Thirty patients who had received with Volumetric Modulated Arc Radiotherapy (VMAT) for left breast cancer after breast-conserving surgery were included in this retrospective study. Requirements on cases selection were as follows: enough exercises were carried out on the same side upper limb to meet requirements of body posture in CT localization and treatment; No lymph node metastasis; KPS > 90. The mean age of the study group was 49 (range from 32 to 65). The range of planned target volume (PTV) was from 354.32 to 1615.03 cm3.
2.2Target region delineation
After computed tomography (CT) simulation, the scanned image was sent to the Monaco treatment planning system (TPS, Version: 5.40.03). Organs at risk (heart, left and right lungs, spinal cord, contralateral breast) were segmented; target region clinical target volume (CTV) was segmented by the clinician. On the basis of CTV, the inside, outside, and back limits were extended 5 mm, respectively, to generated PTV, with the boundary under skin.
2.3Planning formulation
All plans adopted 6-MV X-ray and Elekta VERSA HD accelerator (Stockholm, Sweden, 5 mm MLC), with prescription doses all set to 2.0Gy * 25 fractions. Monaco TPS (Elekta. Inc, V 5.40.03). was adopted for plan optimization, which utilized Monte Carlo for the dose calculation 1 arc, 150∼260 degree was designed, and according to the shape of target region, corresponding collimator angles were set, table angles all 0°, maximum dose rate 600 MU/min. After providing some optimizing constraints (shown in Table 1), distribution of dose curves was automatically optimized, and through repeated parameters adjustment, the ideal distribution of dose curves was achieved.
Table 1
The optimization constraints of plans
| PTV/OARs | Constraint conditions | Objectives |
| PTV | D99 | ≥50 Gy |
| Dmax | ≤55 Gy | |
| L-lung | V20 | < 30% |
| R-lung | V20 | < 10% |
| Heart | Dmean | < 4 Gy |
| C-Breast | Dmean | < 6 Gy |
| Cord | Dmax | < 30 Gy |
2.4The definition of dose gradient function (DGF)
VMAT is a multi-field focused radiotherapy technique, which forms the distribution characteristics of isodose lines decreasing outward from the target area. The rate at which the radiation dose decreases outward from the target area determines the range of radiation dose received by the surrounding normal tissues. The faster decay rate, the less normal tissues are irradiated around the target area, and the higher the quality of the radiotherapy plan. In this study, dose gradient function (DGF) was defined and utilized to quantify the decay rate of dose and to guide the re-optimization of the plan, improving the quality of the radiotherapy plan. The DGF was defined as follows:
(1)
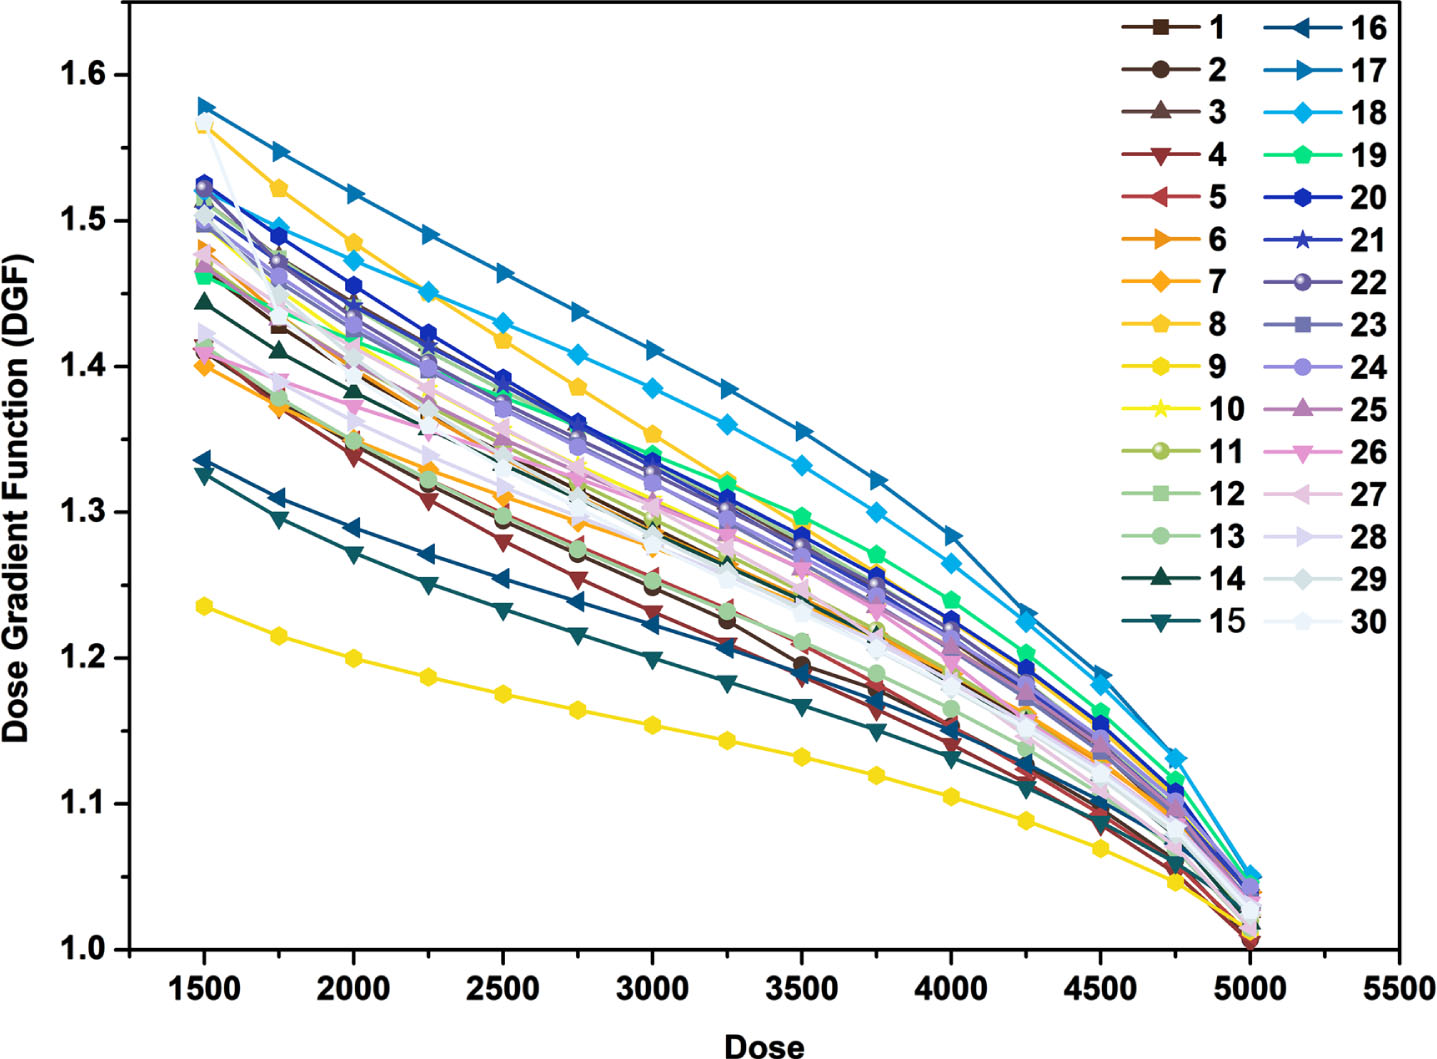
where VD is the volume of isodose line generated structure, VP is the volume of target (PTV). According to the above definition DGF, the thirty VMAT plans were analyzed. The volume of isodose line (from V50Gy to V15Gy, the step size is 0.25Gy) was generated for each case, and then the DGF was calculated. The Dose-DGF curve was plotted as shown in Fig. 1.
Fig. 1
The Dose-DGF curves of 30 patients.
2.5The mechanism of DGF guiding radiotherapy plan optimization
2.5.1A simple example describes the properties of DGF
Figure 2 A, B shows two typical DGF examples, indicating the area where the iso-dose line of 5000cGy-1500cGy intersects the left lung. The shorter the distance between the dose lines, the steeper the dose gradient and the faster the dose attenuation, the smaller the volume of the left lung that receives the radiation dose (Fig. 2A). Meanwhile, according to the formula (1), the lower the value of VD, the less DGF, therefore, the faster the dose attenuation. As shown in Fig. 2C, the smaller the area under the D-DGF curve, the lower the irradiation dose received by organ at risk (OARs, when SPA < SPB, we have DPA,OARs < DPB,OARs, here SPA, SPB were indicated as area under the patient’s A and B D-DGF curve, DPA; DPA, DPB were indicated as the dose of patient A and B). Thus, in this study, the area under the D-DGF curve was used as a trigger factor to guide the optimization of the plan, reducing radiation-induced lung injury in breast cancer postoperative radiotherapy.
Fig. 2
A, B) Two typical DGF examples; C) The area under the D-DGF curve of representative patient A and B.

2.5.2The mechanism of DGF guiding radiotherapy plan optimization
The area under the D-DGF curve of thirty patients were calculated by GraphPad Prism Software (Table 2). The volume of 2000cGy dose line (V20) of left lung in original plan was statistical. As shown in Table 2, the plan of 9th patient was considered to be the optimal plan, therefore, select and use the minimum area value (Smin) as the trigger operator to trigger the re-optimization of other patient plans respectively. The plans were triggered to optimize for area reduction.
Table 2
The area under the D-DGF curve and the V20 of left lung of thirty patients
| No | Area (S, cm2) | V20 (%) | No | Area (S, cm2) | V20 (%) | No | Area (S, cm2) | V20 (%) |
| 1 | 4413 | 15.6 | 11 | 4426 | 14.8 | 21 | 4533 | 12.26 |
| 2 | 4276 | 14.5 | 12 | 4538 | 18.4 | 22 | 4524 | 12.78 |
| 3 | 4532 | 13.4 | 13 | 4300 | 11.4 | 23 | 4496 | 9.76 |
| 4 | 4238 | 11.6 | 14 | 4390 | 11.9 | 24 | 4512 | 13.47 |
| 5 | 4287 | 11.9 | 15 | 4135 | 11.9 | 25 | 4461 | 15.48 |
| 6 | 4421 | 17.2 | 16 | 4198 | 11 | 26 | 4413 | 13.18 |
| 7 | 4355 | 16 | 17 | 4770 | 22.78 | 27 | 4432 | 20.31 |
| 8 | 4615 | 17.3 | 18 | 4681 | 20.21 | 28 | 4365 | 10.32 |
| 9 | 3981 | 10.5 | 19 | 4549 | 17.58 | 29 | 4412 | 5.65 |
| 10 | 4481 | 11.4 | 20 | 4567 | 15.44 | 30 | 4405 | 20.47 |
* NO is the number of 30 patients.
2.6Evaluation parameters
On the premise of meeting clinical requirements, the following comparisons among the plans of before and after optimization were conducted using dose-volume histogram (DVH): V95, V100, V107, V110, D98, and D2, as well as conformity and homogeneity of target; mean dose, V5, V10, V20, and V30 of L-lung; V5, V10, V20 and mean dose of right lung; D2 and mean dose of heart; D1 and mean dose of contralateral breast; maximum dose of the spinal cord; low dose bath (10% Rx); Monitor Unit (MUs). Among statistical indexes of the target region, VX represents the target volume wrapped by X% prescription dose. In this research, volume parameters were adopted to evaluate minimum and maximum dose in the target region. The minimum dose is that 98% PTV exceeds (D98), and the maximum dose is that 2% PTV exceeds (D2).
2.7Calculation of radiobiological parameters
According to the Lyman-Kutcher-Burman model, NTCP for Vx of an OAR is given by [18]:
(2)
Where,
(3)
Where, V20 represents the volume of the OAR receiving the dose of≥20Gy, and V20, 50 represents the volume received under≥20Gy when the probability of radiotherapy complications is 50%.
In addition, according to literature [19] research results, the probability of radioactive cardiac events will increase by 7.4% when the average cardiac dose increases by 1Gy, that is:
(4)
In this paper, our team selected formulas (2) and (4) to calculate the NTCP of the L- Lung and heart respectively.
2.8Statistical analysis
The Paired-Samples T-test was used to carry out statistical analysis using SPSS statistical software (V.28.0.1, SPSS, Inc., Chicago, IL), and P < 0.05 was considered statistically significant.
3Results
3.1Comparison of target dose
As shown in Table 3, the radiotherapy plans before and after optimization were compared, the evaluation parameters of PTV were not statistically significant (P > 0.05), suggesting that the re-optimization of the plan had no effect on the coverage of the target. Low dose bath (the volume of 500 cGy) and Monitor Unit (MUs) were no statistically significant (P > 0.05).
Table 3
Comparison of tumor target dose between the original plan and the DGF plan in 30 patients
| Evaluation parameters | Original plan | DGF plan | P value |
| V95 (%) | 98.91±0.75 | 98.69±0.50 | 0.133 |
| V100 (%) | 95.26±0.56 | 95.31±0.61 | 0.332 |
| V107 (%) | 11.25±18.14 | 6.26±6.73 | 0.190 |
| V110 (%) | 2.24±6.94 | 0.65±1.20 | 0.236 |
| D2 (cGy) | 5408.03±87.22 | 5393.48±72.07 | 0.527 |
| D98 (cGy) | 4848.89±100.85 | 4853.85±59.84 | 0.806 |
| 10% Rx (cm3) | 3809.34±120.34 | 3656.69±121.23 | 0.25 |
| MUs | 897.94±130.18 | 935.57±114.11 | 0.134 |
3.2Comparison of dose parameters of OARs
3.2.1Left lung
In the radiotherapy of breast cancer, the ipsilateral lung is one of the important OARs. Figure 3 compares of the V20 of Left lung between the original plan and the DGF plan in 30 patients, the results showed that after optimization, the V20 in the left lung is down (26 of 30 patients). All with statistical significance (P < 0.001) observed through paired comparisons (Table 4).
Fig. 3
The V20 of Left lung between the original plan and the DGF plan in 30 patients.
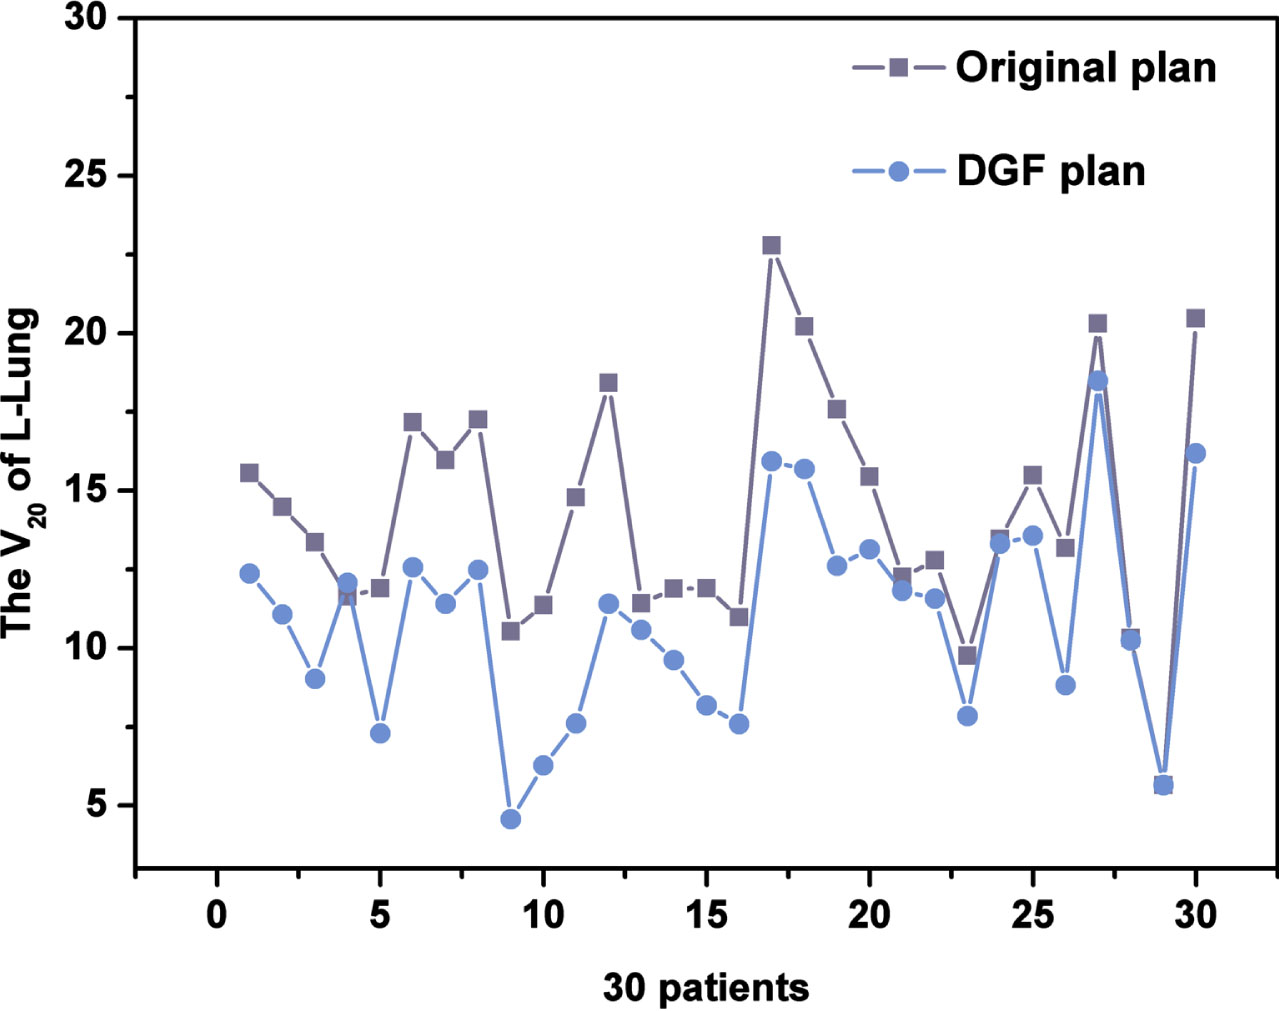
Table 4
Comparison of OARs between the original plan and the DGF plan in 30 patients
| Evaluation parameters | Original plan | DGF plan | P value | |
| Lung-L | V5 (%) | 43.01±12.67 | 35.82±7.54 | 0.005 |
| V10 (%) | 25.00±5.74 | 19.74±4.87 | < 0.001 | |
| V20 (%) | 14.28±3.81 | 10.96±3.30 | < 0.001 | |
| V30 (%) | 9.22±3.25 | 6.45±2.46 | < 0.001 | |
| MLD (cGy) | 920.61±151.73 | 763.63±143.65 | < 0.001 | |
| Heart | D2cc (cGy) | 3261.13±1040.46 | 2745.45±975.43 | 0.001 |
| MHD (cGy) | 356.89±69.67 | 293.84±50.94 | < 0.001 | |
| LAD | Mean (cGy) | 1835.32±69.38 | 1453.06±57.22 | < 0.01 |
| Lung-R | V5 (%) | 15.11±13.03 | 9.24±8.84 | 0.023 |
| V10 (%) | 1.90±2.87 | 0.78±2.15 | 0.085 | |
| V20 (%) | 0.04±0.20 | 0.00±0.01 | 0.331 | |
| MLD (%) | 265.79±128.17 | 232.56±82.14 | 0.146 | |
| Breast-R | D1cc (cGy) | 1782.05±824.25 | 2026.35±1110.95 | 0.183 |
| MBD (cGy) | 369.99±159.63 | 323.19±119.36 | 0.121 | |
| Cord | DMax (cGy) | 358.12±230.22 | 399.45±201.17 | 0.383 |
The studies have shown that radiation-induced lung injury after volume-modulated radiotherapy (VMAT) for left breast cancer is correlated with the different dose volumes and mean dose of the ipsilateral lung, and the low dose volume of the ipsilateral lung has a certain degree of influence on the occurrence of radiation-induced lung injury as well as the high dose volume of the ipsilateral lung. In breast cancer radiotherapy, in addition to paying attention to the traditional predictors of radiation-induced lung injury such as V20, the evaluation of V5, V10, V30 and MLD should be further strengthened. In this study, we found that when V20 decreased, V5, V10, V30 and MLD also decreased, all with statistical significance (P < 0.01) observed through paired comparisons (Table 4). It was concluded that the introduction of DGF could affect the whole dose curve of the left lung.
3.2.2Other OARs
Comparison of OARs between the original plan and the DGF plan in 30 patients. As shown in Table 4, compared with the original plan, the D2cc and Dmean of heart and V5 of right lung were significantly decreased in the DGF plan guided by dose gradient function, all with statistical significance (P < 0.05). In addition, although the V10, V20, Dmean of the right lung, D1CC, Dmean of the breast-R and DMax were not statistically significant (P > 0.05), all met the clinical requirements.
3.3The DVH and dose distribution of the typical patients
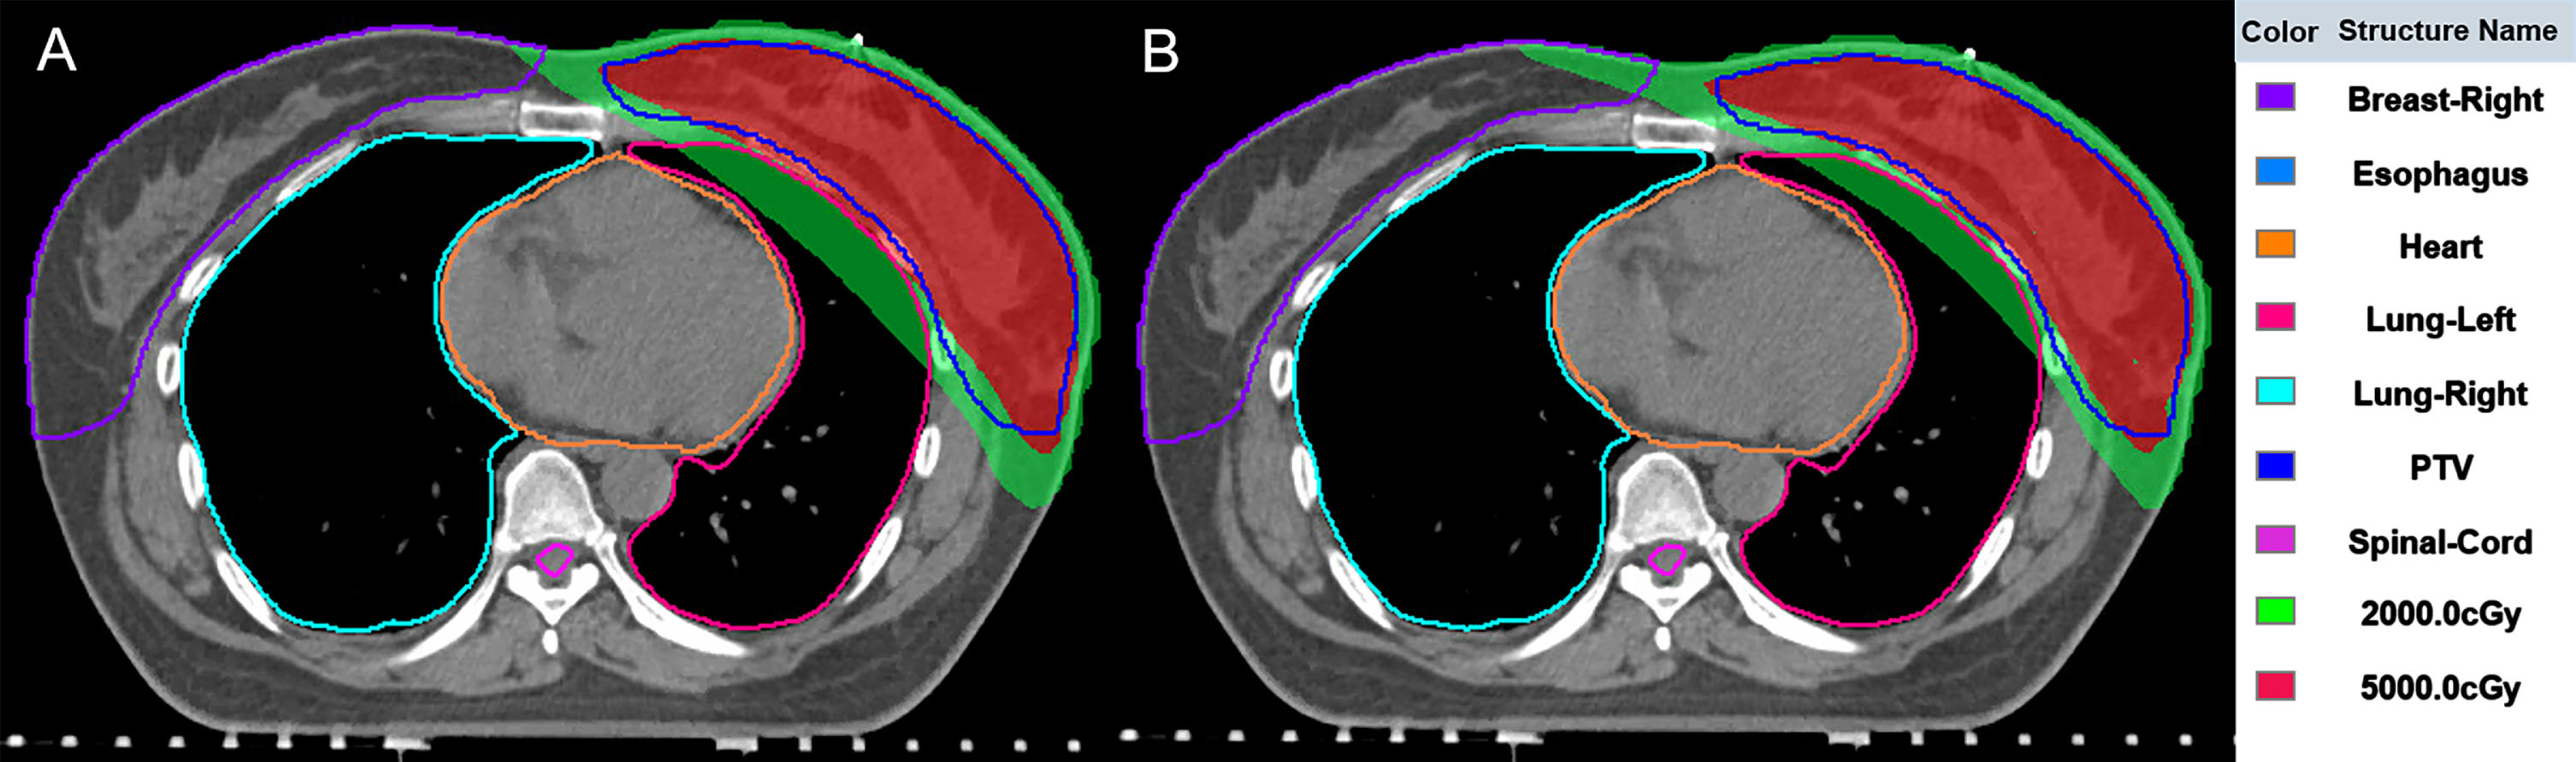
The DVH curves between the original plan and the DGF plan of the typical patient are shown in Fig. 4. The DVH curves illustrate that there was no significant change in the target dose after optimization, however, the doses to OARs were significantly reduced. Figure 5 shows the position relationship between 5000cGy, 2000cGy and the left lung on the patient’s transverse section. After optimization (Fig. 5B), the overlap area between 2000cGy and the left lung was smaller, reduces damage to normal left lung tissue.
Fig. 4
The DVH curves between the original plan and the DGF plan of the typical patient.
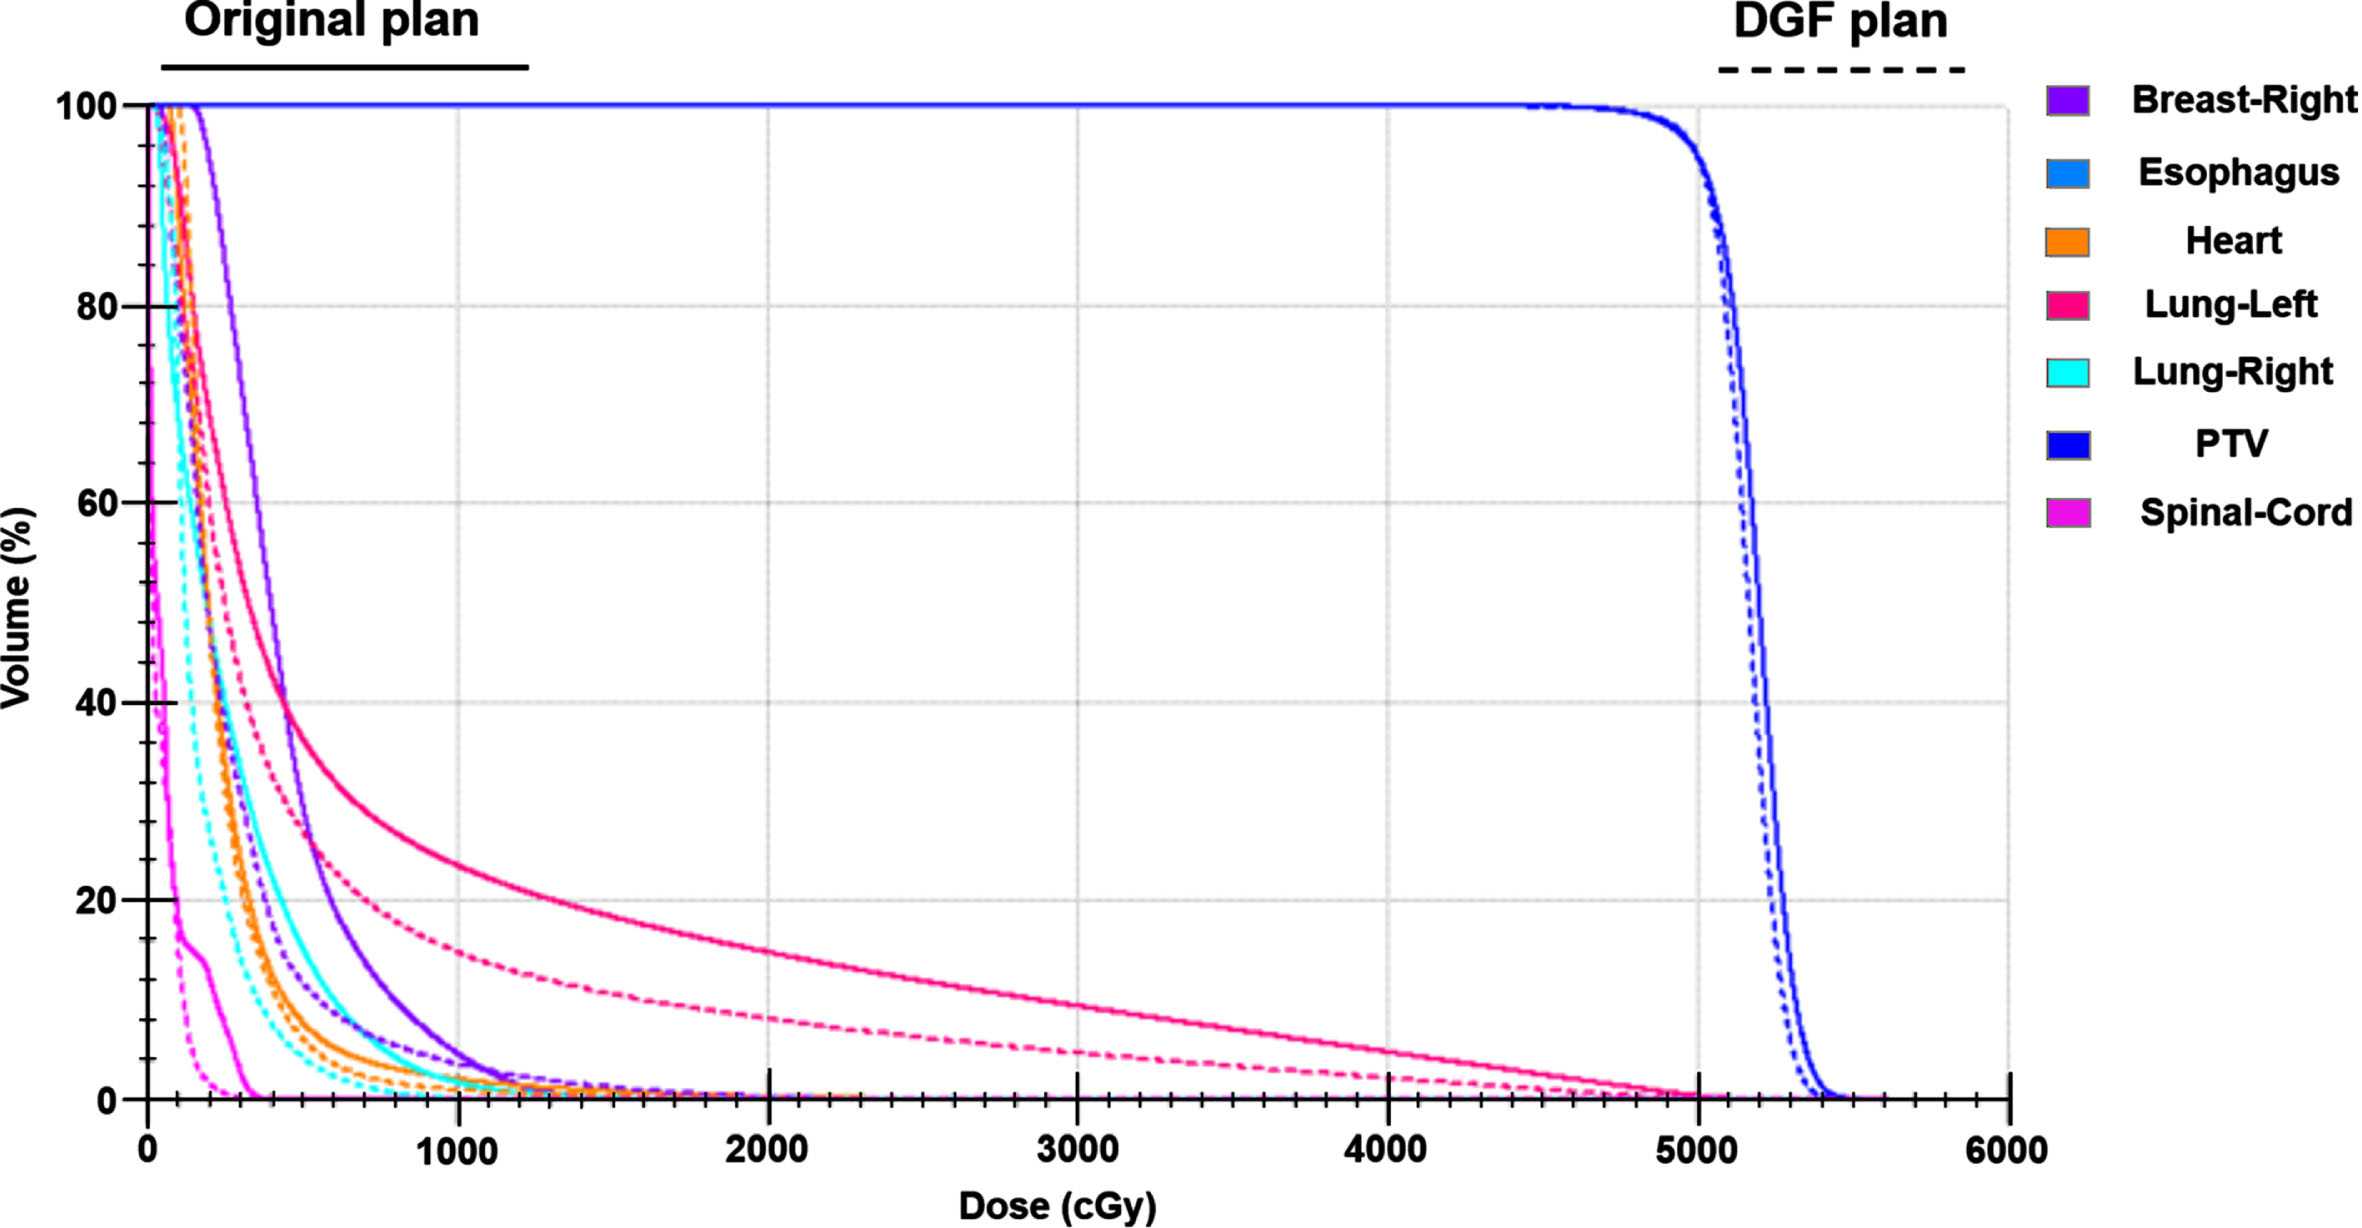
Fig. 5
The dose distribution between the original plan (A) and the DGF plan (B) of the typical patient.
3.4Radiobiological results for left lung and heart
The results of NTCP of L-Lung were presented in Table 6, the difference of NTC P value of V20 before and after re-optimization was statistically significant (P < 0.001). According to the formulas (4), the magnitude of the risk value was calculated and shown in Table 5, the incidence of major coronary decreased from 2.64 % to 2.17% (P < 0.001).
Table 5
Comparison of NTCP of left lung and percent increase in rate of major coronary events
| Parameters | Type | Original (%) | Re-optimized (%) | t | P |
| V20 | NTCP | 15.00±5.90 | 10.46±3.94 | 7.33 | < 0.001 |
| Heart | 2.64±0.51 | 2.17±0.37 | 5.73 | < 0.001 |
4Discussions
Breast radiotherapy is challenging and complicated, as the target being located on one side of the body and surrounding organs make this an inherently difficult site to achieve a homogeneous dose distribution. Plane 2D resulted in dose inhomogeneities, particularly in women with larger breasts. An inhomogenous dose may lead to increased normal tissue side effects and poor cosmetic results, which can cause significant psychological morbidity for patients. The introduction and wide application of CT and computer technology in radiotherapy were the beginning of precise radiotherapy. Three-dimensional conformal radiation therapy (3D-CRT) was the beginning technology of the precise radiotherapy. 3D-CRT followed by Intensity modulated radiation therapy (IMRT), and then many sub-technologies were developed based on IMRT. The study of Selvaraj, et al. showed that the reductions of V105 and V110 for the IMRT compared to 3DCRT were 44.7% and 66.3%, respectively (P < 0.01). The mean dose and V30 for heart with IMRT were 2.3 (SD: 1.1) and 1.05 (SD: 1.5) respectively, which was a reduction by 6.8% and 7.9%, respectively, in comparison with 3D. Similarly, the mean dose and V20 for the ipsilateral lung and the percentage of volume of contralateral volume lung receiving > 5% of prescribed dose with IMRT were reduced by 9.9%, 2.2%, and 35%, respectively [20]. A dosimetric study on radiotherapy for left side breast cancer showed that both VMAT and IMRT led to improved PTV95 % coverage (95.63±1.82% in VMAT; 93.70±2.16 % in IMRT; 81.40±6.27% in 3D-CRT) and improved CI (0.96±0.02 in VMAT; 0.91±0.06 in IMRT) as compared to 3D-CRT (0.66±0.11) [21]. It can be seen that the dose of peripheral organs at risk can be reduced effectively by selecting better radiotherapy techniques. But when the technique is not optional, how to judge plans can be improved is remaining a problem.
Therefore, many methods have been raised, which can be used to improve the quality of plans. An earlier model for predicting the dose of OARs in radiotherapy for breast cancer was proposed by Oxford and researchers assessed the value of maximum heart distance (MHD) in predicting the dose and biologically effective dose (BED) to the heart and the left anterior descending (LAD) coronary artery for left-tangential breast or chest wall irradiation [22]. With our proposed DGF optimization, the dose gradient at the edge of the target is improved, the dose “diffused” to the LAD is reduced. And then OVH was proposed, and the OVH achieves a new patient’s DVH by comparing the distance of the OARs and targets of the new patient with those of prior patients, whose plans were maintained in a database. The basis for this calculation was r _ v, 1 ⩾ r _ v, 2 ⇒ Dv,1 ⩽ Dv,2. For v > OVH(0), we have rv,2 > rv,1; then Dv,2 > Dv,1 was expected. For v < OVH(0), we have rv,1 > rv,2; then Dv,1 < Dv,2 was expected. For v = OVH(0), we have rv,1 = rv,2; then Dv,1 = Dv,2 was expected. This method is effective in predicting the dose of parotid gland in NPC radiotherapy [23]. Several subsequent studies based on OVH expanded the connotation and application scope of OVH [24–26]. However, one shortcoming of these method is that the distance r exists between two points, but the edge of the target is three-dimensional-space curved surface, besides the dose variation occurs in a three-dimensional space. So, only considering the distance in one plane is not enough for optimizing plans.
In the paper, the research team obtained DGF based on the continuance of the dose gradient (DF) concept in SBRT [27–29]. DF’s formula is
The pursuit of lower doses of OARs is essentially an expectation of lower NTCP. So, this study also investigated the change of NTCP caused by the decrease of physical dose, and the results showed that the decrease of physical dose actually resulted in the decrease of NTCP, as shown in Table 6. With the method proposed in this study, the NTCP of the ipsilateral lung can be reduced by about 4.5% and the heart by about 0.5%.
Through the method proposed in this paper, we can review the team’s previous breast-conserving radiotherapy plans to obtain a DGF-curve to guide the design of new plans, or extract a DGF-curve from the plans designed by experienced physicists (dosimetrists) to guide the plan design of entry-level physicists (dosimetrists). Can guarantee continuously improving the quality of plans and keeping the quality level of plans from declining due to the different experiences of the physicist (dosimetrist). In the clinical workflow, the proposed method provides guidance for optimization and, in theory, reduces the number of trial and error in planning. Another potential implication is to programmatically build the recommended methods into TPS to evaluate plans or drive automatic optimization of plans, and our research team will address it in future studies.
5Conclusion
The dose-gradient function is valid in reducing radiation induced lung injury in breast cancer radiotherapy.
Conflict of interest
The authors declare that the research was conducted in the absence of any commercial or financial relationships that could be construed as a potential conflict of interest.
Author contributions
HB, QL, and XP conceived and designed the study. HS, QL, JB, RW, XL and FC retrieved and analyzed the documents. QL and HS collected the Figures. HB wrote the paper. XP supervised the study, reviewed, and edited the manuscript. All authors approved the final manuscript.
Funding
This work was financially supported by the Science, Technology Department of Yunnan Province (202101AY070001-164).
References
[1] | Chang J.S. , Chang J.H. , Kim N. , Kim K. et al., Intensity Modulated Radiotherapy and Volumetric Modulated Arc Therapy in the Treatment of Breast Cancer: An Updated Review, J Breast Cancer 25: (5) ((2022) ), 349–365. |
[2] | Cheng H.W. , Chang C.C. , Shiau A.C. , Tsai J.T. et al., Dosimetric comparison of helical tomotherapy, volumetric-modulated arc therapy, intensity-modulated radiotherapy, and field-in-field technique for synchronous bilateral breast cancer, MED DOSIM 45: (3) ((2020) ), 271–277. |
[3] | Yin Y. , Chen J. , Sun T. , Wang R. et al., Dosimetric research on intensity-modulated arc radiotherapy planning for left breast cancer after breast-preservatxion surgery, MED DOSIM 37: (3) ((2012) ), 287–92. |
[4] | Iorio G.C. , Franco P. , Gallio E. , Ricardi U. et al., Volumetric modulated arc therapy (VMAT) to deliver nodal irradiation in breast cancer patients, MED ONCOL 35: (1) ((2017) ), 1. |
[5] | Pasler M. , Lutterbach J. , Björnsgard M. , Georg D. et al., VMAT techniques for lymph node-positive left sided breast cancer, Z MED PHYS 25: (2) ((2015) ), 104–11. |
[6] | Marks L.B. et al., Dosimetric predictors of radiation-induced lung injury, Int J Radiat Oncol 54: (2) ((2002) ), 313–6. |
[7] | Pan W.Y. , Bian C. , Zou G.L. , Wang Y.Y. et al., Combing NLR, V20 and mean lung dose to predict radiation induced lung injury in patients with lung cancer treated with intensity modulated radiation therapy and chemotherapy, Oncotarget 8: (46) ((2017) ), 81387–81393. |
[8] | Chen J. , Hong J. , Zou X. , Zhang W. et al., Association between absolute volumes of lung spared from low-dose irradiation and radiation-induced lung injury after intensity-modulated radiotherapy in lung cancer: a retrospective analysis, J Radiat Res 56: (6) ((2015) ), 883–8. |
[9] | Zeng F.H. , He H.T. , Relationship between radiation-induced lung injury and low-dose irradiated volume in breast cancer patients treated with intensity-modulated radiotherapy, Chinese Journal of Prescription Drugs 20: (02) ((2020) ), 165–167. |
[10] | Graham M.V. , Purdy J.A. , Emami B. et al., Clinical dose-volume histogram analysis for pneumonitis after 3D treatment for non-small cell lung cancer (NSCLC), Int J Radiat Oncol Biol Phys 45: (2) ((1999) ), 323–329. |
[11] | Lind P.A. , Marks L.B. , Hardenbergh P.H. et al., Technical factors associated with radiation pneumonitis after local+/- regional radiation therapy for breast cancer, Int J Radiat Oncol 52: (1) ((2002) ), 137–43. |
[12] | Zeng Y.Y. , Tao L. , Zhao C. , Deng Y.F. et al., Risk Factors of Radiotherapy-induced Lung Injury after Radical Mastectomy, Chin J Cancer 35: (04) ((2020) ), 643–646. |
[13] | Ohtakara K. , Hayashi S. , Hoshi H. , Dose gradient analyses in Linac-based intracranial stereotactic radiosurgery using Paddick’s gradient index: consideration of the optimal method for plan evaluation, J Radiat Res 52: (5) ((2011) ), 592–9. |
[14] | Hossain S. , Xia P. , Huang K. , Ma L. et al., Dose gradient near target-normal structure interface for nonisocentric CyberKnife and isocentric intensity-modulated body radiotherapy for prostate cancer, Int J Radiat Oncol 78: (1) ((2010) ), 58–63. |
[15] | Giżyńska M.K. , Kukołowicz P.F. , KordowskiImplementation P. , of a dose gradient method into optimization of dosedistribution in prostate cancer 3D-CRT plans, Rep Pract OncolRadi 19: (6) ((2014) ), 385–91. |
[16] | Reynolds T.A. , Jensen A.R. , Bellairs E.E. , Ozer M. , Dose Gradient Index for Stereotactic Radiosurgery/Radiation Therapy, Int J Radiat Oncol. 106: (3) ((2020) ), 604–611. |
[17] | Sung K. , Choi Y.E. , Dose gradient curve: A new tool for evaluating dose gradient, PLoS One 13: (4) ((2018) ), e0196664. |
[18] | Borst G.R. , Ishikawa M. , Nijkamp J. , Sonke J.J. et al., Radiation pneumonitis after hypofractionated radiotherapy: evaluation of the LQ(L) model and different dose parameters, Int J Radiat Oncol. 77: (5) ((2010) ), 1596–1603. |
[19] | Darby S.C. , Ewertz M. , McGale P. , Hall P. et al., Risk of ischemic heart disease in women after radiotherapy for breast cancer, New Engl J Med. 368: (11) ((2013) ), 987–998. |
[20] | Selvaraj R.N. , Beriwal S. , Pourarian R.J. , Heron D.E. et al., Clinical implementation of tangential field intensity modulated radiation therapy (IMRT) using sliding window technique and dosimetric comparison with 3D conformal therapy (3DCRT) in breast cancer, MED DOSIM. 32: (4) ((2007) ), 299–304. |
[21] | Das Majumdar S.K. , Amritt A. , Dhar S.S. , Parida D.K. et al., A Dosimetric Study Comparing 3D-CRT vs. IMRT vs. VMAT in Left-Sided Breast Cancer Patients After Mastectomy at a Tertiary Care Centre in Eastern India, Cureus 14: (3) ((2022) ), e23568. |
[22] | Taylor C.W. , McGale P. , Povall J.M. , Darby S.C. et al., Estimating cardiac exposure from breast cancer radiotherapy in clinical practice, Int J Radiat Oncol 73: (4) ((2009) ), 1061–8. |
[23] | Wu B. , Ricchetti F. , Sanguineti G. , McNutt T. et al., Patient geometry-driven information retrieval for IMRT treatment plan quality control, Med Phys. 36: (12) ((2009) ), 5497–505. |
[24] | Zhou Z. , Zhang W. , Guan S. , An effective calculation method for an overlap volume histogram descriptor and its application in IMRT plan retrieval, Phys Medica 32: (10) ((2016) ), 1339–1343. |
[25] | Wu B. , Pang D. , Lei S. , Collins S. et al., Improved robotic stereotactic body radiation therapy plan quality and planning efficacy for organ-confined prostate cancer utilizing overlap-volume histogram-driven planning methodology, Radiother Oncol 112: (2) ((2014) ), 221–6. |
[26] | Wu B. , Pang D. , Simari P. , McNutt T. et al., Using overlap volume histogram and IMRT plan data to guide and automate VMAT planning: a head-and-neck case study, Med Phys 40: (2) ((2013) ), 021714. |
[27] | Liu C.W. , Cho Y.B. , Magnelli A. et al., The dosimetric impact of titanium implants in spinal SBRT using four commercial treatment planning algorithms, J Appl Clin Med Phys ((2023) ), e14070. |
[28] | Dwivedi S. , Kansal S. , Shukla J. et al., Dosimetric assessment of the mono and dual-isocentric VMAT technique based on flattening filter-free beams for SBRT with non-contiguous spinal targets, Med Dosim. 48: (2) ((2023) ), 90–97. |
[29] | Dupuis P. , Francois M. , Baudier T. et al., Evaluation of adedicated software for semi-automated VMAT planning of spineStereotactic Body Radiotherapy (SBRT), Phys Med. 109: ((2023) ), 102578. |


