
An interpretable multi-task system for clinically applicable COVID-19 diagnosis using CXR
Abstract
BACKGROUND:
With the emergence of continuously mutating variants of coronavirus, it is urgent to develop a deep learning model for automatic COVID-19 diagnosis at early stages from chest X-ray images. Since laboratory testing is time-consuming and requires trained laboratory personal, diagnosis using chest X-ray (CXR) is a befitting option.
OBJECTIVE:
In this study, we proposed an interpretable multi-task system for automatic lung detection and COVID-19 screening in chest X-rays to find an alternate method of testing which are reliable, fast and easily accessible, and able to generate interpretable predictions that are strongly correlated with radiological findings.
METHODS:
The proposed system consists of image preprocessing and an unsupervised machine learning (UML) algorithm for lung region detection, as well as a truncated CNN model based on deep transfer learning (DTL) to classify chest X-rays into three classes of COVID-19, pneumonia, and normal. The Grad-CAM technique was applied to create class-specific heatmap images in order to establish trust in the medical AI system.
RESULTS:
Experiments were performed with 15,884 frontal CXR images to show that the proposed system achieves an accuracy of 91.94% in a test dataset with 2,680 images including a sensitivity of 94.48% on COVID-19 cases, a specificity of 88.46% on normal cases, and a precision of 88.01% on pneumonia cases. Our system also produced state-of-the-art outcomes with a sensitivity of 97.40% on public test data and 88.23% on a previously unseen clinical data (1,000 cases) for binary classification of COVID-19-positive and COVID-19-negative films.
CONCLUSION:
Our automatic computerized evaluation for grading lung infections exhibited sensitivity comparable to that of radiologist interpretation in clinical applicability. Therefore, the proposed solution can be used as one element of patient evaluation along with gold-standard clinical and laboratory testing.
1Introduction
The novel coronavirus disease 2019 (COVID-19) was first detected in December 2019, in Wuhan, China and had rapidly spread over the world [1]. Presently, COVID-19 remains a global threat, and the World Health Organization (WHO) has declared COVID-19 a global pandemic. Current clinical experience suggests that the RT-PCR detection of viral RNA has low sensitivity, especially in the early stage [2]. As a form of pneumonia, inflammation of air sacs in lungs has been found, and it has been shown that bilateral lung involvement could be observed for early, intermediate, and late-stage patients. In order to more effectively control the spread of COVID-19, to appropriately triage patients, and to reduce the mortality rate, medical images play an important role as an early, non-invasive test that broadly captures the lung field [3]. In current clinical practice, 2D chest radiography and 3D computed tomography (CT) are the two recommended imaging modalities to detect COVID-19, assess its severity and monitor its prognosis (or response to the treatment). As a modality, CT generally demonstrates higher sensitivity, however, chest X-ray has broader clinical application given advantages including low cost, low radiation dose, ease of operation and wide accessibility in general or community hospitals [4]. Reading a high volume of chest X-ray images to detect subtle COVID-19 pneumonia and/or distinguish it from other forms of pneumonia is difficult due to many radiographic similarities between pneumonia resulting from COVID-19 infection and that caused by other infections. Therefore, radiologists face a clinical challenge in the management of COVID-19 [5], as they need to perform accurate differentiation of COVID-19 pneumonia compared to other lung pathologies— including other forms of pneumonia— while experiencing increased volume of interpretive requests. Thus, computer-aided diagnosis is helpful in improving efficiency and reducing inter-observer variability.
Although typical chest X-ray images may help in early screening of suspected cases, the symptoms of COVID-19 are similar and overlap with other infectious and inflammatory lung diseases, which sometimes lead to incorrect diagnoses. It is both time-consuming and challenging for radiologists to read a high volume of chest X-ray images and to consistently detect COVID-19 and distinguish it from other non-COVID-19 causes of pneumonia [6]. To address this challenge, machine learning has attracted broad research interest, which aims to automatically analyze disease characteristics and provide radiologists with valuable tools to support more accurate or efficient detection and diagnosis of COVID-19 infected pneumonia.
Machine learning techniques have recently led to a paradigm shift in analyzing complex medical data. However, due to difficulty in identifying and segmenting subtle patterns representing pneumonia on 2D chest X-ray images, developing CAD schemes based on deep learning algorithms without segmentation of suspicious disease patterns or regions can be more efficient and probably more reliable than the use of the classical machine learning based methods. This is because deep learning structures, such as convolutional neural networks (CNN), have shown an outstanding ability to automatically process large amounts of medical images, as well as to identify complex associations in high-dimensional data that are useful for disease diagnosis without requiring such patterns to be explicitly designed beforehand [7]. Radiomics analysis, which extracts high-throughput features from medical images and uses them for multiple clinical prediction tasks, has had a high impact in medical image analysis and computer-aided diagnosis. While recent work [8–12] have shown the advantage of deep CNNs for predicting clinical outcomes, compared to traditional radiomic pipelines, the direct application of such strategy is also prone to overfitting when only few labeled examples are available, leading to poor generalization on new data and this considerably hindering clinical use. To overcome the problem of limited training data, Khalif et al. [13] preliminary used entropy-related features extracted at different layers of a CNN to train a separate classifier model for the final prediction. Their approach was based on the principle of transfer learning, where convolutional features learned for a related image analysis task can be reused to improve learning for a new task. This technique is well-suited for detecting anomalies such as lesions in medical images, since those anomalies are typically characterized by local changes in texture, and not by broad, high-level structures in the image such as entirely new objects. Therefore, low-level features learned by a deep network, which capture general characteristics of texture and other local features, can be successfully transferred across different image analysis tasks as those core patterns are shared between objects from different tasks.
Despite promising sensitivity and specificity metrics reported in other studies, many issues have still not been thoroughly investigated. First, in most investigations, results are obtained using cross-validation without utilizing an independent test set coming from a separate dataset that may have biases. As a result, deep learning models trained in this way are likely to overfit the distribution of training data when independent test sets are not used and are also prone to learn dataset-specific artifacts rather than the truly generalizable disease characteristics [14]. Second, most studies use only a small dataset with very few COVID-19 samples. This makes it difficult to generalize the results reported in these articles and it cannot be guaranteed that the reported performance will be retained when these models are to be tested on a larger dataset. Third, some researchers directly use whole images to train deep learning models. However, there is much redundant information in whole chest X-ray images, i.e., black background, presence of large, non-lung body parts etc. Learning irrelevant feature representations could adversely impact clinical decision making [15–17]. Moreover, raw chest X-ray images are inevitably contaminated by noise and suffer significantly from contrast problems, encoding irrelevant information and preventing from more accurate and stable identification of COVID-19. CNNs are adept at summarizing features from a limited number of images and, thus, the use of whole X-ray images as opposed to specific Regions of Interest (ROI) is likely to result in featurization of extraneous image data which will significantly reduce both accuracy and robustness. Finally, one of the main challenges in the effective application of any deep learning-based solution in the medical field is the black-box nature of such models, which lacks the logical relationship between the process and predicted results. Due to the end-to-end learning pattern, it becomes a major obstacle hindering further exploration of full potential of causal reasoning in medical diagnosis.
In this study, we developed an interpretable multi-task system assessed by expert radiologists on the attention maps for diagnostically relevant image regions. Firstly, a series of preprocessing techniques are sequentially applied to normalize image contrast-to-noise ratio. Further, an unsupervised machine learning technique was designed for automatic detection of the lung area. In this way, the background along with other surrounding information is eliminated and features are extracted from automatically selected ROIs, which greatly increases the overall accuracy. Moreover, we demonstrate that analyzing the distribution of these features within ROIs corresponding to distinct findings can yield a high accuracy for discriminating between COVID-19 and other types of pneumonia. Then, we focus on developing an end-to-end architecture of deep CNN by boosting the training of DTL models using the ROIs for accurate classification of COVID-19 infected pneumonia, normal and community-acquired pneumonia (CAP) cases based on chest X-ray images. Compared with many previous studies [9–11], we analyzed the key regions in the CNN decision-making process to gain trust for model application in the clinical practice. Therefore, we embed such prominent explainable AI technique as Grad-CAM in our CNN model, which is one of the transparent alternatives to the existing black-box AI framework. This can not only improve the classification accuracy and reliability of the model based on the predicted output, but also provide a rough estimate of the infected areas. Furthermore, the proposed system was trained on a large dataset of images with confirmed COVID-19 and annotated ROIs that can help learn informative features that capture local texture anomalies related to COVID-19 infection. Finally, the proposed system has been independently trained and tested for effectiveness and robustness based on both public dataset and clinical database with medical interpretations to establish the confidence and trust of the medical community in using such models. The main contributions of our work are summarized next:
1) Developing an automated computer-aided system with multiple joint tasks to detect lung region and conduct an end-to-end architecture of deep CNN by boosting the training of DTL models for accurate identification of COVID-19 infected pneumonia, normal and community-acquired pneumonia (CAP) cases based on chest X-ray images.
2) Employing unsupervised machine learning techniques for chest X-rays enhancement and lung detection which greatly increased the overall accuracy as compared to the original dataset.
3) Evaluation of multiple clinically applicable hypotheses and proposal of an incremental framework to select optimal settings for training deep learning networks for detecting COVID-19 cases against 15,884 cases of chest X-rays.
4) Visualization of the attention lung areas in the diagnosis process to provide an interpretable diagnostic basis and improve model transparency and reliability.
5) The proposed system has been independently tested for effectiveness and robustness based on 1000 cases from clinical database with medical interpretations to build the confidence and trust of the medical community in using such models.
2Methods
2.1Datasets
We used the public datasets [18–23] from COHEN, ACTMED (ActualMed COVID-19 Chest X-ray Dataset Initiative), RSNA, SIRM and a proprietary clinical dataset form the University of Texas Medical Branch at Galveston (UTMB), which are summarized in Table 1. The employed public data mainly includes COVID-19 positive, pneumonia and normal, while the UTMB clinical database includes COVID-19 positive and COVID-19 negative. As listed in Table 1, COVID-19 positive, pneumonia and normal are the experimental datasets for tri-class classification, while COVID-19 positive and COVID-19 negative from the UTMB clinical test datasets are used for binary classification, in which COVID-19 negative may include pneumonia cases and normal cases.
Table 1
Data sources for the public and proprietary UTMB of chest X-ray images
| Class | Data sources | No. of X-ray cases | ||
| Each | Total category | |||
| COVID-19 Positive | UTMB clinical dataset | 428 | 825 | |
| COVID-19 Image Data Collection [18] | 301 | |||
| Public Dataset | ActualMed COVID-19 Chest X-rays [19] | 27 | ||
| Figure 1 COVID-19 chest X-rays [20] | 36 | |||
| COVID-19 radiography database [21] | 33 | |||
| COVID-19 Negative | UTMB clinical dataset | 572 | 572 | |
| RSNA pneumonia detection dataset [22] | 4,234 | |||
| Pneumonia | NIH Chest X-ray Dataset [23] | 290 | 4,562 | |
| COVID-19 Image Data Collection [18] | 38 | |||
| Normal | RSNA normal detection dataset [22] | 10,497 | 10,497 | |
2.2Proposed system
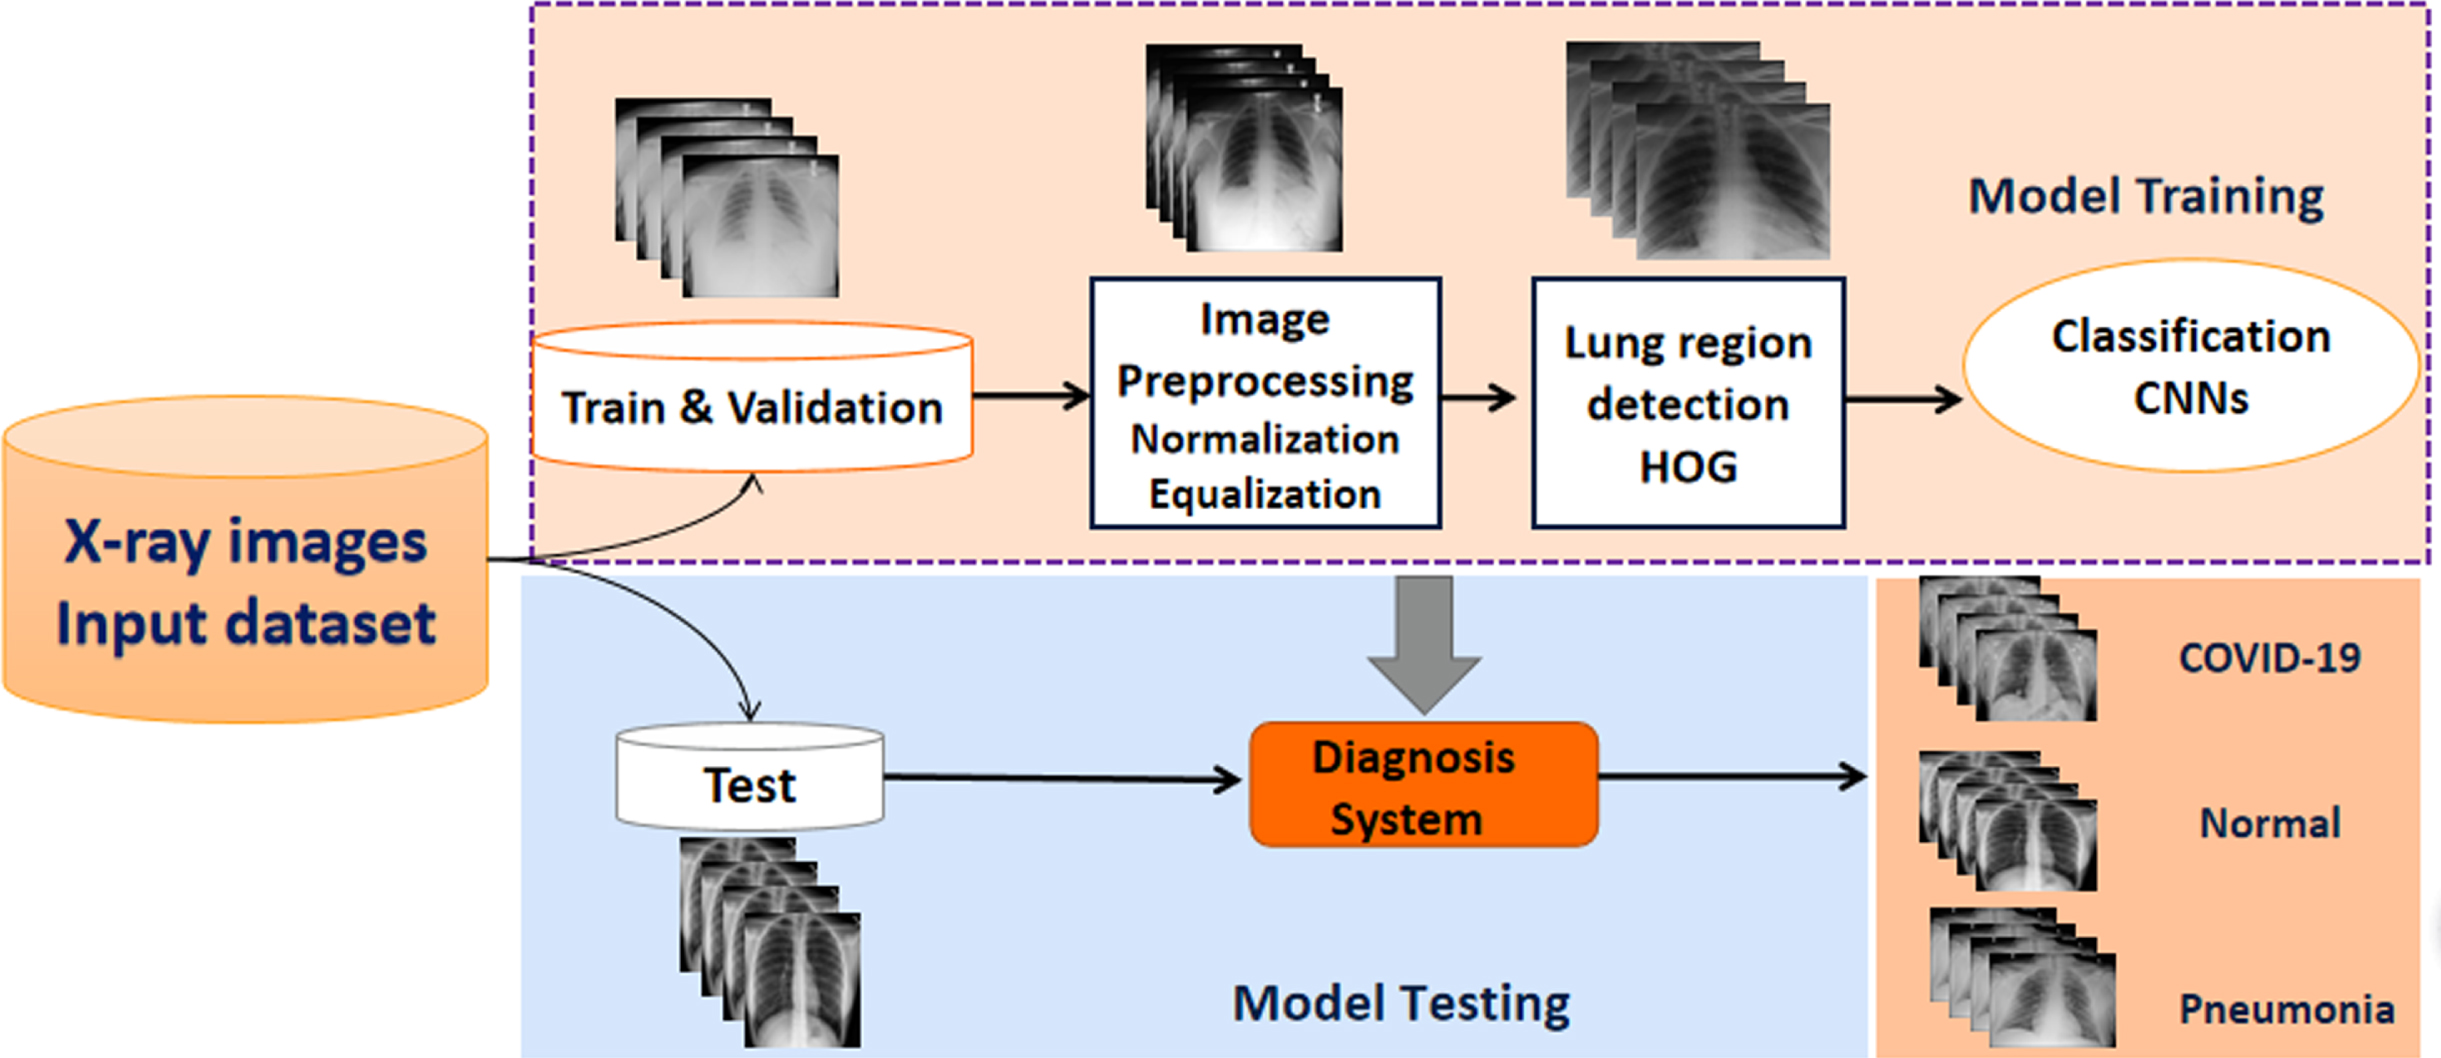
In our study, we focused on putting forth a diagnostic system by combining machine learning approaches with a CNN for accurate classification of COVID-19 infected pneumonia, community-acquired pneumonia (CAP), and normal chest films based on chest X-ray images. The public dataset and the proprietary clinical dataset are divided into training, validation and test sets. As shown in Fig. 1, the proposed procedure consists of several steps. Image pre-processing algorithms normalize image contrast-to-noise ratio, locate the lung area based on the histogram of oriented gradient features and generate three input images before subsequently linking to a deep CNN architecture with an interpretable module using the ROIs obtained for the training dataset images for predicting COVID19. Then, the unsupervised HOG operator identifies the lung region from whole chest X-ray images. Finally, the CNN learns differentiation of the input ROI and for a “hard” classification of the lung into three categories (COVID-19, normal, and pneumonia).
Fig. 1
Schematic illustration of our methodology framework.
2.2.1Image preprocessing
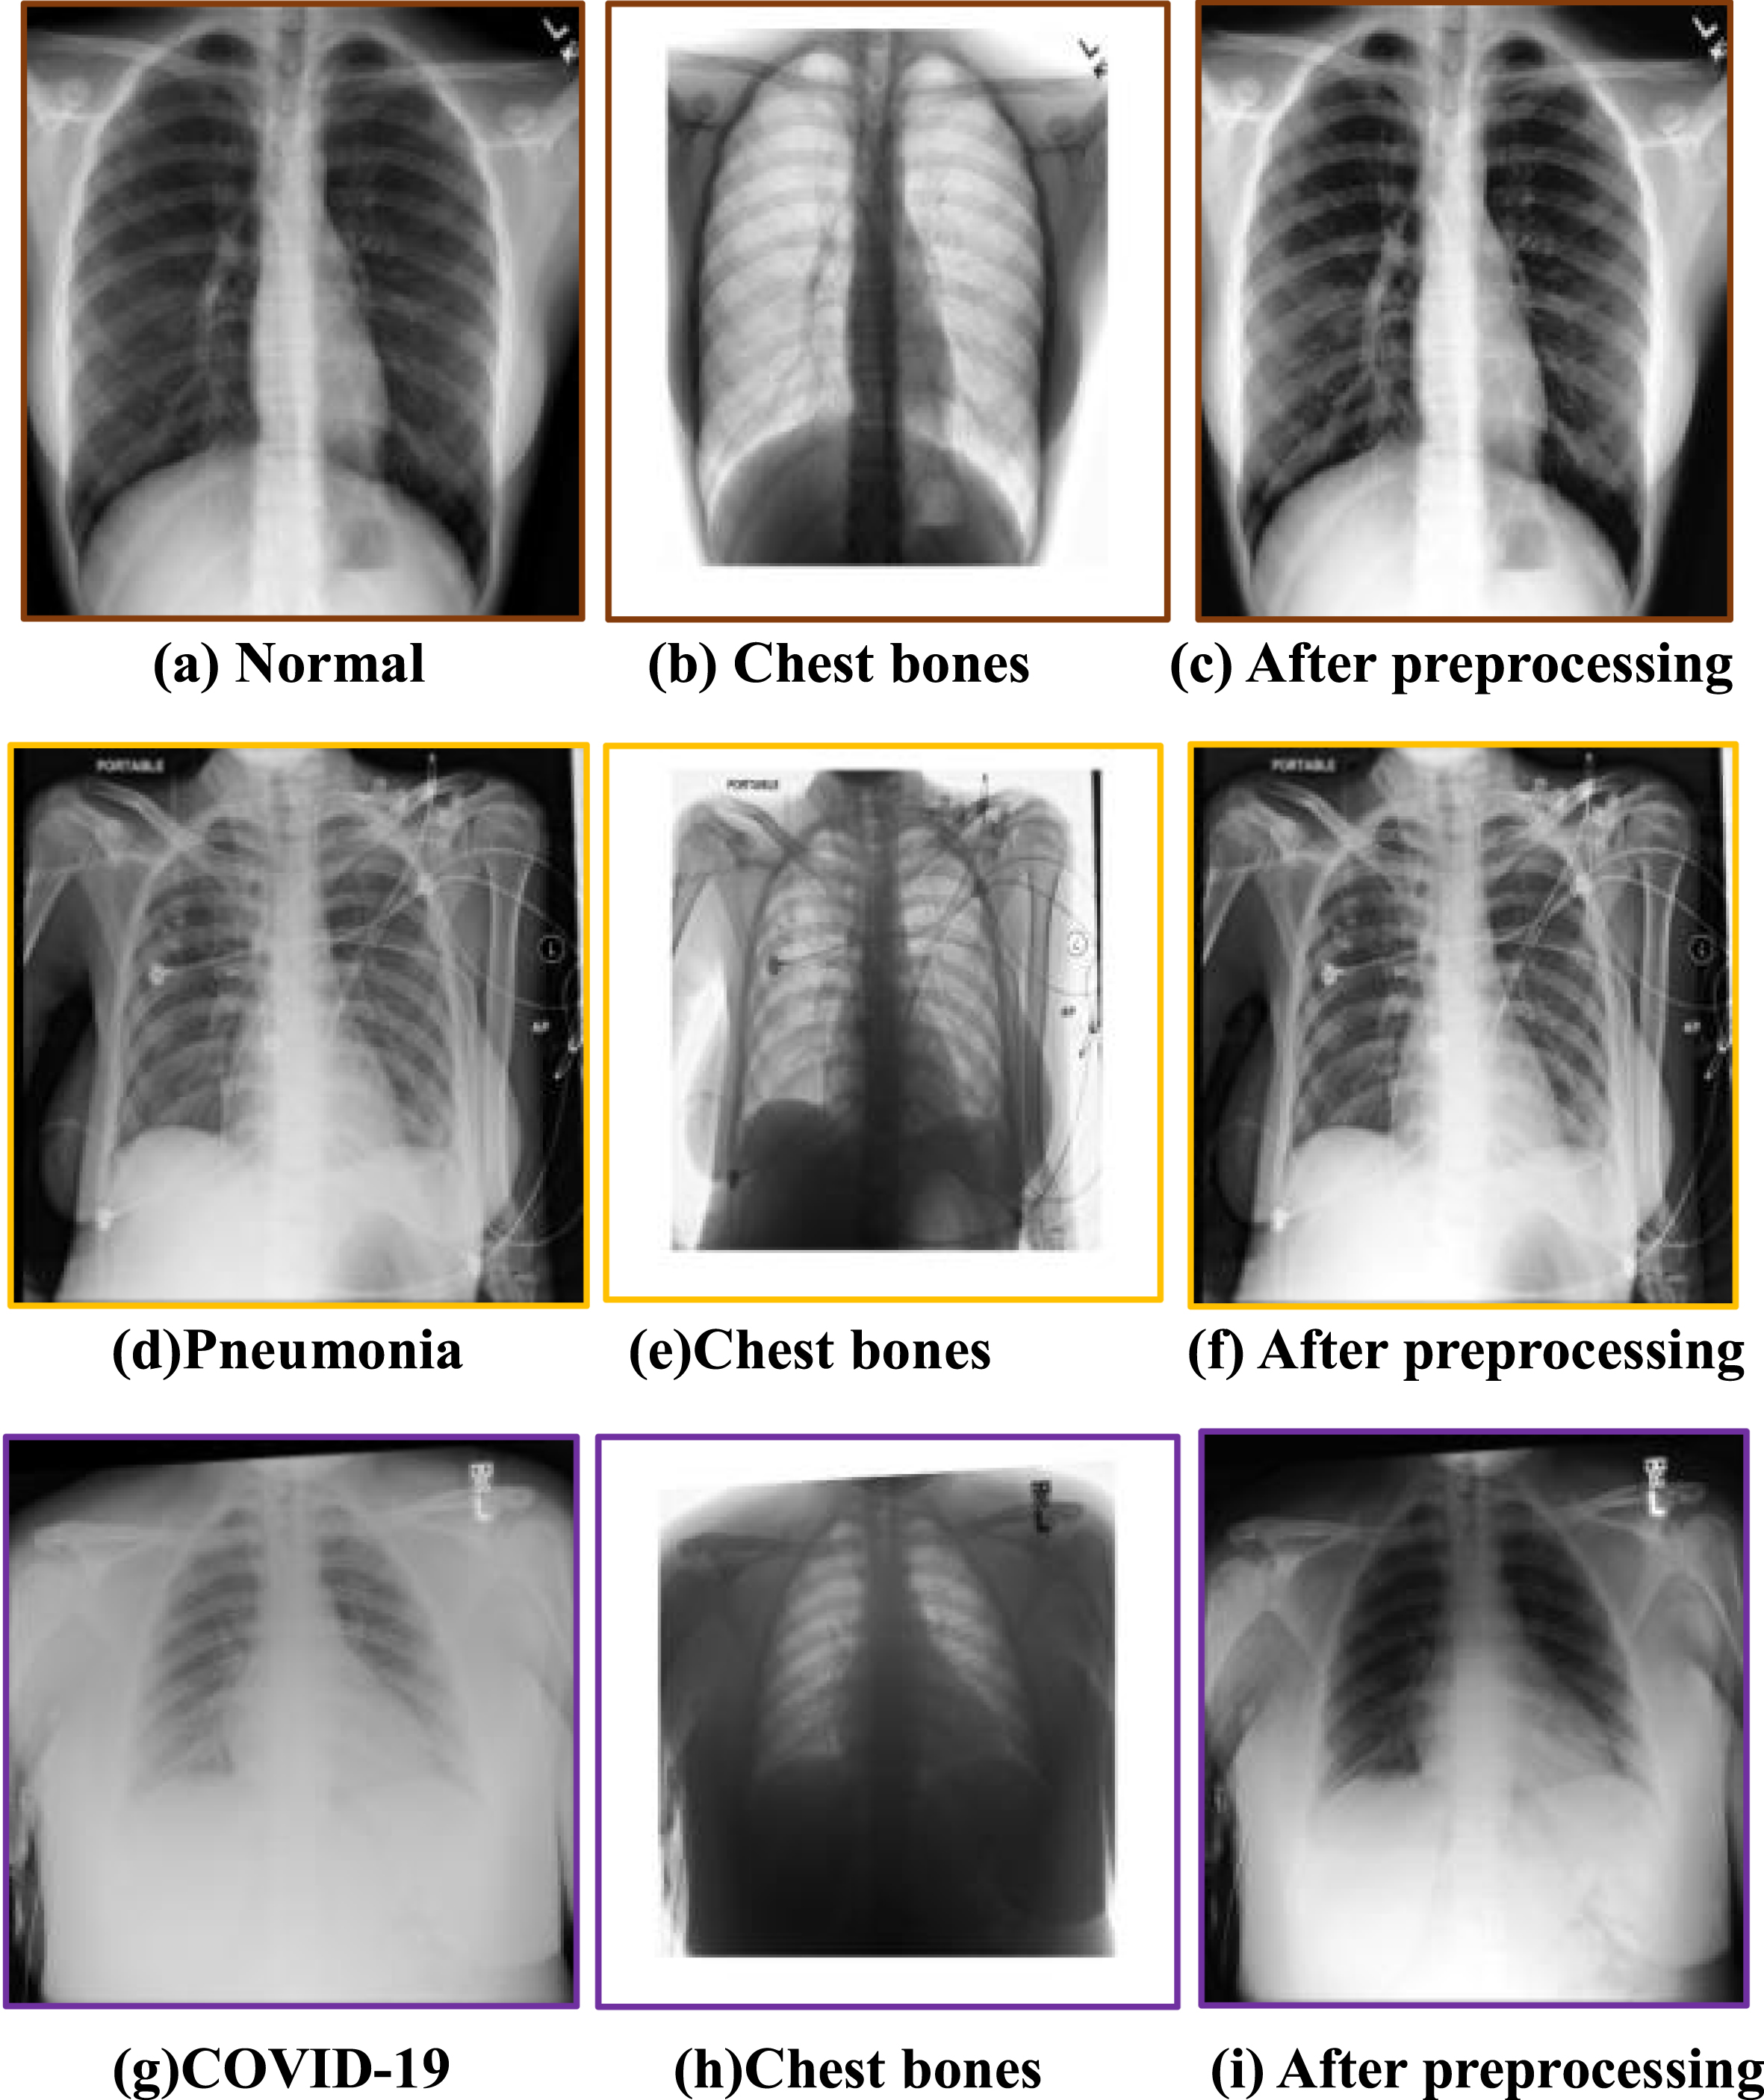
Raw chest X-ray images are inevitably contaminated by noise, lower resolution and suffer significantly from contrast problems, so we used the image processing to improve the overall quality of the CXR dataset, especially for the images with particularly low contrast and resolution, as shown in Fig. 2. The first column shows the original X-ray images of different types, and the second column presents the effect of image preprocessing, and the gray value of each pixel in the chest bone image was calculated from the absolute value of the pixel discrepancy between the original CXR and preprocessed CXR at the corresponding position, while the third column shows the result after preprocessing). Max-min normalization is applied to improve the signal-to-noise ratio and to reduce the noise resulting from differences in radiography equipment, protocol, and institution. Subsequently, to improve the contrast and the overall intensity distribution, the intensity of each pixel is recomputed using the intensity of pixels in the adjacency of the respective pixel (3×3 square window). Additionally, the gray level of all pixels of the image is reconfigured so that they take the values between 0 and 255. Later on, by employing tools such as adaptive histogram equalization, local contrast enhancement is exercised. The procedure starts with determining a window with certain dimensions and sliding it over the image. The histograms of pixels inside the window are equalized and the values of the pixels are recomputed. Equalization of the histogram can be done using the exponential distribution. Therefore, it can be confirmed from the chest bone images that the preprocessing step reduces the interference of regions other than the lungs in the original images, especially the artifacts of the chest bone overlapping the lung region, which helps improve the accuracy of subsequent ROI localization and lung disease classification.
Fig. 2
CXR image preprocessing.
2.2.2Unsupervised lung detection
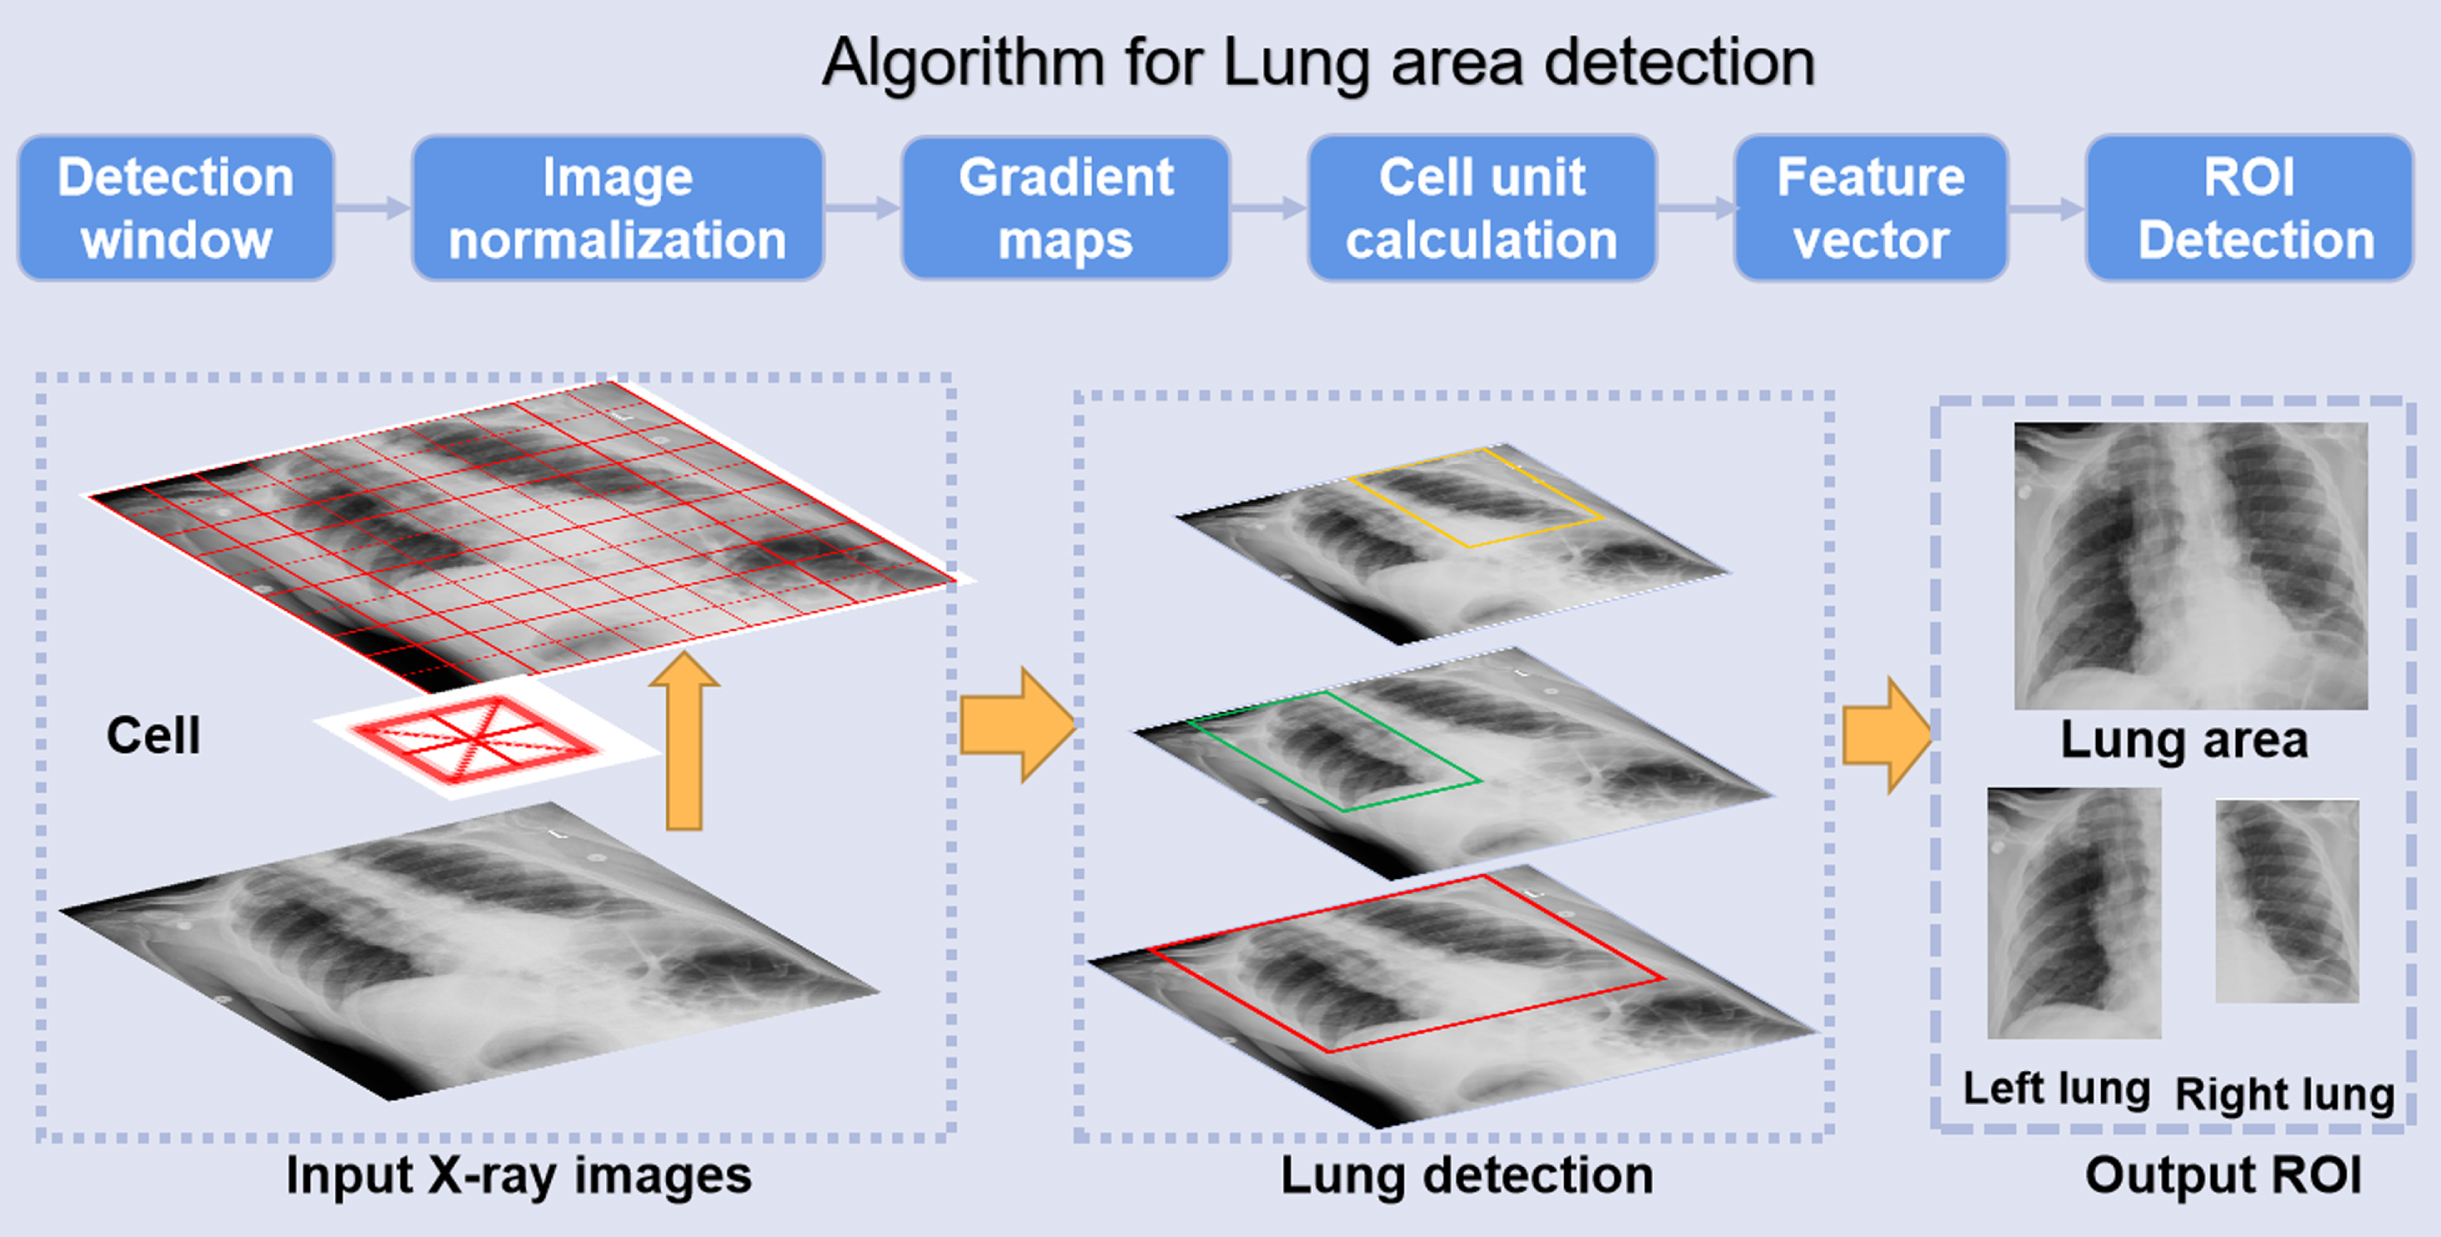
CNN models are affected by imaging artifacts and the presence of other, non-lung tissues in chest X-ray images, and so they may learn to rely on non-lung features in making a diagnostic prediction regarding the lung such as the presence of pneumonia. To ensure that only lung areas are exported to the downstream classification system, we concentrate on the most successful and popular vector-form feature: histograms of oriented gradients (HOG) to locate the lung area and remove artifacts, as shown in Fig. 3.
The HOG features concentrate on the contrast of silhouette contours against the background through unsupervised machine learning (UML) approaches to enhance detection performance [24]. The gradient of the image’s abscissa and ordinate directions are calculated at each pixel position after image normalization, mainly to capture contour information and further to weak the interference of noise. Analyzing the numerical derivatives can not only capture contours, shadows and some texture information, but also further reduce lighting influence.
Fig.3
Automatic detection process of lung area.
The (numerical) gradient of the pixel (x, y) in the image is shown in Equations (1) and (2):
(1)
(2)
where, Gx(x,y), Gy(x,y) and H(x,y) represent the horizontal gradient component, the vertical gradient component and the color value at pixel (x,y) in the input image, respectively. The gradient norm G (x, y) and slope α (x, y)at pixel (x,y) are:
(3)
(4)
Then the image was divided into several cells (6×6 pixels) to code for the partial image area while maintaining weak sensitivity to the posture and appearance of the whole lung in the chest X-rays. We constructed a block by combining every few cells (3×3 cells/block) and concatenated the feature descriptors of all cells in a block to obtain the HOG feature descriptor of the block. Finally, the feature descriptors of all blocks in the image were connected to get the feature descriptor of the lung area, which was the detected ROI for classification.
2.2.3Interpretable classification scheme
After image preprocessing and ROI detection, the CXR dataset was randomly divided into training set, validation set and independent test set, as shown in Table 2.
Table 2
The dataset for 3-class classification based on the X-ray images
| COVID-19 | Pneumonia | Normal | Total | |
| Train set | 508 | 2,783 | 6,642 | 9,933 |
| Validation set | 172 | 992 | 2,107 | 3,271 |
| Test set | 145 | 787 | 1,748 | 2,680 |
| Total | 825 | 4,562 | 10,497 | 15,884 |
Based on the CNN architecture, a schematic illustration of our X-ray image categorization system is displayed in Fig. 4. First, all input images are rescaled to a uniform size of 224×224 pixels based on the automatically identified ROI images. Then, the uniformed-size images undergo preprocessing and augmentation steps. To prevent overfitting [25], we augment the training dataset using the following image transformations: random flipping, rotation, translation and scaling. The green rectangle corresponds to the CNN architecture for the ROI classification. Finally, the ROIs are used as input for a CNN classification model.
Fig. 4
Illustration of interpretable CNN for CXR diagnosis.
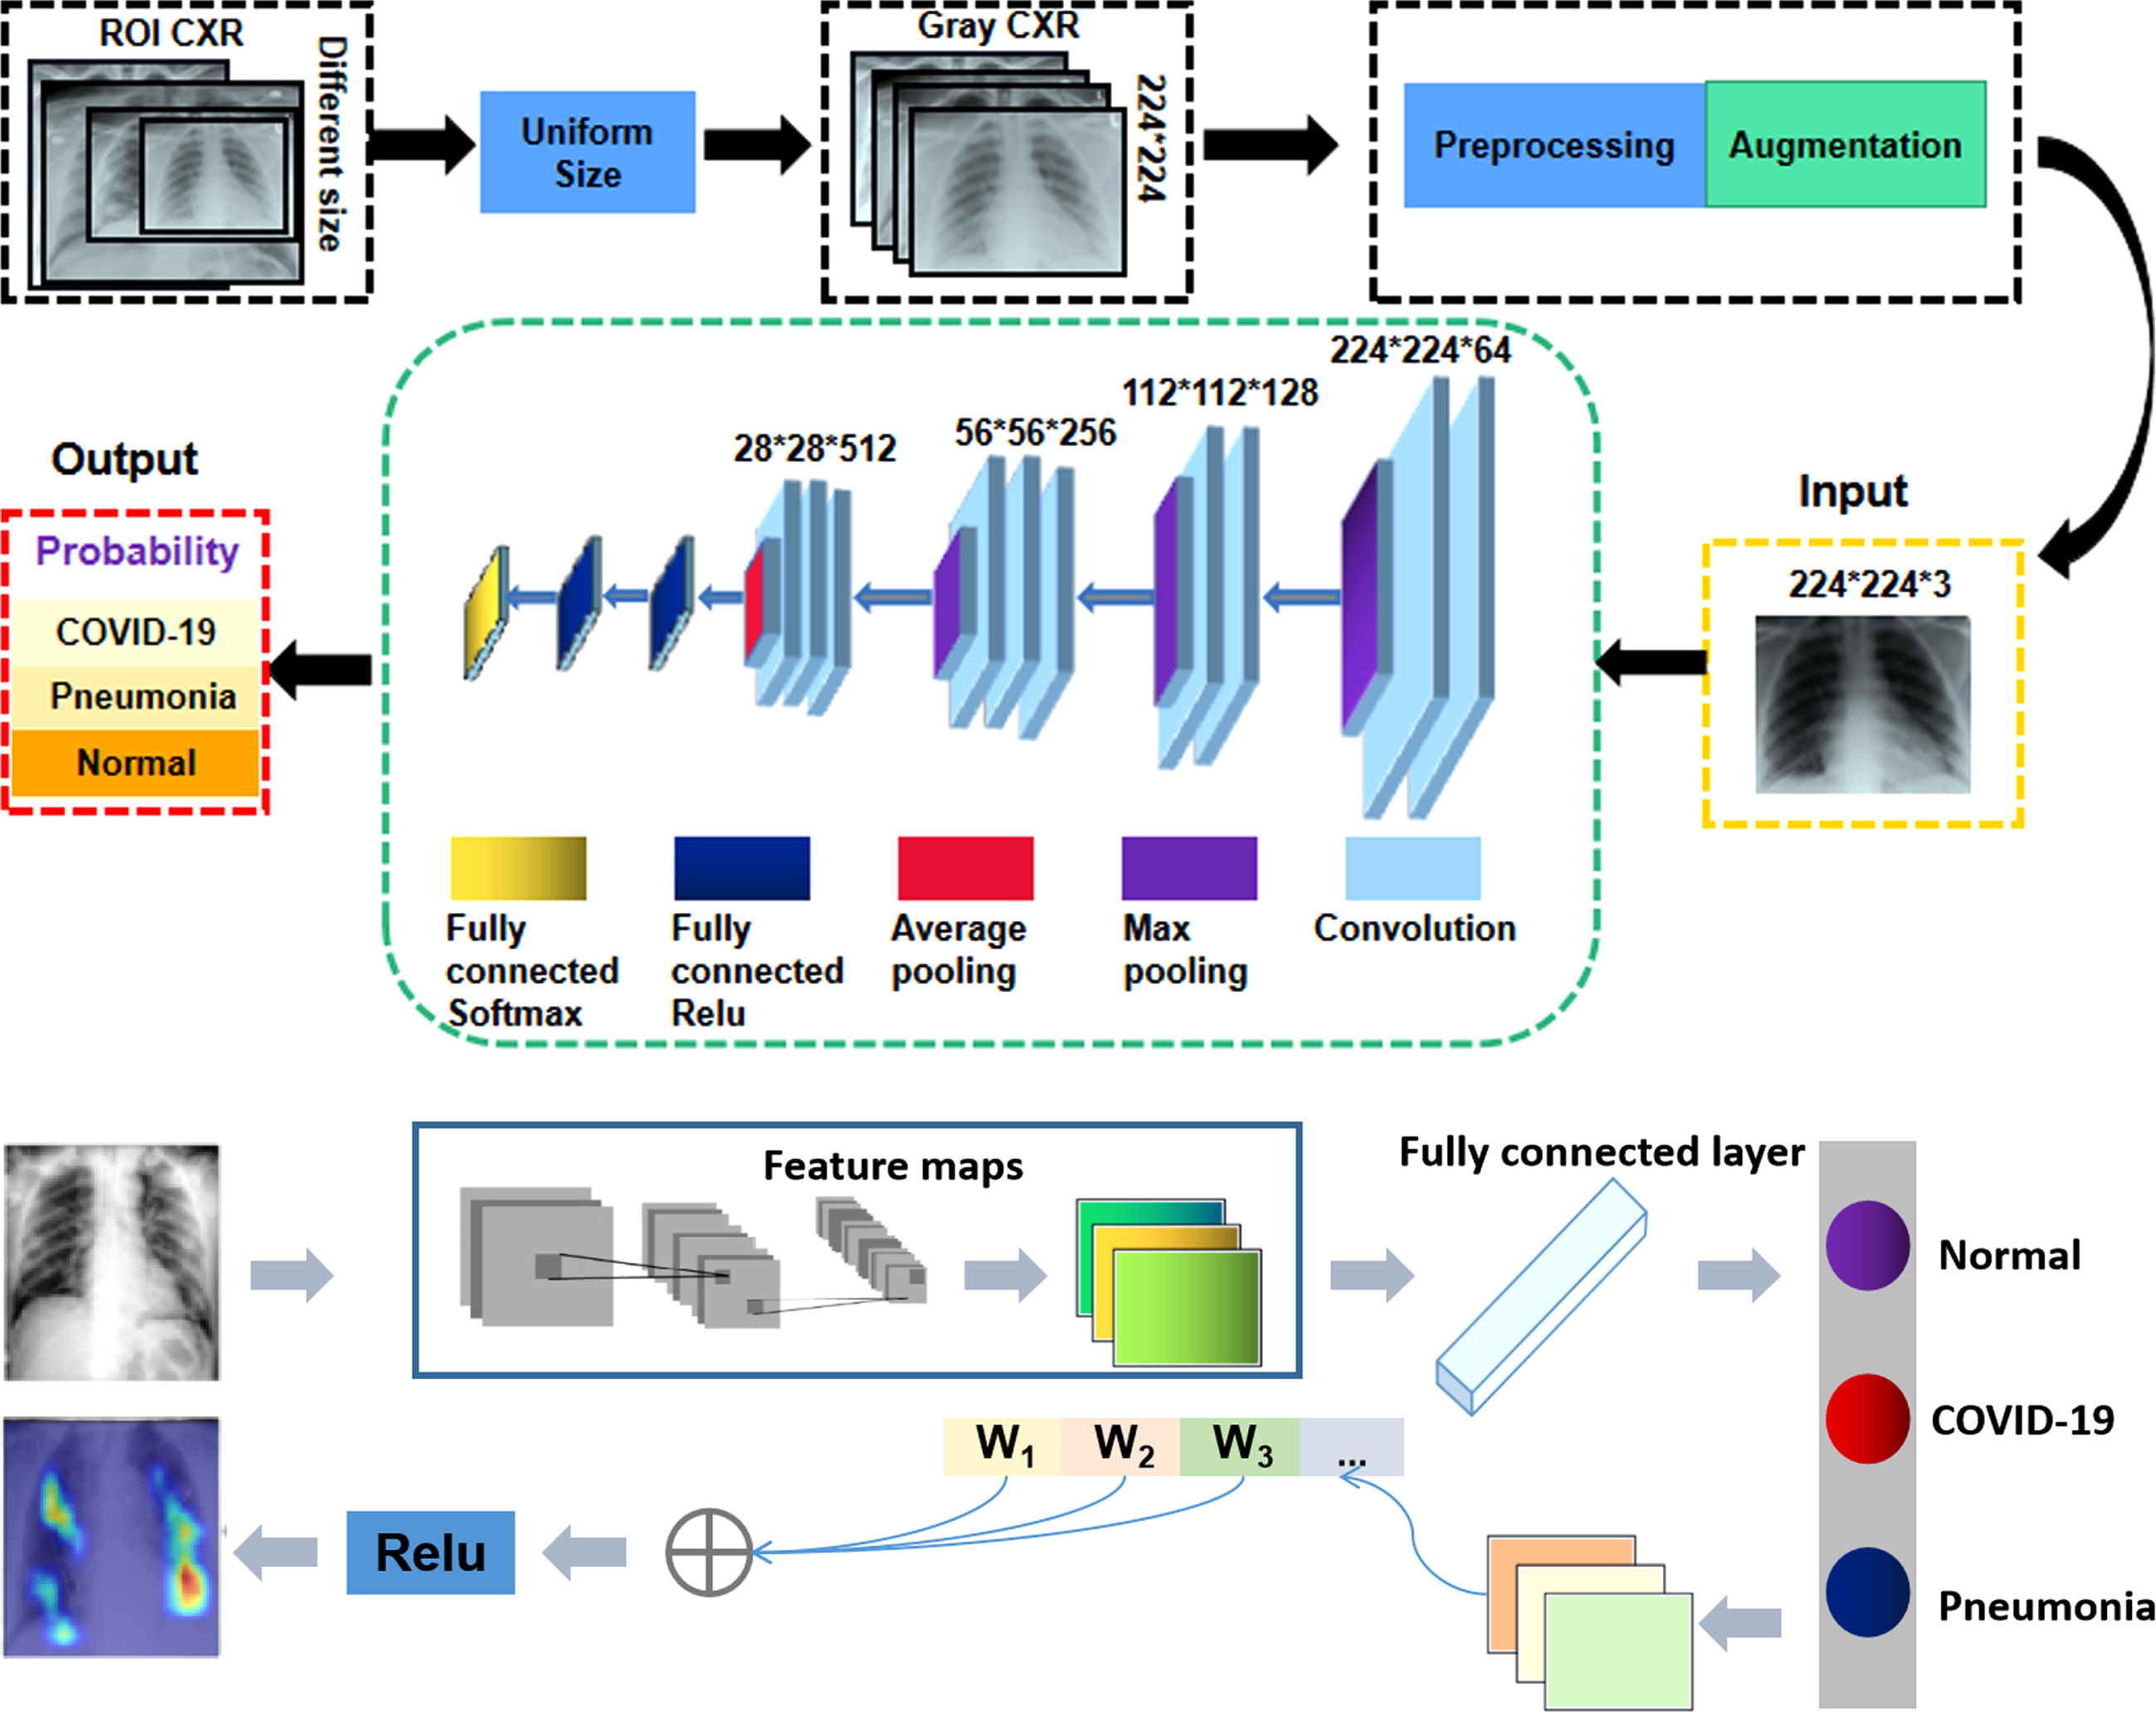
An effective classifier can enhance the discriminating ability of lung features from different categories, thus promoting accurate classification. Clinically, the local texture of lung infections is well represented in low-level convolution layers, and essential features can be extracted with additional convolution layers. Compared to many other deep learning models, we found that VGG16 has the following advantages for this application. First, in the previous studies, VGG Net has demonstrated superior performance in many engineering applications using diverse datasets [26]. Second, in a competition based on the ImageNet dataset involving 14 million images, it achieved first place in image localization and second place in image classification when benchmarked in 2014. This suggests that the parameters of this CNN model are quite well trained on ImageNet, which makes it suitable for transfer learning (TL). Transfer learning is a powerful strategy that enables to quick and effective training of deep neural networks with a limited amount of labeled data. The basic idea of this strategy is to use a pre-trained network on a related task for which a lot of data is available, and then use the features of this network as representation for learning a new task without completely re-training the network. Transferred features can be used directly as input to the new model or adapted to a new task via fine-tuning.
Theoretically, it needs massive training data for support in the process of using deep learning framework due to the fact the model has a large number of parameters to be trained. Following transfer learning strategy (TLS), the proposed CNN architecture was pre-trained to develop our model based on the VGG backbone net for the target task, which can achieve the superior performance on our limited datasets. Besides, we can fine-tune all layers, including the convolutional layers. It means all weights inherited from the trained deep learning model are fine-tuned by the new task datasets and all layers participate in backward computation. In particular, the ImageNet was used as initial weights in our network, which improves classification efficiency and accuracy compared with using random weight. Referring to Fig. 4, the first four blocks (from Block 1 to Block 4) formed the encoding path. Each block in the encoding path shared the same structure, which contained two or three convolution layers and one pooling layer. In the encoding path, the number of feature channels of a convolution layer was doubled when followed by the max pooling or average layer. We argue that relevant information for detecting COVID-19 lies in local changes in texture, and that this information can be captured effectively with a general set of low-level features. For adapting these pre-trained networks to the task of differentiating between COVID-19 and other forms of pneumonia or normal lung images, we replaced the layers following the last convolution block (i.e., fully-connected ReLU and softmax activation) by new layers of appropriate size, and fine-tuned the modified networks using training examples representing the new task. In the training process, we initialized the weights based on ImageNet and employed stochastic gradient descent with momentum (SGDM) to update all network parameters. We set batch size to 10, the learning rate to 1×10⁻⁴ and the number of epochs to 50. The dataset was split into three independent subsets containing different subjects, with 60%, 20% and 20% of examples for training, validation and testing, respectively. As stated previously, to prevent overfitting [27], we augmented the training dataset using the following image transformations: random flipping, rotation, translation and scaling. In addition, data imbalance is a key challenge in machine learning, which can affect the accuracy of classifiers, so the loss function was improved as focal-loss [28] to solve the imbalance of each chest X-ray dataset. The classification error Lcls is defined as follows:
(5)
In order to enhance the model’s interpretability, we applied the GradCAM [30] algorithm to visualize the importance of each pixel on the final decision, as shown in the Fig. 4. GradCAM examines the gradient information flowing from the input layer up to the last convolutional layer, for a given class label, providing a qualitative attention map for assessing the performance of the network. To obtain the weights of the neurons importance, the new gradients are computed by the global average pooling layer over the dimensions of the image. Finally, a linear combination of the weights and the feature maps is applied, followed by a ReLU function, to produce the heatmap. The heatmap was subsequently resized to the initial dimension of the image and overlaid on it. Thus, the fully connected layers of the classification network may further process these features, effectively applying a selection strategy on them, in order to predict the final outcome. By extending the idea of Grad-CAM, we present an interpretable classification framework to clearly show the results that are well correlated with radiological findings.
3Results
Further, to study the effectiveness of the proposed scheme for detecting lung infection from chest X-ray images, as well as for localizing and grading results were evaluated by comparing corresponding labels from the PCR testing which is a molecular test for the presence of COVID-19 infection that operates by directly detecting viral RNA. These experiments consisted of two main components. One was evaluating the effect of ROI identification on final classification results, and the other was the discriminative capability of lung infection categories based on different test datasets, which included both the public datasets and the UTMB clinical dataset.
3.1Evaluation metrics
We deployed the clinical metrics, viz., precision, sensitivity, specificity, F1-score, and overall accuracy to evaluate the performance of the proposed multi-class classification task. Fp and Fn represent the false positive and false negative, respectively. Tp is the number of cases correctly predicted as belonging to a given class, while Tn represents the number of samples correctly identified as not belonging to a given class. Overall accuracy (ACC) is defined as:
(6)
Precision refers to the proportion of correctly predicted positive cases to all positive cases. Low precision with high false positives would result in an increasing burden on the health care systems, which is defined as:
(7)
Sensitivity (recall) is used to evaluate the false negative rate that is of utmost significance in initial screening in the clinical practice, and is defined as:
(8)
Specificity represents the true negative rate which directly affects the diagnosis of the disease, and is defined as:
(9)
The F1-score is defined as the harmonic mean of precision and recall, which evaluate significant metrics of precision and recall.
(10)
3.2Results analysis
The issue of multi-class classification poses a greater challenge as compared to a binary classification task due to the increased complexity of models. Thus, we tested the data set of 2680 cases based on proposed method and obtained the confusion matrix of the classification results. Furthermore, this study tests the classification model’s ability based on real time clinical database to distinguish between COVID-19 and non-COVID-19 which have similar imaging modalities. Furthermore, Fig. 5 shows performance metrics calculated from the confusion matrix to evaluate the performance of the proposed method. As can be seen from the evaluation metrics derived from the confusion matrix in Fig. 5, the proposed model shows superior classification performance for COVID-19, pneumonia, and normal cases under the different metrics (Fig. 5 evaluation curves). The specificity for COVID-19 cases can achieve as high as 99.15%, and the accuracy for normal cases is 94.05%, and the sensitivity for both COVID-19 and normal cases is more than 94%. The proposed method demonstrated higher F1-score in all three categories, indicating superior performance in model stability and reliability.
Fig. 5
The confusion matrix and evaluation metrics for the proposed method.
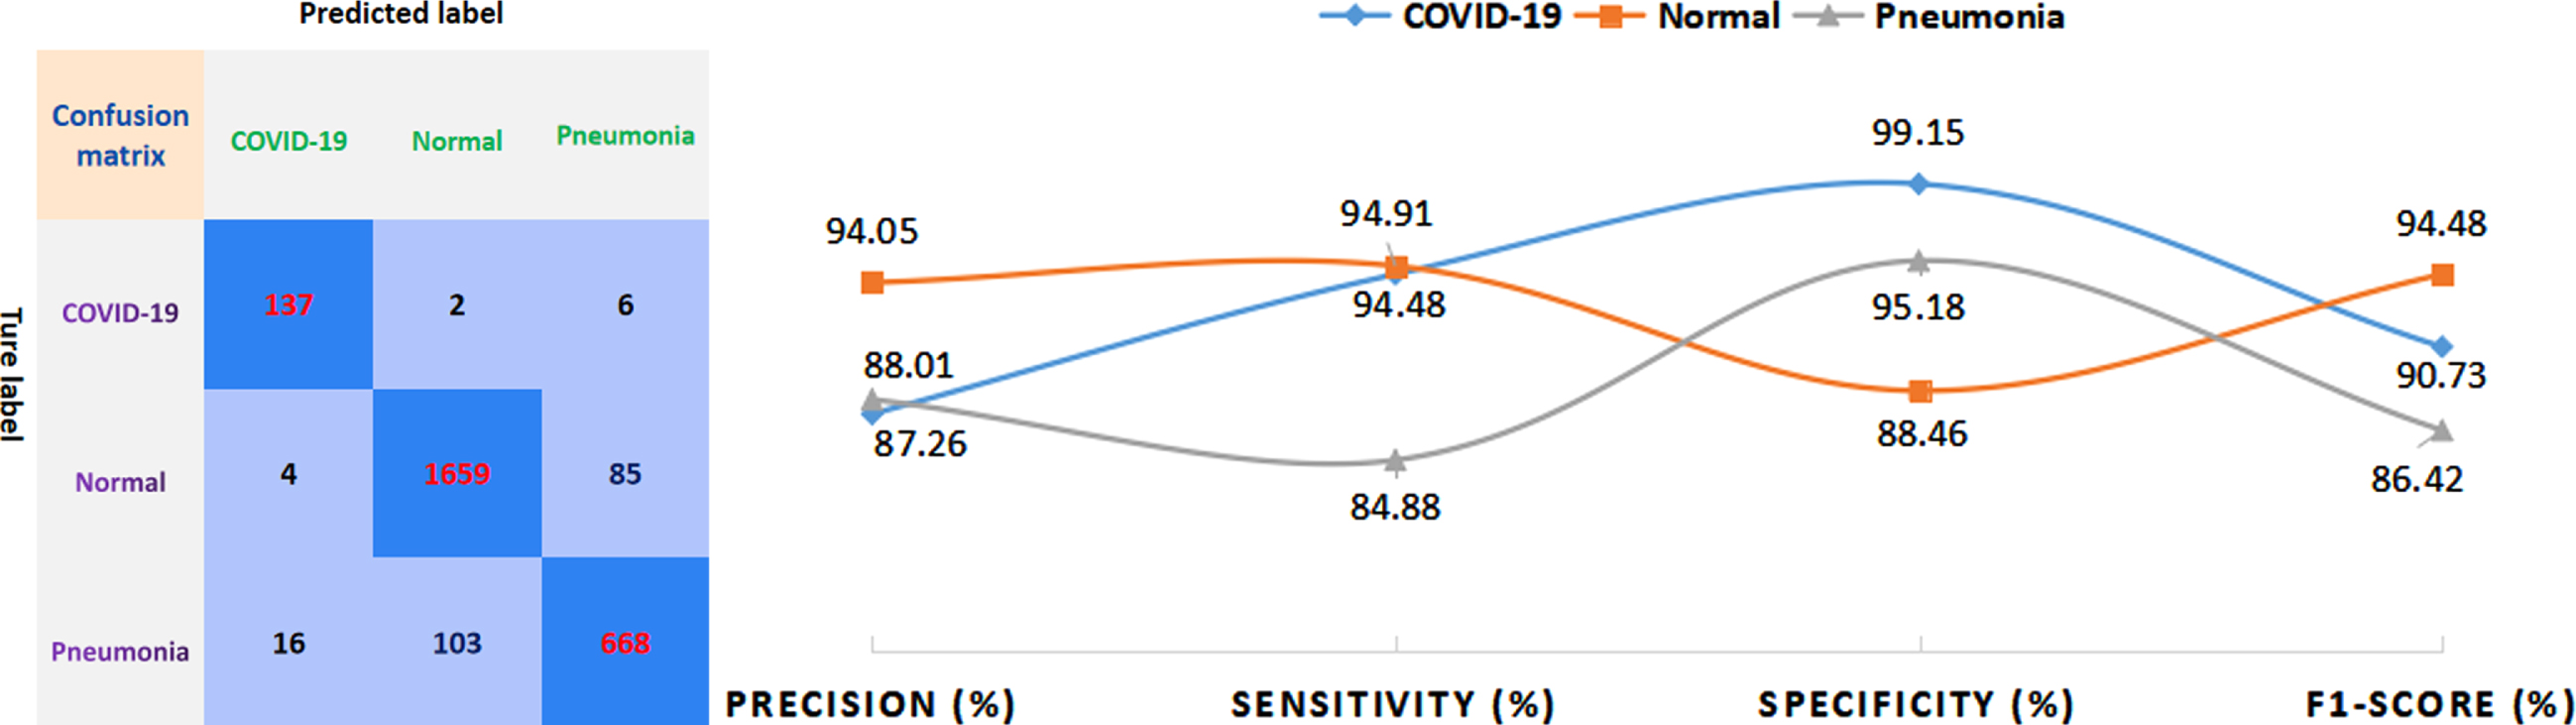
Table 3 mainly presents the sensitivity of each class and the overall accuracy of the model as the evaluation indicators for the tri-class classification of test cases of COVID-19, pneumonia, and normal cases, respectively. Macro-F1 indices (average of the F1-score for the three categories) help evaluate the reliability and stability of the model, From Table 3, we can observe that our proposed method yields the highest overall accuracy (91.94%) and Macro-F1 (90.54%), which is increased by 4.95% and 6.37% compared to other methods with better results, respectively. Besides, the proposed method achieves a superior performance of sensitivity for COVID-19 (94.48%) and normal (94.91%) classification, while the sensitivity (84.88%) is slightly lower than the highest specificity of Dense Net (86.02%).
Table 3
Comparison of different methods based on CXR images
| Sensitivity | Accuracy | Macro-F1 | |||
| COVID-19 | Normal | Pneumonia | |||
| VGG16 | 58.54% | 90.68% | 82.21% | 86.25% | 79.95% |
| InceptionV3 | 89.63% | 78.76% | 68.36% | 76.40% | 67.06% |
| Resnet50 | 87.80% | 92.39% | 67.73% | 84.92% | 79.73% |
| Inception ResnetV2 | 93.29% | 84.95% | 74.97% | 82.55% | 74.17% |
| Dense Net | 82.32% | 87.87% | 86.02% | 86.99% | 84.17% |
| Preprocessing +CNN [6] | 56.69% | 90.35% | 83.32% | 85.69% | 79.39% |
| Truncated net [29] | 66.90% | 81.81% | 64.42% | 75.90% | 64.73% |
| Proposed method | 94.48% | 94.91% | 84.88% | 91.94% | 90.54% |
In order to further substantiate clinical applicability of the proposed system, we used a very recent clinical data set provided by UTMB, which is divided into COVID-19 positive and COVID-19 negative cases as determined by COVID-19 PCR testing. Based on the clinical dataset, the sensitivity of 88.23% was obtained, thereby providing a rapid screening tool that can be used during the pandemic.
4Discussion
We proposed an adaptive ROI-based DNN system that can be stably trained for effective diagnosis from chest X-ray, which can assist physicians with the tedious and time-consuming task of assigning diagnostic labels. additionally, this automated computer-aided system can help radiologists improve the sensitivity of COVID-19 screening, especially amidst an anticipated rise in imaging volume that would otherwise result in fatigue and deteriorated diagnostic accuracy. With ROI detection algorithm that can accurately identify lung region, goal-oriented features can be automatically learned extracted by our improved architecture to discriminate the category of lung infection in CXR images. Thus, our diagnosis system can potentially relieve the burden for radiologists from the time-consuming image reading process and alleviate the impact imaging workload on clinical practice to preserve limited medical resources and prevent further spreading of the virus. Our system has an attractive performance on normal cases with the precision in excess of 90%. As for normal cases, the accuracy is higher than that of the other two categories (COVID-19 and pneumonia). this may be caused by the fact that the number of the COVID-19 and the pneumonia cases is less than that of the normal cases. Although prediction of COVID-19 on the clinical UTMB database is not as high as the public dataset, it may significantly outperform manual diagnosis.
4.1Effect of ROI detection on final identification
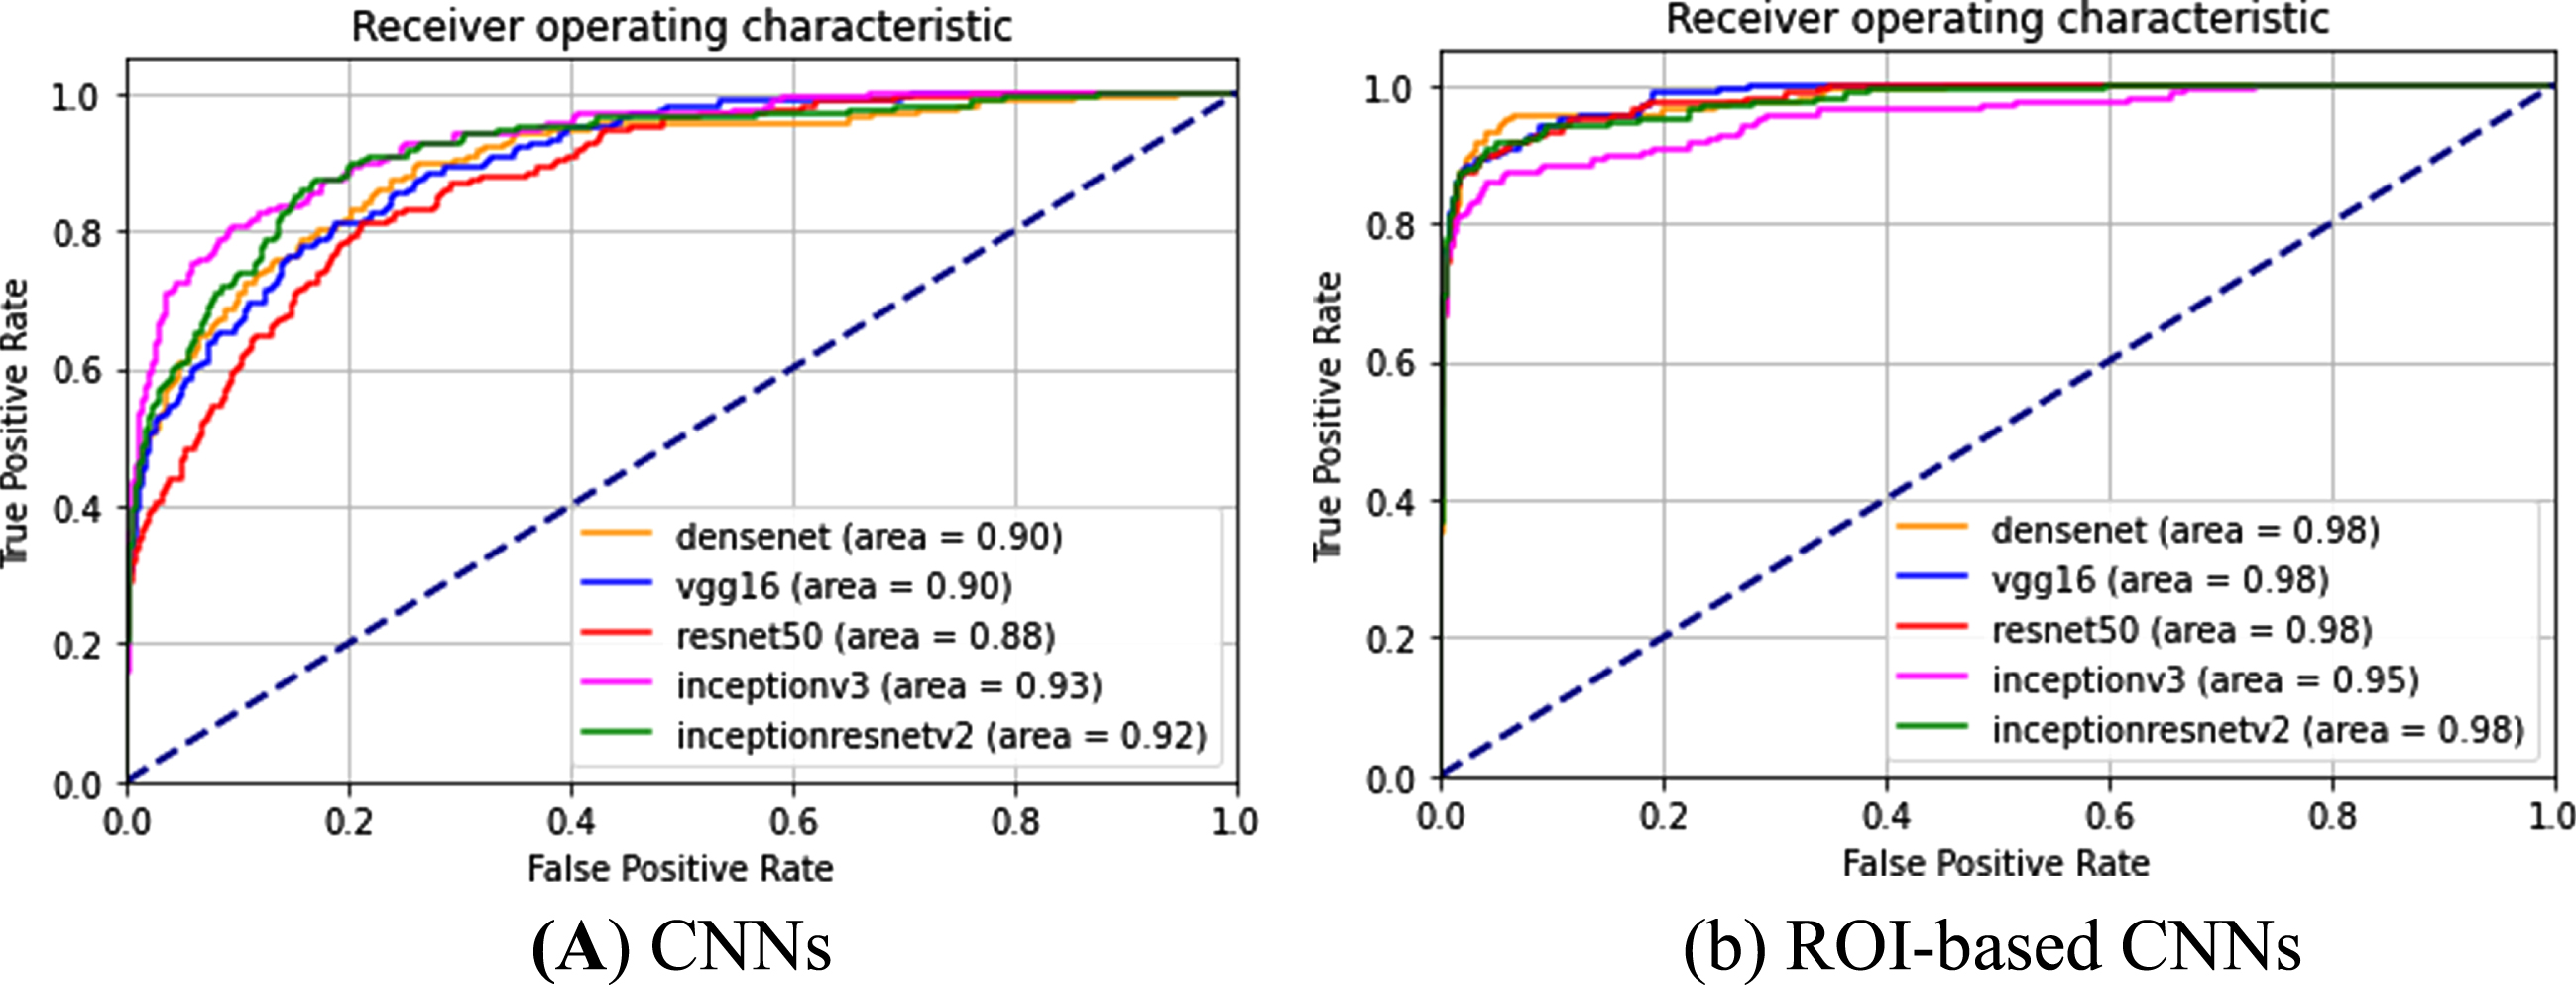
Lung localization, which denotes the area of the ROI, theoretically affects the feature mapping and may influence final grading. To investigate the effects of the accuracy of the identified lung region on the final categorization from the chest X-ray images, the ROC curves of different deep learning-based models were calculated to show the effect of the proposed lung region detection on the final classification accuracy. The correctly classified and misclassified test samples of COVID-19 are recorded as TP and FN, respectively, and the true positive rate (TPR = TP/(TP+FN)) and false positive rate (FPR = FP/(FP+TN)) under each threshold can be computed to obtain a ROC curve. Two types of images were fed into different state-of-the art CNNs (VGG16, Densenet, Resnet50, InceptionV3, InceptionResnetV2) as part of the following two experiments. CNN corresponds to an experiment in which the input is simply the original X-ray images without predictive localization of the lung region, as shown in Fig. 6(a). In the “ROI-based CNN” experiment, the original chest X-ray images underwent complete processing procedures in our lung detection scheme before being fed into the CNNs, as shown in Fig. 6(b). Referring to the ROC curves for COVID-19 classification (Fig. 6), all grading results can be improved using the experiment ROI CNN with the highest AUC value. In contrast, experiments with CNN refers to CNN without ROIs, thus the AUCs are lower. Particularly, the lower AUC value is illustrated in Fig. 6, where CNN performs the worst with an AUC of 88% based on resnet50 in all experiments based on whole CXRs. While the AUC increased to 98% using the same CNN by performing the ROI detection of lung region in chest X-ray images. This is due to the presence of image contrast, noise and artifacts in CXR images. Therefore, it can be concluded based on comparisons of ROC curves with different CNNs that the best performance for classification results can be achieved with localization of ROIs.
Fig. 6
ROC curves and AUC values for different implementations in classifying COVID-19 CXR images based on different CNNs.
4.2Performance evaluation of the diagnosis system
Referring to Table 3, the accuracy of the final diagnosis strongly suggests that our method demonstrates better diagnosis performance and robustness than the state-of-the-art CNN architectures when utilizing chest X-ray images from both the UTMB clinical database and public databases. The sensitivity with 94.48% of our method for COVID-19 positive is much higher than 56.69% in reference [6], which indicates the detection algorithm can adaptively extract ROI features to reduce additional irrelevant information imported into the CNN models more accurately. Therefore, the proposed diagnosis system yields higher accuracy by decoupling the identification features for distinguishing lung regions from the background based on the full images and concentrating on classifying lung infections into different types were extracted from ROI.
4.3Clinical applicability validation
Testing our system based on the clinical UTMB database, severity levels of both COVID-19 infected pneumonia and other community-acquired pneumonias vary in different cases in the database. Some COVID-19 positive cases were classified as normal cases by our system as false negative, were these patients in an early stage, mild or asymptomatic, although PCR test was positive. Therefore, there were no COVID-19 infection features on chest X-ray images, such as ground glass opacity (GGO) or consolidation. Although some are non-COVID-19 pneumonia cases (may be in more severe disease stage), they are mis-classified as COVID-19 cases. Even experienced physicians may have biases in determining the category solely based on only one type of source associated with chest X-ray images. Clinically, further diagnostic tests, such as PCR testing is needed to achieve the more accurate results.
4.4Interpretability using saliency map
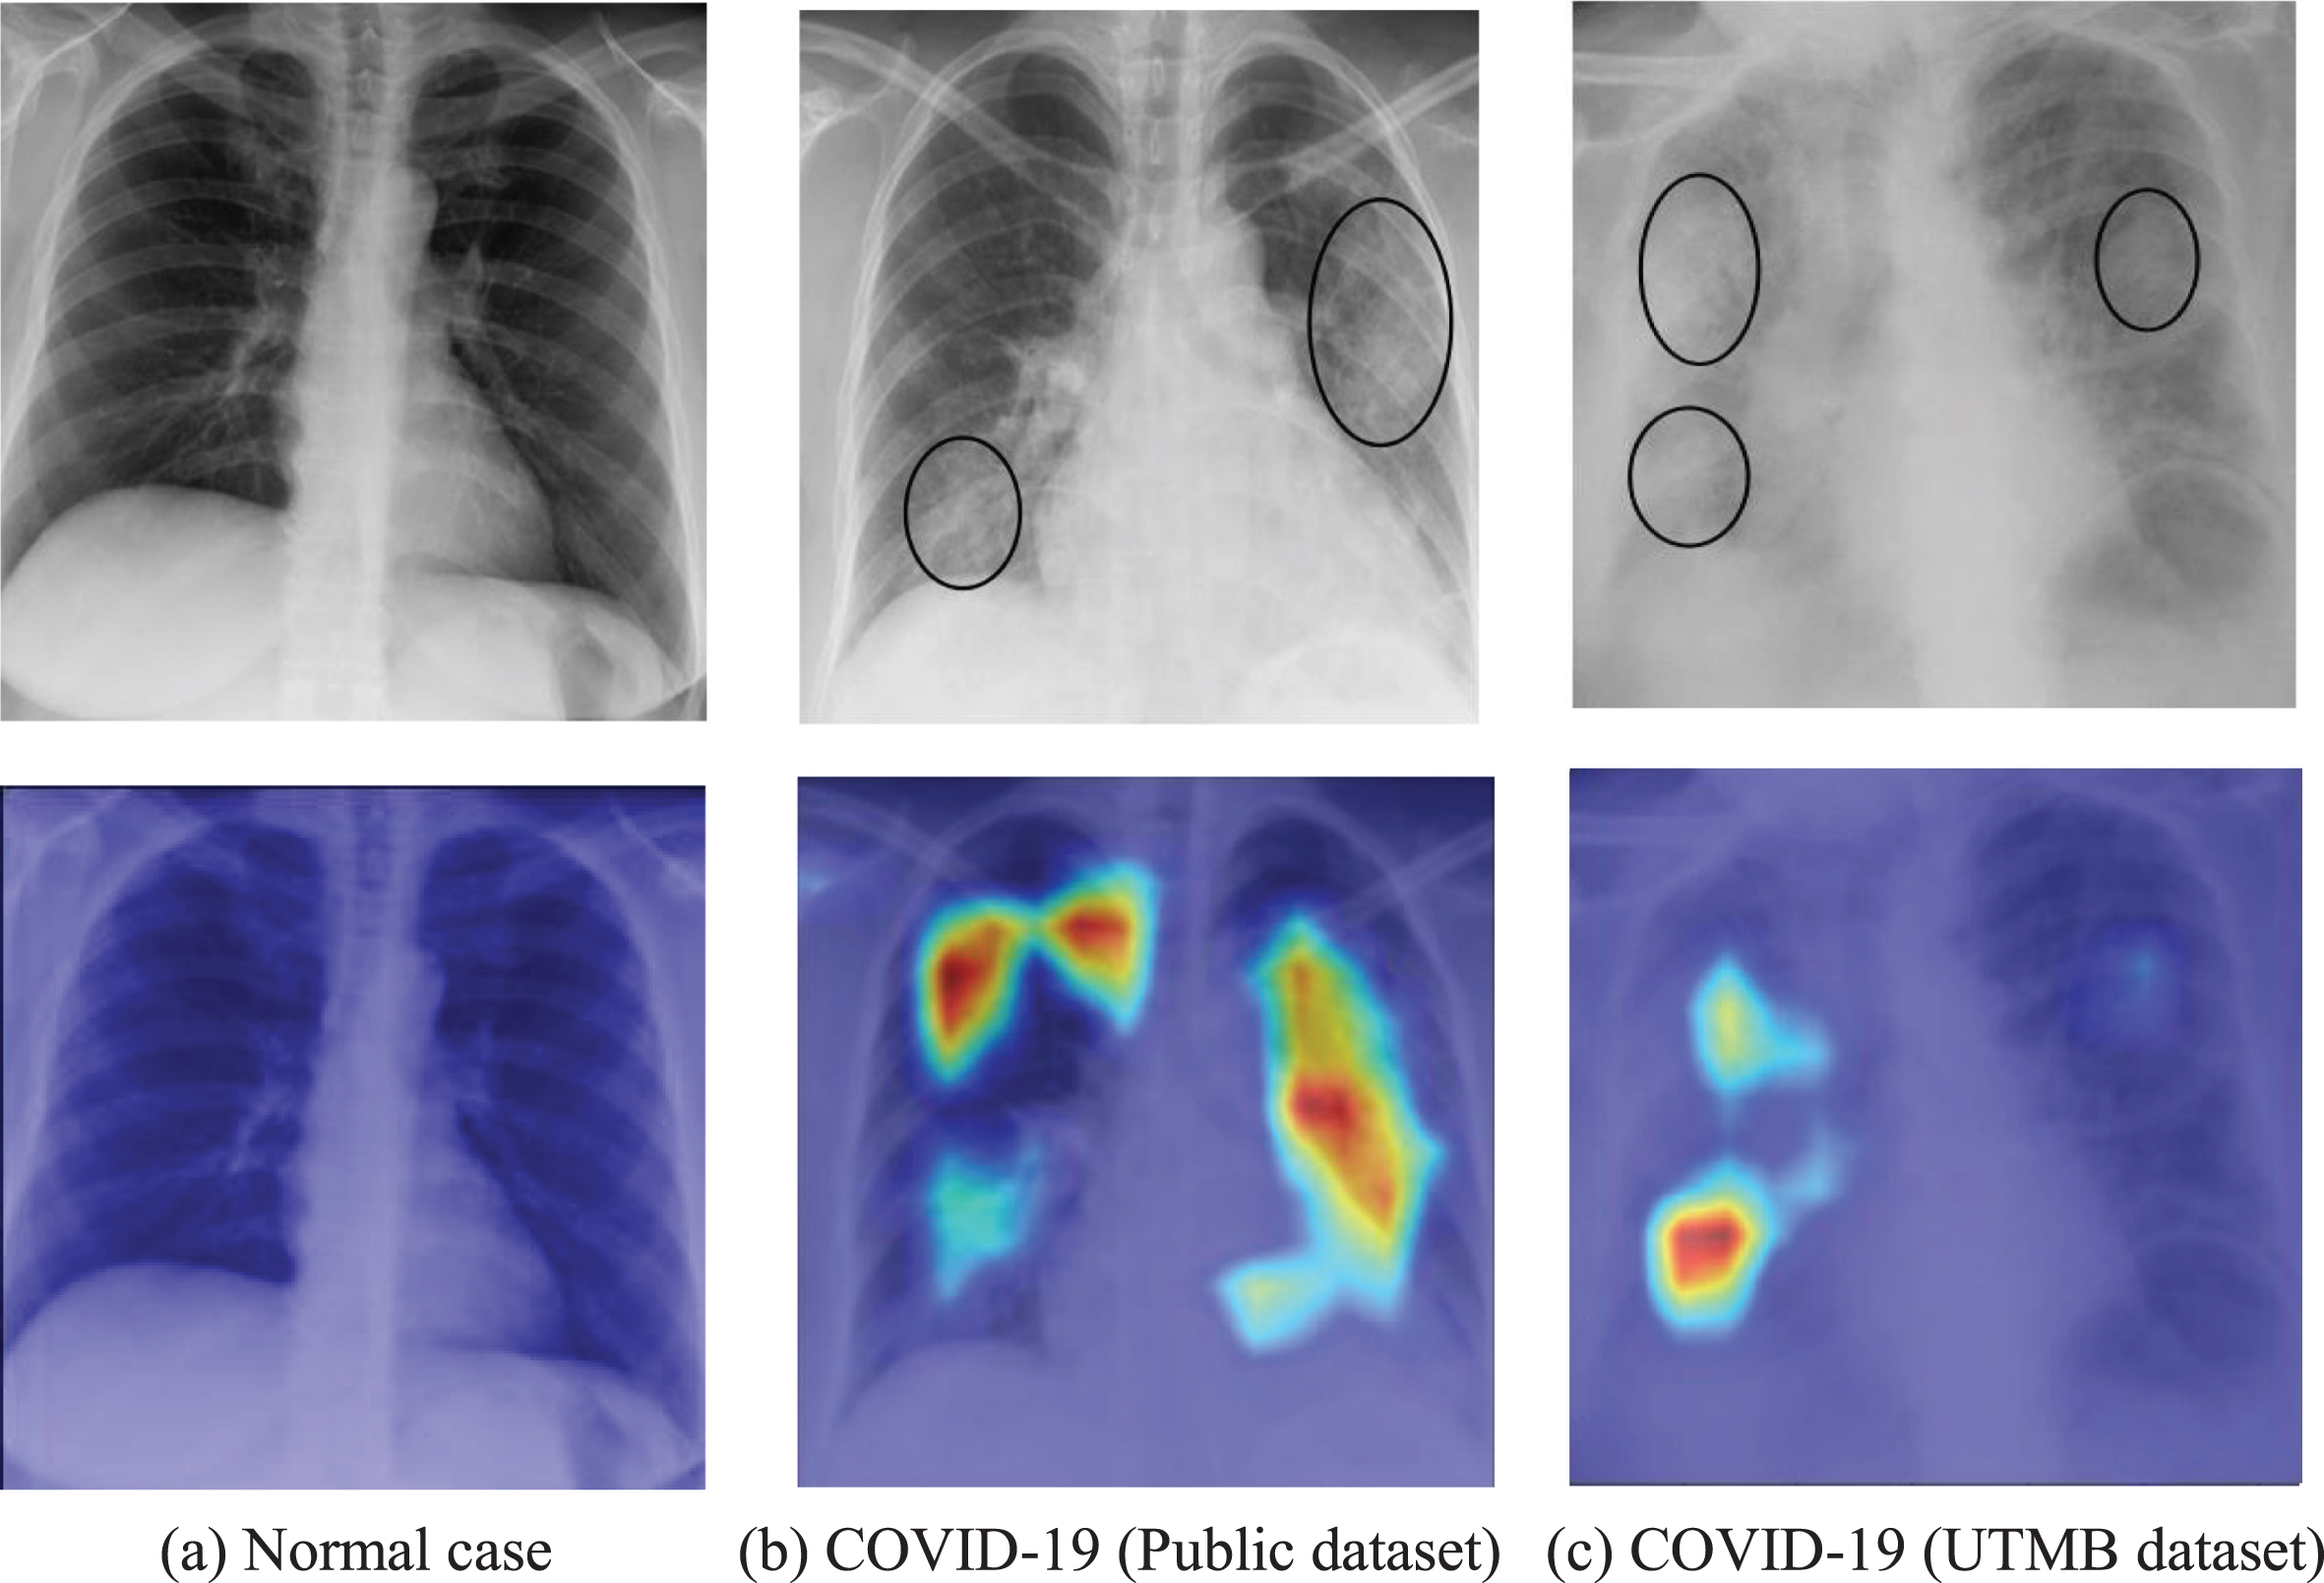
Furthermore, the Grad-CAM technique was used to create class-specific heatmap images, which is one of the interpretable approaches for CNN to highlight the areas in the decision-making process. Figure 7 illustrates examples of visualization of saliency maps. As shown in Fig. 7(a), there are almost no highlighted areas showing infected lesions on X-ray images of normal cases. The experienced radiologist explained that visualized results in Figs. 7 (b-c) shows the typical alveolar infiltrates of COVID pneumonia and the infection in the lung peripheries bilaterally as well as asymmetrically, which was in consistent with the clinical findings. For Fig. 7(b), the visualized maps include multiple network attention regions of the network, which exceeds the actual infected areas. However, this will help inexperienced or junior radiologists reduce the missed detection and improve diagnosis sensitivity in practical clinical application.
Fig. 7
Examples of probabilistic Grad-CAM of COVID-19 class. The first row is the original X-ray image and the second row is corresponding visualization map, where the COVID-19 infection areas were marked (using ellipses) by an experienced radiologist.
Therefore, the proposed system provides the doctor with an approximate tool for computer aided diagnosis in addition to the results, thereby indicating rough assessment of infected areas for each input image. It provides an intuitive and understandable basis for whether doctors should adopt the predictions from a deep learning network, especially for inexperienced radiologists. For example, it suggests the network has extracted the correct features of the key areas if the highlighted areas are basically inside the lungs. On the contrary, the prediction result should not be accepted if the main visualization areas are outside the lung, which indicates a high probability for incorrect features learned by the CNN. Therefore, the interpretable system is consistent with medical logic and clinical applicability, which greatly improved transparency and reliability of AI-assisted diagnostics.
One limitation of this study is the sample size of the clinical dataset, further data collection is required to test the generalizability of the AI model to other patient populations. Another limitation is the bias toward patients with COVID-19 in the training data, which given the possibility of the chest X-ray images most come from symptomatic patients. However, our system can be easily extended to analyses of increased dataset or other chest X-ray images generated with other types of medical equipment without extra feature extraction. In future studies, a larger dataset will be collected as the scale of this COVID-19 outbreak is climbing. It is necessary to validate the robustness of our AI system at multiple hospitals. Also, we plan to continue collecting more data not only from chest X-ray images but also from CT scans, particularly on the COVID-19 cases, to further increase the prediction accuracy of our grading system. Moreover, we plan to integrate the CXR images in more specific categories, such as bacterial pneumonia, tuberculosis and viral pneumonia, thus developing a more comprehensive computerized CXR diagnosis system.
5Conclusion
In this work, we proposed an interpretable multi-task system to automatically detect the lung region and identify COVID-19, non-COVID-19 pneumonia and normal cases from chest X-ray images and offered an objective assessment. We used an ROI detection model based on unsupervised learning to adaptively locate the lung region to represent a full chest X-ray image, which greatly reduces computation of training a deep neural networks and extracts the features from neat ROIs. Furthermore, public data sets and UTMB data sets were both collected to validate the effectiveness and robustness of the system in terms of applicability, and the performance of illustrated the potential role for the rapid COVID-19 diagnosis based on CXR. Moreover, the proposed framework is an ongoing effort to assess the interpretability potential of the solutions, which can greatly accelerate the clinical acceptance of AI classification systems. Thus, the system was comparable to assist and potentially capable of improving the performance of junior radiologists as an efficient first reading or screening tool. Moreover, the proposed AI system can also help meet the significant demand for diagnostic expertise when the health system is overloaded in a pandemic situation or in remote geographic areas.
Acknowledgments
This work was partially supported by the National Science Foundation (USA), (ECR-PEER-1935454) and (ERC-ASPIRE-1941524) and the Department of Education (USA), (P120A180101) and (DoEd- P116S210004). We also thank our collaborators from The University of Texas Medical Branch for clinical consulting and providing the proprietary dataset used in this research.
Ethics statement
The study has been approved by the Ethics Committee of the University of Texas Medical Branch. All procedures performed in the study were in accordance with the ethical standards of the Ethics Committee of the University of Texas Medical Branch. Informed consent was obtained from all individual participants included in the study.
Conflict interest
The authors declare that the research was conducted in the absence of any commercial or financial relationships that could be construed as a potential conflict of interest.
References
[1] | Khan A.I. , Shah J.L. , Bhat M.M. CoroNet: A deep neural network for detection and diagnosis of COVID-19 from chest x-ray images, Computer Methods and Programs in Biomedicine 196: ((2020) ), 105581. |
[2] | Apostolopoulos I.D. , Mpesiana T.A. Covid-19: automatic detection from x-ray images utilizing transfer learning with convolutional neural networks, Physical and Engineering Sciences in Medicine 43: ((2020) ), 635–640. |
[3] | Sarker M. , Makhlouf Y. , Banu S.F. et al., Web-based efficient dual attention networks to detect COVID-19 from X-ray images, Electronics Letters 56: (24) ((2020) ), 1298–1301. |
[4] | Aradhya V. , Mahmud M. , Guru D.S. et al., One-shot Cluster-Based Approach for the Detection of COVID–19 from Chest X–ray Images, Cognitive Computation 13: (4) ((2021) ), 873–881. |
[5] | Ucar F. , Korkmaz D. COVIDiagnosis-Net: Deep Bayes-SqueezeNet based Diagnostic of the Coronavirus Disease 2019 (COVID-19) from X-Ray Images, Medical Hypotheses (2020), 109761. |
[6] | Heidari M. , Mirniaharikandehei S. , Khuzani A.Z. , Danala G. , Qiu Y. , Zheng B. Improving the performance of CNN to predict the likelihood of COVID-19 using chest X-ray images with preprocessing algorithms, International Journal of Medical Informatics 144: ((2020) ), 104284. |
[7] | Abdollahi B. , El-Baz A. , Frieboes H.B. Overview of Deep Learning Algorithms Applied to Medical Images, Big Data in Multimodal Medical Imaging (2019), 225–237. |
[8] | Waheed A. , Goyal M. , Gupta D. , Khanna A. , Al-Turjman F. , Pinheiro P.R. Covidgan: Data augmentation using auxiliary classifier GAN for improved Covid-19 detection, IEEE Access 8: ((2020) ), 91916–91923. |
[9] | Ahammed K. , Satu M.S. , Abedin M.Z. , Rahaman M.A. , Islam S.M.S. Early Detection of Coronavirus Cases Using Chest X-ray Images Employing Machine Learning and Deep Learning Approaches, medRxiv, 2020. |
[10] | Ouyang X. et al., Dual-Sampling Attention Network for Diagnosis of COVID-19 from Community Acquired Pneumonia, IEEE Transactions on Medical Imaging, 2020. |
[11] | Kang H. et al., Diagnosis of coronavirus disease (covid-19) with structured latent multi-view representation learning, IEEE Transactions on Medical Imaging 39: (8) ((2020) ), 2595–2605. |
[12] | Maghdid H.S. , Asaad A.T. , Ghafoor K.Z. , Sadiq A.S. , Khan M.K. Diagnosing COVID-19 pneumonia from X-ray and CT images using deep learning and transfer learning algorithms, arXiv preprint arXiv:2004.00038, 2020. |
[13] | Khalifa N.E.M. , Taha M.H.N. , Hassanien A.E. , Elghamrawy S. Detection of coronavirus (COVID-19) associated pneumonia based on generative adversarial networks and a fine-tuned deep transfer learning model using chest X-ray dataset, arXiv preprint arXiv:2004.01184, 2020. |
[14] | Hasan M.K. et al., Challenges of Deep Learning Methods for COVID-19 Detection Using Public Datasets, medRxiv, 2020. |
[15] | Rajaraman S. , Antani S. Training deep learning algorithms with weakly labeled pneumonia chest X-ray data for COVID-19 detection, medRxiv, 2020. |
[16] | Candemir S. , Antani S. A review on lung boundary detection in chest X-rays,”, International Journal of Computer Assisted Radiology and Surgery 14: (4) ((2019) ), 563–576. |
[17] | Gozes O. et al., Rapid ai development cycle for the coronavirus (covid-19) pandemic: Initial results for automated detection & patient monitoring using deep learning CT image analysis, arXiv preprint arXiv:2003.05037, 2020. |
[18] | Cohen J.P. , Morrison P. , Dao L. Covid-19 image data collection, arXiv 200311597, 2020. |
[19] | Chung A. (2020a) Actualmed covid-19 chest X-ray data initiative. https://github.com/agchung/Actualmed-COVIDchestxray-dataset. |
[20] | Chung A. (2020b) Figure 1 covid-19 chest X-ray data initiative. https://github.com/agchung/Figure1-COVIDchestxray-dataset. |
[21] | Tawsifur R. (2019) COVID-19 radiography database. https://www.kaggle.com/tawsifurrahman/covid19-radiographydatabase. |
[22] | RSNA (2019) RSNA pneumonia detection challenge. https://www.kaggle.com/c/rsna-pneumonia-detectionchallenge/data. |
[23] | NIH Chest X-ray Dataset of 14 Common Thorax Disease Categories https://nihcc.app.box.com/v/ChestXray-NIHCC. |
[24] | Oh Y. , Park S. , Ye J.C. Deep learning Covid-19 features on CXR using limited training data sets, IEEE Transactions on Medical Imaging 39: (8) ((2020) ), 2688–2700. |
[25] | Vaid S. , Kalantar R. , Bhandari M. Deep learning COVID-19 detection bias: accuracy through artificial intelligence, International Orthopaedics 44: ((2020) ), 1539–1542. |
[26] | Sitaula C. , Hossain M.B. Attention-based VGG-16 model for COVID-19 chest X-ray image classification, Applied Intelligence 51: (1) ((2021) ), 2850–2863. |
[27] | Tan W. , Liu P. , Li X. et al., Classification of COVID-19 pneumonia from chest CT images based on reconstructed super-resolution images and VGG neural network, Health Information Science and Systems 9: (1) ((2021) ), 1–12. |
[28] | Lin T.Y. , Goyal P. , Girshick R. et al., Focal loss for dense object detection, Proceedings of the IEEE International Conference on Computer Vision (2017), 2980–2988. |
[29] | Das D. , Santosh K.C. , Pal U. Truncated inception net: COVID-19 outbreak screening using chest X-rays, Physical and Engineering Sciences in Medicine 43: (3) ((2020) ), 915–925. |
[30] | Selvaraju R.R. , Cogswell M. , Das A. et al., Grad-CAM: Visual explanations from deep networks via gradient-based localization, International Journal of Computer Vision 128: (2) ((2020) ), 336–359. |


