
Optimized chest X-ray image semantic segmentation networks for COVID-19 early detection
Abstract
BACKGROUND:
Although detection of COVID-19 from chest X-ray radiography (CXR) images is faster than PCR sputum testing, the accuracy of detecting COVID-19 from CXR images is lacking in the existing deep learning models.
OBJECTIVE:
This study aims to classify COVID-19 and normal patients from CXR images using semantic segmentation networks for detecting and labeling COVID-19 infected lung lobes in CXR images.
METHODS:
For semantically segmenting infected lung lobes in CXR images for COVID-19 early detection, three structurally different deep learning (DL) networks such as SegNet, U-Net and hybrid CNN with SegNet plus U-Net, are proposed and investigated. Further, the optimized CXR image semantic segmentation networks such as GWO SegNet, GWO U-Net, and GWO hybrid CNN are developed with the grey wolf optimization (GWO) algorithm. The proposed DL networks are trained, tested, and validated without and with optimization on the openly available dataset that contains 2,572 COVID-19 CXR images including 2,174 training images and 398 testing images. The DL networks and their GWO optimized networks are also compared with other state-of-the-art models used to detect COVID-19 CXR images.
RESULTS:
All optimized CXR image semantic segmentation networks for COVID-19 image detection developed in this study achieved detection accuracy higher than 92%. The result shows the superiority of optimized SegNet in segmenting COVID-19 infected lung lobes and classifying with an accuracy of 98.08% compared to optimized U-Net and hybrid CNN.
CONCLUSION:
The optimized DL networks has potential to be utilised to more objectively and accurately identify COVID-19 disease using semantic segmentation of COVID-19 CXR images of the lungs.
1Introduction
The COVID-19 is a worldwide epidemic that kills thousands of people every day. Typically, COVID-19 spreads via direct contact between individuals or organisms. The most successful method for breaking the infection chain is early detection and treatment. In many countries, healthcare systems are being strained by full of COVID-19, which is having rapid spread by the severe acute respiratory syndrome (SARS)-coronavirus-2 (SARS-CoV-2), which has single-stranded genomes made of ribonucleic acid (RNA). In December 2019, the largest epidemic of the millennium began in Wuhan, China [1]. According to experts, the COVID-19 virus has an incubation period of about one week [2]. This period is very significant because the infection can spread by the infected patient unknowingly and act as silent carriers. It spreads faster than its detection due to its highly transmissible nature.
According to the World Health Organization’s (WHO) Coronavirus dashboard, there would be over 267.8 million COVID-19 cases globally by December 2021, with 5.28 million deaths. The symptoms in the infected cases may include fever, breathing difficulty, coughing, fatigue, and a loss of taste and smell. For detecting COVID-19, a nasopharyngeal swab reverse transcription (RT)-polymerase chain reaction (PCR) is the gold standard testing method. While continuous PCR sputum testing in confirming COVID-19 has the highest sensitivity, the time necessary to confirm infection in infected patients can be lengthy [3]. On the other hand, the rapid antigen test checks for virus antigens in a nasal swab but produces more false negatives. The patient’s blood is tested for viral antibodies in a serological test. It primarily tracks IgM and IgG antibodies throughout and after recovery, rather than detecting viruses early. The CXR images to diagnose individuals with a high probability of infection can be critical, except for pregnant women and children in emergencies [4]. The CXR images have been studied as a technique of detecting COVID-19 in the ongoing pandemic since chest X-ray scans are cost-effective and the results are straightforward to interpret. Chest X-rays are readily available, portable, and expose patients to relatively minimal radiation.
Because of the high radiation exposure, current guidelines do not recommend CT scan images for regular testing of COVID-19. As a result, radiologists recommend that COVID-19 be diagnosed via CXR images. X-ray machines may provide two-dimensional images of the patient’s chest in most radiological laboratories and hospitals. The CXR images have been used to confirm or recommend COVID-19 treatment in infected patients [5]. They help radiologists in perceiving chest pathology in general. A CXR can give more information about a patient. Interpreting this information from CXR requires a radiologist’s skill, experience, and concentration. Even expert radiologists have trouble distinguishing infiltrates from normal blood vessels [6]. Interobserver and intraobserver differences of up to 30 points are common when radiologists grade abnormal findings [7]. Because of the clinical importance and complexity of CXR understandings, researchers continue to investigate machine learning and image processing methods to develop analytical approaches in understanding CXR images by radiologists [8]. These methods are combined by the computer-aided diagnosis (CAD) systems in which the medical image segmentation [9] and classification [10] are two critical steps to identify abnormalities in patients.
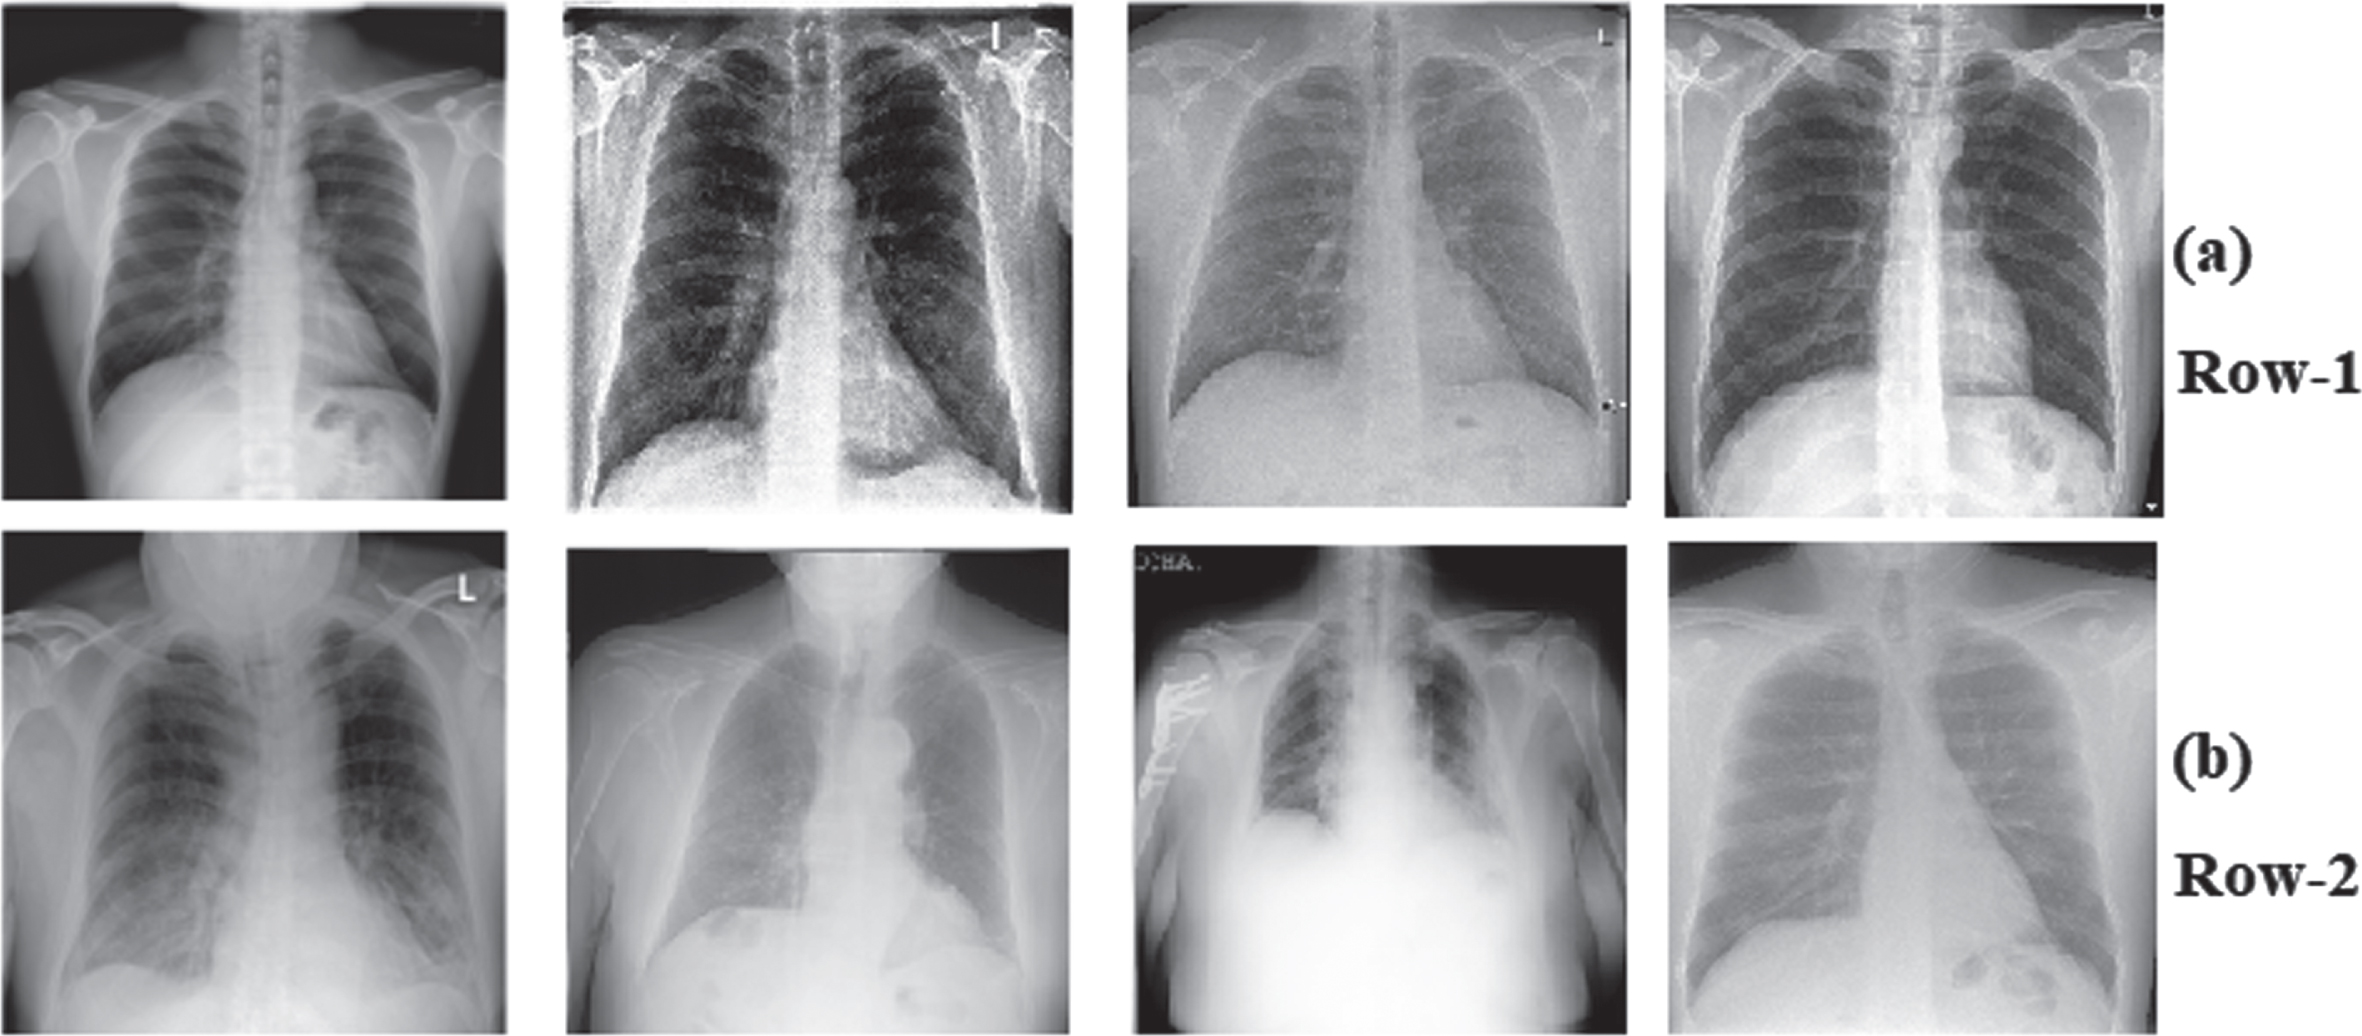
By providing structural information about the irregular shapes and sizes of the lungs, the chest X-ray lung segmentation also investigates serious clinical conditions like pleural effusion, emphysema, and pneumothorax. The effects of CAD system imaging artifacts are reduced when the mask accurately identifies the region of the lung by its segmentation with discarding other regions [11]. The CAD systems can typically produce acceptable segmentations in differentiating regions of the lung and their boundaries when the patients are healthy or have only a small lesion. This research aims to develop automatic lung semantic segmentation networks to segment infected lung regions from CXR images and predict COVID-19 infection. Developing a tool for semantically segmenting COVID-19 patient’s medical lung images would aid in image irregularity quantification, can manage overcrowded hospitals more effectively. Therefore, an automated method for recognizing and measuring infected lung areas would be extremely beneficial. The CXR image samples are shown in Fig. 1.
Fig. 1
CXR image samples of (a) Row-1: Normal, (b) Row-2: COVID-19.
2Related works
To build networks that simulate higher-order systems and achieve human-like performance, DL has become a popular technique. Researchers Daimary.D et al. in [12] developed brain tumor segmentation from Magnetic Resonance Imaging (MRI) images with several network hybridizations, including U-Net and SegNet, with over 90% accuracy. Breast tumors are segmented using conditional generative adversarial network (cGAN) with an accuracy of 80% by Singh VK et al. in [13]. The generated marks are classified using a convolutional neural network (CNN). When comparing detection accuracy in two structurally different DL networks using lungs CT scan images, Saood, A. et al. [14] found that SegNet and U-Net were more than 90% accurate. Some graphical elements of COVID-19 may be extracted from CT images using artificial intelligence methods, according to Wang, S.et al. [15]. According to Li, Y., and Xia L. [16], a low misdiagnosis rate in COVID-19 can be achieved with chest CT images. The researchers could better distinguish between infected and non-infected patients. Chest CT scans detect COVID-19 infections faster than RTPCR assays, according to research by T. Ai et al. [17]. For example, a patient’s recovery or the severity of infection can be tracked with recurrent scanning. Khalid El Asnaoui et al. [18] implemented an inception-ResNet-V2 DL model classification accuracy of 92.18 percent on CT and CXR images to detect Coronavirus disease. Deng-Ping Fan et al. in [19] detected COVID-19 from the CT slices segmentation automatically using Infection Segmentation Deep Network (Inf-Net). Kai Gao et al. in [20] developed a combined segmentation and classification dual branch network for lesion segmentation and attention mechanism on CT images to improve the sensitivity in COVID-19 prediction. N.Paluru et al. [21] developed a lightweight CNN with lower parameters called Anam-Net for CT images to segment infected regions to detect COVID-19, containing a lightweight CNN with fewer parameters than U-Net. To segment COVID-19 lesions, Q.Yan et al. in [22] presented a very accurate segmentation network (COVID-SegNet) for CT images. A multiscale feature fusion technique called COVID-SegNet was employed with enhanced features. To improve different CT image feature representation levels, Ruiyong Zheng et al. [23] used the 3D CU-Net attention technique for the segmentation of CT images. An MTL architecture to perform multi-task deep learning on CT image segmentation and classification by Amyar A et al. [24]. DL-based COVID-19 diagnosis system called DRE-Net was developed for CT images by Y. Song et al. [25].
The COVIDX-Net is a DL network developed by Hemdan EED et al. [26] to predict the COVID-19 in CXR images by analyzing the normalized intensities. To analyze CXR images and categorize them as positive or negative, A. I. Khan et al. [27] presented the CoroNet DCNN model. An AI-based method was present by Maghdid HS et al. [28], enabling radiologists and other health care professionals to quickly and accurately review COVID-19 cases. In addition, identification method based on DL and TL (Transfer Learning) approaches with the huge number of CXR and CT images stated on different datasets. Decompose, Transfer, and Compose (DeTraC) CNN was developed by Abbas, A. et al. in [29] for COVID-19 CXR images classification, and the TL was used to fine-tune the parameters. Afshar P. et al. [30] developed a new demonstration system, the COVID-CAPS, that used capsule networks (instead of CNNs) for early COVID-19 detection in CXR. For improved screening, Wang, L. et al. [31] developed a prediction method based on COVID-Net. Deep learning utilizing CNNs, as demonstrated by I.D. Apostolopoulos et al. [32] can automatically improve essential elements detection and extraction from CXR images for early Covid-19 detection. P.K. Sethy et al. [33] implemented a 95.33 percent accurate residual network-50 (ResNet50) with a support vector machine (SVM) for early COVID-19 detection in CXR images. Oh, Y. et al. [34] investigated the prospective CXR COVID-19 markers statistically. They employed COVID-19 CXR images, which uses lung intensities mean and standard deviation to construct a local patch-based method. Their classification model was up to 88.9% accurate. To differentiate the COVID-19 infection among pneumonia and lung illnesses, MD. Li et al. [35] presented Siamese Neural Networks for pulmonary CXR images. The researchers Loey M al. [36] proposed deep transferred learning-based GAN network with Alexnet, Resnet18, and Googlenet achieved accuracy over 66.67%, 69.46%, and 80.56% respectively with other metrics for detecting COVID-19 in CXR images. DL networks such as InceptionV3, ResNet-50, and ResNet-10 are developed to detect the CoVID-19 with 95.40%, 96.10%, and 96.10% by Narin, A. et al. in [37] using CXR images. The Mask R-CNN DL network is proposed to classify the COVID-19 by Soumyajit P., et al. [38]. For segmenting the Lung fields of the CXR images, LF-SegNet was developed by Mittal, A. et al. [39]. The U-Net DL network and its modified forms for lung parenchyma are performing segmentation on CXR images with a dice coefficient over 99.1% proposed by Tan, Wenjun et al. [40]. Goel, T. et al. [41] implemented an optCoNet with GWO (Grey wolf optimizer) for hyperparameters optimization in a convolutional neural network to diagnose COVID-19 in CXR. The COVID-19 diagnosis utilizing DL analysis of CXR images and chest CT images has been the subject of numerous research projects so far, with encouraging results. On the other hand, semantic segmentation of such images has shown to be less interesting. The low detection accuracy is one primary limitation of previous studies with the advantages of detecting COVID-19 from X-ray and CT images.
It is challenging to identify infected lung lobes in CXR images for early COVID-19 decease diagnosis with higher accuracy. The motivation of this study is to make the DL networks and their optimized networks suitable for detecting COVID-19 from the CXR images with greater accuracy by segmenting the COVID-19 CXR images. The medical image semantic segmentation was investigated to determine if it might be used to diagnose COVID-19 accurately. The addition of high-level problem independent meta-heuristic optimization techniques with the DL networks in early COVID-19 decease detection using CXR images further improves the segmentation and classification accuracy. Several optimization techniques are available in deep learning to find out the best possible options for training the DL networks with complex structures with more hyperparameters.
3Materials and methods
3.1Dataset
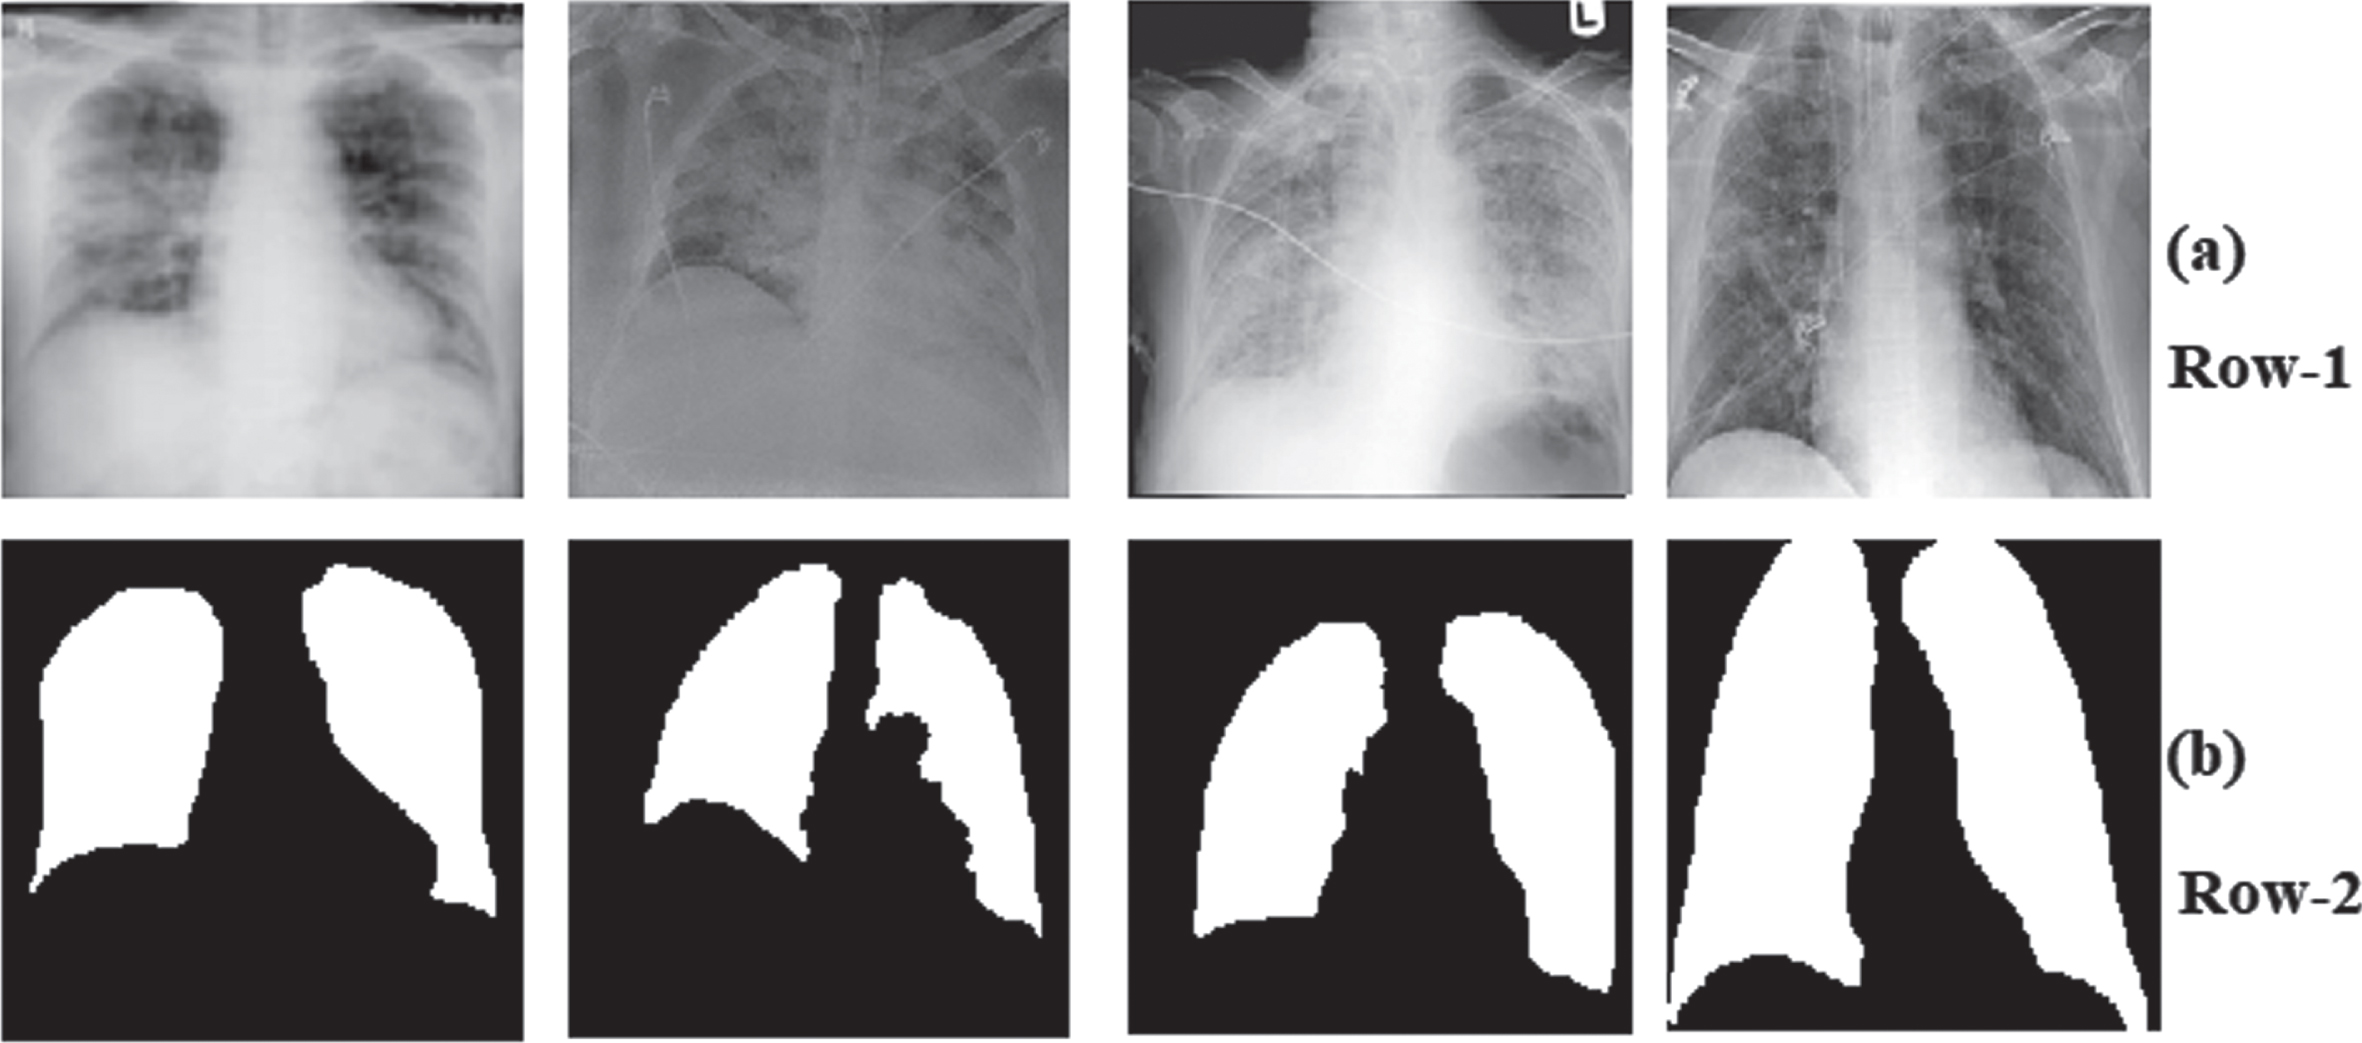
This research work uses the QaTa-COV19 dataset containing COVID-19 CXR images, developed by researchers of Qatar University and Tampere University [42, 43]. Aysen Degerli et al. in [44] employed a novel human-machine technique to annotate ground-truth segmentation masks on CXRs, a CXR dataset comprising the COVID-19 infected regions and segmentation masks was published. The dataset contains 2,572 COVID-19 images, including 2,174 training images and 398 testing images. To build the dataset for the proposed networks, we obtained 2,174 ground truth masks matching the 2,174 CXR images of COVID-19 from the publicly available QaTa-COV19 dataset in the kaggle public repository for training. All these images have been downsized to 256x256 pixels. The sample CXR dataset with COVID-19 images and corresponding ground truth segmented images used as masks are shown in Fig. 2. The DL network can produce only rough localization in images if no ground truth masks are used. Further, COVID-19 in CXR may fail to detect by the activation maps.
Fig. 2
Sample dataset (a) Row-1: COVID-19 CXR images (b) Row-2: Ground-truth images.
3.2Deep Learning Neural Networks
A deep learning (DL) neural network is an artificial neural network (ANN) that contains several hidden layers. The Neurons, weights, biases, and functions are all fundamental components of neural networks, which come in a variety of shapes and sizes. The function of the human brain and these components of the neural networks are similar and may be trained in the same way as any other ML algorithm. Semantically segmenting an image involves building a structure that combines features from successive convolutional operations to produce a segmentation map. This study gives a brief overview of three fundamentally distinct deep learning networks: SegNet, U-Net, and Hybrid CNN with SegNet plus U-Net. These three networks semantically segment biomedical images such as COVID-19 CXR images.
3.3SegNet architecture
Developing scene segmentors for road images requires a deep neural network (DNN). The network must converge using imbalanced datasets because road images contain classes like road, sidewalk, and sky. One such DNN available used as scene segmentors is a SegNet. Practically, SegNet is a deep fully CNN used for pixel by pixel semantic segmentation motivated by scene understanding applications primarily [45]. Thus, SegNet is designed to be memory and computationally efficient during inference requires less trainable parameters than the other semantic networks.
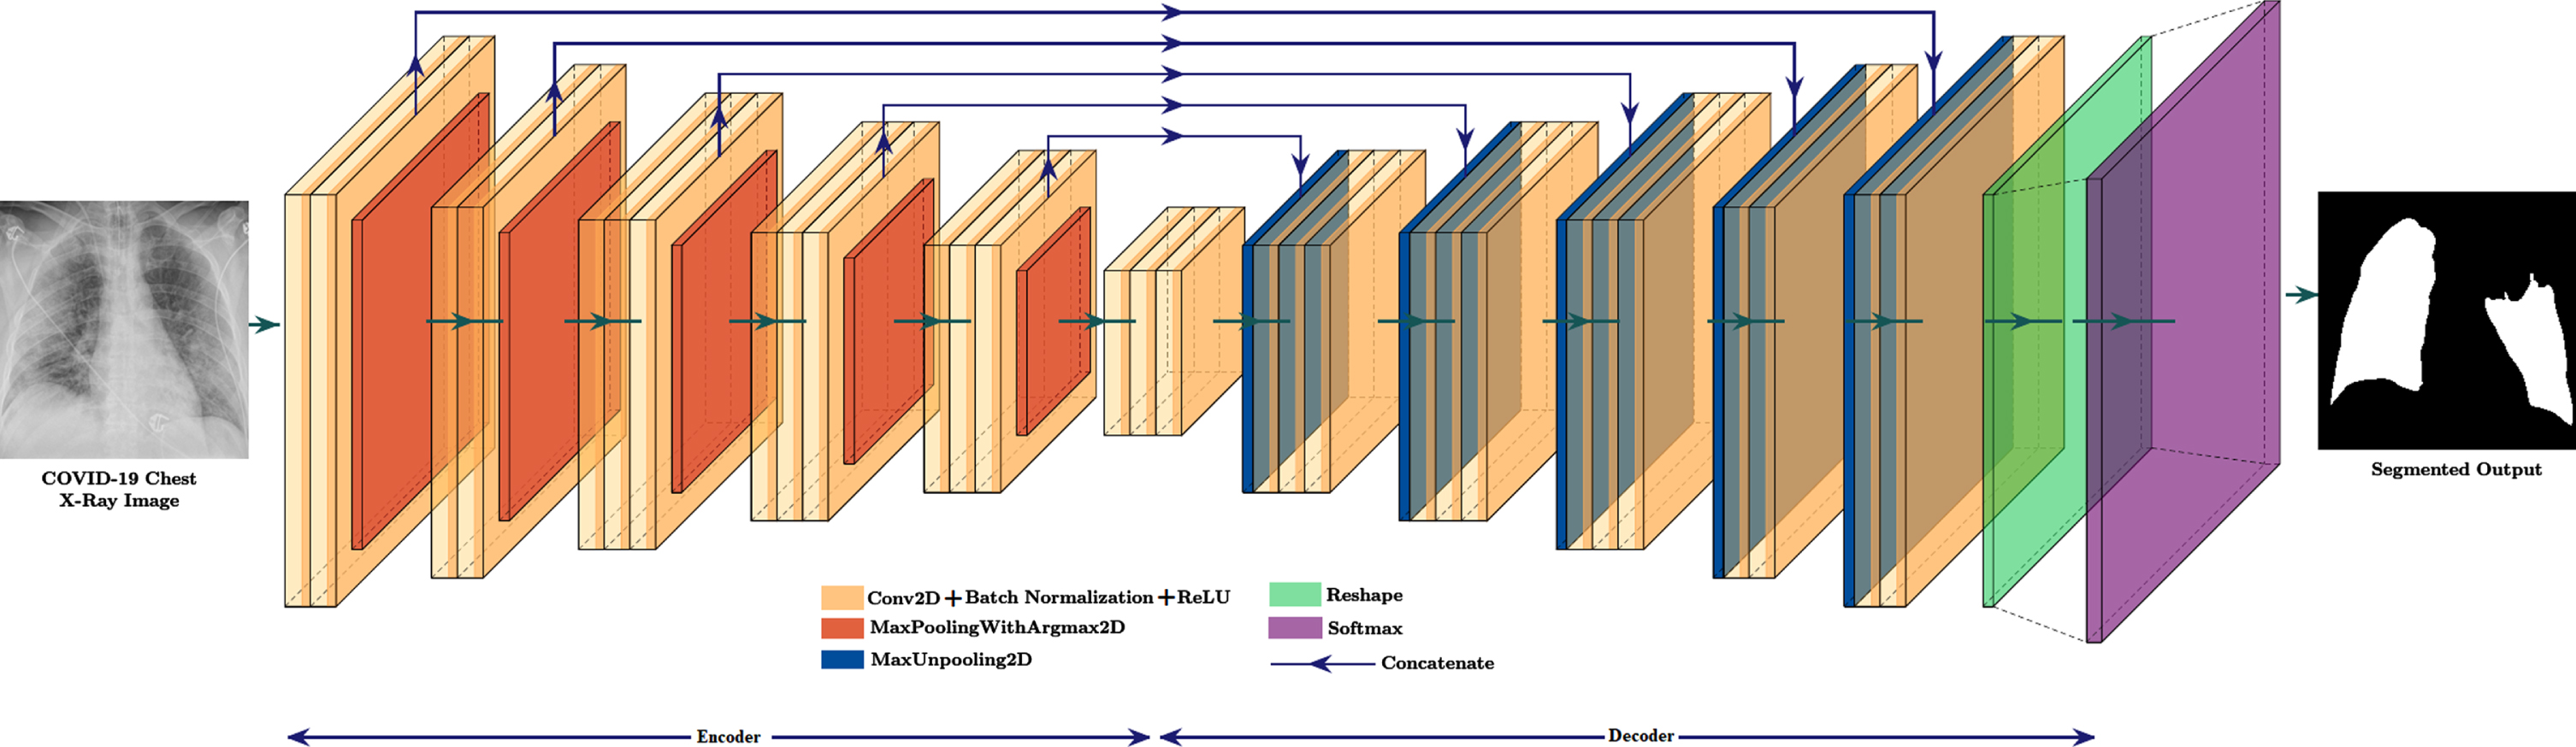
An iterative method like gradient descent (GD) can train the SegNet model consisting of an encoder-decoder network with a pixel-wise classification. In VGG16 (Visual Geometry Group-16) network, there are 13 convolutional layers, and the SegNet encoder network has the same topological structure [46]. The downsampling operation of the SegNet encoder produces feature maps with low resolution, and it can be brought into full-resolution feature maps by upsampling operation of the SegNet decoder. Further, these full-resolution feature maps are used as input for pixel-by-pixel classification with a softmax layer. The SegNet decoder network performs upsampling by using pooling indices obtained from the max-pooling operation of the encoder to upsamples lower resolution feature map(s) and is the uniqueness present in SegNet. It is no longer necessary to learn how to upsampling need to perform in the decoder. High-resolution upsampled maps are feature maps with sparse features transformed into dense feature maps using convolutional trainable filters. The SegNet architecture used in this study is shown in Fig. 3.
Fig. 3
SegNet architecture.
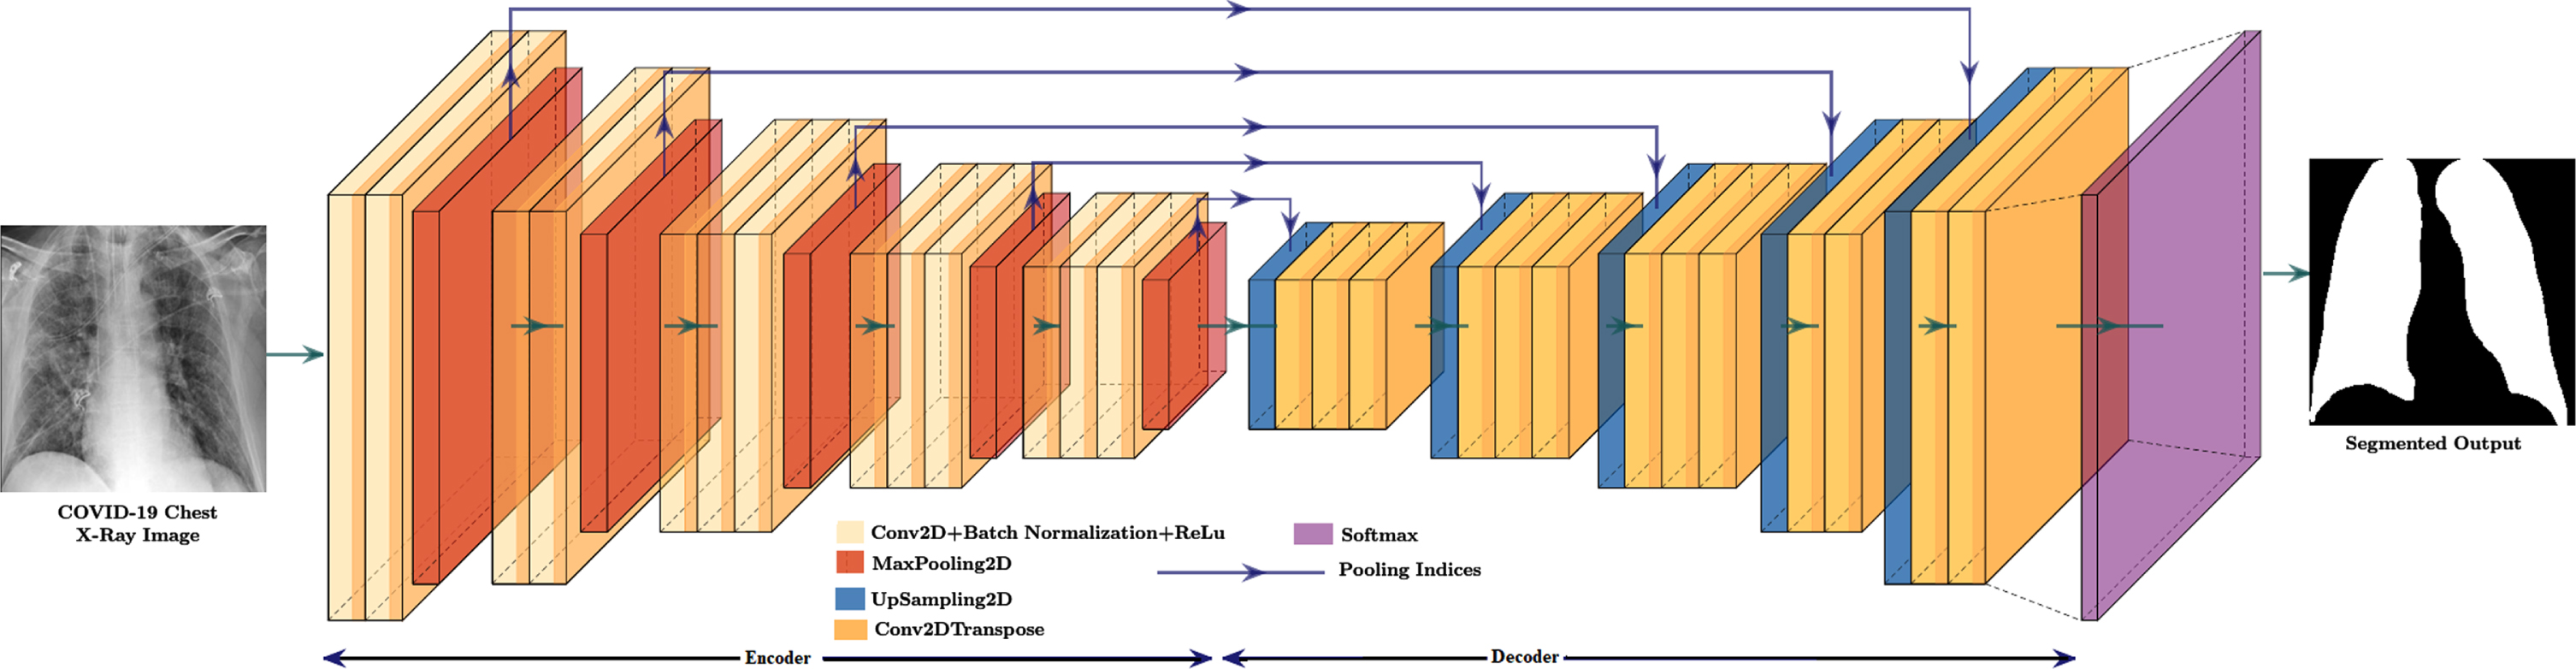
The SegNet’s encoder has 13 convolutional-2D layers with 3 × 3 filters, batch normalization, ReLu (Rectified Linear Units) activations, and 5 max pooling 2D layers of size 2 × 2 with a stride equal to 2. For small spatial shifts, the translation invariance can be achieved with max-pooling operation by downsampling the input by a factor of 2. A batch normalization layer normalizes the output of each convolutional 2D layer for each training mini-batch. The function f (x) = max(0, x), where x is input to the activation function and is then applied element-by-element with a ReLu layer. SegNet’s decoder includes 5 upsampling 2D layers and 13 convolutional 2D-Transpose layers with 3 × 3 filters, batch normalization, and ReLu. The upsampling 2D layers in the decoder of SegNet perform non-linear upsampling by using pooling indices obtained from max-pooling 2D layers of the encoder to upsamples lower resolution feature map(s) that have been memorized. The High-resolution upsampled maps are feature maps with sparse features transformed into dense feature maps using convolutional trainable convolutional 2D-transpose layers with 3 × 3 filters, batch normalization, and ReLu. The high dimensional dense feature maps of the decoder are feed to the softmax layer for pixel-by-pixel classification. This softmax layer classifies each pixel separately, produces N-channels of probabilities for each N number of classes. The class with the highest probability at each pixel corresponds to the expected segmentation.
3.4U-Net architecture
A DL network primarily developed for understanding and segmenting medical images is U-Net [47] and is a significant architecture with a wide range of applications. This section goes through the network’s core technological aspects and how they contribute to successful results. U-Net can also be used for semantic segmentation similar to SegNet, the name for U-Net comes from its encoder and decoder designed in U-shape. The layer in encoder and decoder of U-Net performs downsampling and upsampling respectively. The pooling indices are not used in U-Net similar to the SegNet. The entire feature map from the encoder is transferred to the corresponding decoding layer. The final feature map is generated by concatenating the upsampled feature map with the transferred feature map. The U-Net architecture used in this study is visualized in Fig. 4.
Fig. 4
U-Net architecture.
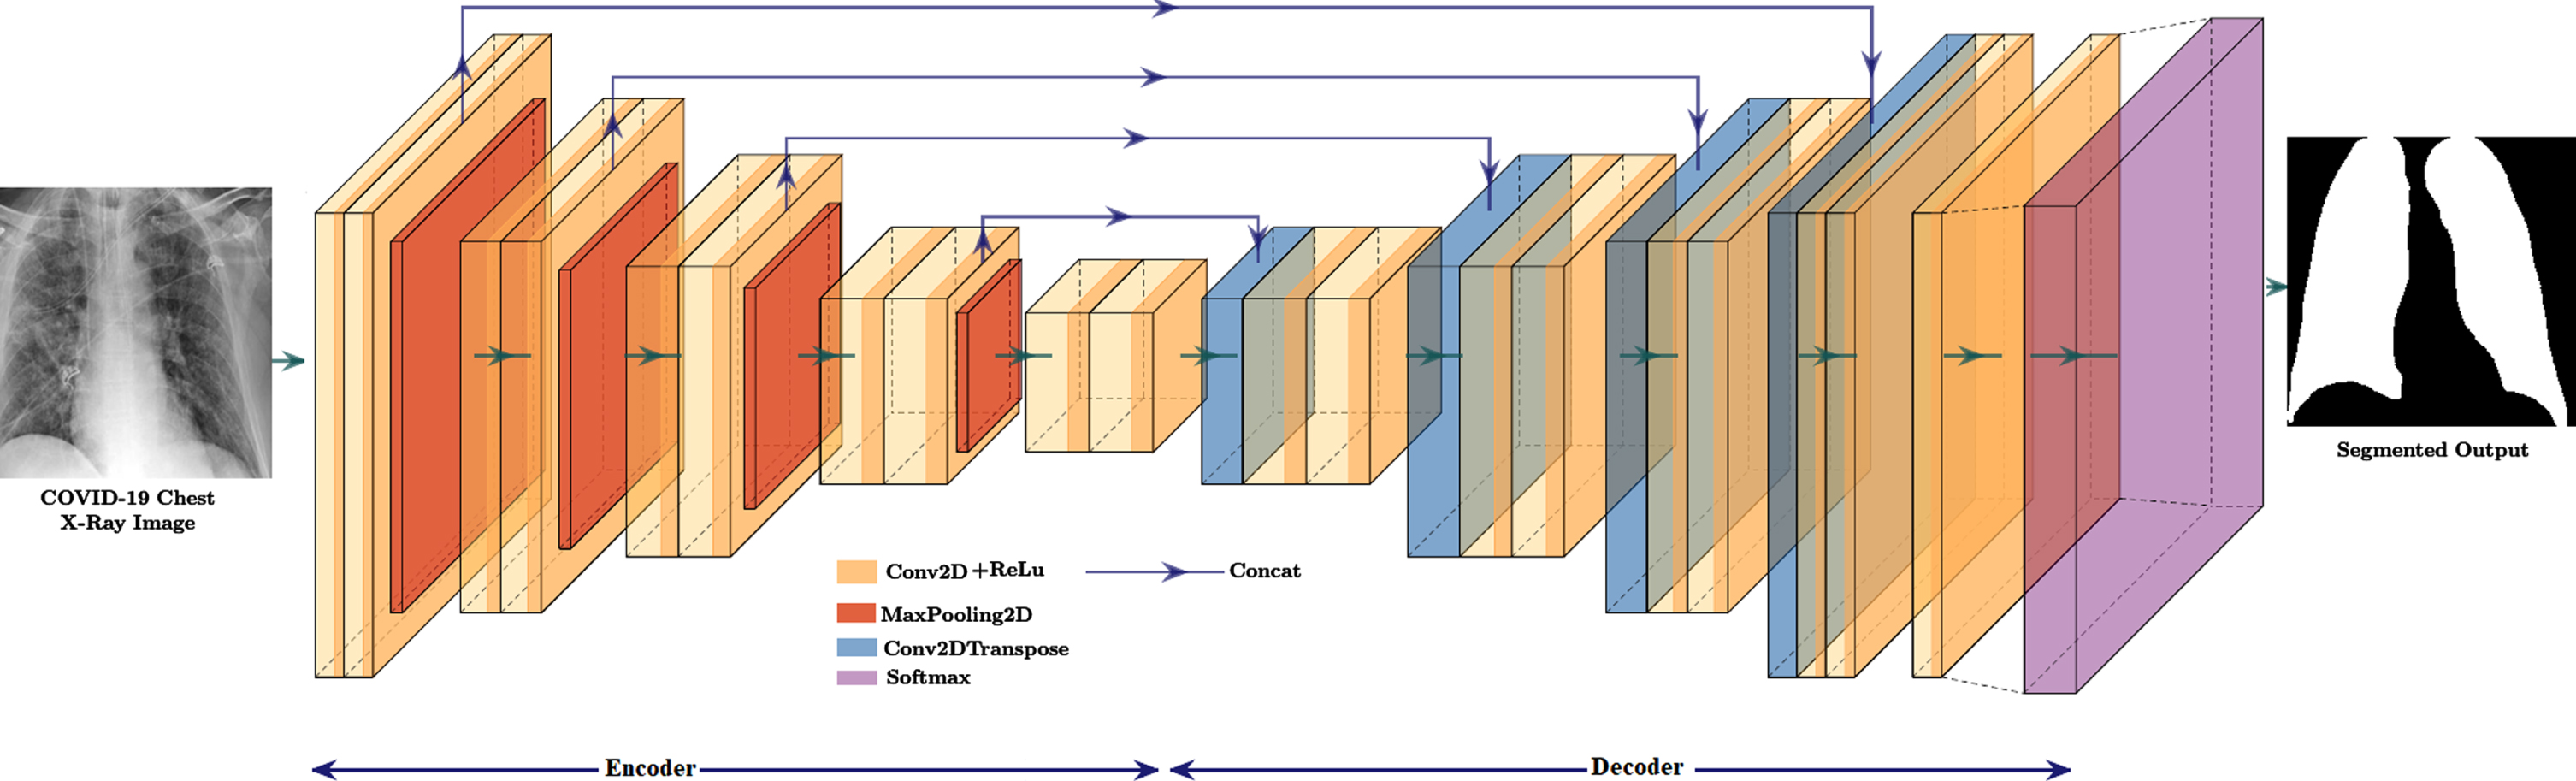
The U-Net for semantic segmentation has an encoder, corresponding decoder along with a softmax classifier. U-Net’s encoder and decoder contain the repeated application of 3x3 convolutional layers, ReLu activation, and 2x2 max-pooling2D operations with a stride equal to 2. The downsampling operation of the U-Net encoder produces feature maps with low resolution, and it can be brought into full-resolution feature maps by upsampling operation of the U-Net decoder.
The U-Net encoder has 10 convolutional-2D layers with 3x3 filters, ReLu (Rectified Linear Units) activations, and 4 maxPooling2D layers with a 2x2 windows and stride value equal to 2. Every convolutional layer’s output is element-wise applied to the function f (x) = max(0, x) by a ReLu layer. For small spatial shifts, the translation invariance can be achieved with max-pooling operation by downsampling the input by a factor of 2. U-Net’s decoder has four convolutional 2D-transpose layers with 3x3 filters, 8 convolutional- 2D layers with 3x3 filters together with ReLu, and one convolutional 2D layer with 1x1 filters. There is a softmax layer at the end of the decoder for pixel-wise classification. The convolutional 2D-transpose layer and convolutional-2D layers concatenation provides the upsampling in U-Net. The upsampling layer is formed by concatenating the suitably cropped feature map from the decoder. The final 1x1 convolutional-2D layer transfers each 32-component feature vector to the required number of classes. The high-dimensional feature representation is provided to a trainable soft-max classifier at the final decoder’s output. Each pixel is classified separately by this soft-max method. The softmax layer receives the decoder’s high-dimensional dense feature maps for pixel-wise categorization. This softmax layer classifies each pixel separately, produces N-channels of probabilities for each N number of classes. The class with the highest probability at each pixel corresponds to the expected segmentation.
3.5Hybrid CNN architecture
The CNN hybridization is formed by combining SegNet and U-Net architectures with downsampling and upsampling properties for conducting semantic segmentation of COVID-19 CXR images in the same manner as SegNet and U-Net do. The hybrid CNN encoder and decoder are based on the SegNet encoder and decoder, but with characteristics inspired by the U-Net concatenated. The encoder, corresponding decoder in the hybrid CNN (HCNN) are comparable to those in the SegNet encoder and decoder. They have the same number of convolutional layers as the VGG16 network encoder and decoder. Between convolutional2D layers and maxunpooling2D layers, the SegNet is modified with concatenation lines inspired by U-Net. Figure 5. shows the hybrid CNN architecture implemented in this study.
Fig. 5
Hybrid CNN architecture.
The hybrid CNN encoder has 16 convolutional-2D layers with 3x3 filters, batch normalization, ReLu (Rectified Linear Units) activations, and 5 max-pooling layers with 2x2 size and stride value equal to 2. For small spatial shifts, the translation invariance can be achieved with max-pooling operation by downsampling the input by 2. The argmax2D’s max-pooling performs max pooling on the input, returns both maximum values and indices. A batch normalization layer normalizes the output of each convolutional2D layer for each training mini-batch. The function f (x) = max(0, x) is then applied element-by-element by a ReLu layer. The hybrid CNN’s decoder includes 5 maxunpooling2D layers, 13 convolutional 2D-transpose layers with 3x3 filters, batch normalization, and ReLu, a reshape layer to reshape the output into required dimensions, and a softmax layer. The lower resolution feature map obtained from the encoder is scaled up by the decoder to retain the original input resolution feature map. The encoder path is symmetrical in the decoder, except that the max-pooling operation has been replaced by the maxunpooling2D layer operation. The maxunpooling2D layer concatenates previous layer outputs with the indices of the associated max-pooling of the encoder. The HCNN decoder produces a dense feature fed to the softmax layer. This softmax layer classifies each pixel separately, produces N-channels of probabilities for each N number of classes. The class with the highest probability at each pixel corresponds to the expected segmentation.
3.6Grey wolf optimization algorithm
A high-level problem independent meta-heuristic optimization proposed by Mirjalili S et al. [48] and is a Grey wolf optimization (GWO), which is exceptionally competitive compared to other meta-heuristic optimizations. GWO was inspired by the grey wolves social hierarchy and hunting strategy and their social hierarchy in leadership. The Grey wolf is an animal that can run at a speed of 50–60 kilometres/hour, having a lifespan of 6–8 years in the wild. The grey wolf looks like a dog and is related to the Canidae family with the scientific name Canis lupus, which can survive on a variety of different climatic conditions. They live in a highly organized pack (group) of 5–12 members on average, can have the ability to work together in a pack while hunting. In an organized pack of wolves, there will be dominant pack leaders such as dominant wolves. Four different ranks can be assigned to the dominant wolves in a pack such as alpha (α), beta (β), delta (δ), and omega (ω) wolves as shown in Fig. 6.
Fig. 6
Dominant Grey Wolves social hierarchy.
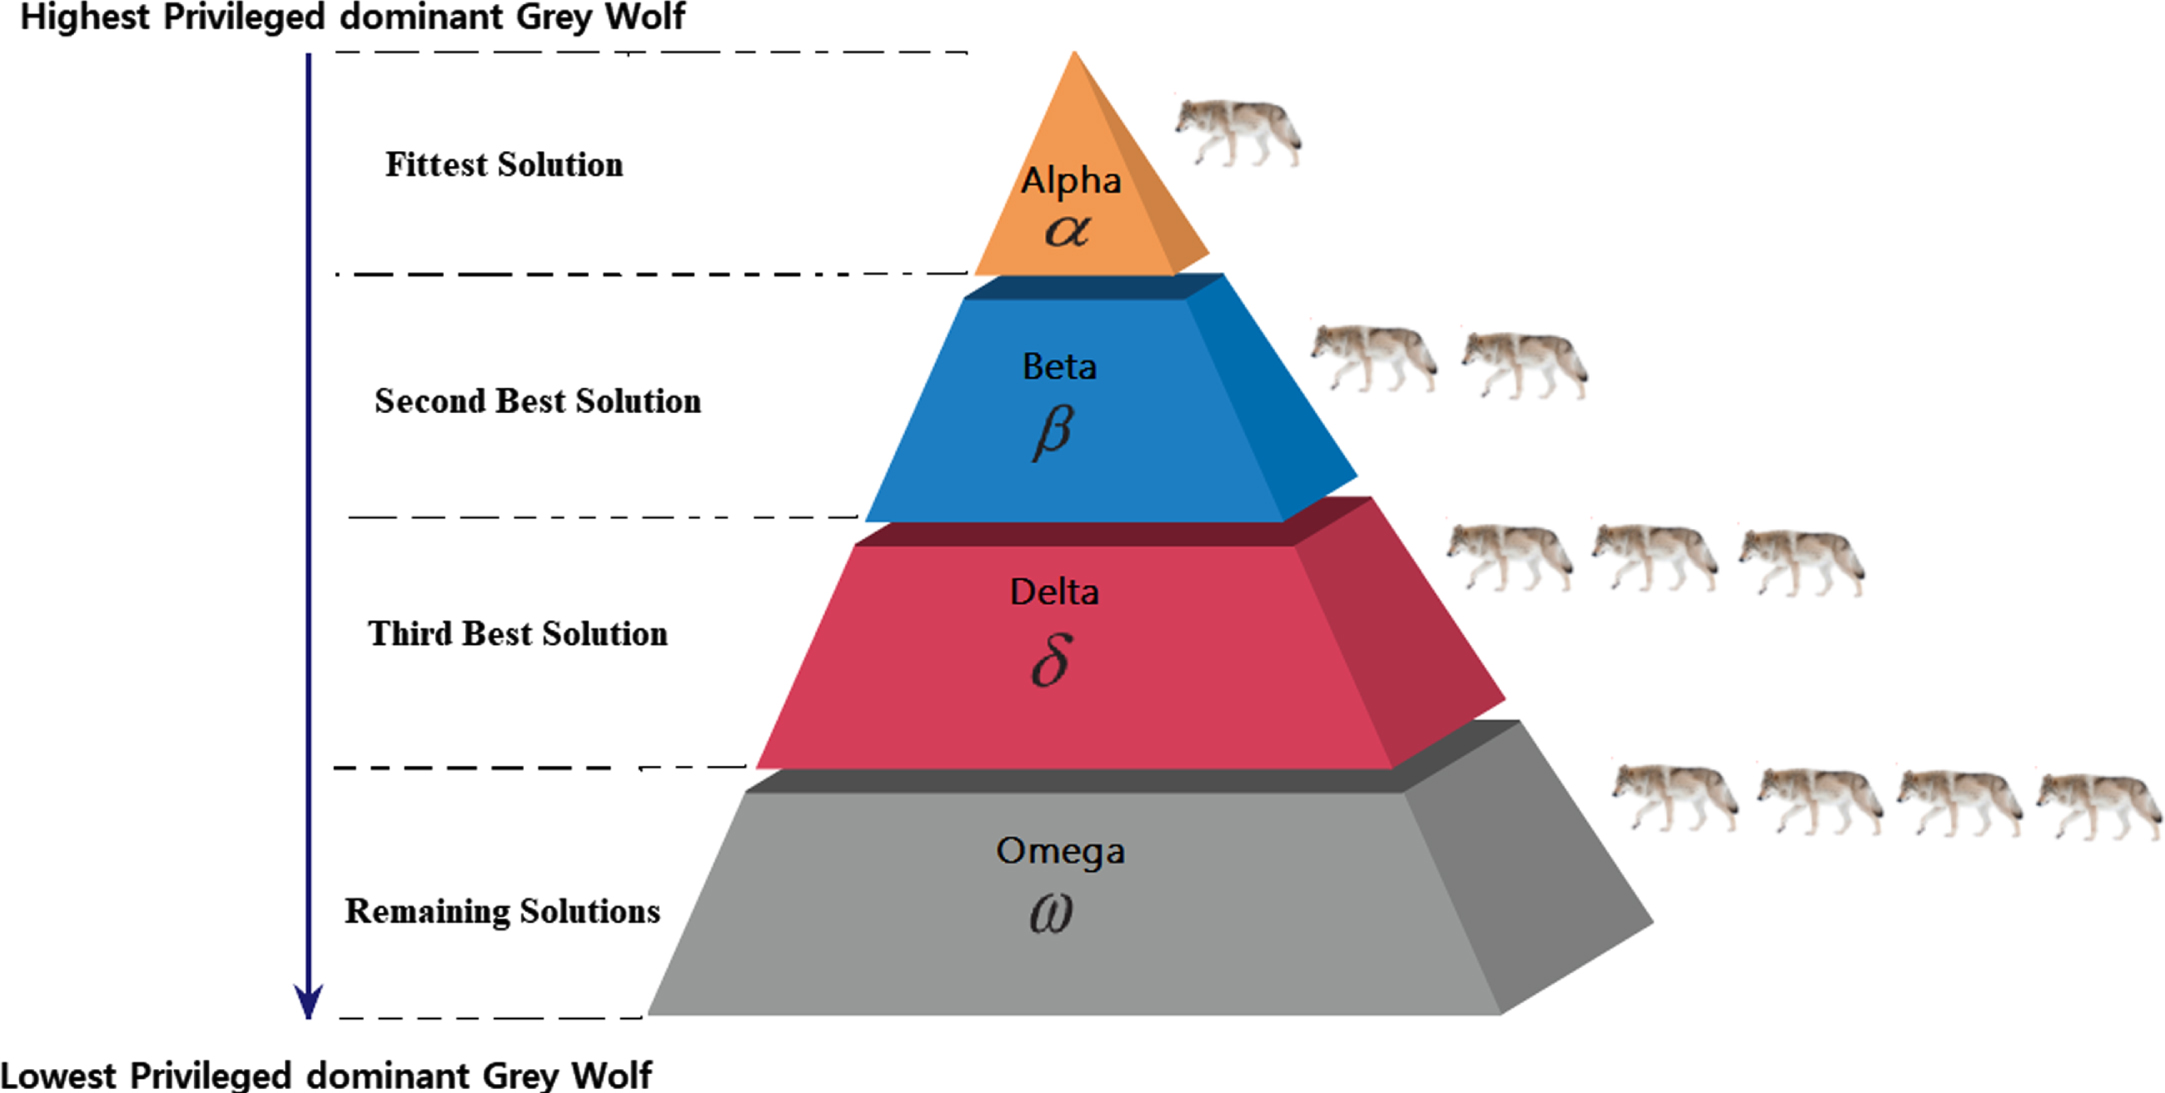
The first level of the hierarchy represents α-wolf which is the dominant one and leader of the pack considered as the fittest solution in the GWO algorithm. The second level of the hierarchy represents β-wolf which helps the α-wolf in making decisions and is considered as the second-best solution in the GWO algorithm. The third level of the hierarchy represents δ-wolf providing the food for the pack and considered as the third best solution. The fourth level of the hierarchy represents ω-wolf which follows α, β, and δ wolves and represents the remaining solutions. The GWO hunting process is directed only by α-wolf, β-wolf, and δ-wolf. The main steps involved in grey wolf hunting are prey searching, pursuing to approach the prey, encircling, and then attacking. During the hunting process, the grey wolves encircle prey to harass until prey stops moving. The grey wolves circling behavior is mathematically represented with the following equations:
(1)
(2)
By altering the values of
(3)
(4)
(5)
(6)
(7)
(8)
(9)
(10)
The position of the grey wolves can be updated with the calculation of the mean value using Equation (11).
(11)
The wolves attack the prey to complete the hunting process when the prey stops moving. Mathematically the attacking phase can be modeled by decreasing
3.7Grey Wolf Optimized SegNet
The SegNet model consisting of an encoder-decoder network with a pixel-wise classification performs semantic segmentation of CXR COVID-19 images, making the SegNet trainable segmentation engine. There are 13 convolutional-2D layers, 5 max pooling 2D layers, 5 upsampling 2D layers, and 13 convolutional 2D-transpose layers in the encoder and decoder of SegNet and are tuned using an iterative method like gradient descent (GD) training algorithm. Many hyperparameters should be included in the training procedure, such as learning rate, batch size, L2-Regularization, momentum, number of epochs, and frequency of validation, as they strongly reflect the performance of the SegNet model. The grey wolf optimization technique improves segmentation accuracy by optimizing the hyperparameters needed to train the SegNet. Although hyperparameters are critical for greater performance, testing each one is time-consuming. As a result, in this SegNet architecture, GWO is proposed for optimizing the hyperparameters needed to train the SegNet layers. The process flow for optimizing the SegNet with grey wolf optimization for COVID-19 detection is shown in Fig. 7.
Fig. 7
Process flow for optimizing the SegNet with grey wolf optimization for COVID-19 detection.
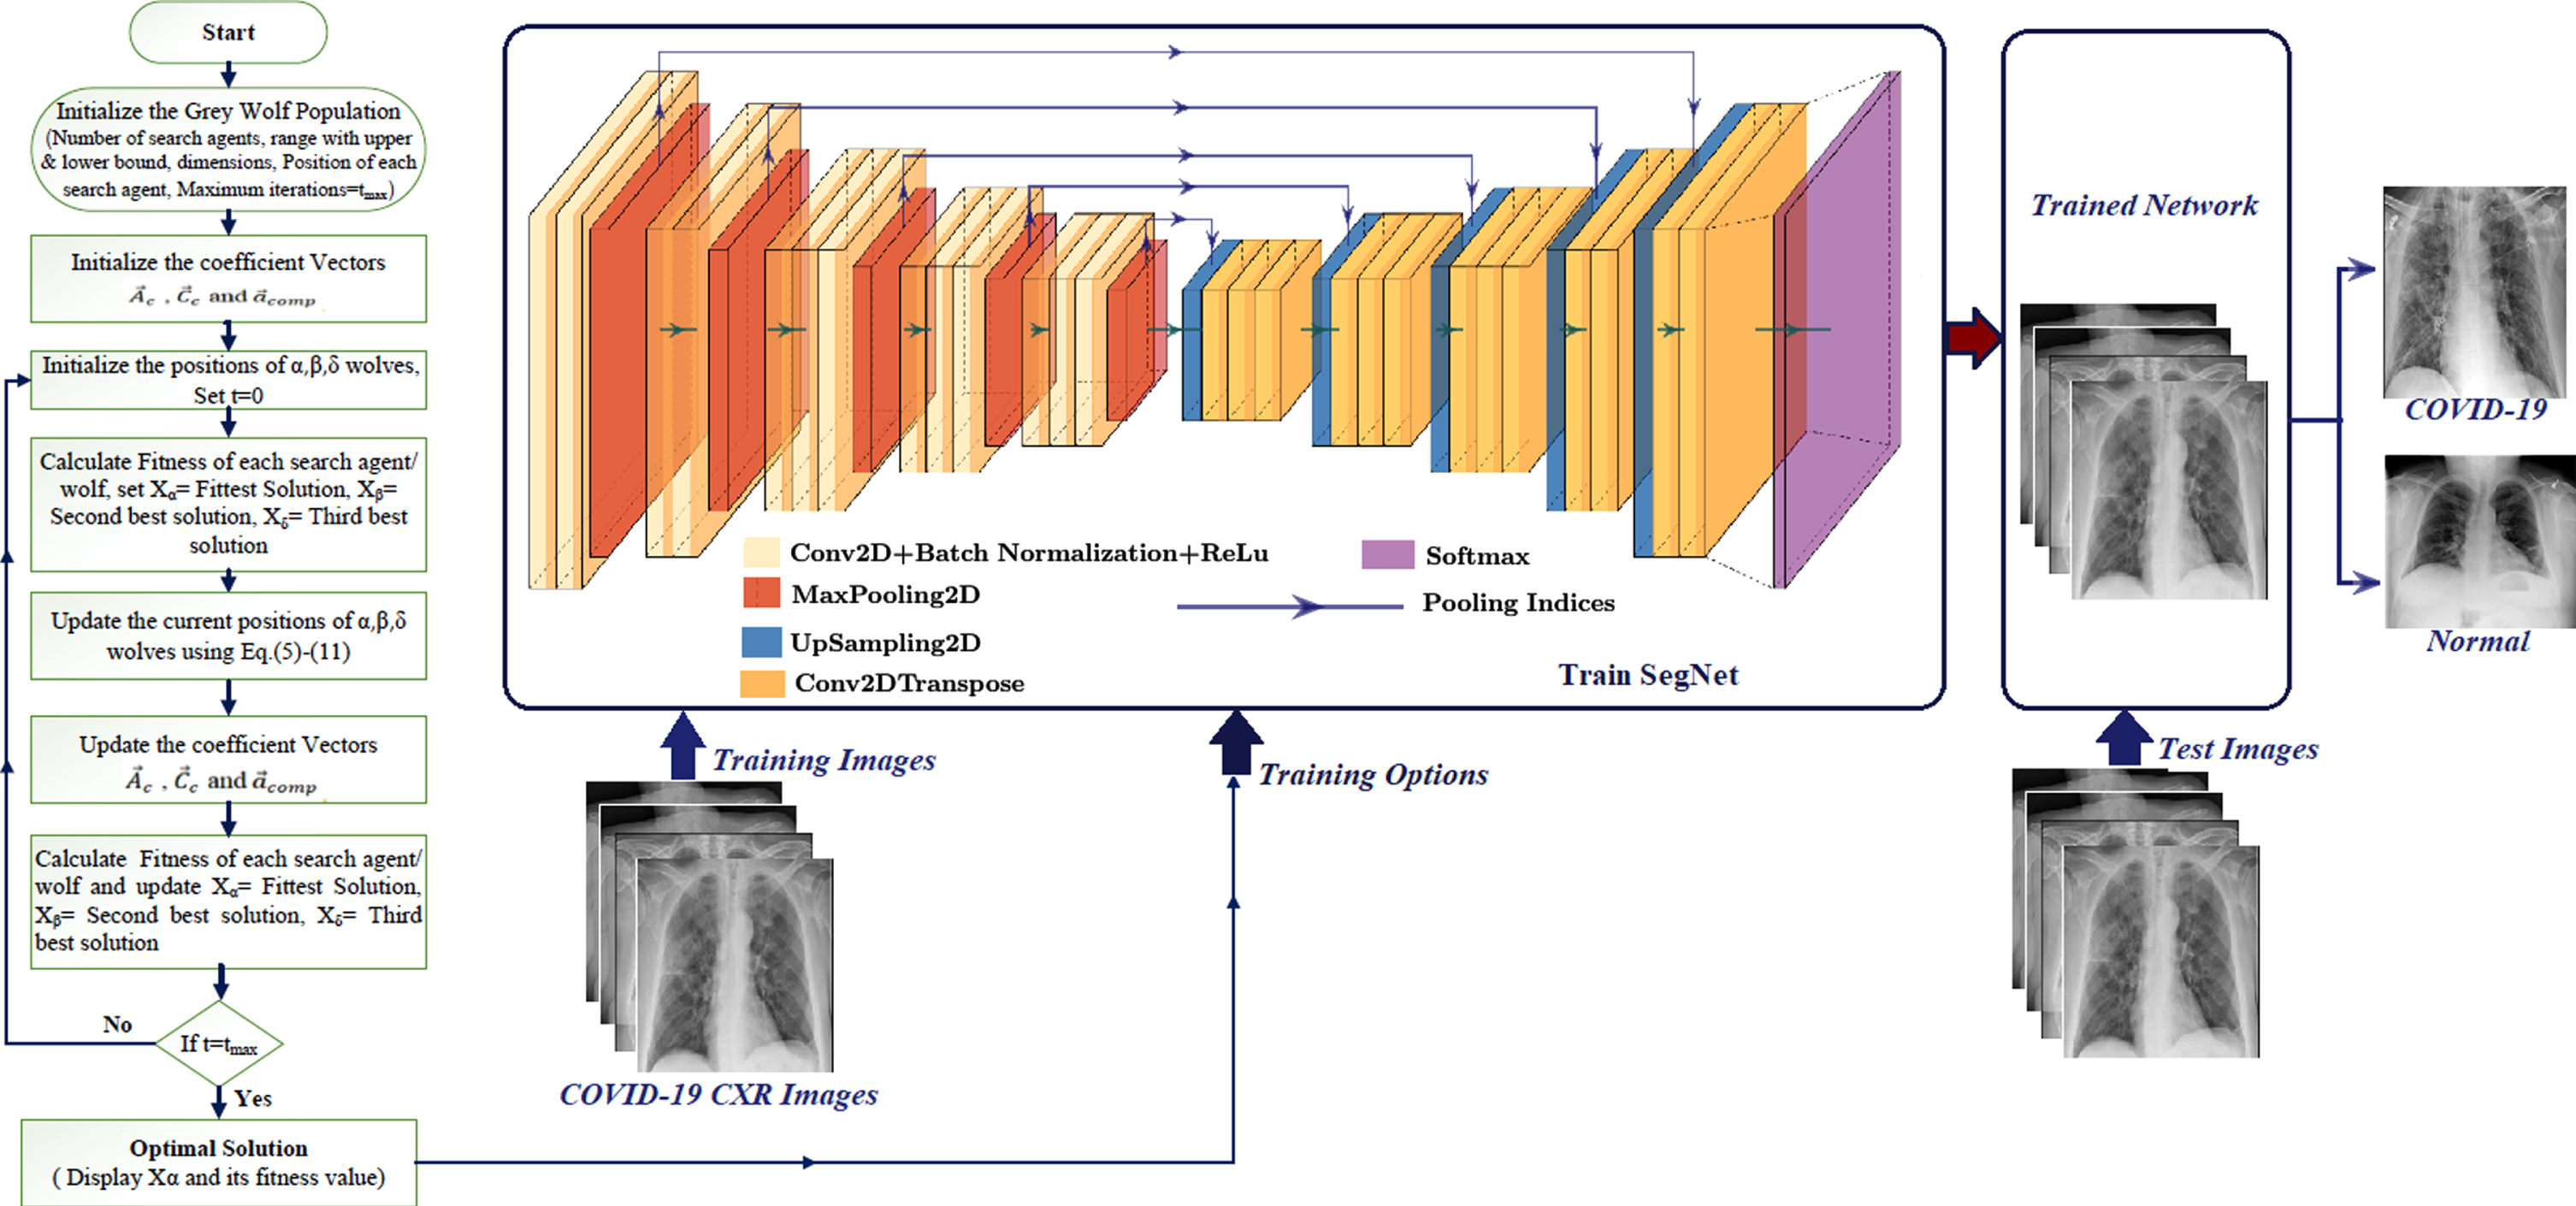
The SegNet model is trained with COVID-19 CXR images using different training options obtained by the GWO algorithm, and the COVID-19 infected region is segmented using related ground truth images. CXR images are then tested for COVID-19 or normal prediction using the trained network.
3.8Grey wolf optimized U-Net
The U-Net for semantic segmentation has an encoder, corresponding decoder along with a softmax classifier. It can also be used to perform semantic segmentation of COVID-19 CXR images, making the U-Net trainable segmentation engine. The encoder and decoder of U-Net have 19 convolutional-2D layers, 4 max pooling 2D layers, and 4 convolutional 2D-transpose layers, all of which should be tuned using an iterative method like gradient descent (GD) training algorithm. Many hyperparameters should be included in the training procedure, such as learning rate, batch size, L2-regularization, momentum, number of epochs, and frequency of validation, as they strongly reflect the performance of the U-Net model. The grey wolf optimization technique improves segmentation accuracy by optimizing the hyperparameters required to train the U-Net. Although hyperparameters are essential for greater performance, testing each one is time-consuming. As a result, GWO is recommended in combination with this U-Net to train its layers using optimized hyperparameters. The process flow for optimizing the U-Net with grey wolf optimization for COVID-19 detection is shown in Fig. 8.
Fig. 8
Process flow for optimizing the U-Net with grey wolf optimization for COVID-19 detection.
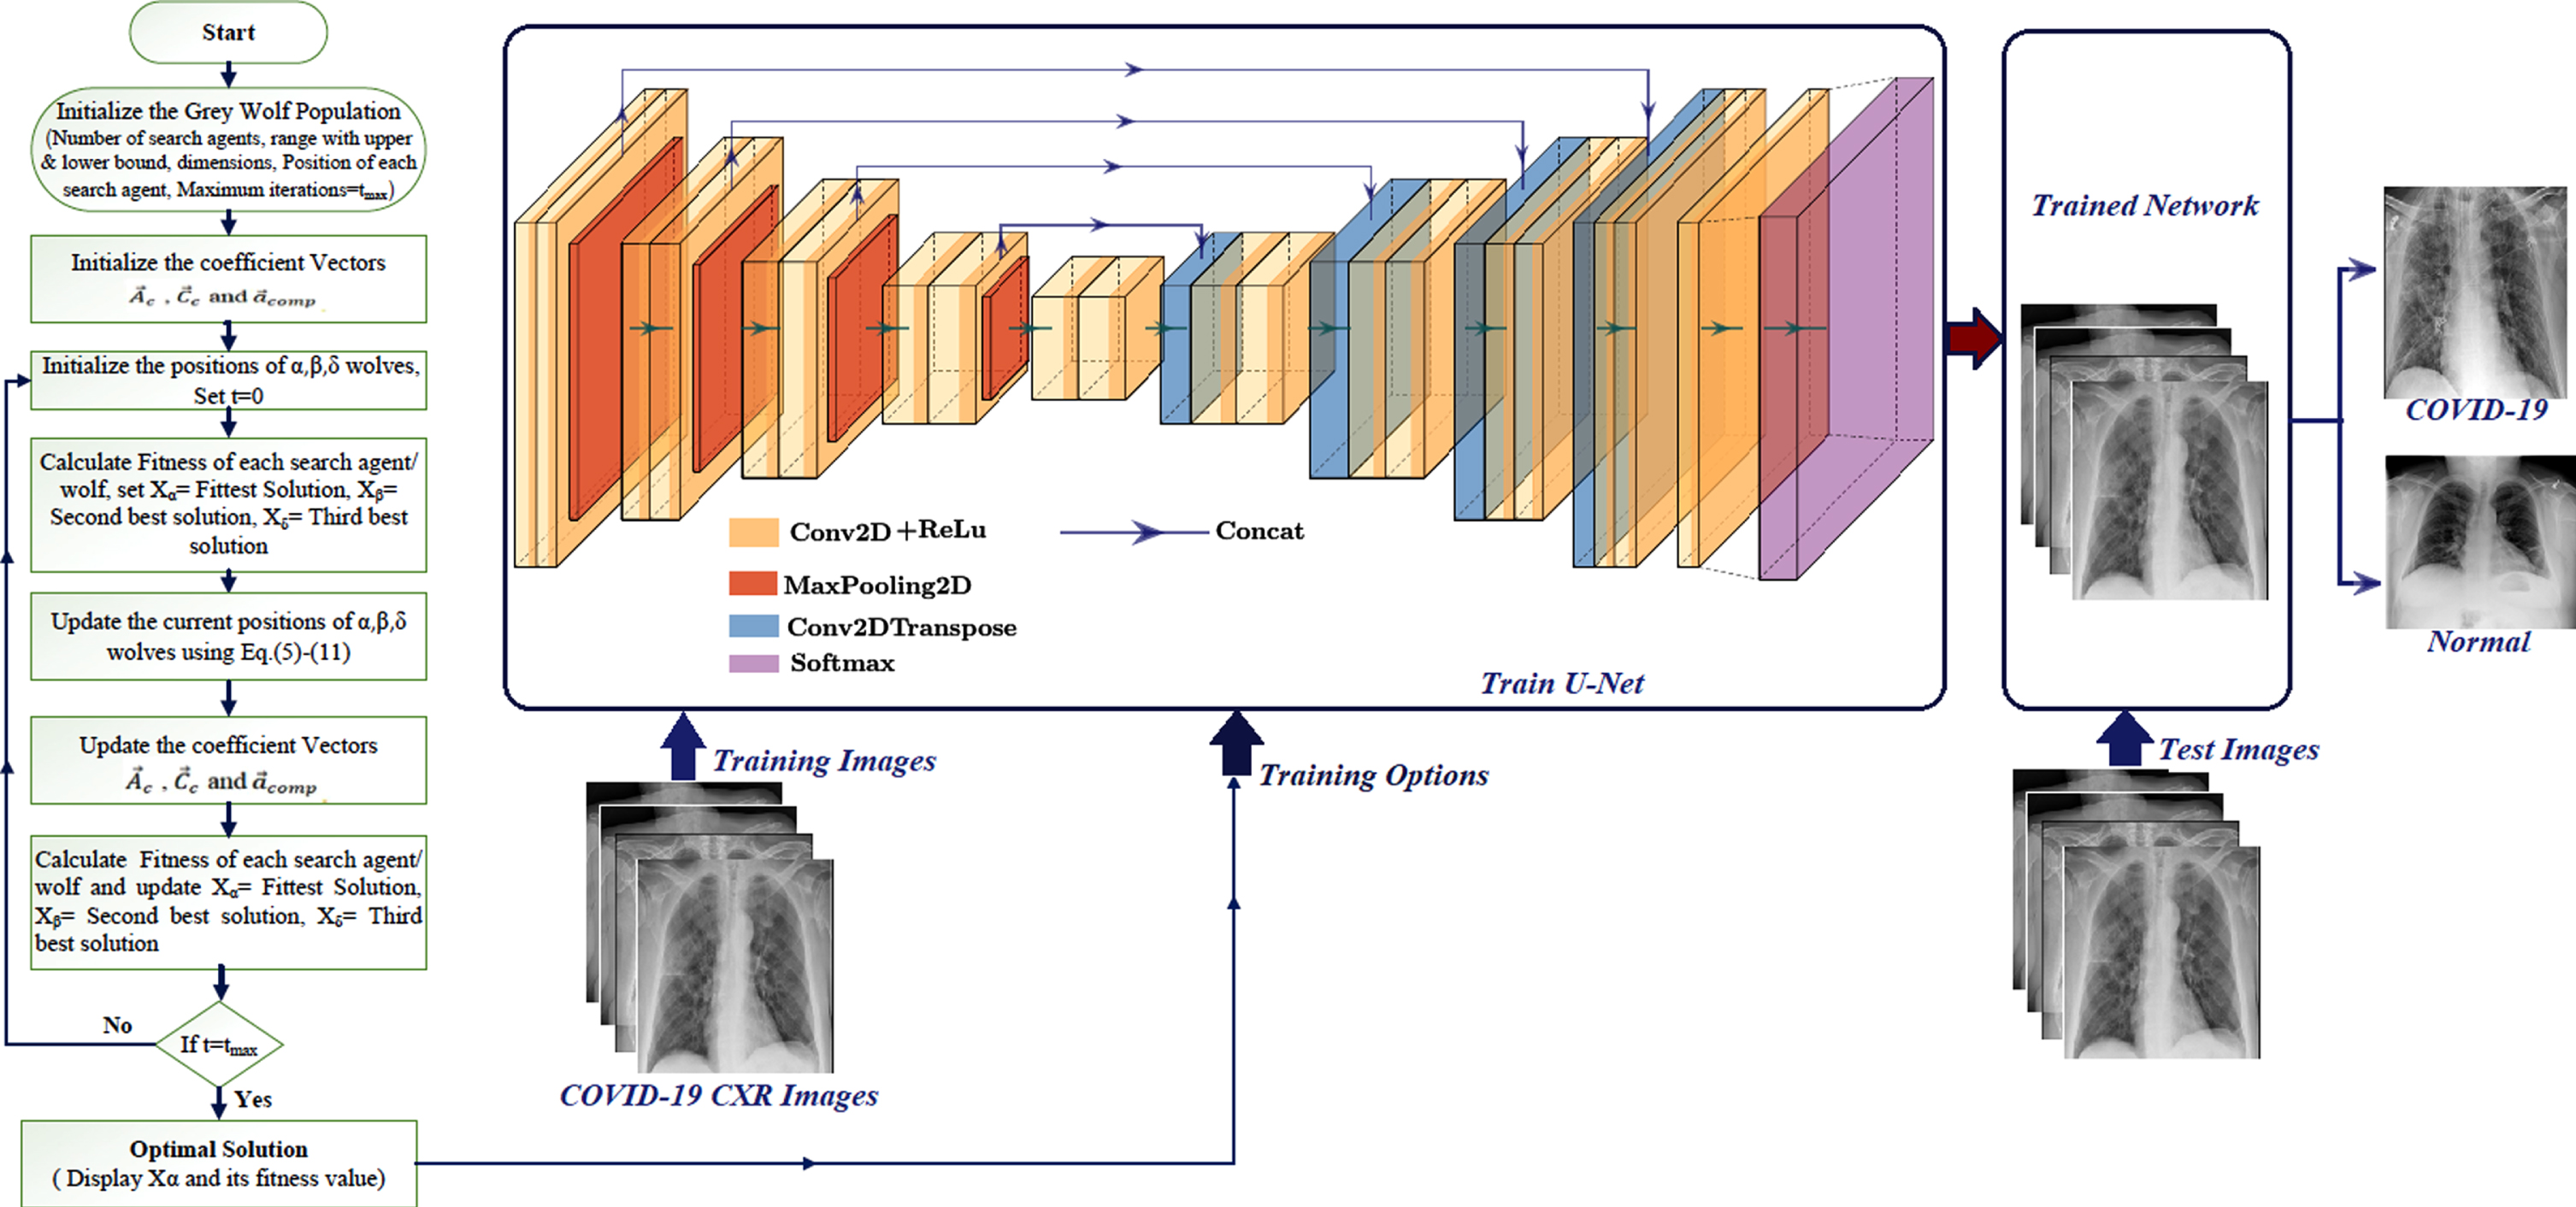
The U-Net model is trained with COVID-19 CXR images using different training options obtained by the GWO algorithm, and the COVID-19 infected region is segmented using related ground truth images. The CXR images are then tested for COVID-19 or normal prediction using the trained network.
3.9Grey wolf optimized hybrid CNN
The hybrid CNN model contains an encoder-decoder network with a softmax classifier for pixel by pixel classification. It can also be used to perform semantic segmentation of COVID-19 CXR images, making the hybrid CNN trainable segmentation engine. The encoder and decoder of hybrid CNN include 16 convolutional-2D layers, 5 max-pooling layers with argmax 2D layers, 5 maxunpooling 2D layers, 13 convolutional 2D-transpose layers, and a reshape layer with various weights. These weights should be tuned using an iterative method like gradient descent (GD) training algorithm. Many hyperparameters should be included in the training process, as they strongly reflect the performance of the hybrid CNN model. The learning rate, batch size, L2-regularization, momentum, number of epochs, and frequency of validation are the parameters in consideration. The grey wolf optimization technique improves segmentation accuracy by optimizing the hyperparameters needed to train the Hybrid CNN. Although hyperparameters are essential for greater performance, testing each one is time-consuming. As a result, in this hybrid CNN architecture, GWO is proposed for optimizing the hyperparameters needed to train the hybrid CNN layers. The process flow for optimizing the hybrid CNN with Grey wolf optimization for COVID-19 detection is shown in Fig. 9.
Fig. 9
Process flow for optimizing the hybrid CNN with grey wolf optimization for COVID-19 detection.
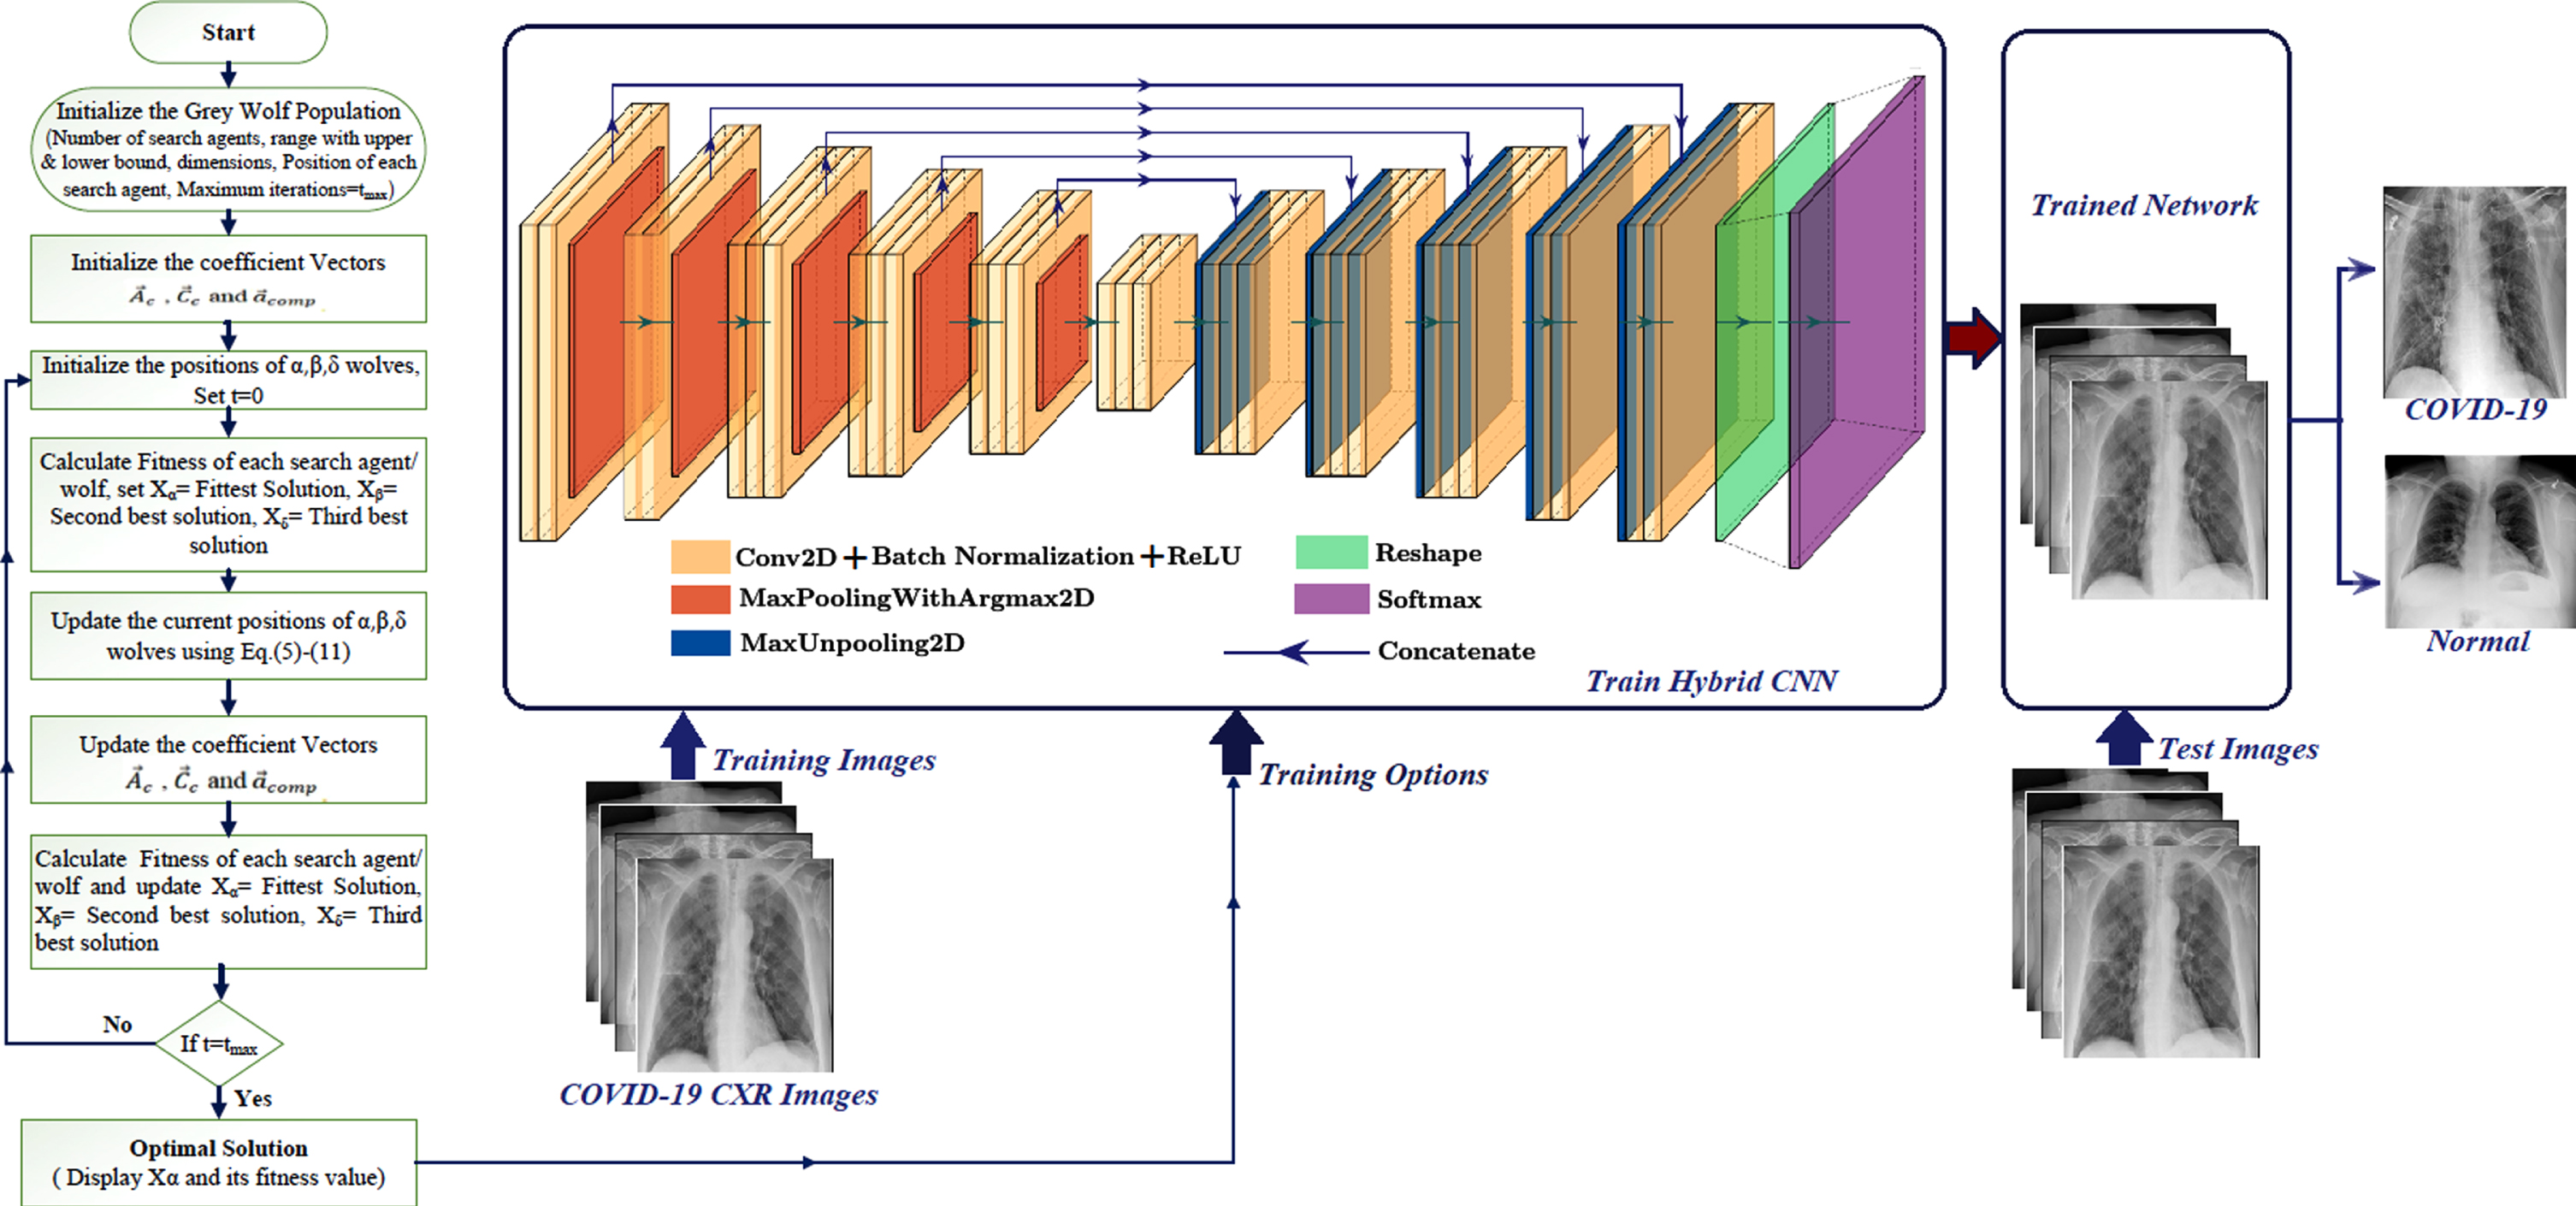
The hybrid CNN model is trained with COVID-19 CXR images using different training options obtained by the GWO algorithm, and the COVID-19 infected region is segmented using related ground truth images. CXR images are then tested for COVID-19 or normal prediction using the trained network.
4Experiments
The COVID-19 and normal CXR images tests were conducted using three structurally different DL networks such as SegNet, U-Net, and hybrid CNN with SegNet plus U-Net. The performance of each network on CXR images semantic segmentation for COVID-19 is evaluated to know the ability of segmentation. Further, each of these networks is optimized by the GWO algorithm to obtain better accuracy in segmentation. Then, the performance of the proposed optimized CXR image semantic segmentation networks for COVID-19 is evaluated to know the ability of segmentation. The experimental works of the proposed networks are implemented in Python 3.7 with the Tensorflow 2.0 deep learning framework on graphics processing unit (GPU) machine having 64GB RAM Nvidia and 20H2 version of windows-10 pro edition.
4.1Training Strategy
As specified in section.3.1, training is performed on 2,174 CXR images of COVID-19 with their ground-truth masks from the QaTa-COV19 dataset in the kaggle public repository, and the testing is carried out on the 398 CXR images of COVID-19. The dataset contains 2,572 COVID-19 CXR images, which include 2,174 training images and 398 testing images. The training is carried on proposed DL networks and their optimized networks to perform semantic segmentation of COVID-19 CXR images. The input images are resized into 256x256 by keeping time for training and storage in mind. All hyperparameters to the proposed DL networks are trained with a stochastic gradient descent-based optimizer called ADAM (Adaptive moment estimation), the learning rate is set at 10-4 [49]. All the hyperparameters used during the training are optimized with GWO. The epochs of 20, 20, and 80 are used in SegNet, U-Net and hybrid CNN, respectively. The momentum, L2Regularization, and batch size are 0.9, 10-4, and 16 respectively in all the networks proposed. In GWO, the maximum iterations are set at 1000, the number of search agents at 5, dimensions at 30, upper bound at 100, and lower bound at 100. The loss is calculated using the softmax cross-entropy with logits, and it evaluates how well a classification model performs when a probability value between 0 and 1 is given in Equation (12).
(12)
Where L
γ is the loss function, Ki and Nc are the number of instances and classes respectively,
4.2Testing strategy
The testing is carried out on the 398 CXR images of COVID-19 taken from the QaTa-COV19 dataset as described in the training strategy. Before testing, all the testing images are resized into 256x256 images. All the proposed trained DL networks are tested for COVID-19 detection with semantic segmentation. Further, the proposed GWO optimized DL networks are tested on the same testing images for better accuracy than the previous testing in the detection of COVID-19 using CXR images semantic segmentation.
4.3Performance evaluation criteria
The performance of proposed DL and GWO optimized DL networks is evaluated with five well-known classification metrics namely, accuracy, sensitivity, specificity, precision, and F1 - score. In all the metrics, TP and FP are true and false positives values respectively, TN and FN are true and false negative values respectively are used. These five well-known classification metrics are evaluated to quantify the performance of proposed DL networks. The correctness of the DL networks proposed can be measured by accuracy. This evaluation metric can be calculated using Equation (13) given below:
(13)
The ability of a proposed DL network to label an individual with the disease as correct positive is measured by sensitivity. This evaluation metric can be calculated using Equation (14) given below:
(14)
The specificity pertains to a proposed DL network’s ability to label an individual with the disease as negative. This evaluation metric can be calculated using Equation (15) given below:
(15)
Dividing the number of correct positive predictions with the total number of positive predictions yields precision. It pertains to a proposed DL network’s capacity to label an individual with the disease as positive. This evaluation metric can be calculated using Equation (16) given below:
(16)
The proposed DL networks’ correctness in testing can be evaluated using the F1-score and is the harmonic mean between precision and sensitivity metrics. This evaluation metric can be calculated using Equation (17) given below:
(17)
5Results
The experimental results for proposed DL networks such as hybrid CNN, U-Net, and SegNet are provided first in this section. Then, both numerical and qualitative visual results have been presented with an extensive set of comparative evaluations between input COVID-19 CXRs, ground-truth images, and segmentation outputs corresponding to the inputs. After that, the experimental results for proposed GWO optimized DL networks such as GWO hybrid CNN (GWO-HCNN), GWO U-Net, and GWO SegNet are provided. Then, again, numerical and qualitative visual results have been presented for the proposed optimized DL networks, are evaluated numerically and qualitatively with an extensive set of comparative evaluations between input COVID-19 CXRs, ground-truth images, and segmented outputs corresponding to the inputs. Further in this section, a comparative analysis of various other networks which use CXR and CT images in early detection of COVID-19 is provided to know the superior performance of the proposed networks of this work.
The quantitative evaluations of the proposed DL networks for infected region segmentation in COVID-19 CXR images are performed at the pixel level. The infected region in white color indicates the positive COVID-19 class, and the rest of the region in black color represents the negative class. There is only one binary class with either black or white color in the segmented images. The performance is calculated per CXR sample, with COVID-19 as only class, and the control group is considered normal while segmenting. A labeled COVID-19 CXR image and its associated labeled ground-truth CXR image are used to train all the proposed networks. For semantically segmenting COVID-19 infected lung lobes in CXR images for COVID-19 early detection, three structurally different deep learning (DL) networks such as hybrid CNN, U-Net, and SegNet have experimented. The performance evaluation metrics corresponding to each proposed network before GWO optimization are given in Table 1.
Table 1
Performance evaluation metrics for proposed DL Networks
| Proposed | Evaluation Metrics (%) | ||||
| Networks | Accuracy | Sensitivity | Specificity | Precision | F1-Score |
| Hybrid CNN | 89.92 | 94.13 | 96.30 | 92.62 | 91.56 |
| U-Net | 91.04 | 91.02 | 100 | 100 | 95.30 |
| SegNet | 93.85 | 98.02 | 88.84 | 91.33 | 94.56 |
The statistical data analysis results listed in Table 1 shows a small difference in the performance between U-Net and SegNet compared to the hybrid CNN. The COVID-19 infected regions in CXR images are segmented with an accuracy of 93.85% by SegNet compared with U-Net and hybrid CNN. The superiority of the SegNet DL network presented in this work can also be understood with qualitative visual results of the proposed DL networks such as hybrid CNN, U-Net, and SegNet shown in Fig. 10.
Fig. 10
Qualitative visual results: (a) Coloumn-1: input COVID-19 CXR images (b) Coloumn-2: Ground truth images (c) Coloumn-3: Hybrid CNN segmentation (d) Coloumn-4: U-Net segmentation (e) Coloumn-5: SegNet segmentation.
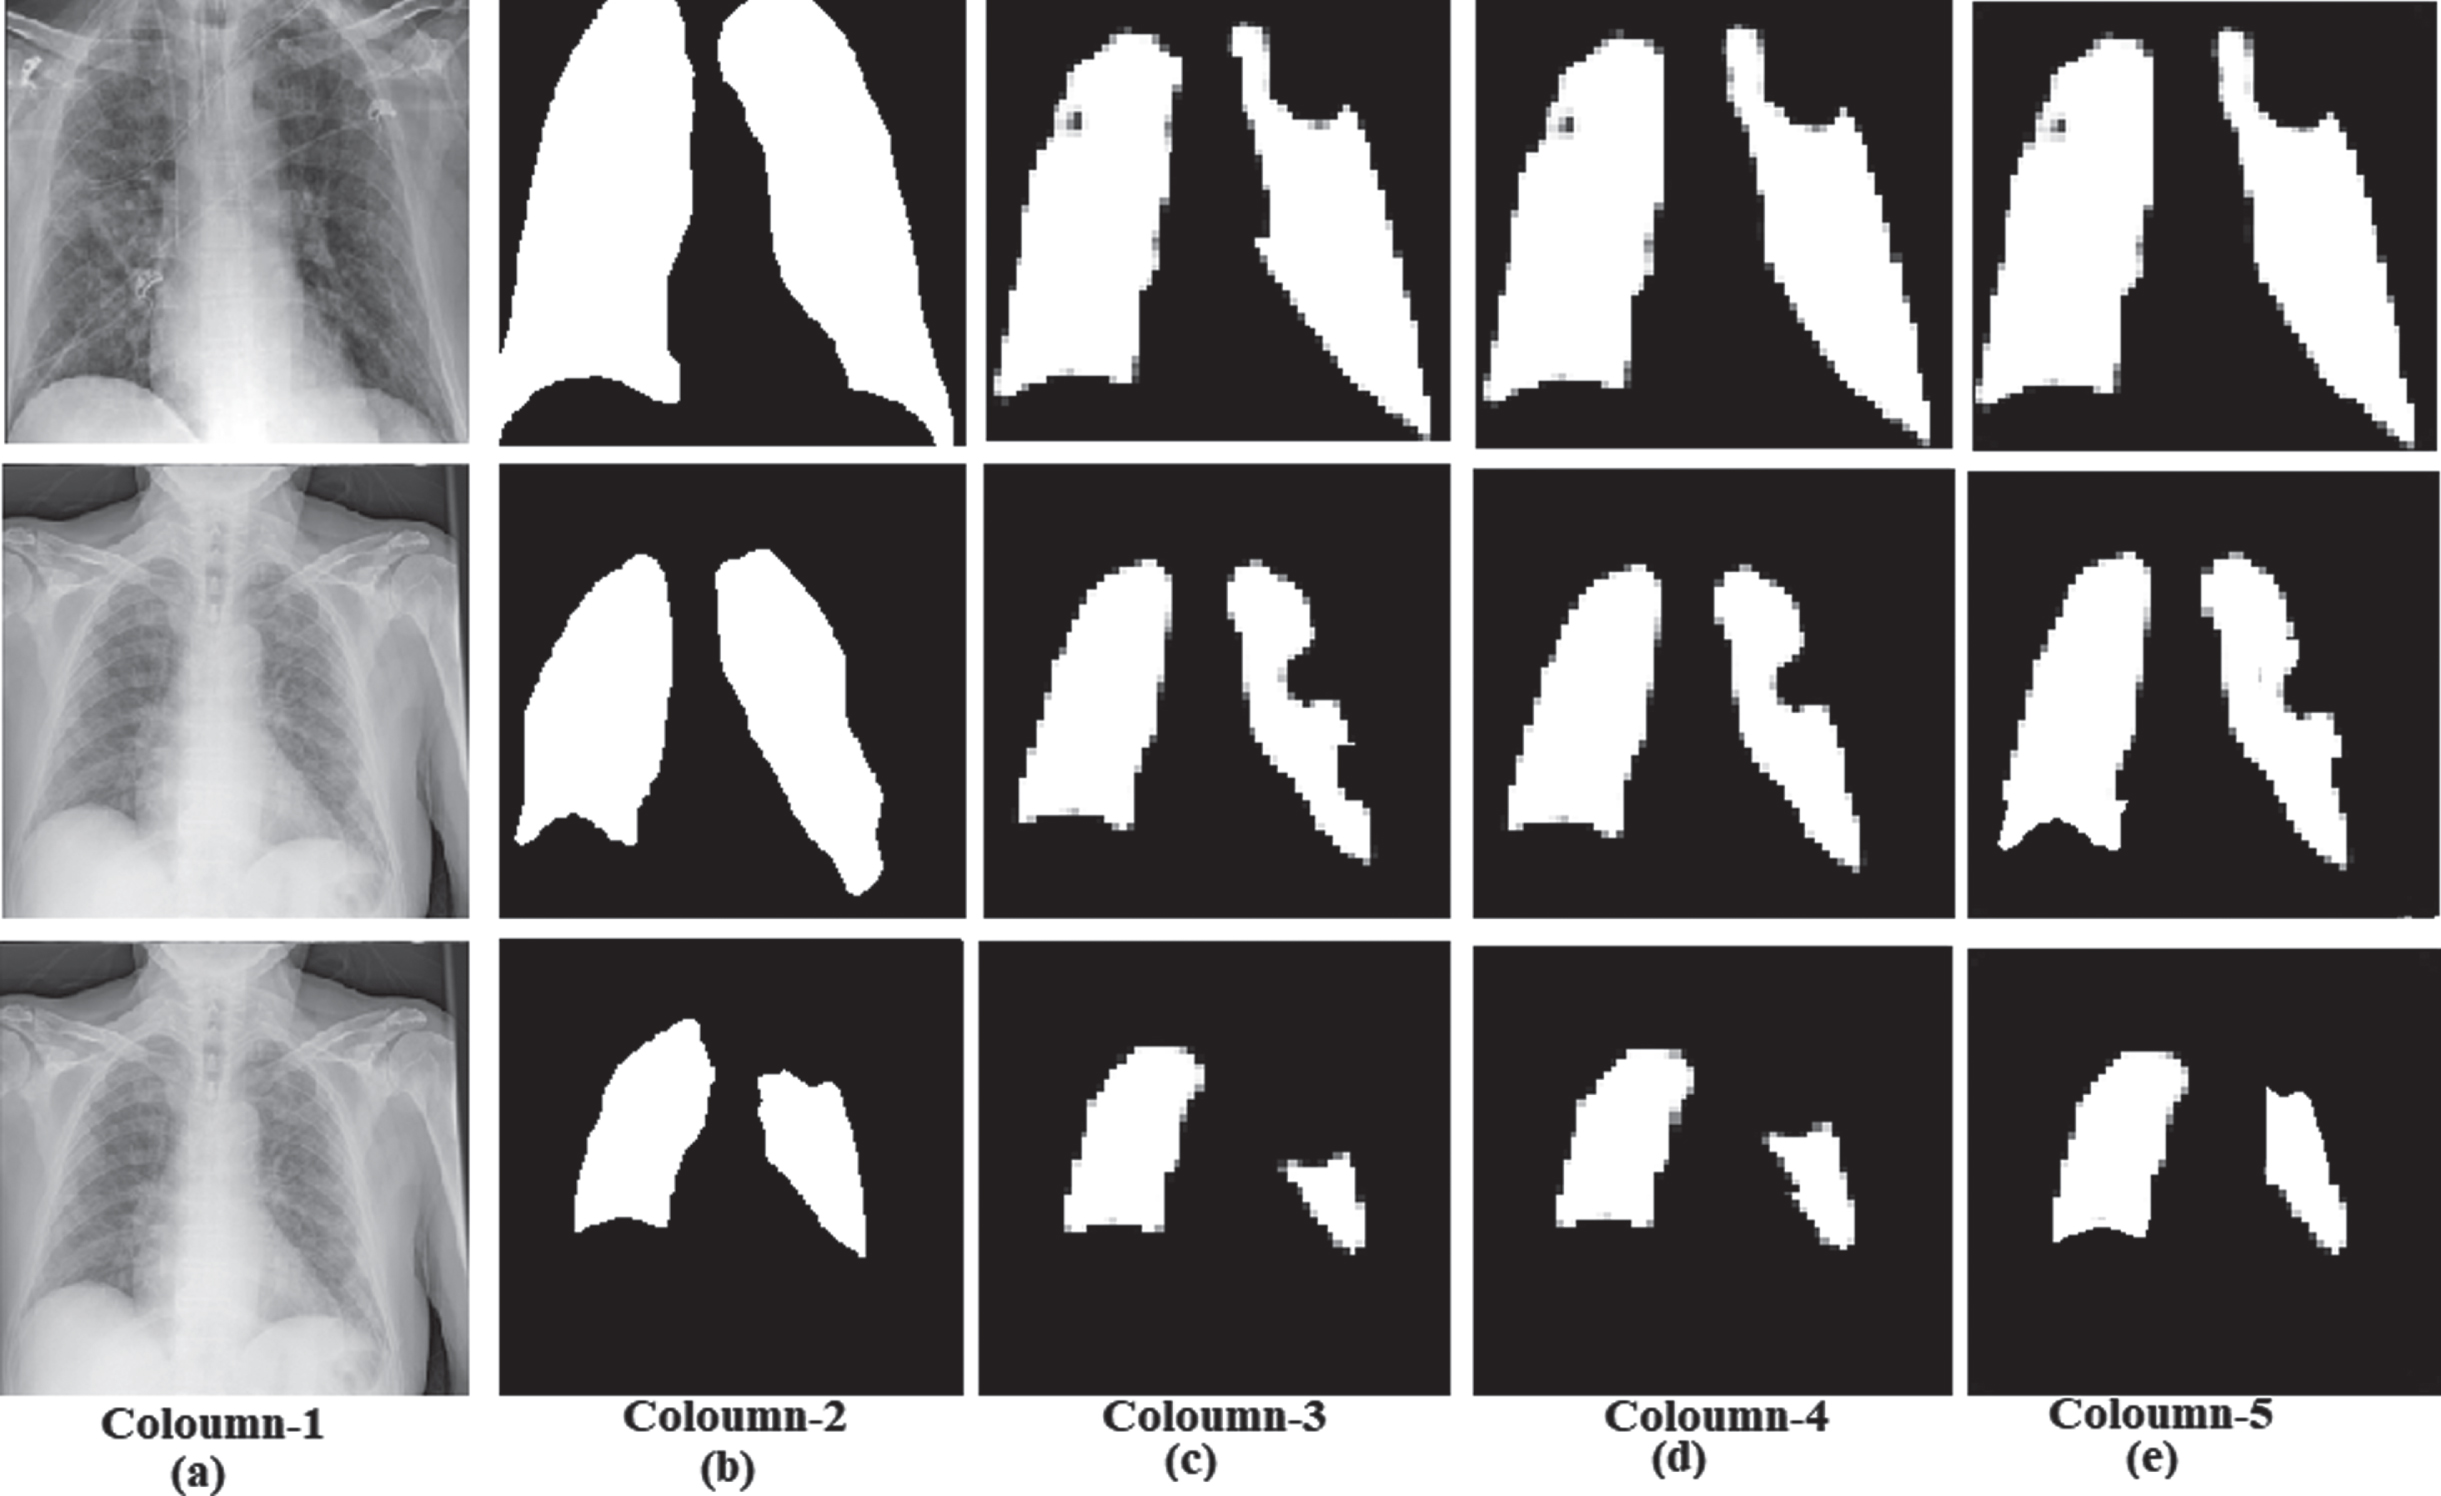
The above qualitative visual result shows the superiority of the SegNet DL network semantic segmentation of chest X-ray images for COVID-19. The segmentation output of the SegNet is close to the ground truth segmentation output. The considerable loss is recorded in other models while performing the semantic segmentation.
The proposed hybrid CNN, U-Net, and SegNet DL networks have more layers in their architectures require more hyperparameters to be tuned during the training process. The optimization of these parameters during the training improves the accuracy of the proposed DL networks. For this purpose, we used a grey wolf optimization technique in each of the proposed DL networks. The GWO algorithm updates and evaluates optimal solutions till the end condition is satisfied. These optimal solutions are the training options used in the proposed DL networks to train hyperparameters in layers. It delivers the best solution for segmenting supplied input CXR images of COVID-19. For semantically segmenting COVID-19 infected lung lobes in CXR images, proposed DL networks such as hybrid CNN, U-Net, and SegNet are optimized with the GWO algorithm. The performance evaluation metrics corresponding to each proposed optimized network with GWO optimization are presented in Table 2.
Table 2
Performance evaluation metrics for GWO based proposed DL Networks
| Proposed Optimized | Evaluation Metrics (%) | ||||
| Networks | Accuracy | Sensitivity | Specificity | Precision | F1-Score |
| GWO-Hybrid CNN | 92.36 | 96.52 | 98.87 | 95.31 | 94.87 |
| GWO-U-Net | 95.63 | 95.62 | 100 | 100 | 97.06 |
| GWO-SegNet | 98.08 | 94.87 | 99.75 | 99.51 | 97.13 |
Table 2 also shows a small difference in the performance between GWO-U-net and GWO-SegNet compared to the GWO-hybrid CNN. The COVID-19 infected regions in CXR images are segmented with an accuracy of 98.08% by GWO-SegNet compared with GWO-U-Net and GWO-hybrid CNN (GWO-HCNN). The superiority of the GWO-SegNet DL network presented in this work can also be understood with qualitative visual results of the proposed optimized DL networks such as GWO-hybrid CNN, GWO-U-Net, and GWO-SegNet shown in Fig. 11.
Fig. 11
Qualitative visual results: (a) Coloumn-1: Input COVID-19 CXR images (b) Coloumn-2: Ground truth images (c) Coloumn-3: GWO-hybrid CNN segmentation (d) Coloumn-4: GWO-U-Net segmentation (e) Coloumn-5: GWO-SegNet segmentation.
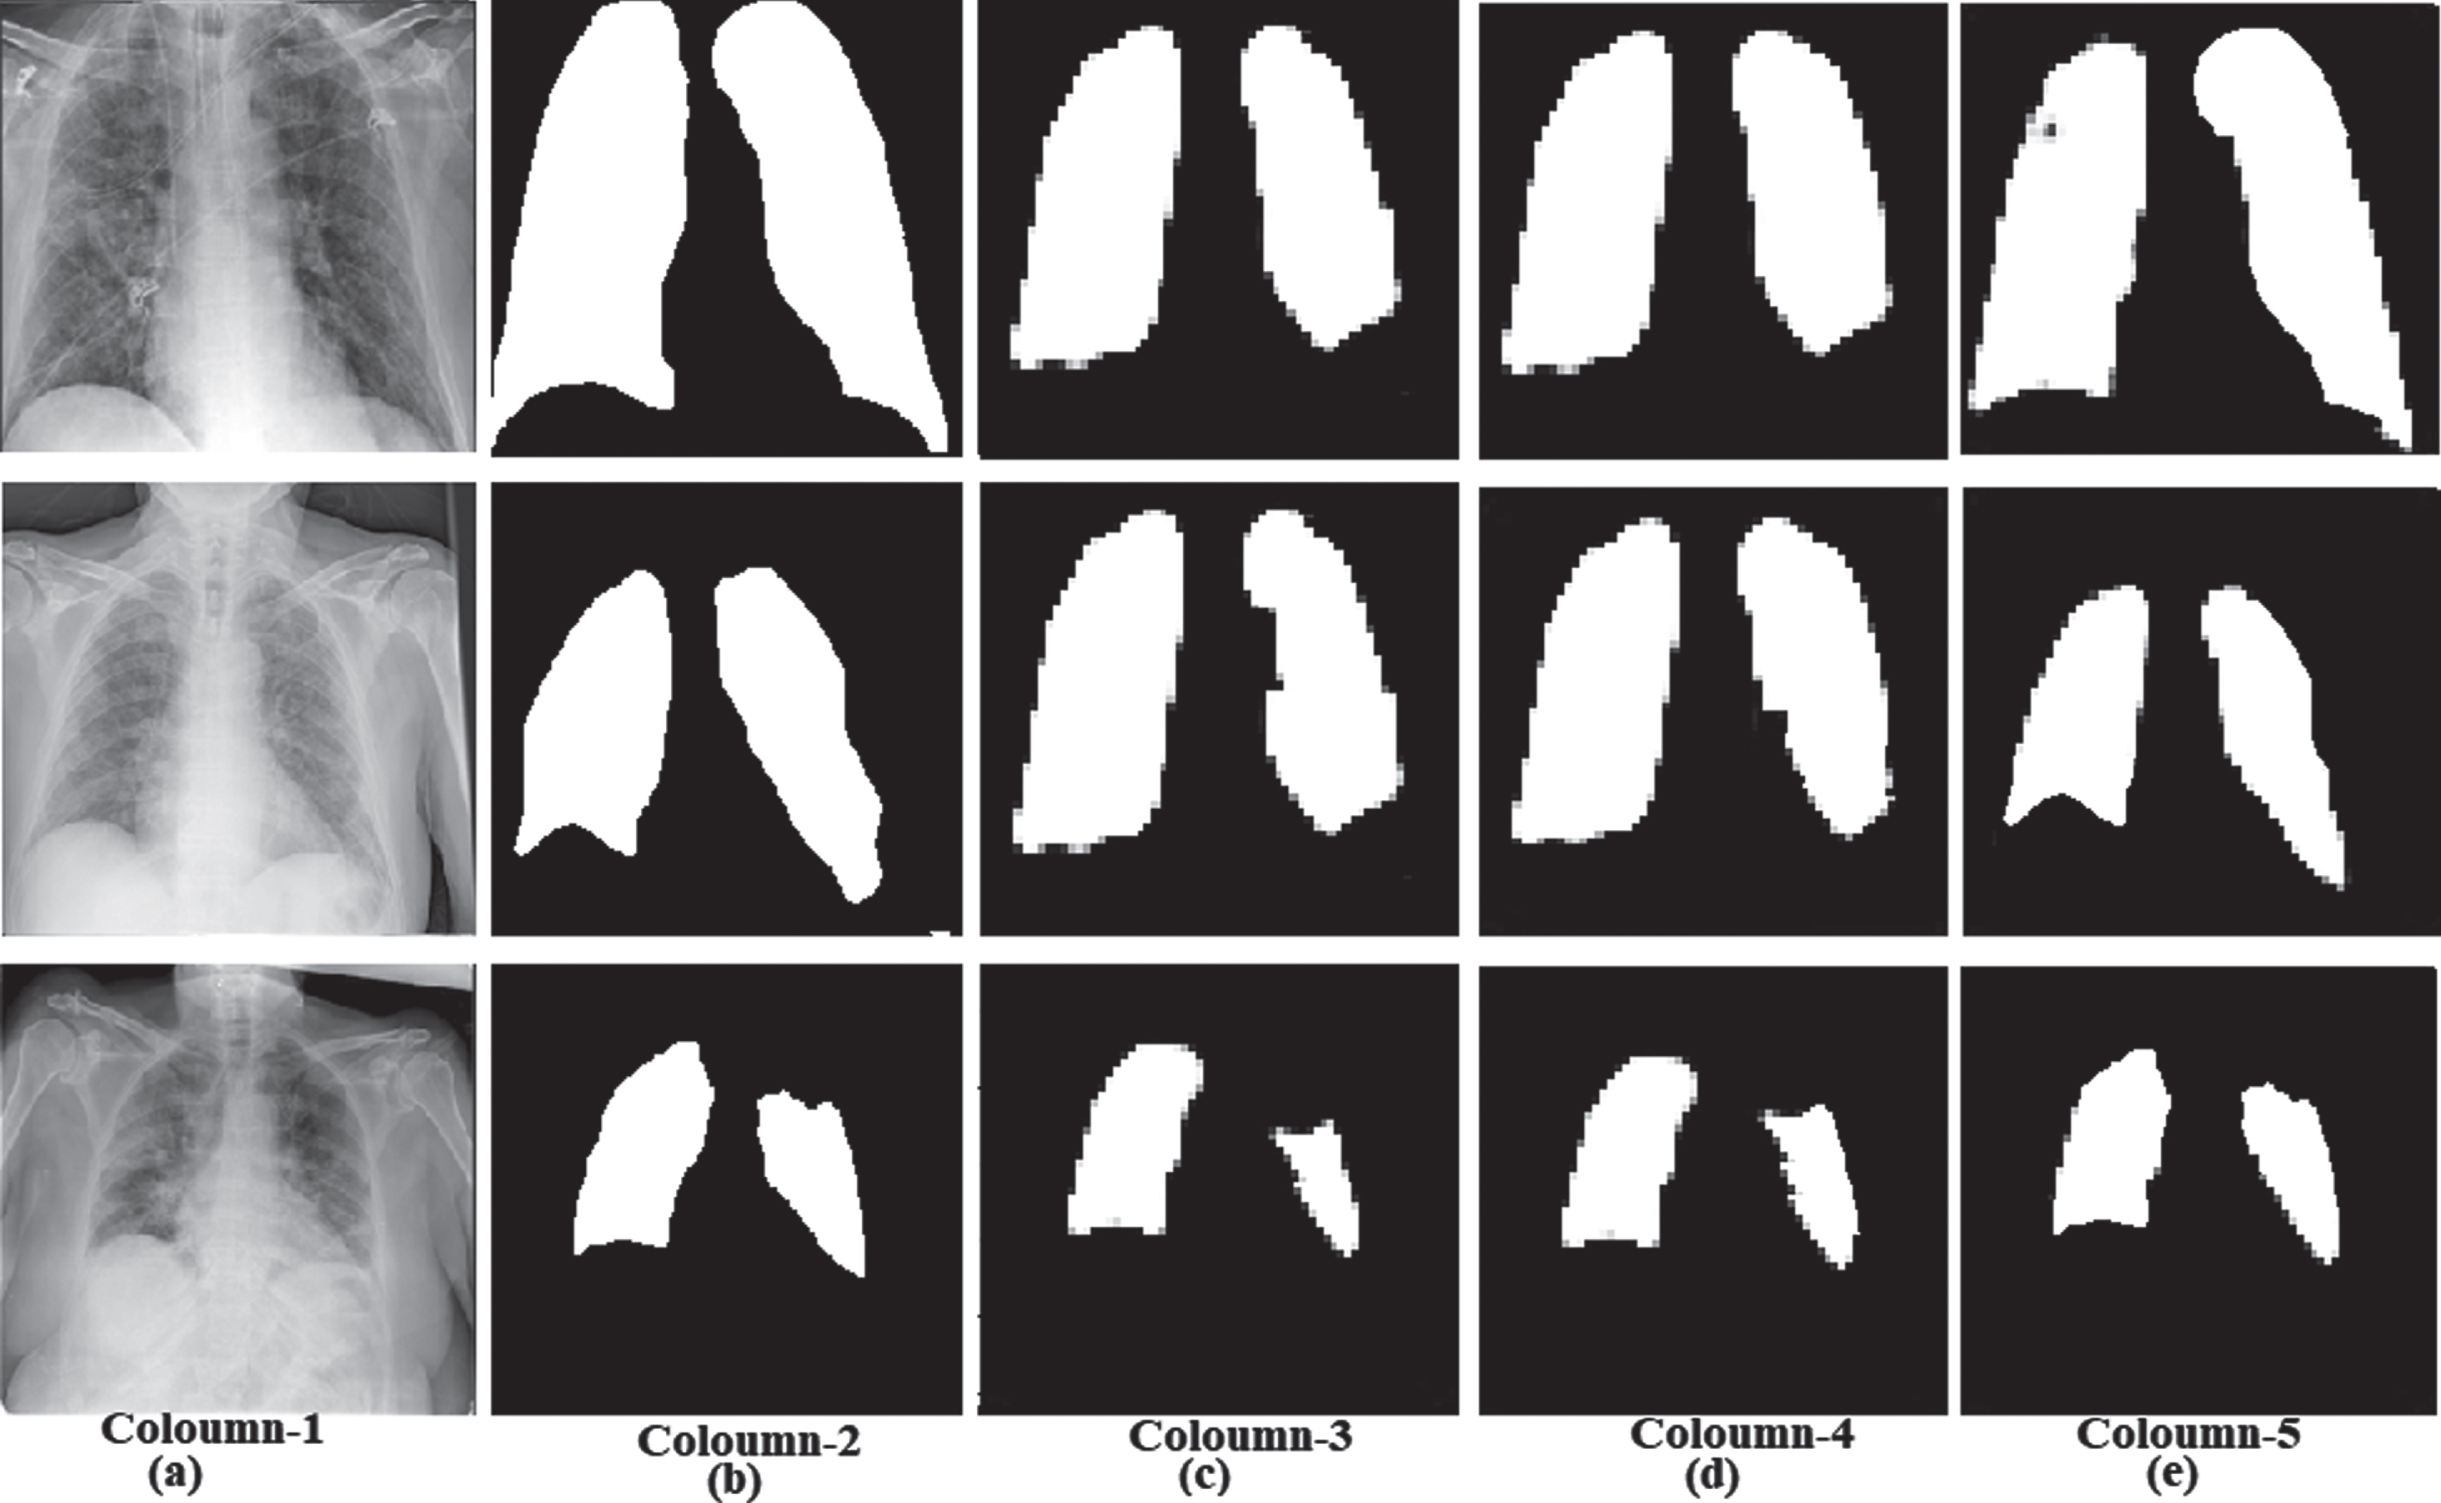
The above qualitative visual result shows the superiority of the GWO-SegNet DL network semantic segmentation of COVID-19 CXR images. The segmentation output of the GWO-SegNet is nearly identical to the ground truth segmentation output. The considerable loss is recorded in other models while performing the semantic segmentation. For semantically segmenting COVID-19 infected lung lobes in CXR images for COVID-19 early detection, proposed DL networks such as hybrid CNN, U-Net, and SegNet and their GWO optimized forms performance metrics are compared with other models summarized in Table 3. All the performance evaluation metrics of the proposed DL networks alone and with GWO are included in Table 3. Our results are compared with the other segmentation and classification networks on CT images and CXR images to understand the significance of our proposed DL networks in CXR images segmentation in COVID-19 early detection.
Table 3
Performance evaluation metrics comparison of proposed DL networks with other networks
| Reference | Dataset images | Methodology | Accuracy (%) | Sensitivity (%) | Specificity (%) | Precision (%) | F1-score (%) |
| Saood, A. et al. [14] | CT | SegNet | 95.40 | 95.60 | 95.42 | – | – |
| U-Net | 94.90 | 96.40 | 94.80 | – | – | ||
| Wang, S. et al. [15] | CT | InceptionV3 | 89.5 | 67.00 | 83.00 | – | 79.30 |
| D.-P. Fan et al. [19] | CT | Semi-Inf-Net | 72.50 | 96.00 | 73.90 | ||
| K Gao et al. [20] | CT | DCN | 95.99 | 89.14 | 98.05 | – | – |
| Yan Q et al. [22] | CT | COVID-SegNet | – | 75.10 | – | 72.6 | 72.60 |
| Amyar A et al. [24] | CT | MTL architecture | 94.67 | 96.00 | 92.00 | – | 88.00 |
| Ying Song et al. [25] | CT | DRE-Net | 86.00 | 96.00 | 77.00 | 79.00 | 87.00 |
| Hemdan EED et al. [26] | CXR | COVIDX-Net | 90.00 | 100 | – | 83.00 | 91.00 |
| A. I. Khan et al. [27] | CXR | CoroNet | 89.60 | 89.92 | 96.40 | 90.00 | 89.80 |
| Afshar P. et al. [30] | CXR | COVID-CAPS | 95.70 | 90.00 | 95.80 | – | – |
| Wang, L. et al. [31] | CXR | COVID-Net | 93.30 | 91.0 | – | – | – |
| P.K. Sethy et al. [33] | CXR | ResNet50 + SVM | 95.33 | 95.33 | – | – | 95.34 |
| Narin, A. et al. [37] | CXR | InceptionV3 | 95.40 | 90.60 | 96.00 | 73.4 | 81.10 |
| ResNet50 | 96.10 | 91.8 | 96.60 | 76.5 | 83.50 | ||
| ResNet101 | 96.10 | 91.80 | 98.20 | 84.20 | 81.20 | ||
| Soumyajit P., et al. [38] | CXR | Mask-RCNN | 96.98 | 97.32 | 97.36 | 96.60 | 96.93 |
| Proposed works | CXR | Hybrid CNN | 89.92 | 94.13 | 96.30 | 92.62 | 91.56 |
| U-Net | 91.04 | 91.02 | 100 | 100 | 95.30 | ||
| SegNet | 93.85 | 98.02 | 88.84 | 91.33 | 94.56 | ||
| GWO-hybrid CNN | 92.36 | 96.52 | 98.87 | 95.31 | 94.87 | ||
| GWO-U-Net | 95.63 | 95.62 | 100 | 100 | 97.06 | ||
| GWO-SegNet | 98.08 | 94.87 | 99.75 | 99.51 | 97.13 |
6Discussion
It is necessary that the COVID-19 be diagnosed as soon as possible because it has infected millions of people across the world. Using Semantic Segmentation methods for identifying and labeling infected lung lobes on CXR images, the suggested DL networks can distinguish COVID-19 patients from normal individuals. Chest radiography is a non-invasive, low-cost procedure for X-rays that may be found in practically every hospital. Various studies have shown that CXR and CT images may be used to screen infection using various DL networks. For semantically segmenting infected lung lobes in CXR images for COVID-19 early detection, three structurally different deep learning (DL) networks such as SegNet, U-Net, and hybrid CNN are investigated initially. A total of 2,174 COVID-19 CXR images are resized into 256x256 dimensions before training the proposed DL networks and the testing is carried out on the 398 COVID-19 CXR images. Each proposed DL network is tested before GWO optimization, and the performance metrics are evaluated. We found that the accuracy of 89.92%, the sensitivity of 94.13%, specificity of 96.30%, the precision of 92.62%, and F1-score of 91.56% in hybrid CNN. The accuracy of 91.04%, 91.02% sensitivity, 100% specificity, 100% precision, and F1-score of 95.30% are recorded in U-Net. The accuracy of 93.85%, 98.02% sensitivity, 88.84% specificity, 91.33% precision, and F1-score of 94.56% are noticed in SegNet. From the evaluation of metrics, a noticeable margin in the performance among the hybrid CNN, U-Net, and SegNet was found. Also, it was observed that SegNet outperforms the U-Net and hybrid CNN for semantically segmenting the CXR images for COVID-19 detection. The accuracy and loss graph of these proposed DL networks are shown in Fig. 12.
Fig. 12
Hybrid CNN, U-Net, and SegNet Accuracy/Loss graph.
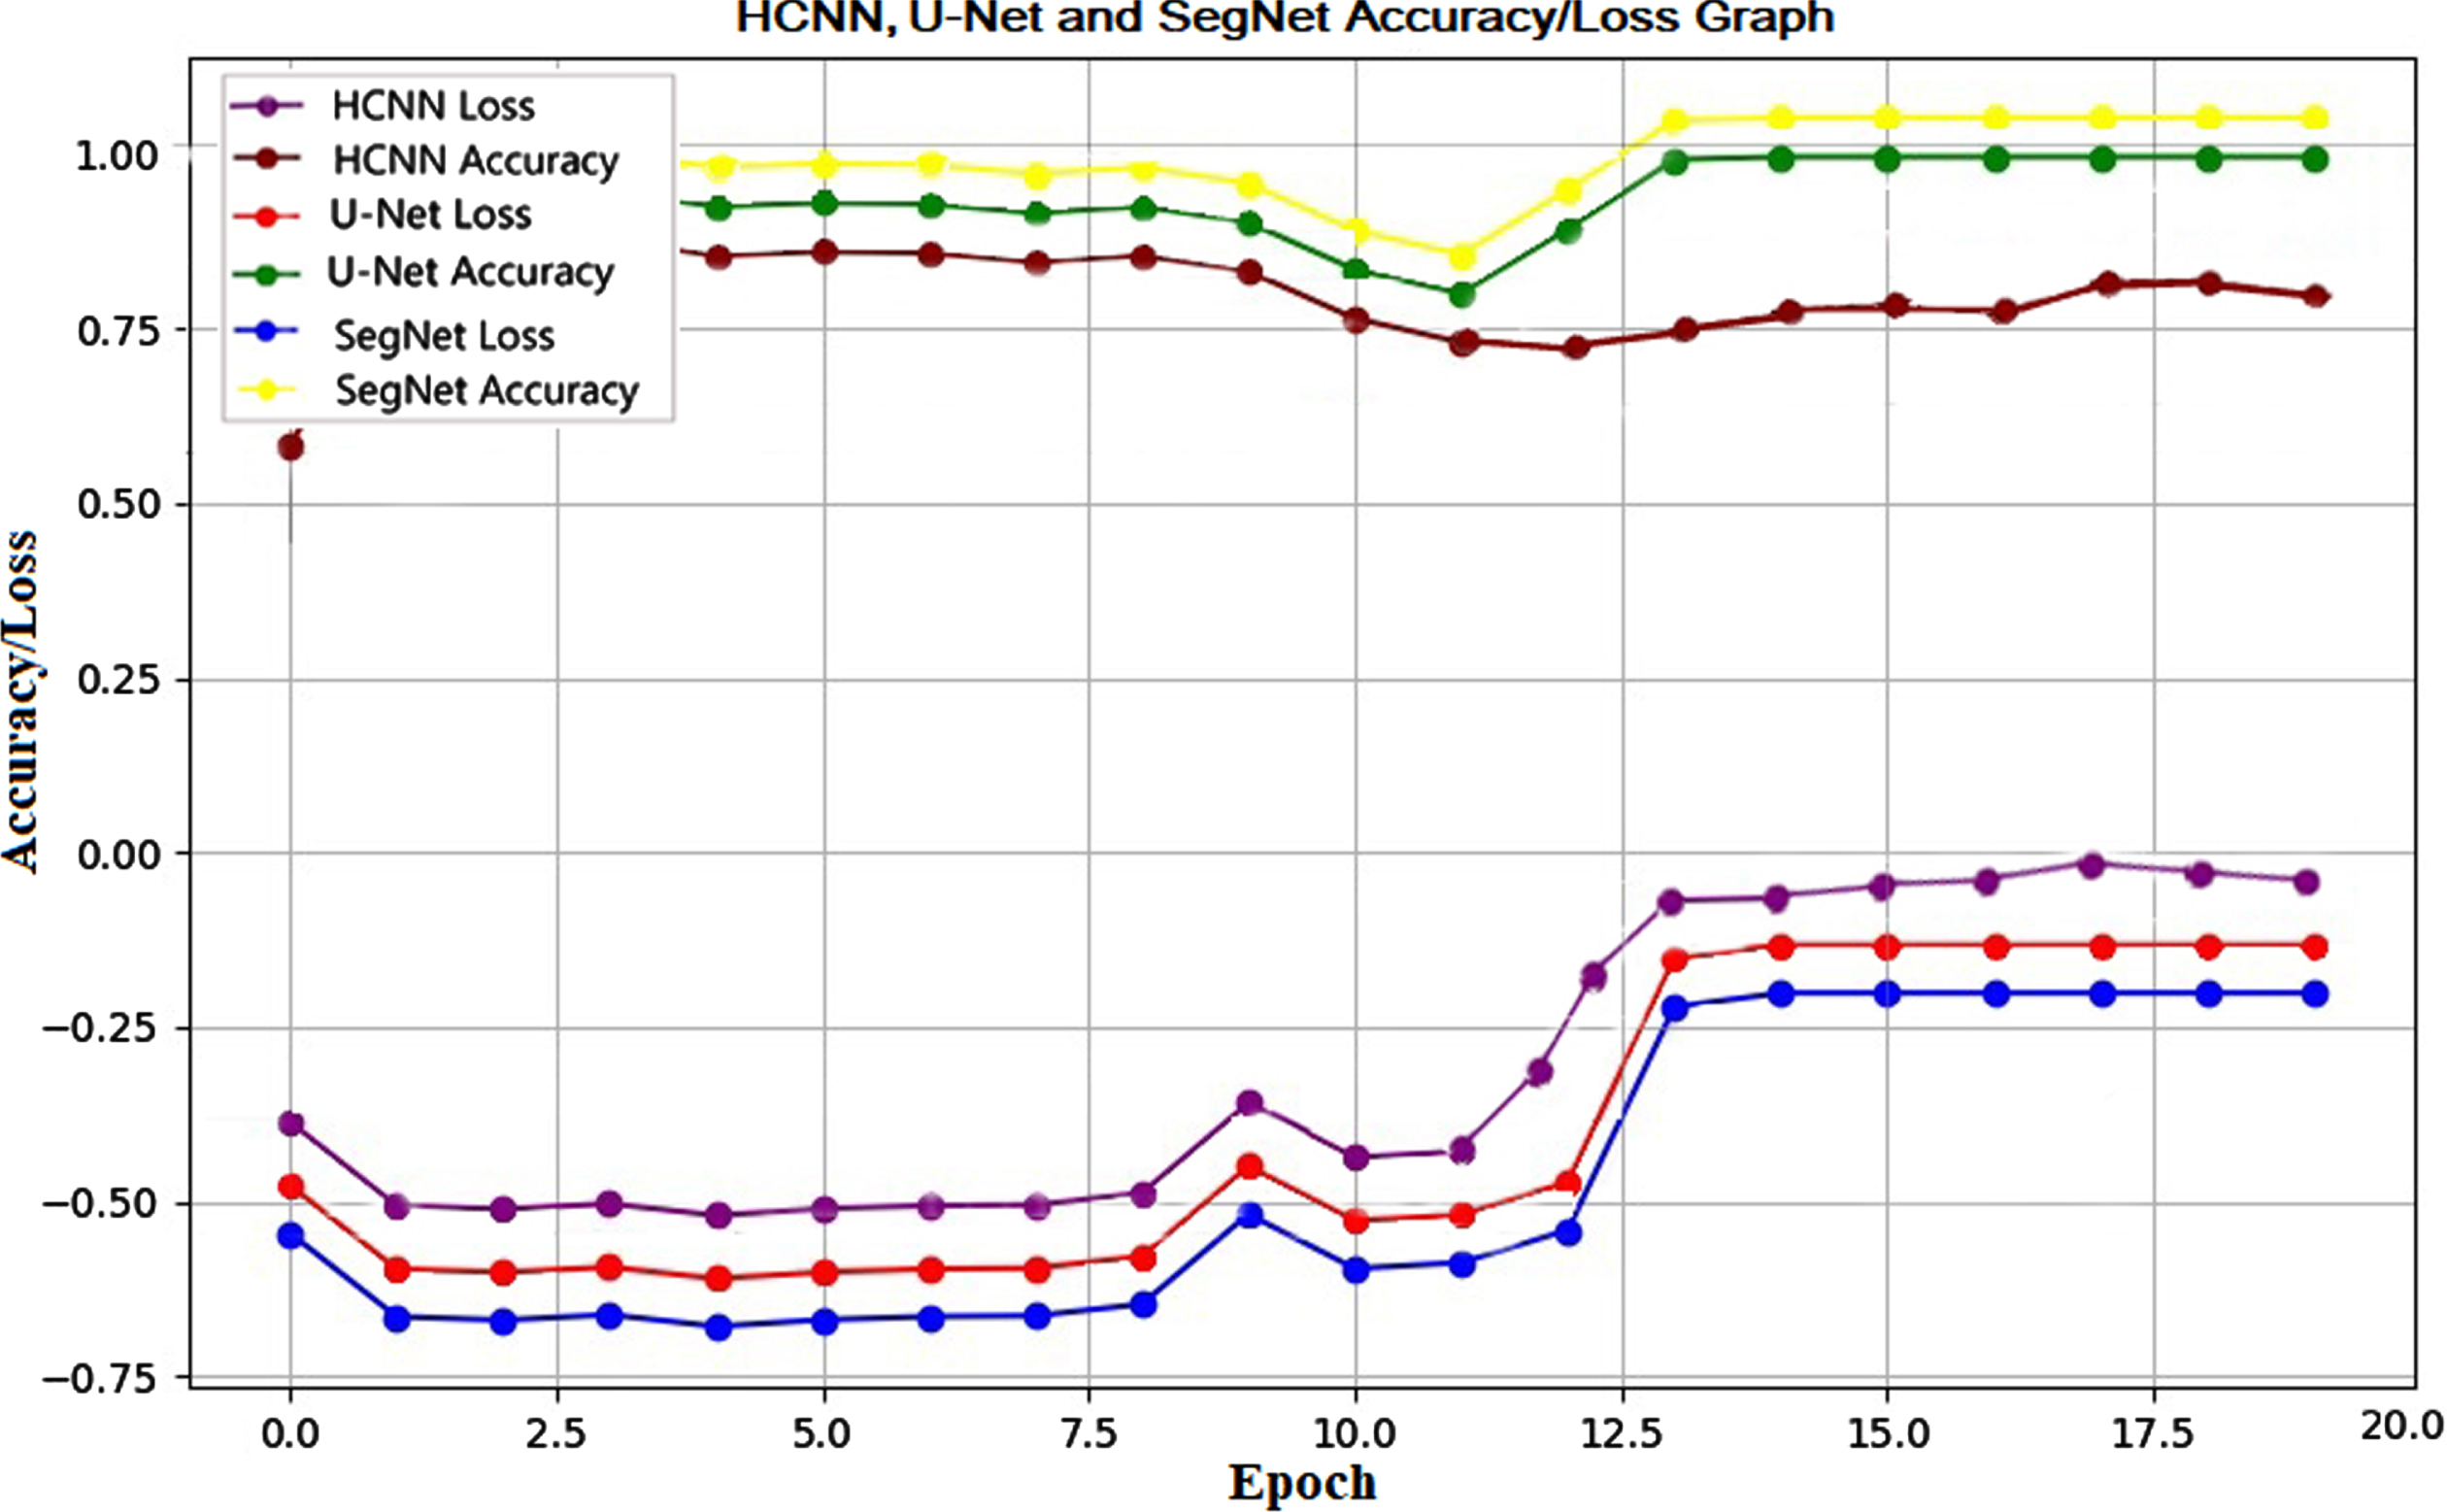
The accuracy and loss for the 20 epochs in proposed DL networks such as hybrid CNN, U-net, and SegNet are visualized in the Fig. 12. More loss with less accuracy is recorded in the hybrid CNN compared to the other two proposed networks such as U-Net and SegNet. Finally, the GWO optimizes hyperparameters of the DL network to avoid overfitting, model collapse, and achieve the highest performance possible. Each proposed DL network is optimized with a GWO algorithm to improve the performance. The optimized CXR image semantic segmentation networks for early detection of COVID-19 are proposed with grey wolf optimization (GWO) algorithm by optimizing the hyperparameters for training hybrid CNN, U-net, and SegNet. The GWO optimized DL networks proposed in this study are GWO-HCNN, GWO-U-Net, and GWO-SegNet, each of these optimized DL networks is tested, and the performance metrics are evaluated. We found that the accuracy of 92.36%, 96.52% sensitivity, 98.87% specificity, 95.31% precision, and 94.87% F1-score in GWO-hybrid CNN. The accuracy of 95.63%, 95.62% sensitivity, 100% specificity, 100% precision, and F1-score of 97.06% are recorded in GWO-U-Net. The accuracy of 98.08%, 94.87% sensitivity, 99.75% specificity, 99.51% precision, and F1-score of 97.13% are noticed in GWO-SegNet. From the evaluation of metrics, a noticeable margin in the performance among the GWO-hybrid CNN, GWO-U-Net, and GWO-SegNet was found. Also, it was observed that GWO-SegNet outperforms the GWO-U-Net and GWO-hybrid CNN for semantically segmenting the COVID-19 CXR images. The accuracy and loss of these optimized DL networks are shown in Fig. 13.
Fig. 13
GWO-Hybrid CNN, GWO-U-Net and GWO-SegNet Accuracy/Loss graph.
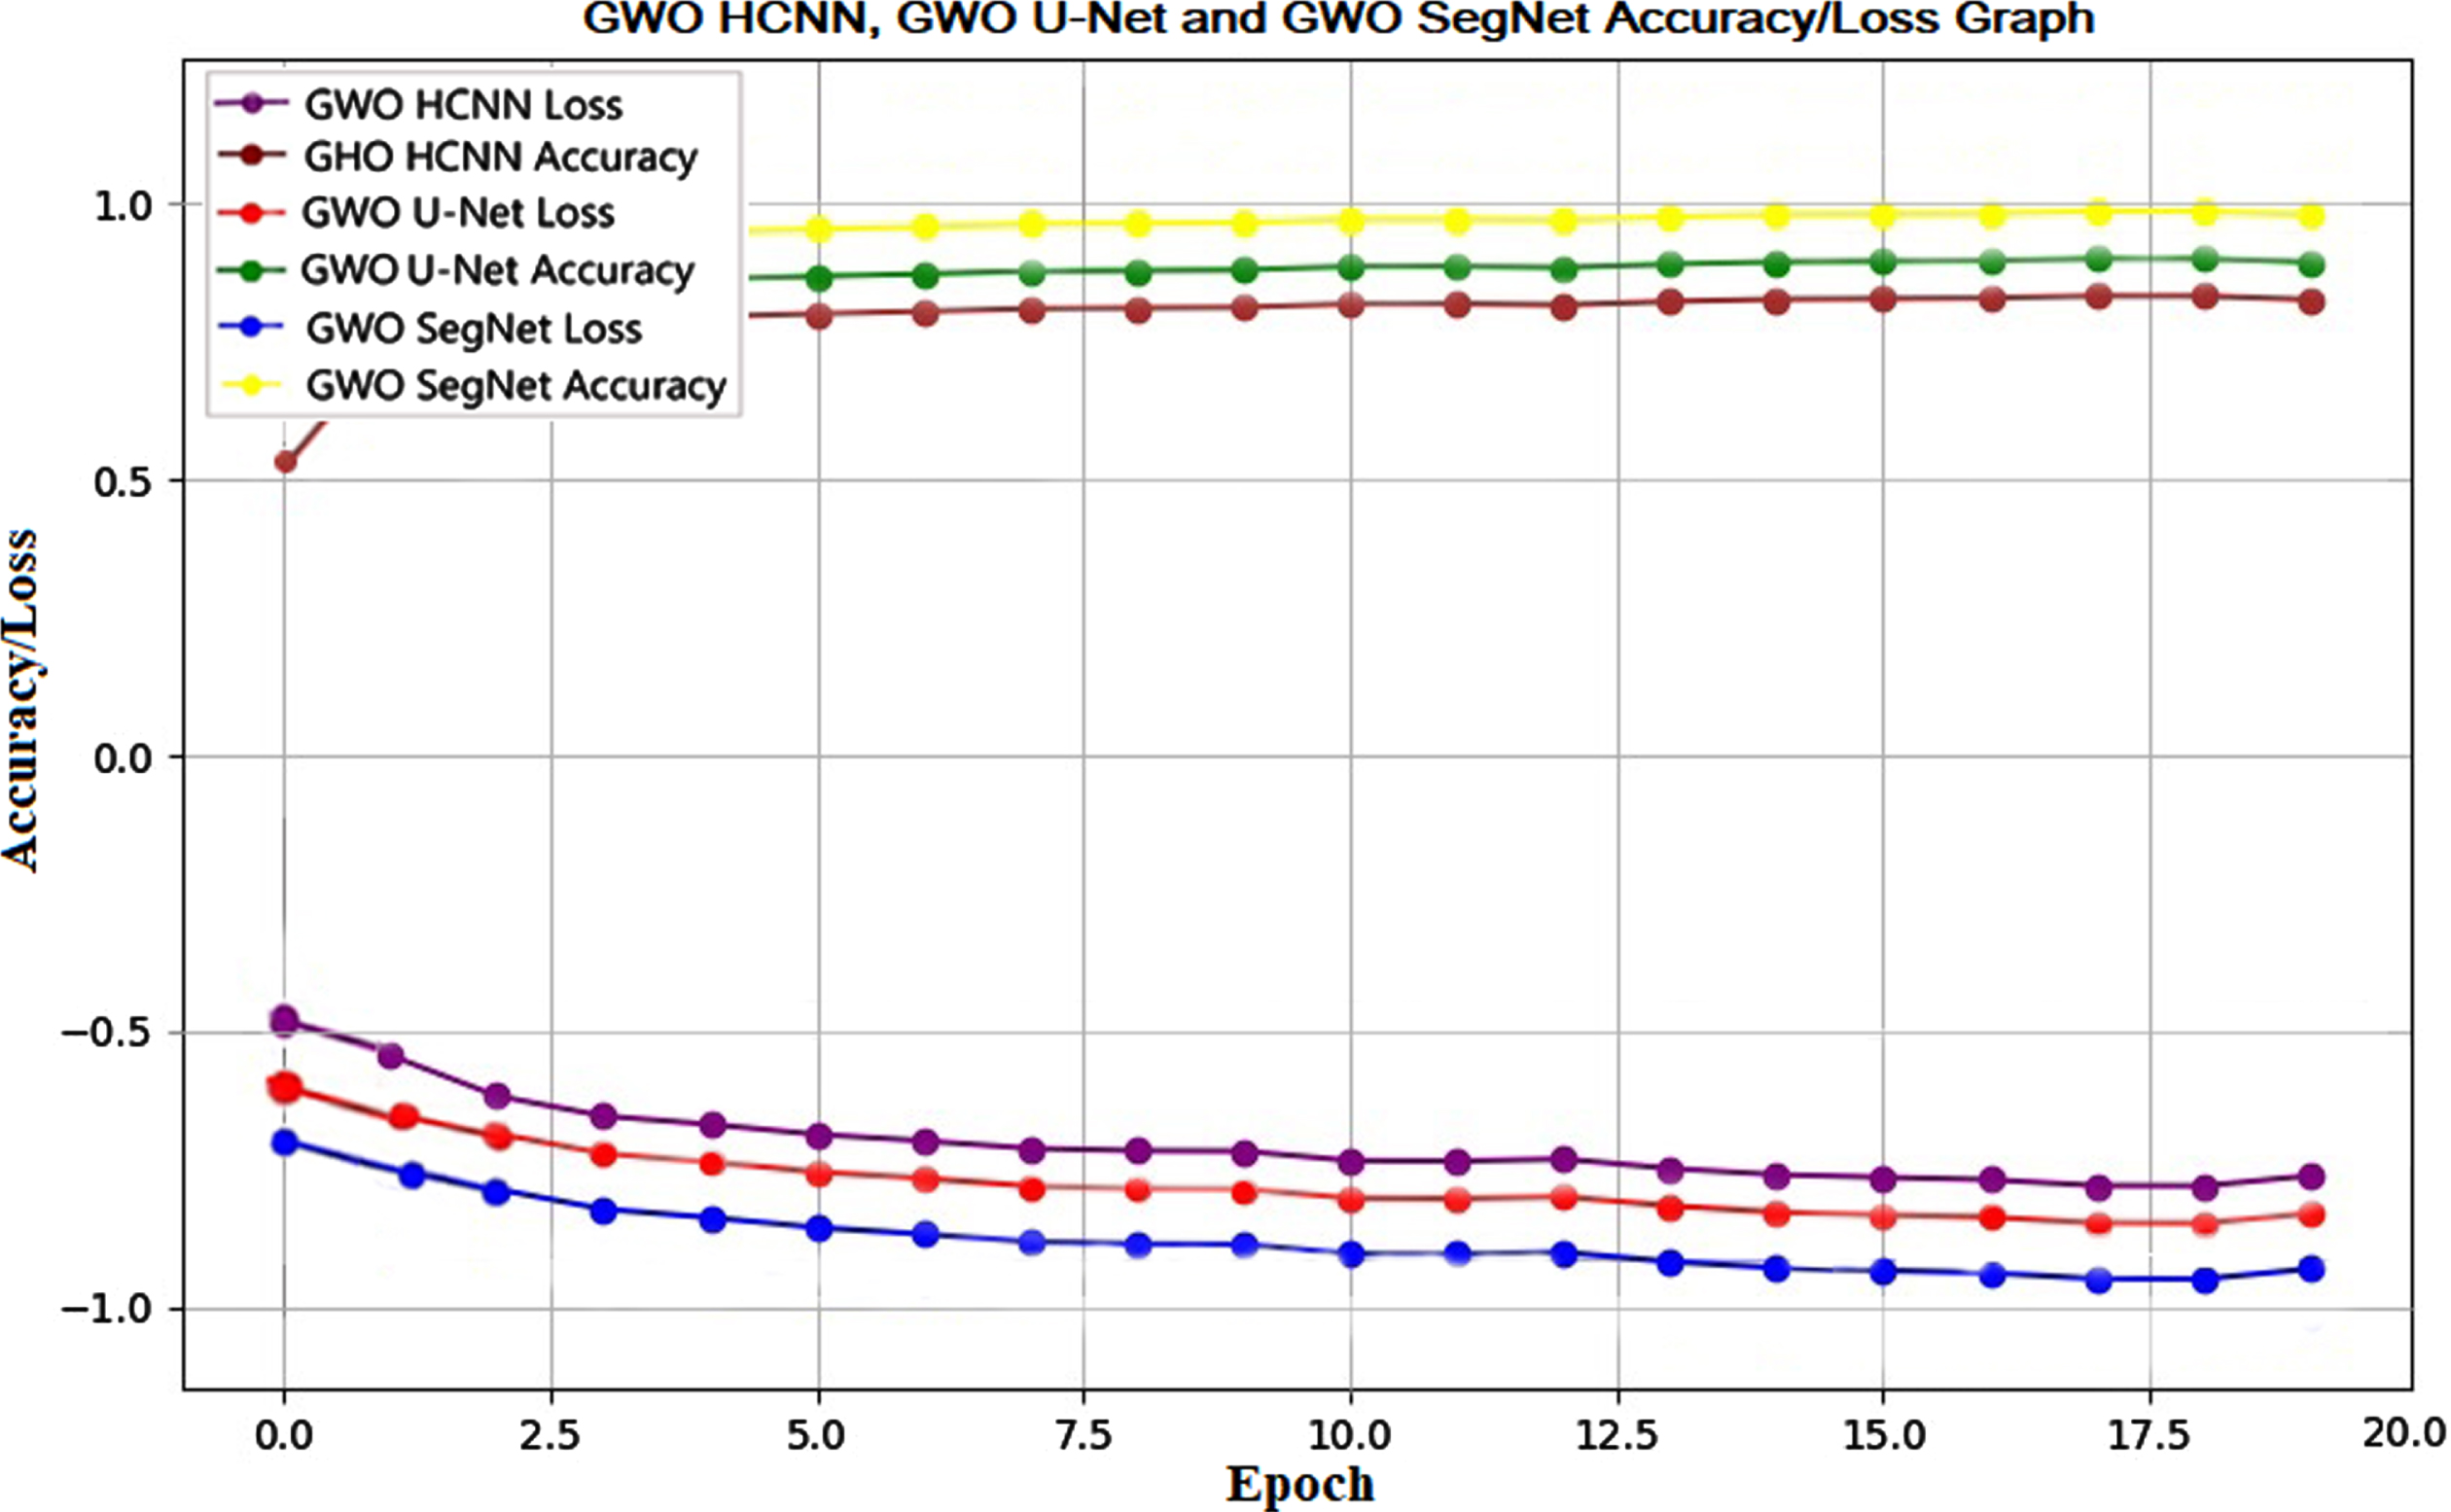
The accuracy and loss for the 20 epochs in optimized DL networks such as GWO-hybrid CNN, GWO-U-Net, and GWO-SegNet are visualized in the Fig. 13. More loss with less accuracy is recorded in the GWO-hybrid CNN compared to the other two optimized networks such as GWO-U-Net and GWO-SegNet. All the performance metrics evaluated in this study are plotted graphically, as shown in Fig. 14.
Fig. 14
Graph of performance evaluation metrics of this study.
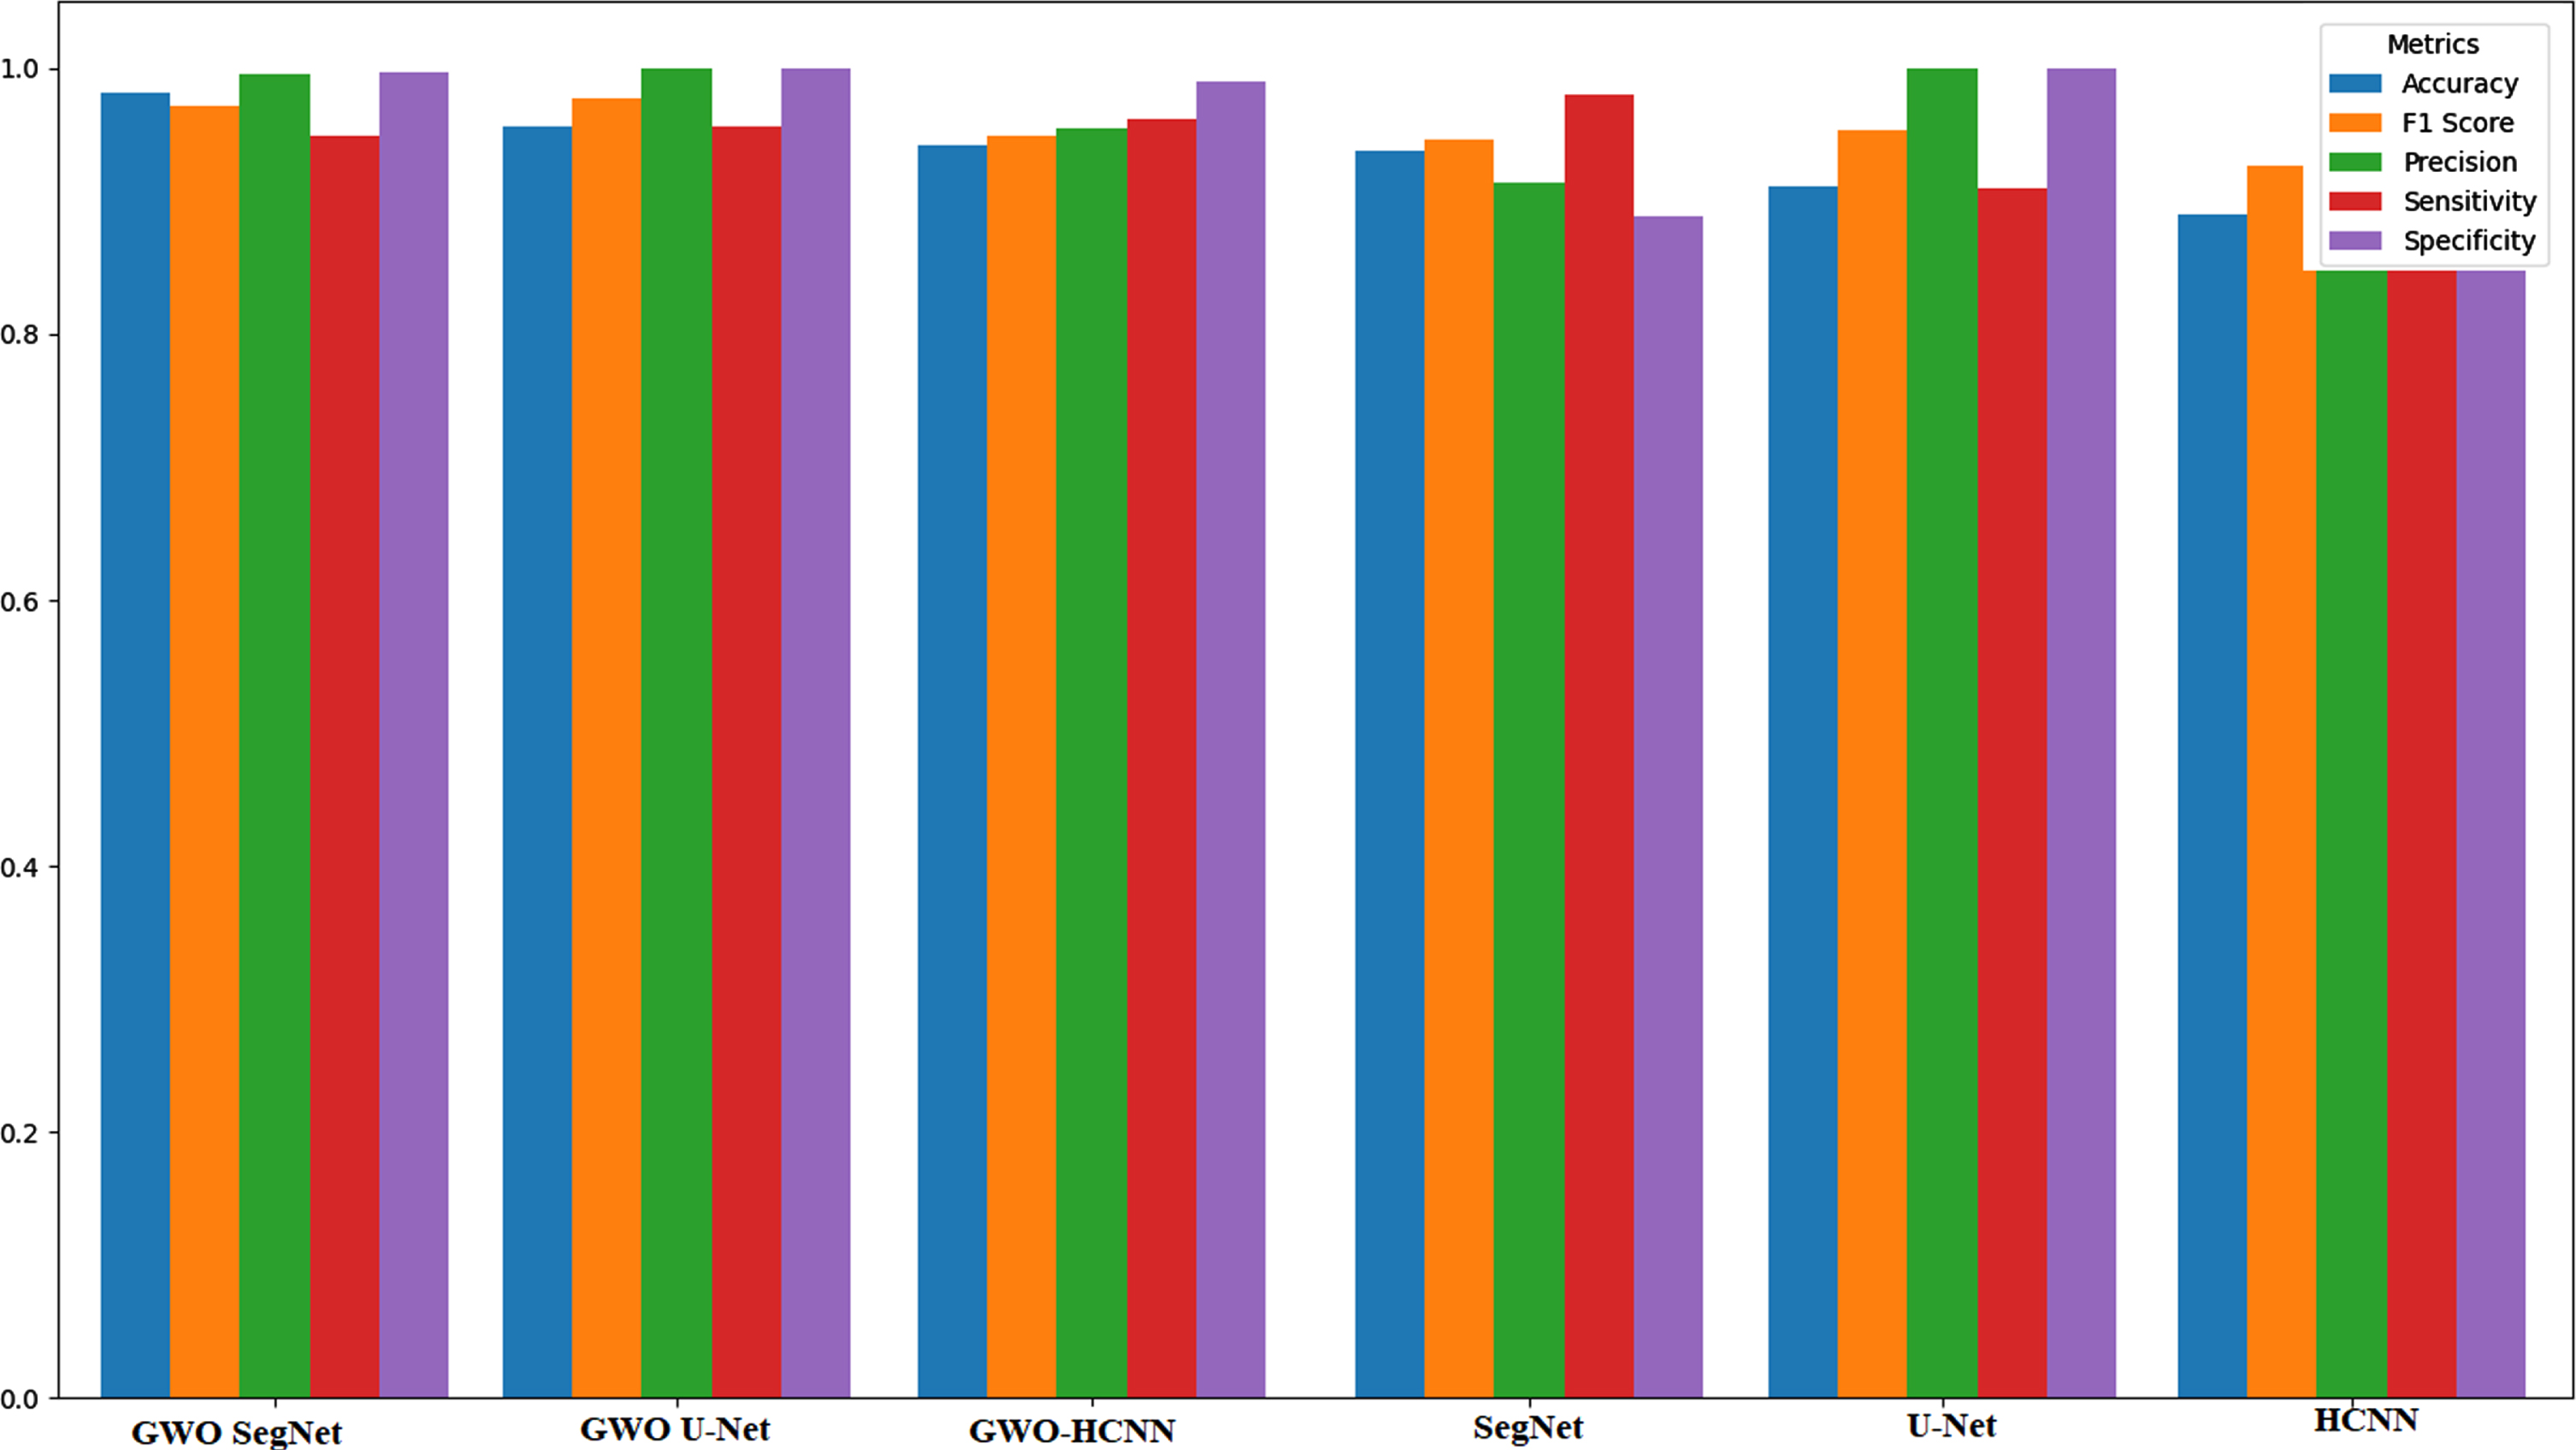
The performance metrics evaluation graph shown in Fig. 14 shows that for all proposed GWO DL networks, semantically segmenting CXR images with more than 92% accuracy. After semantically segmenting infected lung lobes in CXR images, the trained networks were used to classify the CXR images as COVID-19 or normal using the test CXR samples. For flexibility, the non-infected class is treated as normal CXR in all the cases of this study. Several DL networks and optimization techniques are available in deep learning to find out the best possible options for training the DL networks with complex structures with more hyperparameters. The proposed DL networks and their optimized models are compared with the works carried on the CT and CXR images datasets, as shown in Table 3. This research work proves that the DL and optimized DL networks can detect COVID-19 by the semantic segmentation. The results states in a quantifiable manner how reliable are the DL and optimized DL networks in performing segmentation of COVID-19 CXR images. The best network in this study (GWO-SegNet) has high accuracy, indicating that it is good at modeling a trained radiologist in detecting COVID-19 from COVID-19 CXRs with sematic segmentation at hand. The major limitation of this study is that if no ground truth masks are applied, the DL network may only give approximate localization in CXR images, and networks may completely fail to localize COVID-19 infection. It is possible to extract textural features such as local binary pattern, optimal oriented pattern directional pattern, gradient hexa pattern, gradient pattern, ternary pattern, and directional ternary pattern from the segmented portion of COVID-19 CXR images. In the future, we will focus on performing research on these textural features for early COVID-19 infection detection.
7Conclusion
In this study, we developed three structurally different deep learning (DL) networks such as SegNet, U-Net, and hybrid CNN with SegNet plus U-Net for semantically segmenting COVID-19 infected lung lobes in COVID-19 CXR images for early COVID-19 detection. The performance of these DL networks was evaluated qualitatively and quantitatively to know the ability to detect infected regions in CXR images. The SegNet network was highly capable of differentiating between infected and healthy tissues in COVID-19 CXR images compared to U-Net and hybrid CNN. The SegNet network semantically segmented COVID-19 infected lung lobes in CXR images with 93.85% accuracy. Further, these three structurally different DL networks are optimized using the GWO algorithm. The GWO algorithm optimizes the hyperparameters used to train DL networks. The optimized chest X-ray image semantic segmentation networks are developed for COVID-19 early detection such as GWO-hybrid CNN, GWO-U-Net, and GWO-SegNet. The performance of these optimized networks was evaluated qualitatively and quantitatively to know the ability to detect infected regions in CXR images of these optimized DL networks. The GWO-SegNet network was highly capable of differentiating between COVID-19 infected and healthy tissues in CXR images compared to GWO-U-Net and GWO-hybrid CNN. The GWO-SegNet network semantically segmented infected lung lobes in CXR images with 98.08% accuracy. All the optimized CXR image semantic segmentation networks for COVID-19 early detection developed in this study achieved more than 92% accuracy. The optimized DL networks could be utilised to objectively identify COVID-19 disease in chest X-ray images of the lungs.
Funding
None
Conflict of interest
There are no conflicts of interest associated with this work.
Ethical approval
There are no studies with human participants or animals reported by any of the authors in this article.
References
[1] | Calvo C. , López-Hortelano M.G. , De Carlos Vicente J.C. , et al., Recommendations on the clinical management of the COVID-19 infection by the < <new coronavirus> >SARS-CoV2. Spanish Paediatric Association working group, An Pediatría (English Edition) 92: (4) ((2020) ), 241.e1–241.e11. |
[2] | Lauer S.A. , Grantz K.H. , Bi Q. , et al., The incubation period of coronavirus disease (covid-19) from publicly reported confirmed cases: Estimation and application, Ann Internal Med 172: (9) ((2020) ), 577–582. PMID: 32150748. |
[3] | Xu X. , Jiang X. , et al., A Deep Learning System to Screen Novel Coronavirus Disease Pneumonia, Engineering 6: (10) ((2020) ), 1122–1129. |
[4] | Liu H. , Liu F. , Li J. , et al., Clinical and CT imaging features of the COVID-19 pneumonia: focus on pregnant women and children, J Infect 80: (5) ((2020) ), e7–13. |
[5] | Bai Y. , Yao L. , Wei T. , et al., Presumed asymptomatic carrier transmission of COVID-19, JAMA 323: (14) ((2020) ), 1406–1407. |
[6] | Quekel L.G. , Kessels A.G. , Goei R. and van Engelshoven J.M. , Miss rate of lung cancer on the chest radiograph in clinical practice, Chest 115: (3) ((1999) ), 720–724. |
[7] | Garland L.H. , On the scientific evaluation of diagnostic procedures, Radiology 52: (3) ((1948) ), 309–328. |
[8] | Van Ginneken B. , Romeny B.M.T.H. and Viergever M.A. , Computer-aided diagnosis in chest radiography: a survey, IEEE Transactions on Medical Imaging 20: (12) ((2001) ), 1228–1241. |
[9] | Shi T. , Jiang H. and Zheng B. , A stacked generalized U-shape network based on zoom strategy and its application in biomedical image segmentation, Comput Methods Programs Biomed 197: ((2020) ), 105678. |
[10] | Abbas M.A. , Alqahtani M.S. , Alkulib A.J. , et al., Development of a novel computational method using computed tomography images for the early detection and severity classification of COVID-19 cases, J Xray Sci Technol 29: (2) ((2021) ), 211–228. |
[11] | Wang X. , Peng Y. , Lu L. , et al., Chest X-Ray8: Hospital-Scale Chest X-Ray Database and Benchmarks on Weakly-Supervised Classification and Localization of Common Thorax Diseases, in, 2017 IEEE Conference on Computer Vision and Pattern Recognition (CVPR) 2017: , 3462–3471. |
[12] | Daimary D. , Bora M.B. , Amitab K. and Kandar D. , Brain tumor segmentation from MRI images using hybrid convolutional neural networks, Procedia Comput Sci 167: ((2020) ), 2419–2428. |
[13] | Singh V.K. , Rashwan H.A. , Romani S. , et al., Breast tumor segmentation and shape classification in mammograms using generative adversarial and convolutional neural network, Expert Syst Appl 139: ((2020) ), 112855. |
[14] | Saood A. and Hatem I. , COVID-19 lung CT image segmentation using deep learning methods: U-Net versus Seg Net, BMC Med Imaging 21: ((2021) ), 19. |
[15] | Wang S. , Kang B. , Ma J. , et al., A deep learning algorithm using CT images to screen for Corona virus disease (COVID-19), Eur Radiol 31: ((2021) ), 6096–6104. |
[16] | Li Y. and Xia L. , Coronavirus disease (COVID-19): role of chest CT in diagnosis and management, Am J Roentgenol 214: (6) ((2019) ), 1280–1286. |
[17] | Ai T. , Yang Z. , Hou H. , et al., Correlation of chest CT and RT-PCR testing for coronavirus disease (COVID-19) in China: a report of cases, Radiology 296: (2) ((2020) ), E32–E40. |
[18] | El Asnaoui K. and Chawki Y. , Using X-ray images and deep learning for automated detection of coronavirus disease, Journal of Biomolecular Structure and Dynamics 39: (10) ((2021) ), 3615–3626. |
[19] | Fan D.P. , Zhou T. , Ji G.P. , et al., Inf-net: automatic COVID-19 lung infection segmentation from CT images, IEEE Transactions on Medical Imaging 39: (8) ((2020) ), 2626–2637. |
[20] | Gao K. , Su J. , Jiang Z. , et al., Dual-branch combination network (DCN): towards accurate diagnosis and lesion segmentation of COVID-19 using CT images, Medical Image Analysis 67: ((2021) ), Article ID 101836. |
[21] | Paluru N. , et al., Anam-Net: Anamorphic Depth Embedding-Based Lightweight CNN for Segmentation of Anomalies in COVID-19 Chest CT Images, IEEE Transactions on Neural Networks and Learning Systems 32: (3) ((2021) ), 932–946. |
[22] | Yan Q. , Wang B. , Gong D. , et al., COVID-19 chest CT image segmentation network by multiscale fusion and enhancement operations, IEEE Transactions on Big Data 7: (1) ((2021) ), 13–24. |
[23] | Zheng R. , Zheng Y. and Dong-Ye C. , Improved 3D U-Net for COVID-19 Chest CT Image Segmentation, Scientific Programming (2021), 9999368. |
[24] | Amyar A. , Modzelewski R. and Ruan S. , Multi-task deep learning based CT imaging analysis for COVID-19: classification and segmentation, Computer Biol Med 21: ((2020) ), 104037. |
[25] | Song Y. , Zheng S. , Li L. , et al., Deep learning enables accurate diagnosis of novel coronavirus (COVID-19) with CT images, IEEE/ACM Trans Comput Biol Bioinform 18: (6) ((2021) ), 2775–2780. |
[26] | Hemdan E.E.D. , Shouman M.A. and Karar M.E. , COVIDX-NET: a framework of deep learning classifiers to diagnose COVID-19 in x-ray images, ArXiv preprint. arXiv:2003.11055. |
[27] | Khan A.I. , Shah J.L. and Bhat M.M. , CoroNet: A deep neural network for detection and diagnosis of COVID-19 from chest x-ray images, Computer Methods and Programs in Biomedicine 196: ((2020) ), 105581. |
[28] | Maghdid H.S. , Asaad A.T. , Ghafoor K. , et al., Diagnosing COVID-19 pneumonia from X-ray and CT images using deep learning and transfer learning algorithms, Proc SPIE 11734, Multimodal Image Exploitation and Learning (2021), 117340E. |
[29] | Abbas A. , Abdelsamea M.M. and Gaber M.M. , Classification of COVID-19 in chest X-ray images using DeTraC deep convolutional neural network, Appl Intell 51: ((2021) ), 854–864. |
[30] | Afshar P. , Heidarian S. , Naderkhani F. , et al., COVID-CAPS: a capsule network-based framework for identification of COVID-19 cases from X-ray images, Pattern Recognition Letters 138: ((2020) ), 638–643. |
[31] | Wang L. , Lin Z.Q. and Wong A. , COVID-Net: a tailored deep convolutional neural network design for detection of COVID-19 cases from chest X-ray images, Sci Rep 10: ((2020) ), 19549. |
[32] | Apostolopoulos I.D. and Mpesiana T.A. , Covid-19: automatic detection from X-ray images utilizing transfer learning with convolutional neural networks, Phys Eng Sci Med 43: ((2020) ), 635–640. |
[33] | Sethy P.K. , Behera S.K. , et al., Detection of coronavirus disease (COVID-19) based on deep features and SVM, Int J Math Eng Manag Sci 5: (4) ((2020) ), 643–651. |
[34] | Oh Y. , Park S. and Ye J.C. , Deep learning covid-19 features on CXR using limited training data sets, IEEE Trans Med Imaging 39: (8) ((2020) ), 2688–2700. |
[35] | Li M.D. , Arun N.T. , Gidwani M. , et al., Automated assessment and tracking of COVID-19 pulmonary disease severity on chest radiographs using convolutional siamese neural networks, Radiology: Artificial Intelligence 2: (4) ((2020) ), e200079. |
[36] | Loey M. , Smarandache F. and Khalifa M. NE. , Within the lack of chest COVID-19 X-ray dataset: A novel detection model based on GAN and deep transfer learning, Symmetry 12: (4) ((2020) ), 651. |
[37] | Narin A. , Kaya C. and Pamuk Z. , Automatic detection of coronavirus disease (COVID-19) using X-ray images and deep convolutional neural networks, Pattern Anal Applic 24: ((2021) ), 1207–1220. |
[38] | Podder S. , Bhattacharjee S. and Roy A. , An efficient method of detection of COVID-19 using mask R-CNN on chest X-Ray images, AIMS Biophysics 8: (3) ((2021) ), 281–290. |
[39] | Mittal A. , Hooda R. and Sofat S. , LF-SegNet: A Fully Convolutional Encoder–Decoder Network for Segmenting Lung Fields from Chest Radiographs, Wireless Pers Commun 101: (1) ((2018) ), 511–529. |
[40] | Tan W. , Huang P. , Li X. , et al., Analysis of segmentation of lung parenchyma based on deep learning methods, J Xray Sci Technol 29: (6) ((2021) ), 945–959. |
[41] | Goel T. , Murugan R. , Mirjalili S. , et al., OptCoNet: an optimized convolutional neural network for an automatic diagnosis of COVID-19, Appl Intell 51: ((2021) ), 1351–1366. |
[42] | Ahishali M. , Degerli A. , Yamac M. , et al., Advance warning methodologies for covid-19 using chest x-ray images, IEEE Access 9: ((2021) ), 41052–41065. |
[43] | Shi F. , Xia L. , Shan F. , et al., Large-scale screening to distinguish between COVID-19 and community-acquired pneumonia using infection size-aware classification, Phys Med Biol 66: (6) ((2021) ), 065031. |
[44] | Degerli A. , Ahishali M. , Yamac M. , et al., COVID-19 infection map generation and detection from chest X-ray images, Health Inf Sci Syst 9: (15) ((2021) ). |
[45] | Badrinarayanan V. , Kendall A. and Cipolla R. , SegNet: A Deep Convolutional Encoder-Decoder Architecture for Image Segmentation, IEEE Transactions on Pattern Analysis and Machine Intelligence 39: (12) ((2017) ), 2481–2495. |
[46] | Simonyan K. and Zisserman A. , Very deep convolutional networks for large-scale image recognition. arXiv:1409.1556. (2014). |
[47] | Ronneberger O. , Fischer P. and Brox T. , U-Net: Convolutional Networks for Biomedical Image Segmentation. Mredical Image Computing and Computer-Assisted Intervention (MICCAI) (2015), 234–241. |
[48] | Mirjalili S. , Mirjalili S.M. and Lewis A. , Grey wolf optimizer, Adv Eng Softw 69: ((2014) ), 46–61. |
[49] | Kingma D. and Ba J. , Adam: A method for stochastic optimization. In: Proceedings of the 3rd international conference on learning representations (ICLR), arXiv:1412.6980 (2014). |


