
Classification by a stacking model using CNN features for COVID-19 infection diagnosis
Abstract
Affecting millions of people all over the world, the COVID-19 pandemic has caused the death of hundreds of thousands of people since its beginning. Examinations also found that even if the COVID-19 patients initially survived the coronavirus, pneumonia left behind by the virus may still cause severe diseases resulting in organ failure and therefore death in the future. The aim of this study is to classify COVID-19, normal and viral pneumonia using the chest X-ray images with machine learning methods. A total of 3486 chest X-ray images from three classes were first classified by three single machine learning models including the support vector machine (SVM), logistics regression (LR), artificial neural network (ANN) models, and then by a stacking model that was created by combining these 3 single models. Several performance evaluation indices including recall, precision, F-1 score, and accuracy were computed to evaluate and compare classification performance of 3 single four models and the final stacking model used in the study. As a result of the evaluations, the models namely, SVM, ANN, LR, and stacking, achieved 90.2%, 96.2%, 96.7%, and 96.9%classification accuracy, respectively. The study results indicate that the proposed stacking model is a fast and inexpensive method for assisting COVID-19 diagnosis, which can have potential to assist physicians and nurses to better and more efficiently diagnose COVID-19 infection cases in the busy clinical environment.
1Introduction
In November 2019, the severe acute respiratory syndrome, coronavirus 2 (SARS-CoV-2), first appeared in Wuhan, China. This disease, which is stated to be transmitted through the respiratory tract, was officially named COVID-19 by the World Health Organization on February 12, 2020. Spreading around the world through human-to-human transmission in early 2020, COVID-19 turned into a pandemic [1, 2].
Various symptoms such as fever, dry cough, respiratory tract diseases can be observed in patients infected with COVID-19. In severe cases, these symptoms may result in pneumonia, respiratory distress, organ failure, and even death [3, 4]. For the diagnosis of pneumonia, X-ray or computed tomography (CT), from the chest radiography imaging techniques, are utilized [5, 6].
Diagnosing COVID-19 infected patients from the chest CT or X-ray images requires a specialist doctor and is also time-consuming. For this reason, machine learning techniques, a sub-branch of artificial intelligence (AI), are utilized to diagnose and automatically classify COVID-19 from patients’ chest CT and X-ray images [7, 8]. Deep learning, which is one of these techniques, can reveal features that are not distinct in the original images. In particular, Convolutional Neural Network (CNN) is extremely effective in feature extraction. Therefore, it is widely used by researchers [9].
When the recent literature studies on CT and X-ray images in the diagnosis of COVID-19 are examined, it is seen that the CNN is the most preferred technique. Some of these studies have binary classifications, while others have multiple classifications. The number of data used in the studies also varies. Tables 1–3 include recent studies in the literature.
Table 1
Studies performed using Chest Computed Tomography (CT) images
| Model | Dataset | Accuracy (%) | References |
| Deep Transfer Learning (DTL)-based model has been proposed. DCNN architecture was used. | C: 413 N or P: 439 | 93.01 | Pathak et al. [8] |
| Multi-Tasking Deep Learning (MTDL)-based classification and segmentation model has been proposed. | C:449 NC:595 | 86 | Amyar et al. [10] |
| Adaptive Feature Selection-guided Deep Forest (AFS-DF) has been proposed for classification. | C: 1495 CAP: 1027 | 91.79 | Sun et al. [11] |
| CNN-based AlexNet, VGG-16, VGG-19, SqueezeNet, GoogleNet, MobileNet-V2, ResNet-18, ResNet-50, ResNet-101 and Xception architectures was used. | C: 108 NC: 86 | 99.51 | Ardakani et al. [12] |
| DTL model was designed by using CNN-based DenseNet-201 architecture. | C: 1262 NC: 1230 | 97.4 | Jaiswal et al. [13] |
| GLCM, LDP, GLRLM, GLSZM and DWT were used for feature extraction. SVM was used for the classification. | The patch regions were cropped from 150 CT images. Four different patch subsets (C, NC) have been created. | 99.64 | Barstugan et al. [14] |
| CNN-based VGG-16, GoogleNet and ResNet-50 architectures were used. SVM was used for classification. | The patch regions were cropped from 53 CT images. Two different patch subsets (C, NC) have been created. | 98.27 | Ozkaya et al. [15] |
| Convolutional Support Vector Machine (CSVM) consisting of blocks containing three different numbers of SVM cores has been proposed. | C: 1262 NC: 1230 | 94.03 | Ozkaya et al. [16] |
(Viral Pneumonia (VP), Bacterial Pneumonia (BP), Pneumonia (P), Normal (N), COVID-19 (C), Non-COVID (NC), Community Acquired Pneumonia (CAP)).
Table 2
Studies performed using Chest X-ray images
| Model | Dataset | Accuracy (%) | References |
| CNN-based CovXNet model has been proposed. | VP: 305 | 90.3 | Mahmud et al. [17] |
| BP: 305 | |||
| N: 305 | |||
| C: 305 | |||
| CNN-based CVDNet model has been proposed. | C: 219 | 97.20 | Ouchicha et al. [1] |
| N: 1341 | |||
| VP: 1345 | |||
| CoroNet model has been proposed by using Deep Convolutional Neural Networks (DCNN)-based Xception architecture. | N: 310 | 89.6 | Khan et al. [3] |
| BP: 330 | |||
| VP: 327 | |||
| C: 284 | |||
| CNN-based EfficientNet architecture was used. | N: 500 | 96.70 | Marques et al. [18] |
| P: 504 | |||
| C: 504 | |||
| Bayesian Convolutional Neural Networks (BCNN)-based model has been proposed. | N: 1583 | 89.82 | Ghoshal and Tucker [19] |
| BP: 2786 | |||
| VP: 1504 | |||
| C: 68 | |||
| A DCNN-based Decompose, Transfer, and Compose (DeTraC) model has been proposed. | N: 80 | 95.12 | Abbas et al. [20] |
| C: 105 | |||
| SARS: 11 | |||
| DCNN-based VGG16 architecture was used. | C: 498 | 98 | Zhong [21] |
| N: 1583 | |||
| P: 4273 | |||
| DCNN-based Inception V3 with transfer learning has been proposed. | C: 864 | over 98 | Asif et al. [22] |
| VP: 1345 | |||
| N: 1341 | |||
| CNN-based ReCoNet architecture was used. | C: 238 | 97.48 | Ahmed et al. [23] |
| N: 8851 | |||
| P: 6045 | |||
| CNN-based pre-trained VGG16 architecture was used. | C: 132 | 86 | Civit-Masot et al. [24] |
| N: 132 | |||
| P: 132 | |||
| A CNN-based (not pre-trained) network consisting of five convolution layers was designed for feature extraction. Classification processes were performed with K-NN, SVM and DT whose hyper-parameters were optimized through Bayesian optimization algorithms. | C: 219 | 98.97 | Nour et al. [25] |
| N: 1341 | |||
| VP: 1345 | |||
| CNN-based DarkCOVIDNet model has been proposed. | C: 125 | 87.02 | Ozturk et al. [26] |
| No-Findings: 500 | |||
| P: 500 | |||
| The efficient features obtained from the model trained with CNN-based MobileNetV2, SqueezeNet architectures were selected with Social Mimic optimization. | C: 295 | 99.27 | Togacar et al. [27] |
| N: 65 | |||
| P: 98 | |||
| COVIDiagnosis-Net, whose hyper-parameters are optimized with Bayesian optimization algorithms using CNN-based SqueezeNet architecture, has been proposed. | C: 76 | 98.26 | Ucar and Korkmaz [28] |
| N: 1583 | |||
| P: 4290 |
(Viral Pneumonia (VP), Bacterial Pneumonia (BP), Pneumonia (P), Normal (N), COVID-19 (C), Non-COVID (NC)).
Table 3
Studies performed using both Chest X-ray and CT images
| Model | Dataset | Accuracy (%) | References |
| DFeature extraction was performed with 15 DCNN-based architectures (MobileNet, DenseNet121, DenseNet201, Xception, InceptionV3, InceptionResNetV2, ResNet50, ResNet152, VGG16, VGG19, NASNetLarge, NASNetMobile, ResNet50V2, ResNet101V2, ResNet152V2). 6 machine learning algorithms (Decision Tree, Random Forest, XGBoost, AdaBoost Bagging, LightGBM) were used for classification. | C: 117/20 P: 117/20 | 99 | Kassani et al. [29] |
| CNN-based VGG16 and Inception-V2 architectures and DT are used. | C: 360 | 91 | Dansana et al. [30] |
| P: 18 | |||
| SARS: 16 | |||
| A DL-based approach has been proposed by using the DenseNet-121 architecture. | C: 238 (11416 after augmentation) | 93.71 | Sarker et al. [31] |
| N: 8851 | |||
| P: 6045 |
(Pneumonia (P), Normal (N), COVID-19 (C)).
This study focuses on the following topics:
1. Lung X-ray images were used in the detection and diagnosis of COVID-19 in order to minimize misdiagnoses caused by PCR test inaccuracies. Because X-ray is available in every hospital, taking X-ray images is simpler and faster than other imaging techniques.
2. In order to detect the COVID-19 virus from chest X-rays, the image features on the X-ray images were used. CNN increases the classification success by extracting the hidden features on the images. In this way, the time required for the diagnosis will be shortened while the diagnostic success increases.
3. Unlike studies in the literature, this study includes more X-ray images in the COVID-19 class. This has increased the classification reliability of the models.
4. With VGG19 network structure, 4096 features were extracted and used in classification methods.
5. Recall, Precision and F-1 score metrics were used to evaluate the success of the classification models. The classification status of the samples was also examined with the confusion matrices.
The remaining structure of this study is planned as follows: In Chapter 2, the proposed model will be presented. Chapter 3 will provide knowledge about the Dataset used in the study. In Chapter 4, the materials and methods will be given. Chapter 5 will include Experimental Results, and lastly, the results and discussion will be given in Chapter 6.
2Proposed model
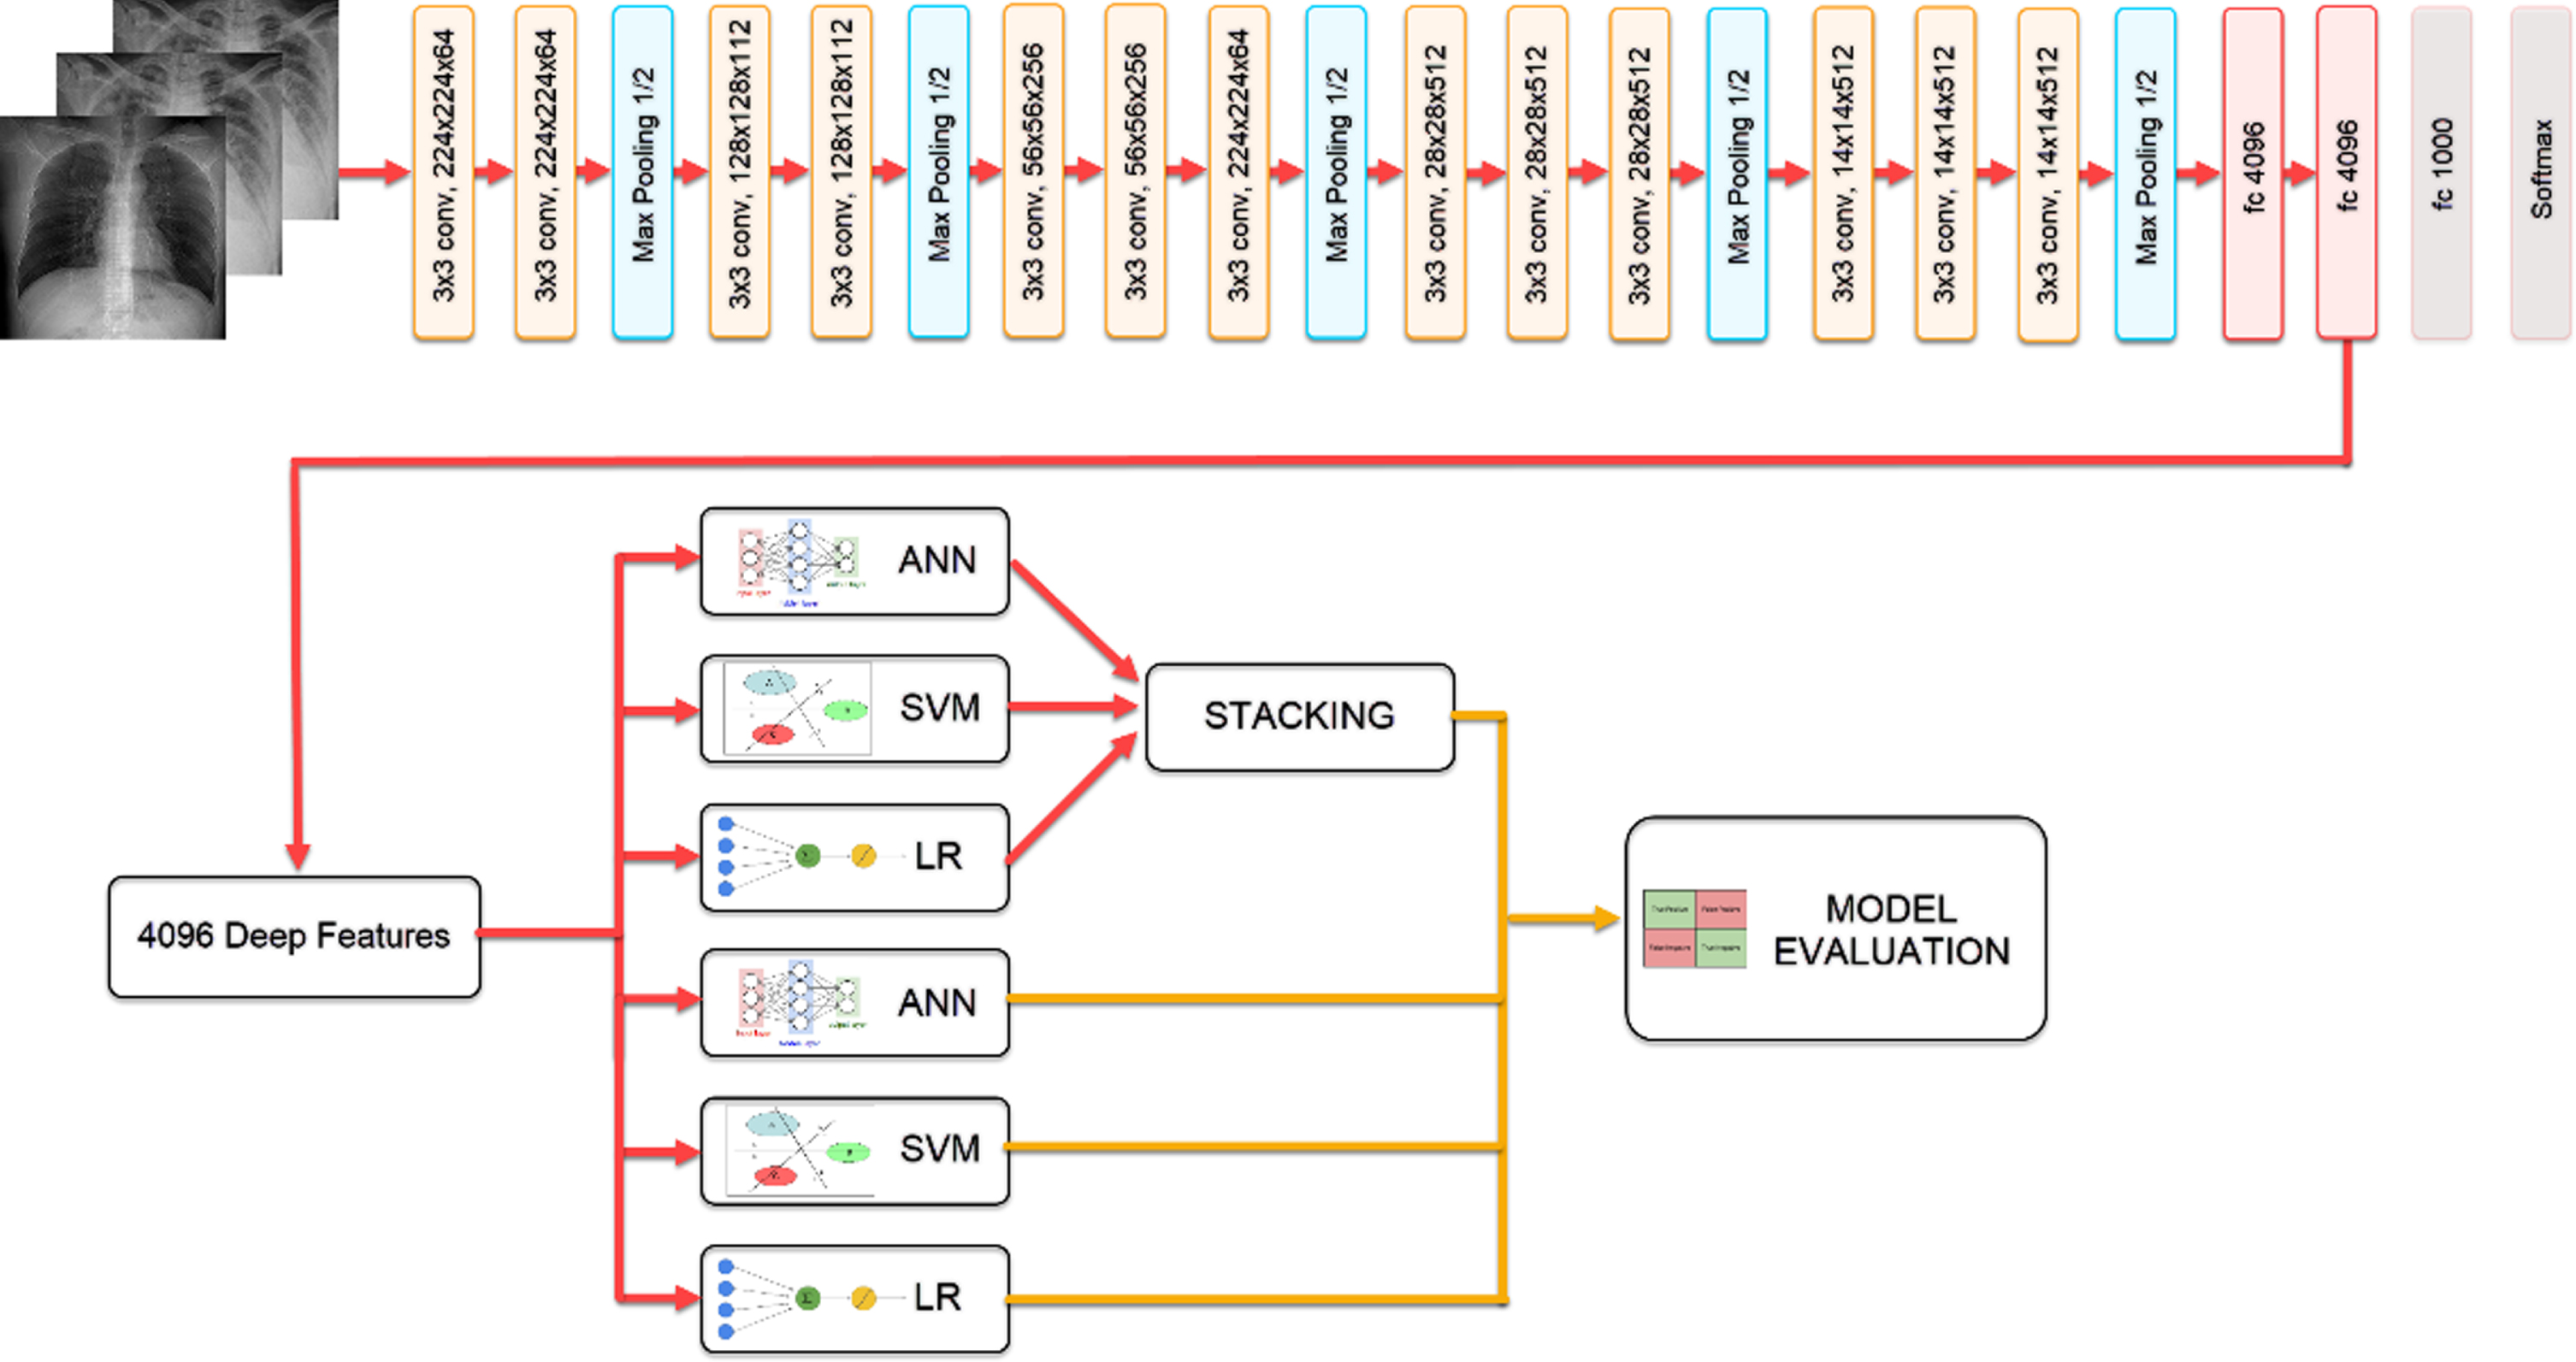
Extracting features from the penultimate layer of the network trained with CNN-based VGG19 architecture, the classification results of Logistic Regression (LR), Artificial Neural Networks (ANN), SVM models, and Stacking model, which was created by combining these models, were compared through. The block diagram showing the steps of the study is given in Fig. 1.
Fig. 1
Flow chart of the proposed model.
3Dataset
Throughout the pandemic period, many studies have been conducted on the COVID-19 diagnosis with lung X-ray images. Lung X-ray images were examined in 3 classes as Normal, Viral Pneumonia, and COVID-19. Since the fact that the image number of classes is equal or close to each other affects the success of machine learning models, the dataset was created with classes whose image numbers are close. The number of images for each class is given in Table 4.
Table 4
Distribution of images for classes contained in the dataset
| COVID19 | Normal | Viral Pneumonia | Total |
| 800 | 1341 | 1345 | 3486 |
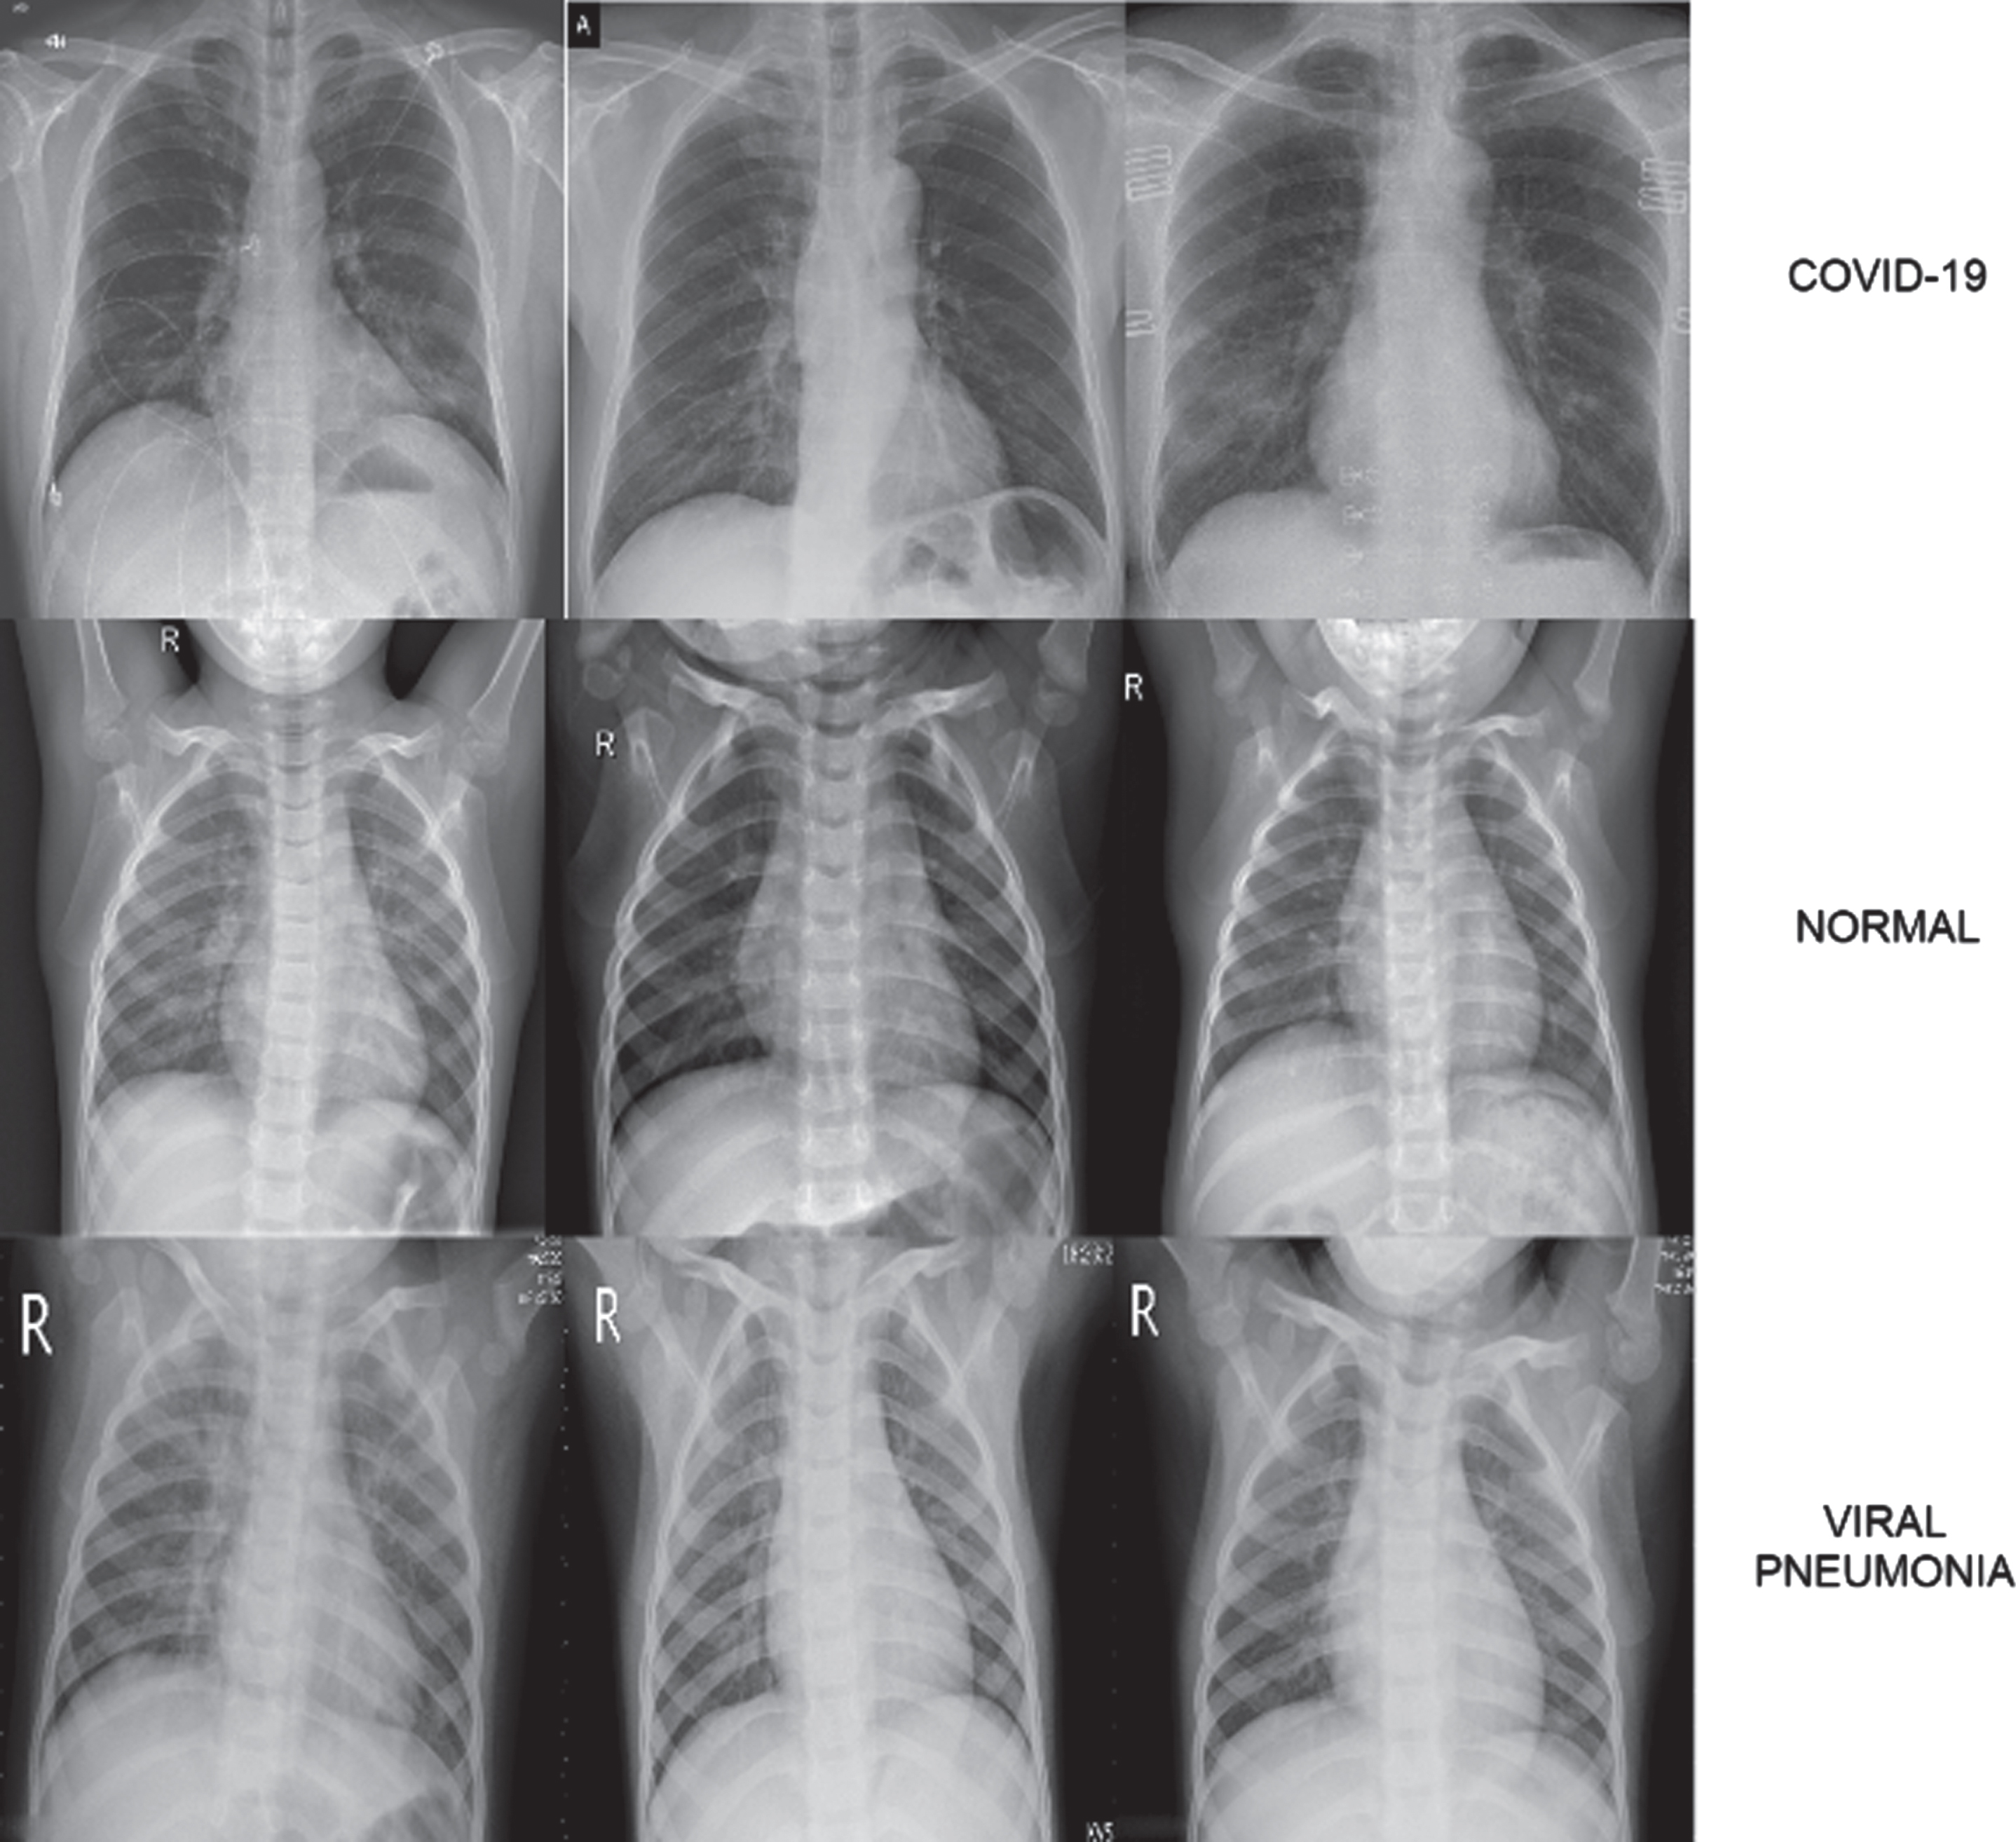
The dataset used in the study was created by combining open access datasets. The number of COVID-19 X-ray images detected as positive is 800, and this number is constantly updated in the source where the dataset was taken [32]. The number of Normal and Pneumonia Chest X-ray images are 1341 and 1345, respectively [33]. A dataset containing a total of 3486 chest X-ray images was created by using these images. Data augmentation was not performed because the number of images in the classes was close to each other. In Fig. 2, samples of images in the dataset are shown.
Fig. 2
COVID-19, Normal and Viral Pneumonia Chest X-ray image samples found in dataset.
4Methods
In this section, general knowledge about the models, machine learning methods, and the performance metrics used in the study will be provided.
4.1Convolution Neural Network (CNN)
CNN is a deep learning architecture with multiple layers. It can be used as a classifier in image processing problems, as well as a feature extractor for different machine learning algorithms. When used as a feature extractor, vectorial features can be extracted from the network just before the classification layer which is the last layer. Until the final stage, several processes are performed on the images. Extracting the features of the input images in the convolution layer is the first one of these processes. As a result of this layer, feature maps are extracted. Activation functions are used to make nonlinear data linear. Since the data obtained in the convolution layers will create computation capacity in the future processes, data reduction is applied in the pooling layers. With this process, the data from the convolution layer can be reduced to the desired size. After these layers, there are fully connected layers, which make connections between all nodes by working like a neural network. While making these connections, activation functions are used. After fully connected layers, there is the flatten layer where the data is prepared for training in neural networks. If the classification cannot be performed in the CNN network, the features are taken from the fully connected layer [34].
The VGG19 network structure used within the scope of the study consists of 14 convolutions, 5 max-pooling, 3 fully connected, and 1 softmax layer. After 5 convolution blocks, fc6, fc7, and fc8 layers come.
In the study, the process of obtaining the features was made from the fc7 layer, which is the penultimate layer having 4096 features. These features are given as input to the machine learning models used in the study.
4.2Artificial Neural Network (ANN)
Neural networks are a supervised machine learning method used in solving classification problems. With this algorithm, which works by taking the human brain as a sample, the data is learned by the computer, and then it is asked to make predictions. The algorithm tries to minimize the error rate by learning from the mistakes it makes during learning. The input layer consists of hidden layers and an output layer. These layers contain nodes called neurons. No processing takes place on the input and output layers. In order for the model to provide better learning, the number of hidden layers and the number of neurons in this layer should be optimally adjusted. Various methods are used to reduce error rates, normalize and optimize the data in the model. In order for a better learning performance, the selection of these parameters should be made in line with the purpose [35].
In our ANN model, parameters were determined in the model to achieve the best classification result. The number of hidden layers is set to one and contains 100 neurons while the activation function is determined as ReLu (Rectified Linear Unit), the optimization method ADAM as a solver, and the number of iterations is determined as 200. The number of inputs is 4096, which is equal to the number of data from the fc7 layer of the CNN model. The number of output was determined as 3, which is our class number.
4.3Support Vector Machine (SVM)
SVM was basically created to solve binary classification problems. The hyperplane is used to be able to make the classification. With this plane, classification is made by dividing the classes into two, however, more than one hyperplane is required for the classifications made with datasets containing many classes. SVM classifiers with multiple hyperplanes are called multi-class SVMs [36]. The model used in our study was also a multi-class SVM model. In the model used within the scope of the study, RBF (Radial Basis Function) was used as the kernel. The number of iterations, on the other hand, was limited to 100.
4.4Logistic Regression (LR)
Logistic Regression is a machine learning method used for classifying categorical or numerical data. The logistic function can also be called the sigmoid function. In the LR method, in which the target can be estimated from one or more variables, it is not necessary for the variables to show normal distribution. LR predicts probability, not outcomes themselves. The value obtained by multiplying the values given as input with the weights that provide learning is inserted into the sigmoid function. After this stage, the obtained error value is sent to the input function in order to reduce the error rate, thus the model becomes able to classify [37]. Ridge Regularization function is used in the training of the LR model with the aim of simplifying the features of the model in order to avoid overfitting and memorization [38].
4.5Stacking model
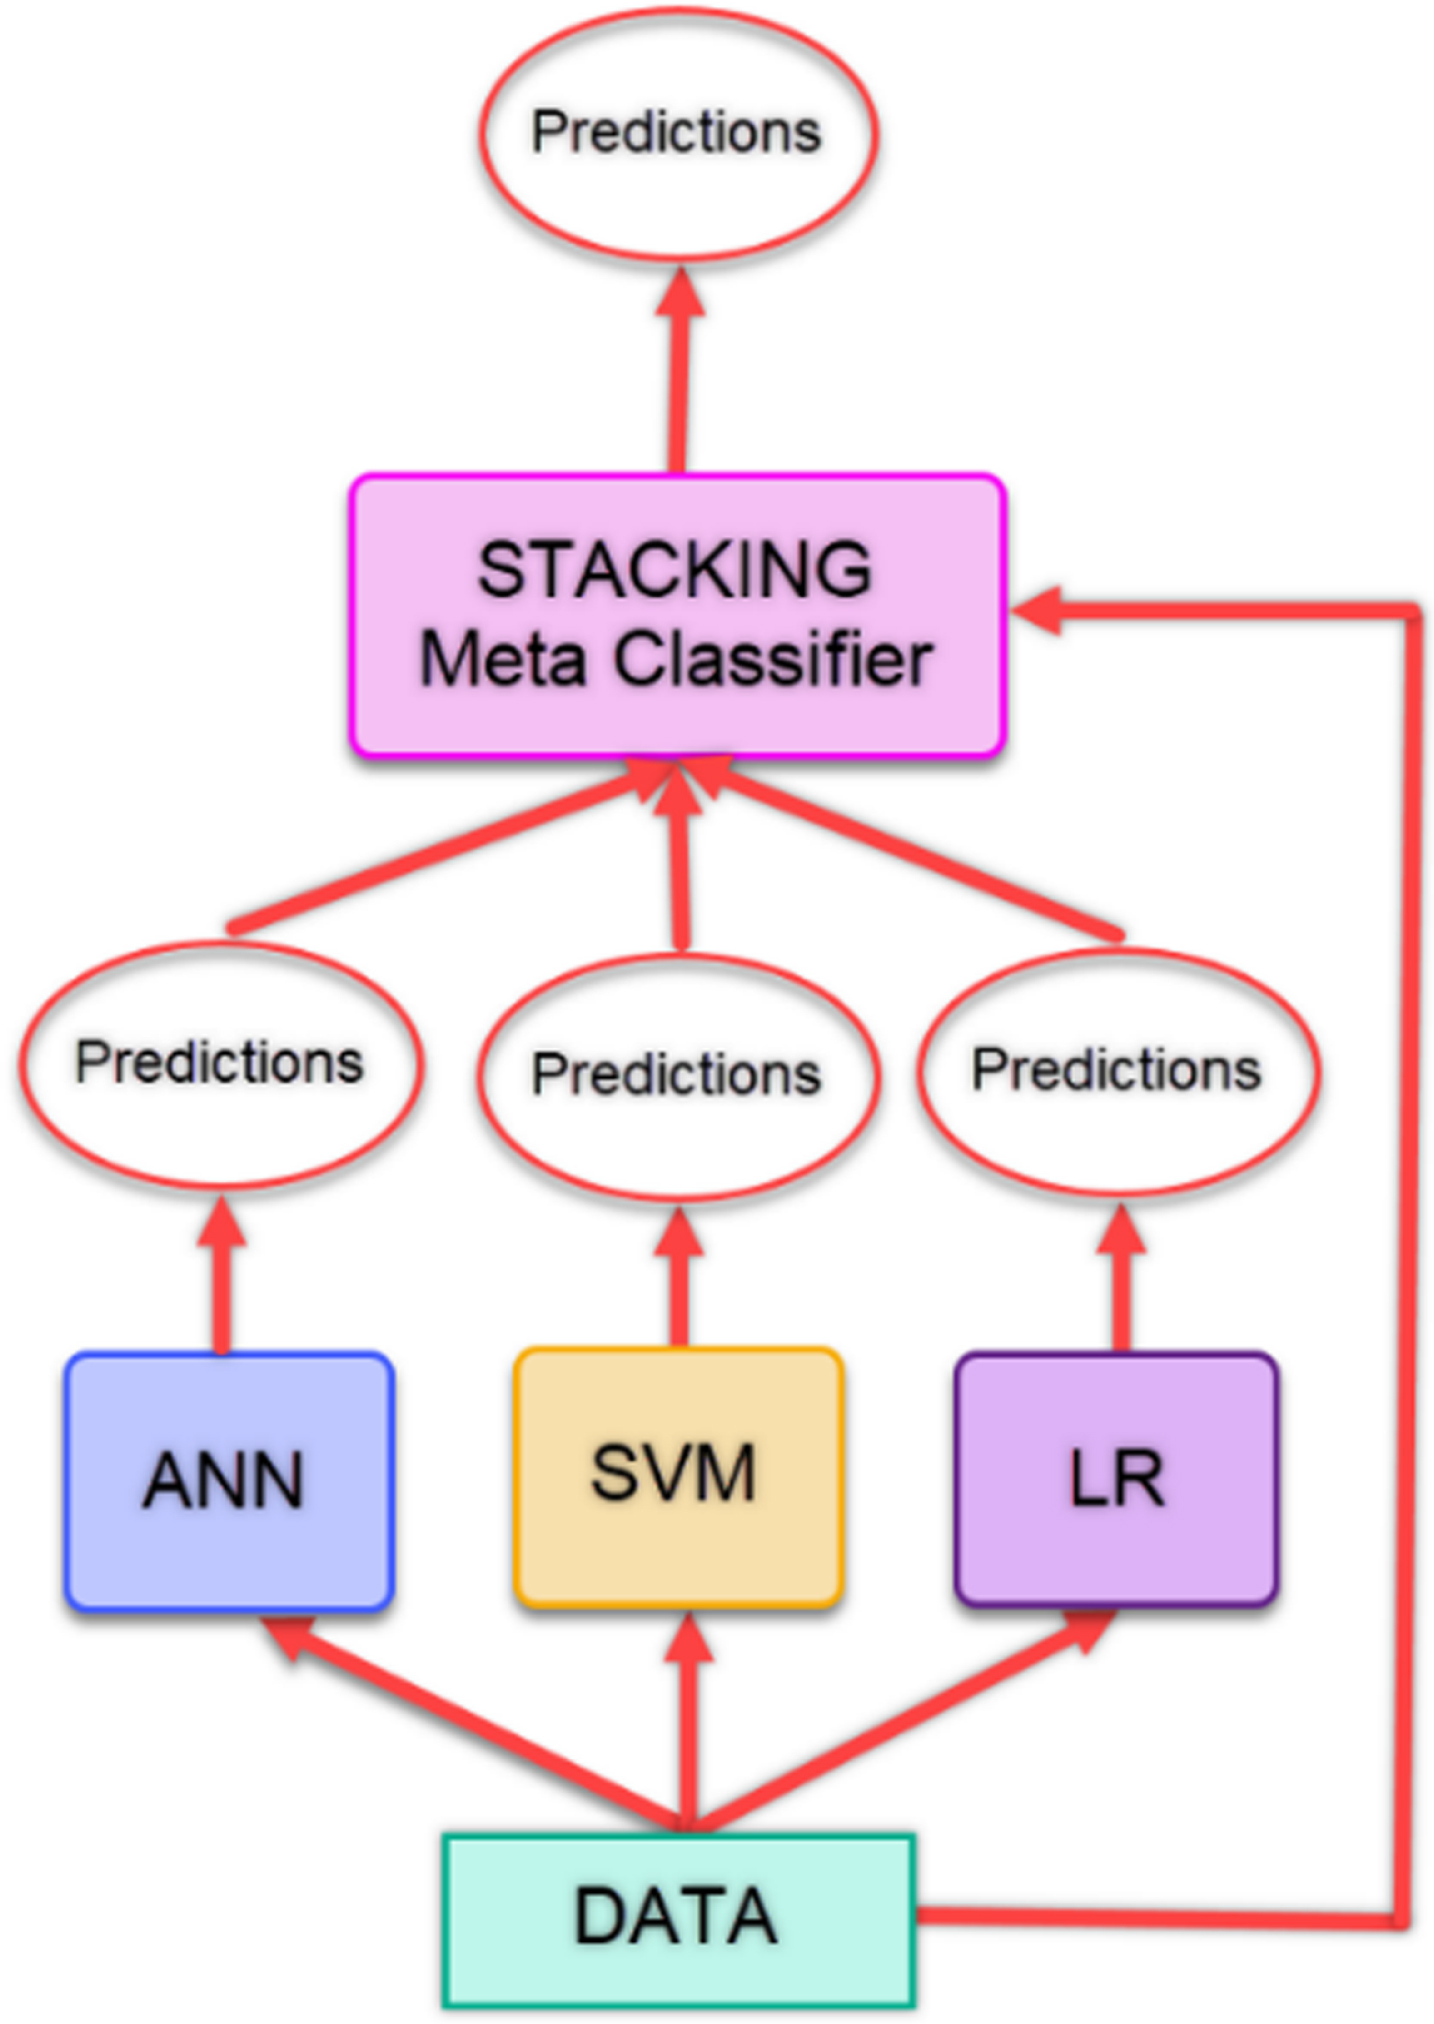
Stacking is based on the idea of creating a new classification model by combining classifiers. Regardless of the number of classifiers, the learning is performed by using the predictions from the classifiers and the data in the existing dataset, and a new model is created. With this model, predictions are made. The model takes its power from the models that constitute it and sometimes can give lower classification results than the classifiers it contains [39]. In our study, the predictions obtained from the ANN, SVM and LR models are given as input to the Stacking model. Figure 3 gives the flow chart of the stacking method used in the study.
Fig. 3
Flow diagram of stacking method.
4.6Performance metrics
Confusion matrix was used to evaluate the performance of the classification models used in the study. Commonly used performance measures, accuracy, precision, recall, and F-1 score values were obtained from the confusion matrix. In order to obtain these values, there are 4 values in the confusion matrix as True positive (TP), true negative (TN), false positive (FP) and false negative (FN) values. TP and TN indicate the number of correctly predicted positive and negative samples, FP and FN indicate the number of incorrectly predicted positive and negative samples. Performance metrics are calculated with the formulas in Table 5 using these 4 values.
Table 5
Formulas for performance metrics
| Performance Metrics | Formula |
| Accuracy | ((TP + TN)/n)*100 |
| Precision | TP/(TP + FP) |
| Recall | TP/(TP + FN) |
| F-1 Score | 2TP/(2TP + FP + FN) |
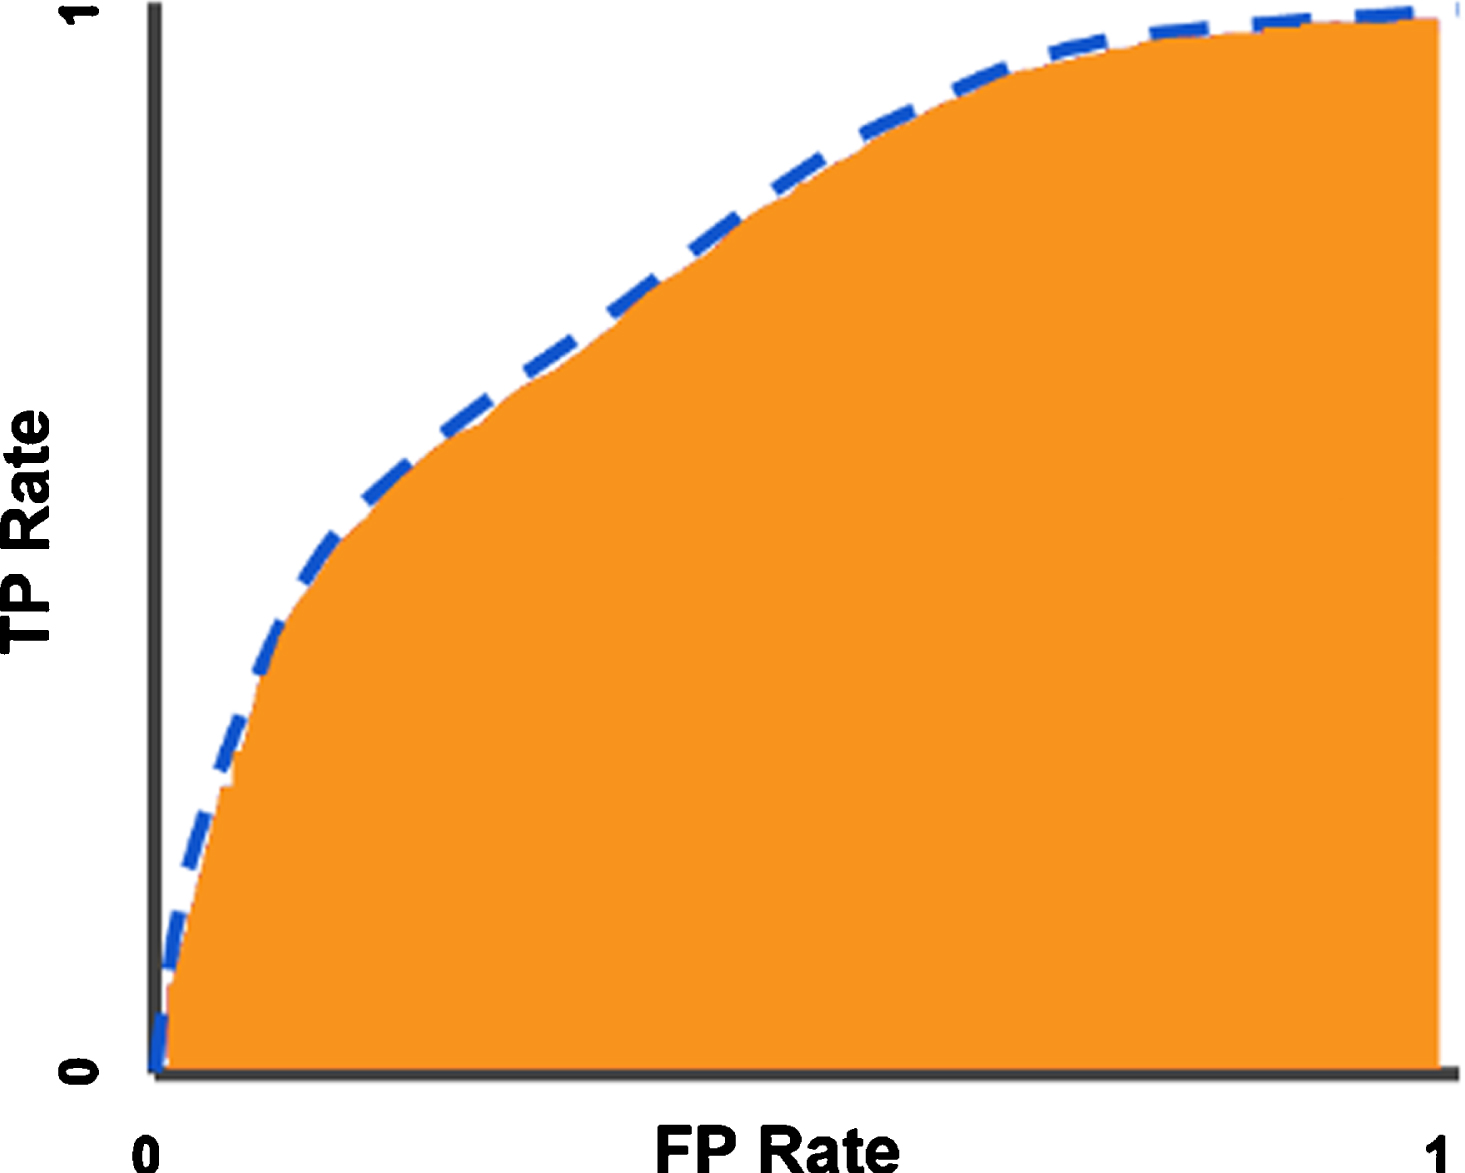
ROC (Receiver Operator Characteristics Curve) curves are also used to measure the performance of a classification model. In ROC curve, sensitivity is shown on the y-axis and specificity is shown on the x-axis. These values are shown as dots and eventually converge, resulting in the ROC curve. The area under the curve is called AUC (Area under the ROC curve) and the AUC value varies between 0 and 1. As this value approaches 1, the predictive value increases, and as it approaches 0, the predictive value decreases [40]. In Fig. 4, the ROC curve and AUC area are shown.
Fig. 4
ROC curve (blue dotted line) and AUC area (Orange zone).
5Results
CNN models were trained by using COVID-19, Viral Pneumonia, and Normal lung X-ray images. Then, trainings and tests were performed by giving the features obtained from this model as input to ANN, SVM, LR, and Stacking models. In the training phase, a computer with Intel i5 2.4 GHz CPU and 8 GB Ram was used. In order to make image processing stages faster, 896 Cuda core NVIDIA GTX 1650 Ti graphics card with DDR6 4GB Ram is utilized. In the CNN model, the VGG19 network structure and the trained model were used. Again, 4096 vector features were obtained from the images with the CNN model. These properties are vectorial values from fc7, the penultimate layer of the VGG19 network. Then, the obtained vectorial values were given as an input to the ANN, SVM, and LR models and the stacking structure. To be able to evaluate the classification success objectively, k-fold cross-validation was used in the evaluation of each model and the k value was determined as 5. 4 models were used in the study, as a result of ANN, SVM, LR, and the stacking method which is a combination of these three models. First, a model was obtained by training the ANN model used in the study with a network structure containing 100 hidden neurons, and an iteration number of 200. Table 6 shows the classification estimate of the trained ANN model with the confusion matrix.
Table 6
Confusion matrix for ANN model
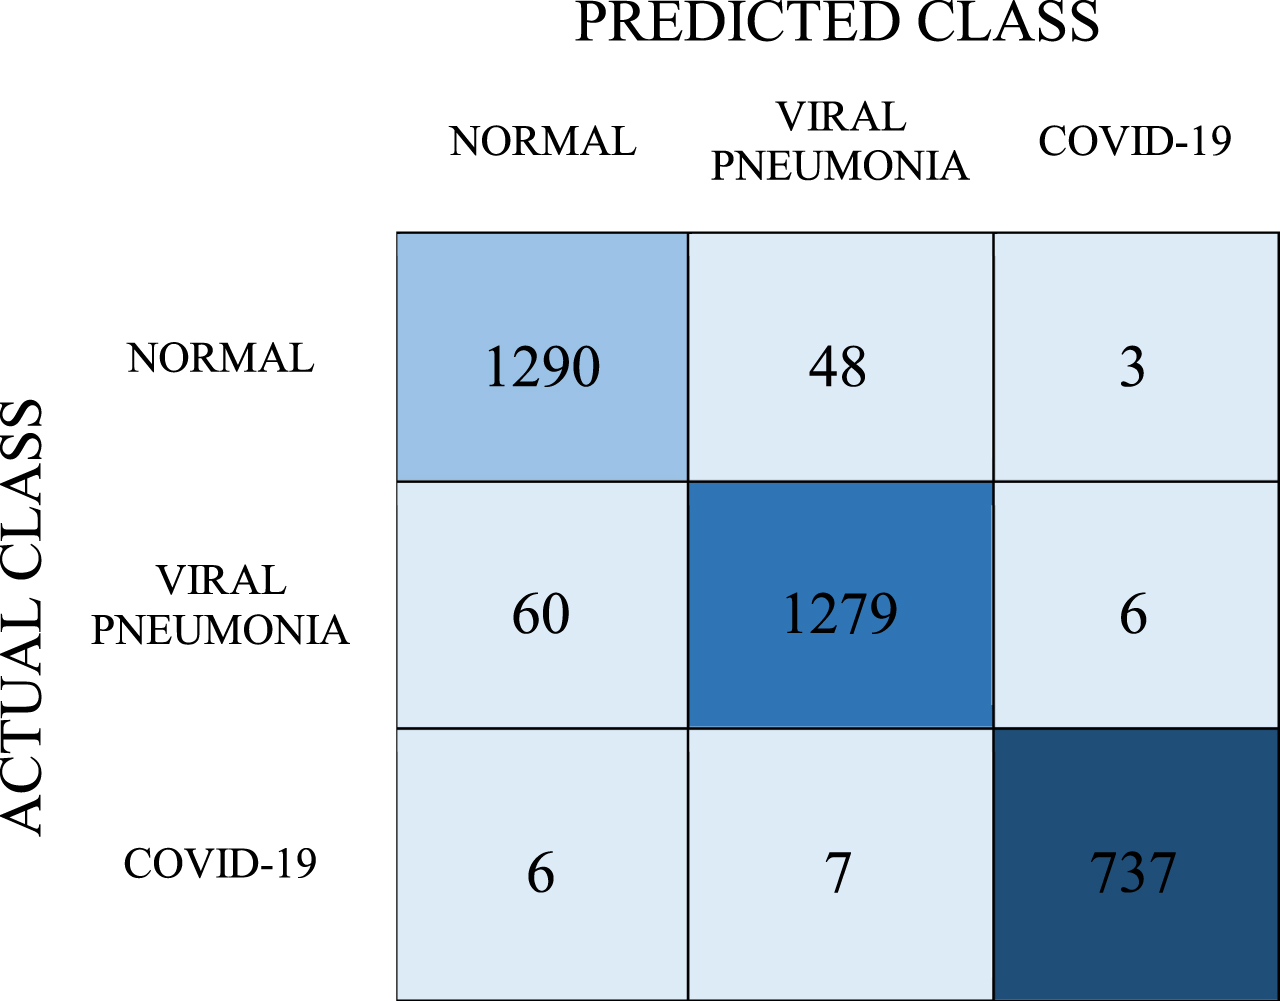 |
As mentioned before, the cross-validation method was used to objectively evaluate the estimation accuracy. 737 of the samples in the COVID-19 class were correctly predicted as a result of the tests. 1290 of the samples were estimated as normal and 1279 as viral pneumonia. Recall, precision, F-1 score values were obtained as 0.962, 0.962, and 0.962, respectively, while the classification success was determined as 96.2%. The AUC value for the ANN model was found to be 0.994.
In the second stage of the experiments, the SVM model was created. In training this model, the RBF kernel is set as hyper-parameter. Afterwards, the classification success of the model was tested. Predictions obtained with the SVM model are shown in the confusion matrix in Table 7.
Table 7
Confusion matrix for SVM model
 |
With the SVM model, the number of correct predictions for the COVID-19 class was 729, and the number of incorrect predictions was 21. Inaccurate predictions of these classes were found to be 199 for the normal class and 98 for viral pneumonia. The average classification success of this model was determined as 90.7%. When the values in the confusion matrix were calculated, the obtained recall, precision, and F-1 score values are 0.907, 0.909, and 0.907, respectively. The AUC value of this model was determined as 0.981.
The tests were carried out with the LR model in the third stage of the experiments. The prediction values obtained as a result of the tests performed with this model are shown in the confusion matrix in Table 8.
Table 8
Confusion matrix for LR model
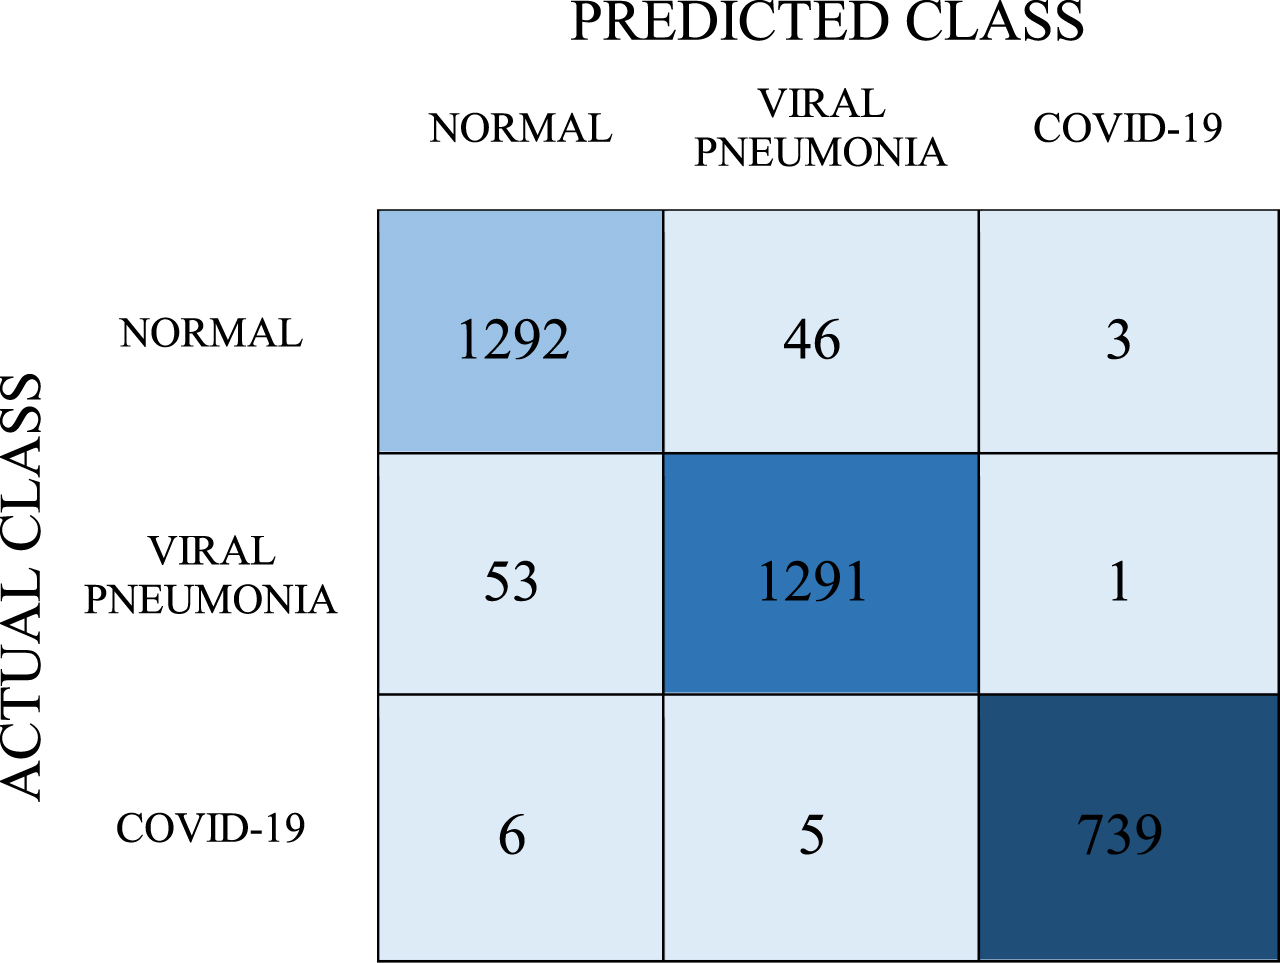 |
As can be seen in Table 8, according to the results of the tests performed with the LR model, the number of correct predictions for the COVID-19 class is 739 and the number of incorrect predictions is 11. In this model, respectively, the number of correct predictions for normal and viral pneumonia classes is 1292 and 1291, and the number of incorrect predictions is 49 and 54. Accordingly, the average classification success in this model was found to be 96.7%. As a result, recall, precision, and F-1 score values were found as 0.967, 0.967, and 0.967, respectively.
With the stacking model experiment which is the last experiment, it was aimed to achieve better classification success by combining the powers of the 3 models. The estimation values obtained from the Stacking Model are given in the confusion matrix in Table 9.
Table 9
Confusion matrix for Stacking Model
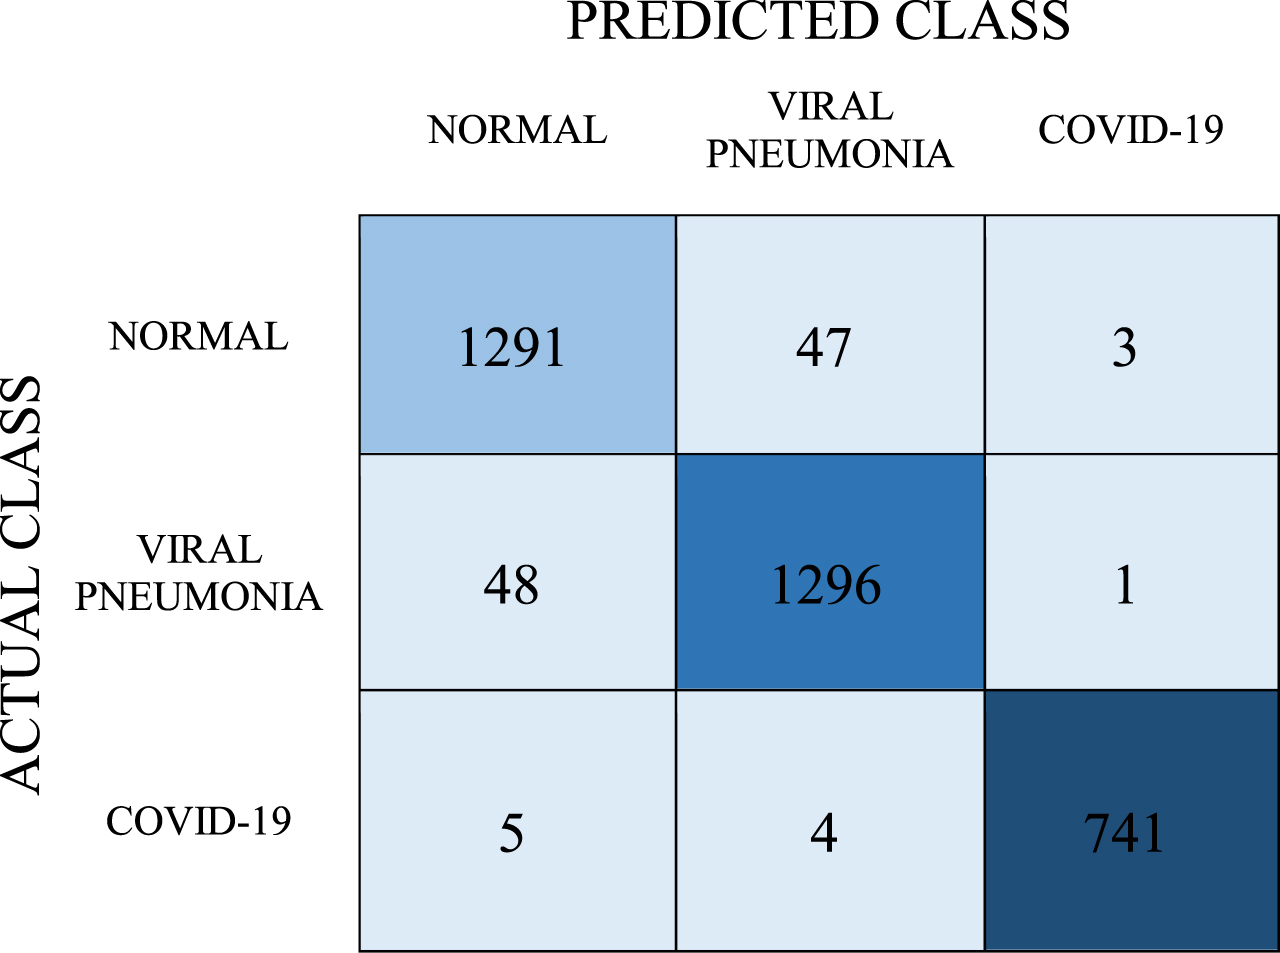 |
In the stacking model, the number of correct predictions for the COVID-19 class was 741, and the number of incorrect predictions was 9. In the normal class, the number of correct predictions was 1291 and the number of wrong predictions was 50. In the viral pneumonia class, the number of correct predictions is 1296 while the number of incorrect predictions is 49. When calculations were made with the data given in Table 9, the recall, precision, and F-1 score values were found to be 0.969, 0.969, and 0.969, respectively. The average classification success of the model, on the other hand, was determined as 96.9%.
Due to the different the number of images in each class, the classification success of the models for each class may also differ. Therefore, the classification success of the models was also calculated according to the classes. The average classification successes of the models are shown in Table 10, and the classification successes of each class are shown in Table 11.
Table 10
Average classification accuracy of models and performance metrics
| Classifier | AUC | Precision | Recall | F-1 score | Average Accuracy (%) |
| ANN | 0.994 | 0.962 | 0.962 | 0.962 | 96.2 |
| SVM | 0.981 | 0.909 | 0.907 | 0.907 | 90.7 |
| LR | 0.996 | 0.967 | 0.967 | 0.967 | 96.7 |
| Stacking | 0.994 | 0.969 | 0.969 | 0.969 | 96.9 |
Table 11
Classification accuracy of models according to classes
| Methods | Accuracy | ||
| Normal | Viral Pneumonia | COVID-19 | |
| ANN | 96.6 | 96.5 | 99.4 |
| SVM | 91.9 | 91.8 | 97.8 |
| LR | 96.9 | 96.9 | 99.6 |
| Stacking | 97 | 97.1 | 99.6 |
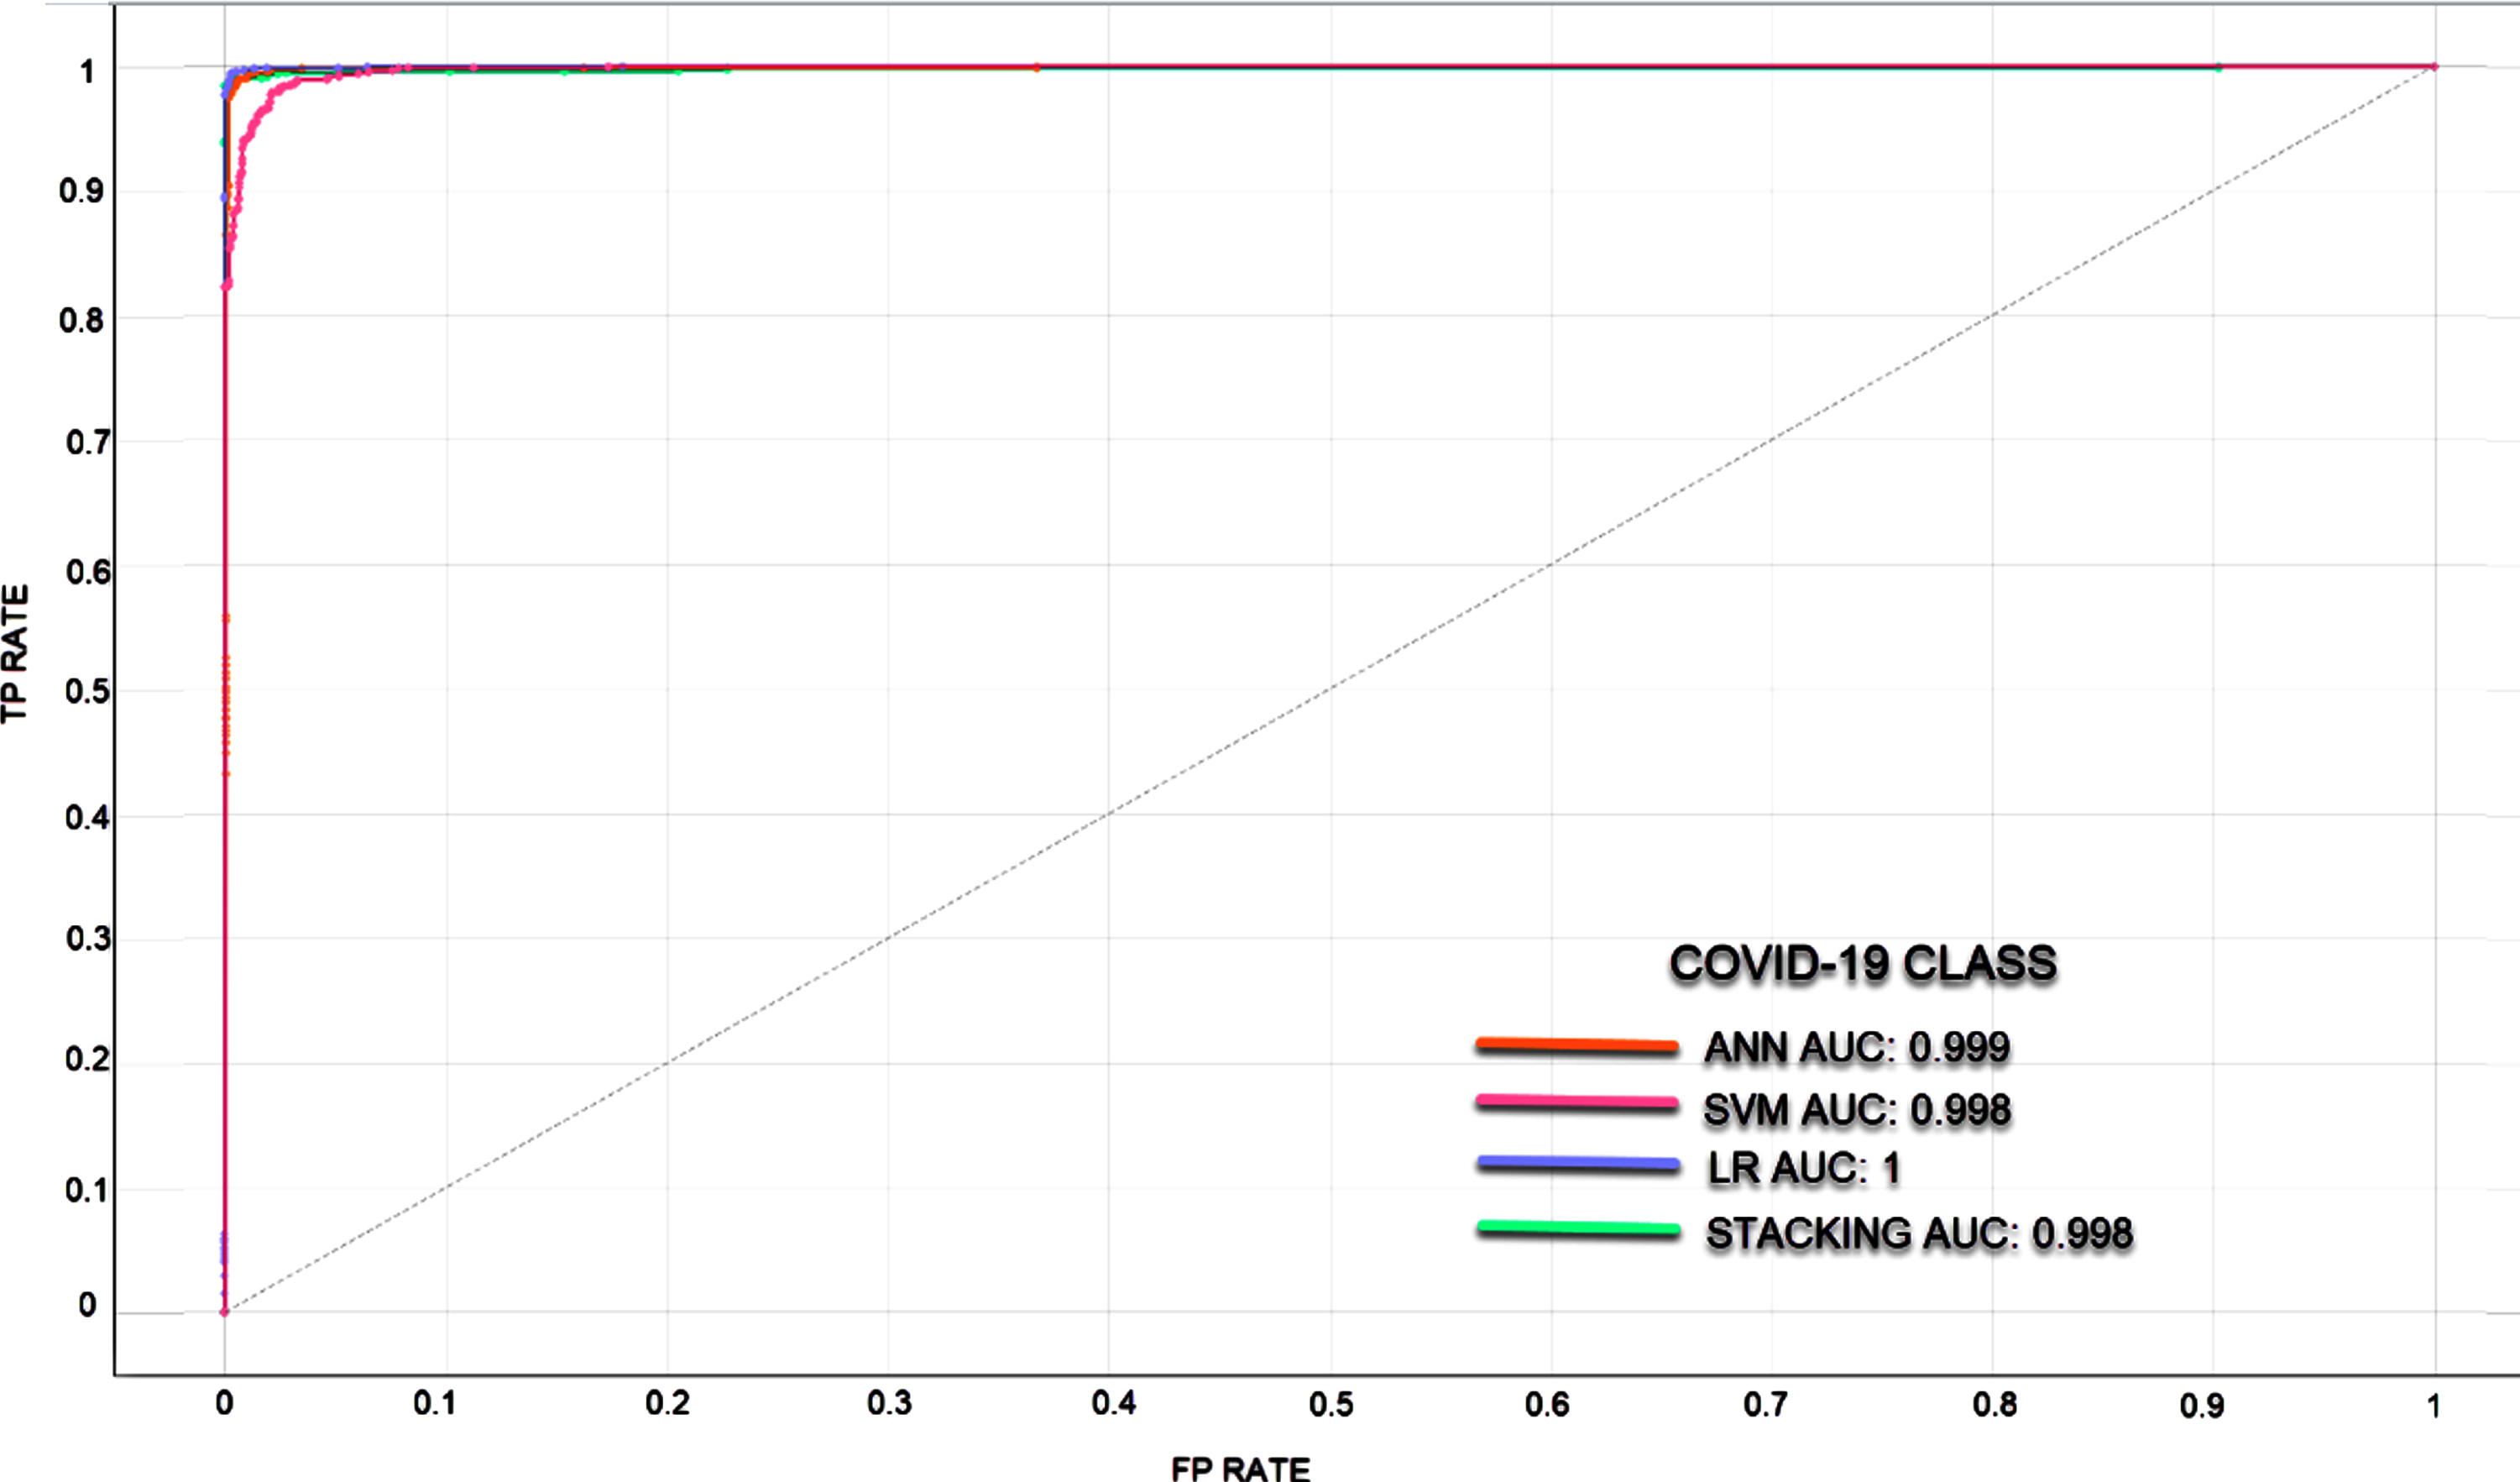
In classifications made with unbalanced datasets where the number of data in the classes is different, ROC curves and AUC values were calculated to measure the classification success of the models. It is understood that the larger the AUC value, the better the predictive ability of the classifier. Since the classification success of the models in different classes also differs, ROC curves and AUC values are given separately for each class. In Figs. 5–7, ROC curves and AUC values of the models are given.
Fig. 5
ROC curve for Normal Class.
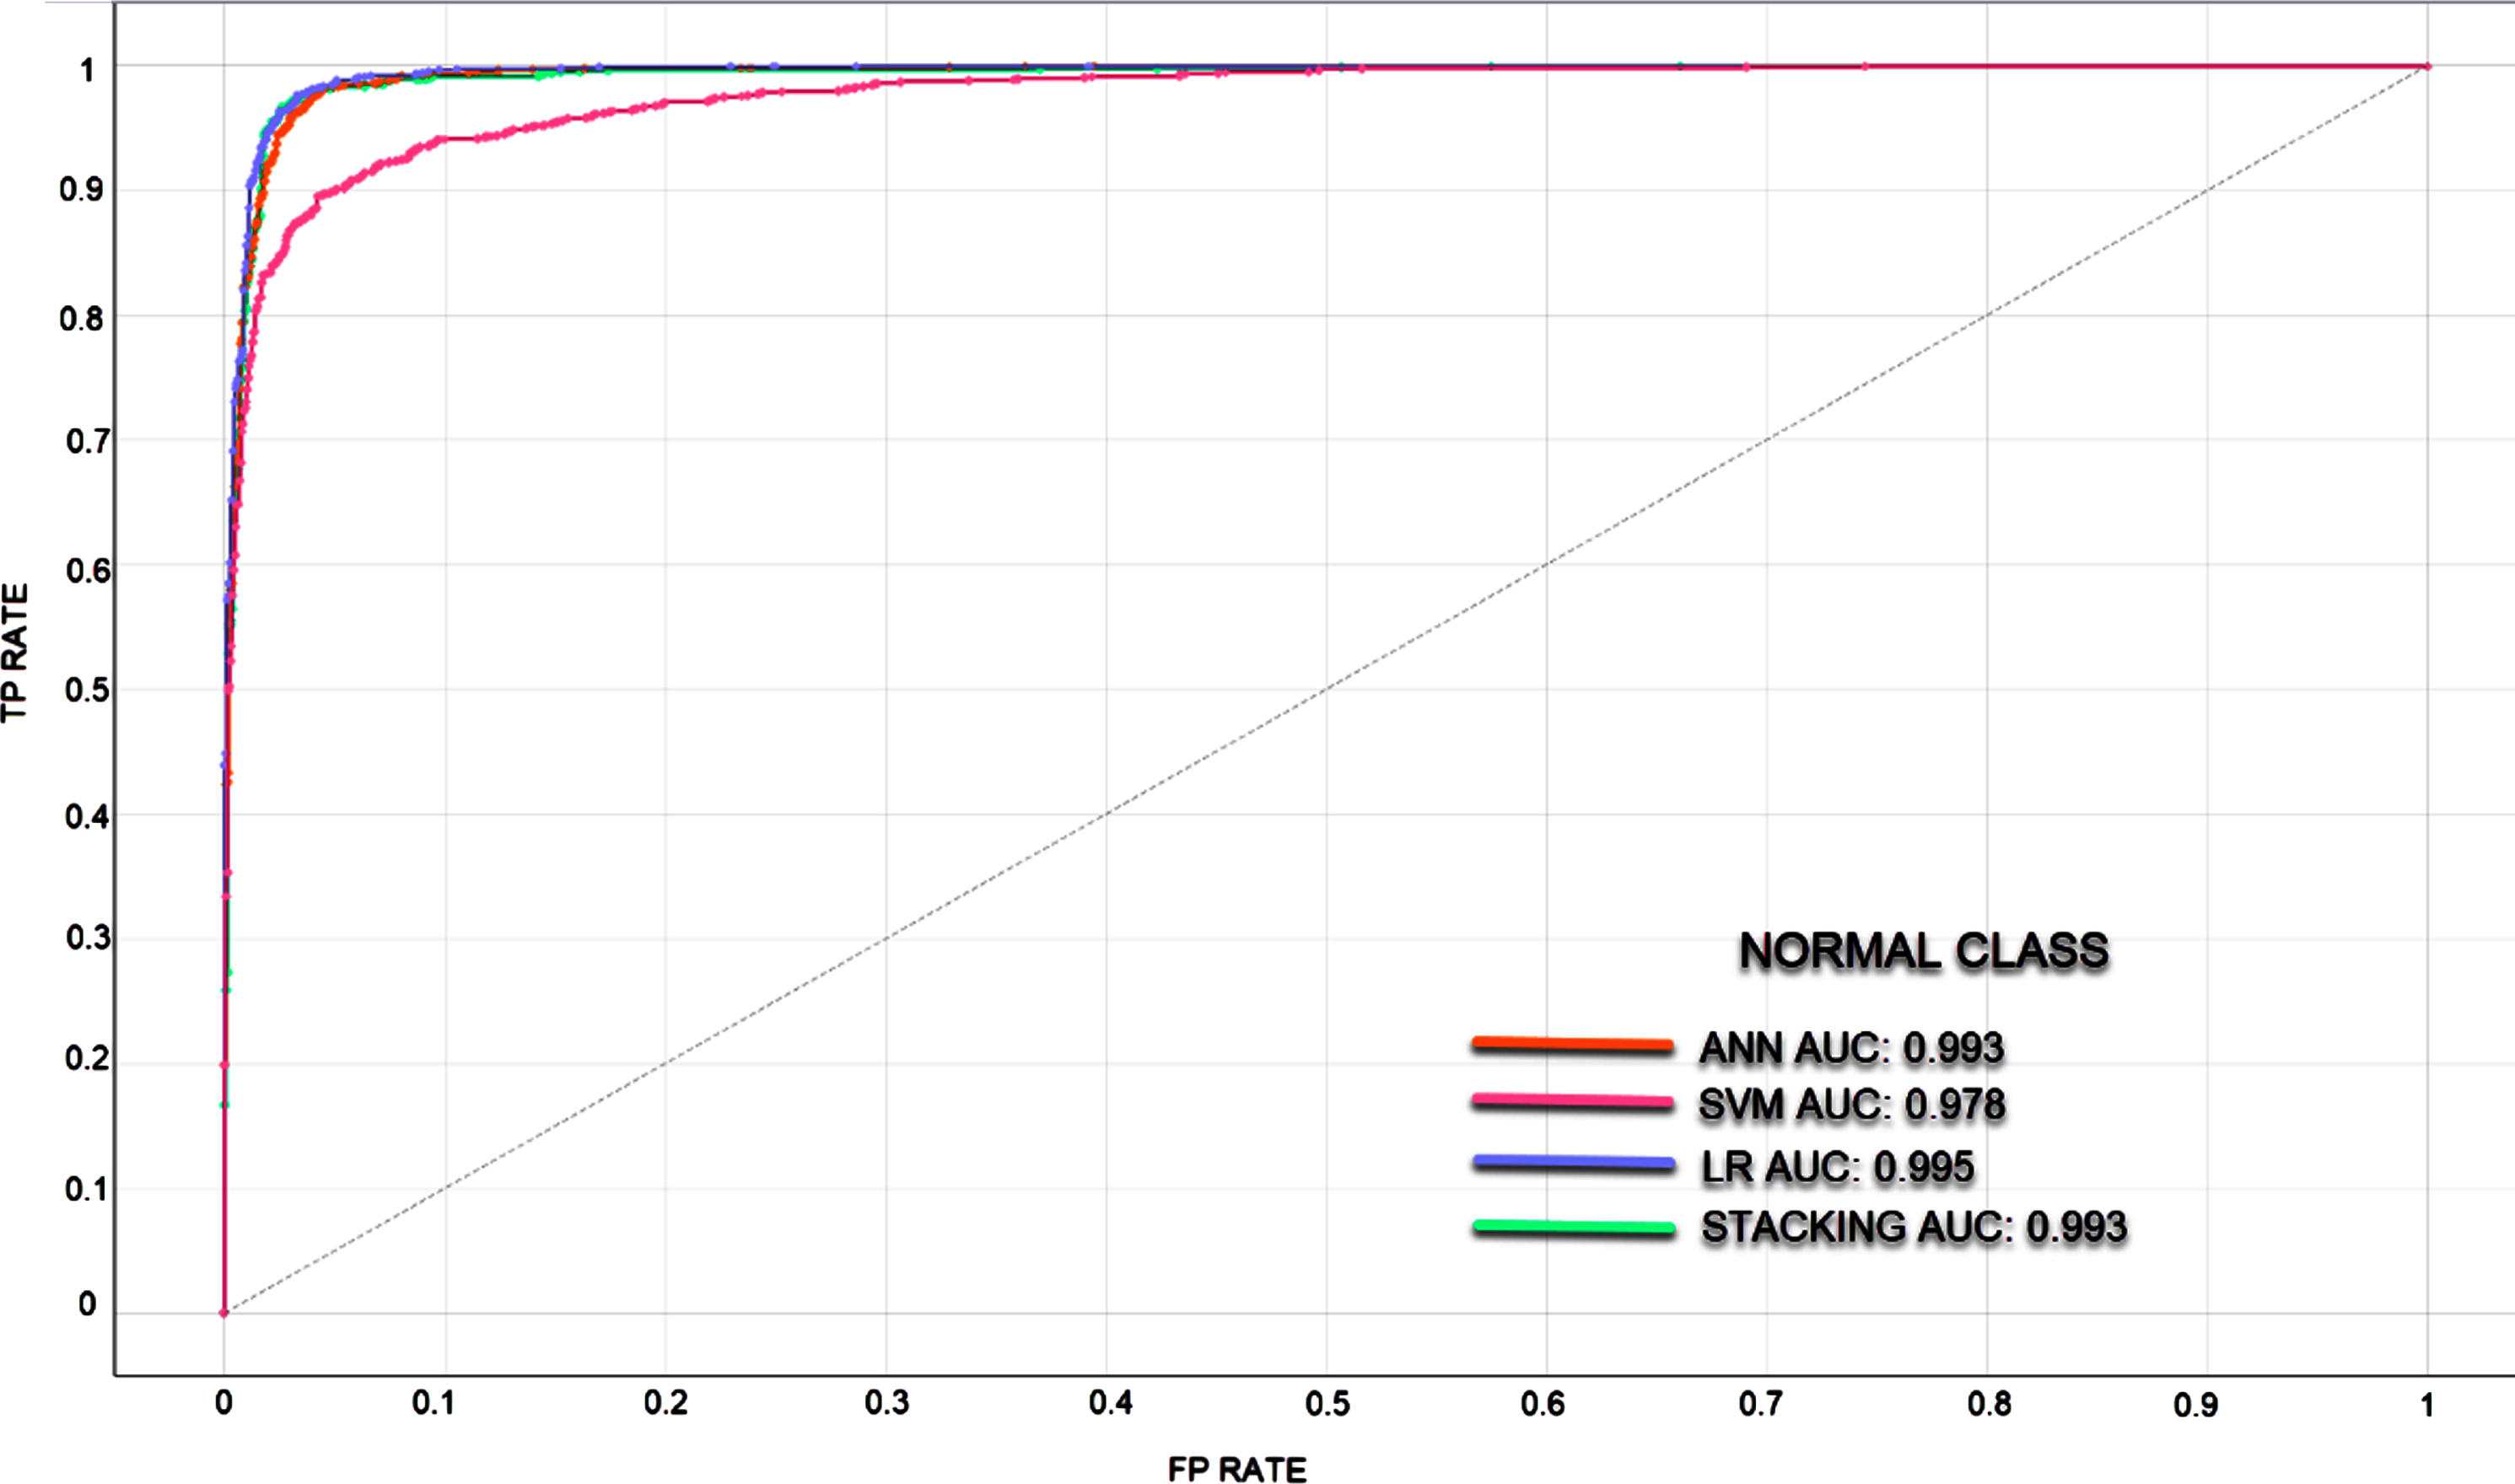
Fig. 6
ROC curve for Viral Pneumonia Class.
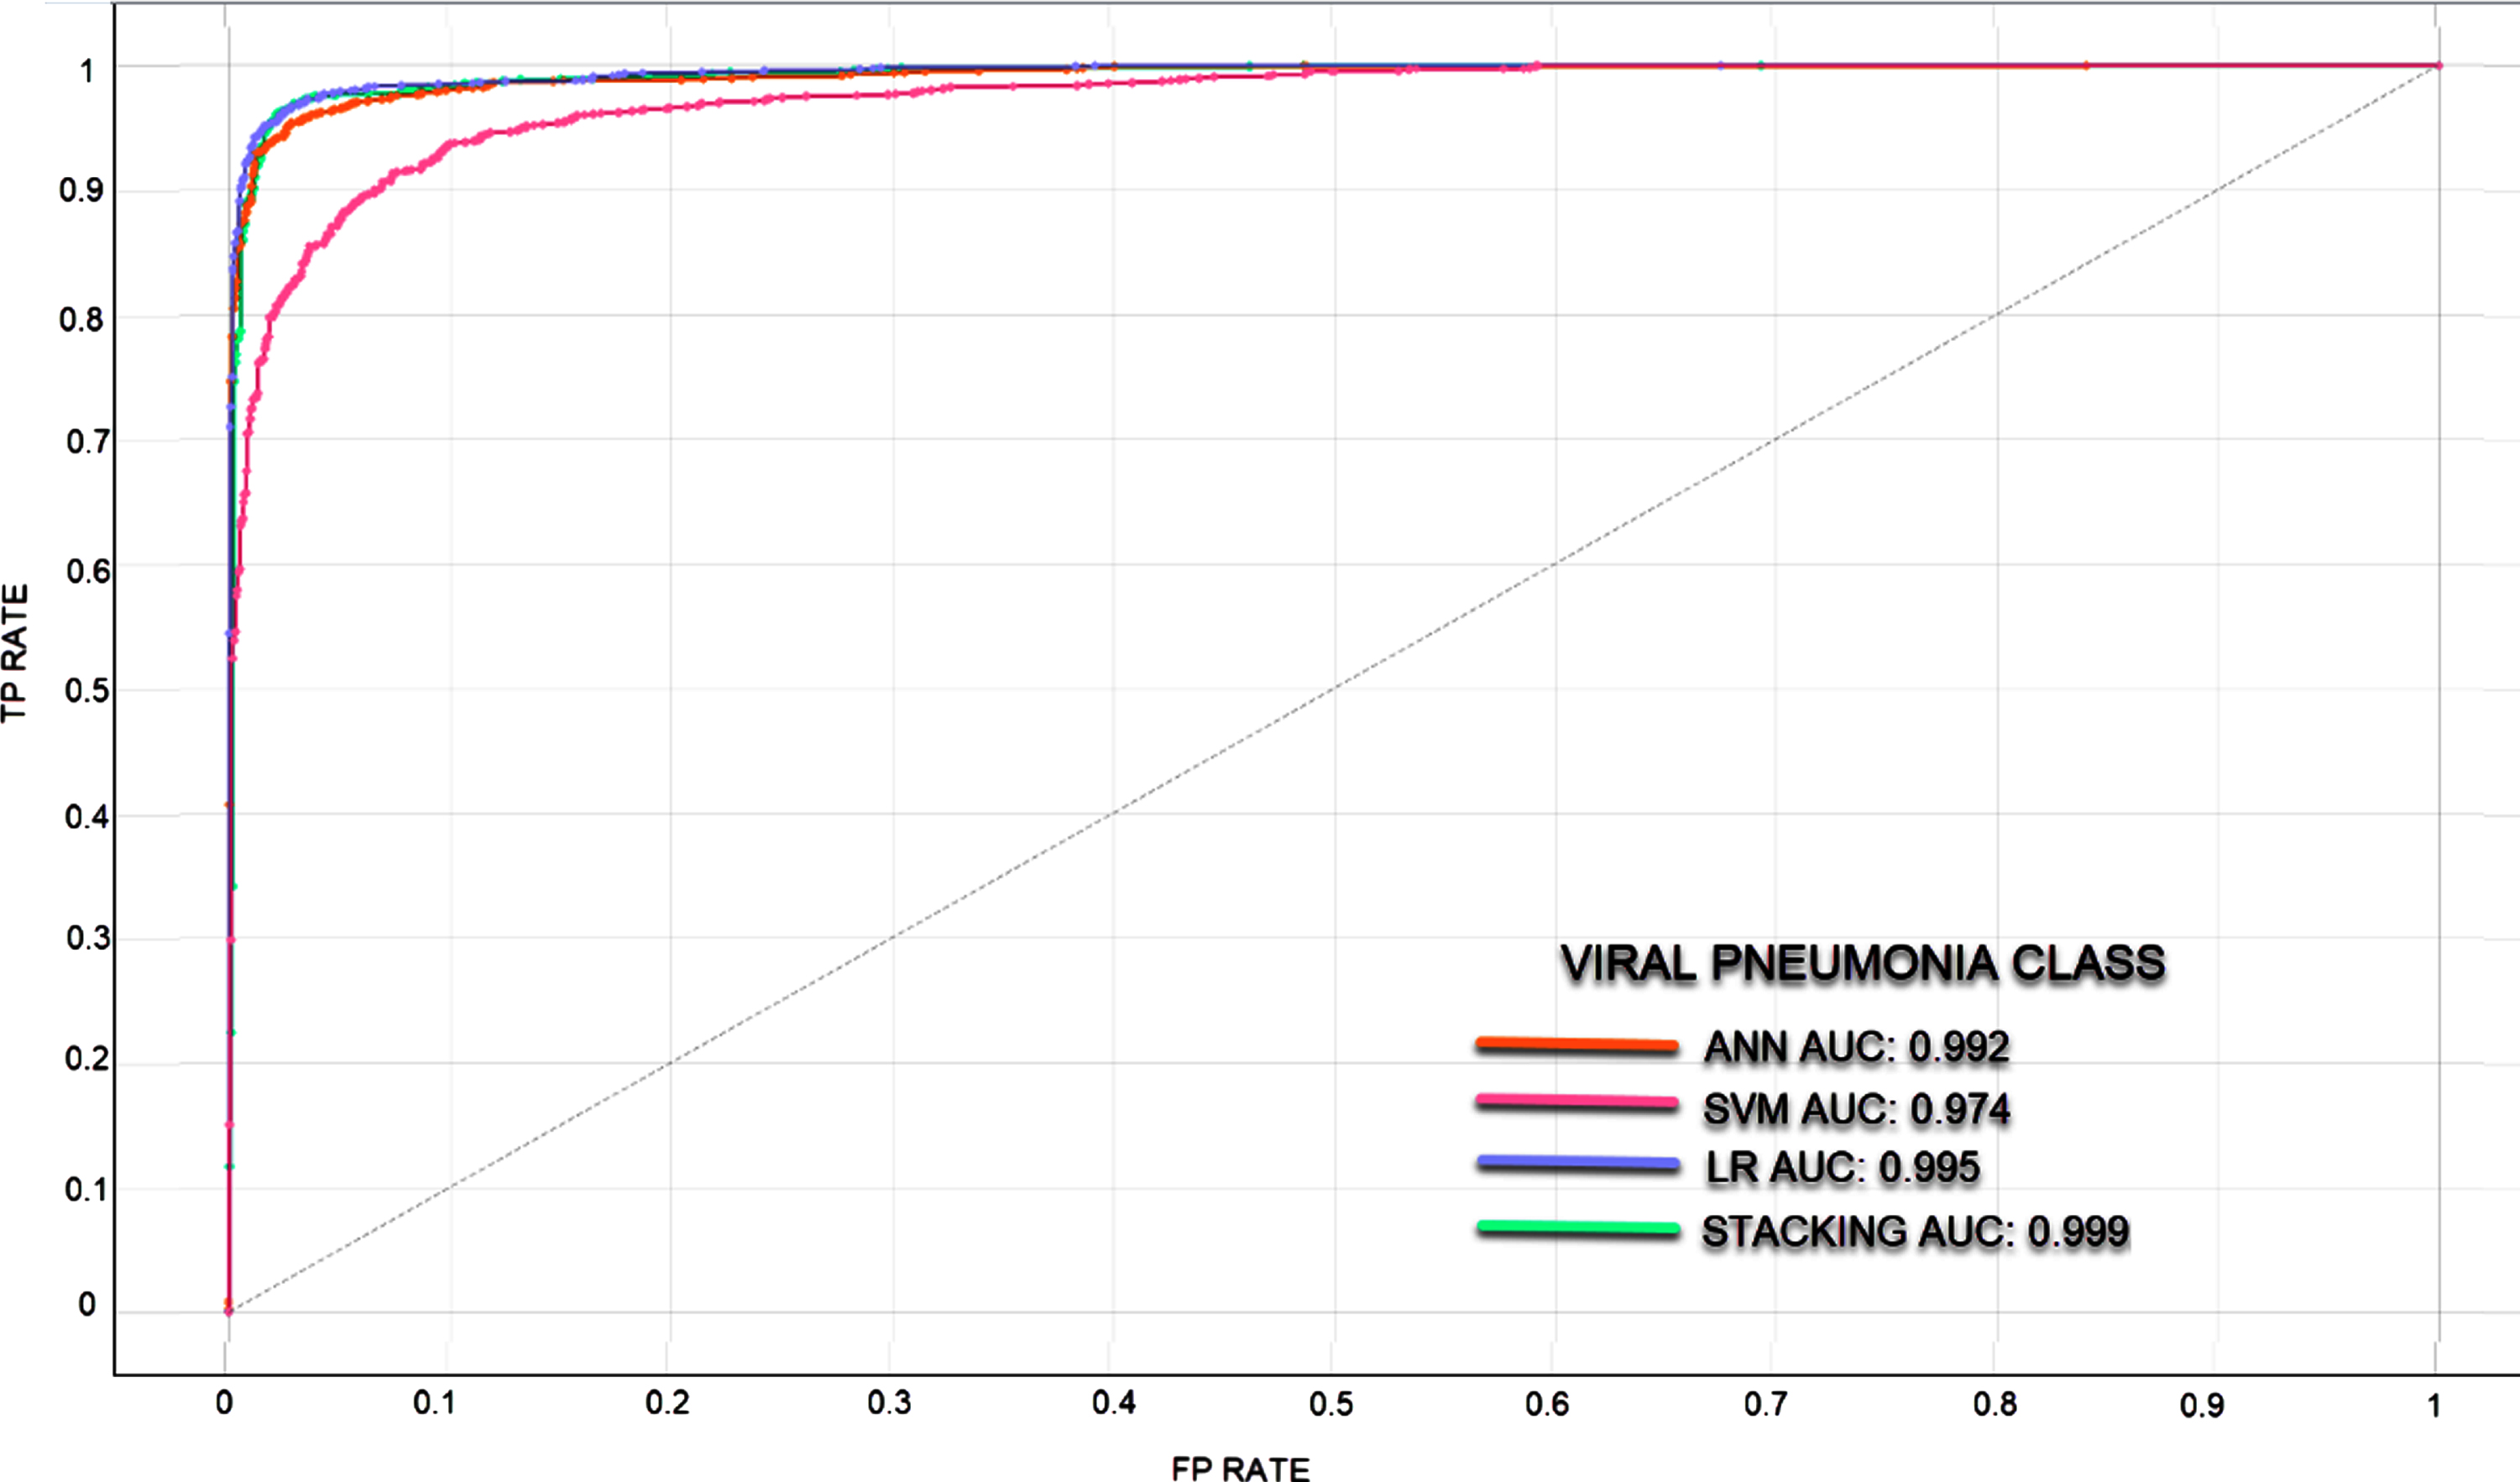
Fig. 7
ROC curve for COVID-19 Class.
6Discussion
In the rapid diagnosis of COVID-19, PCR tests, tomography images and X-ray images have been used. An expert is needed for the analysis of the obtained images, which may decelerate the speed of diagnosis. In the proposed method, COVID-19 diagnosis can be made through image processing without requiring time and experts. In the study where the experimental results of four models were analyzed, the most successful result has been achieved via the stacking model. The stacking model takes its power from the other models. The success rates of SVM, ANN, LR, and Stacking models were determined as 90.2%, 96.2%, 96.7%, and 96.9%, respectively. These are the average classification achievements and each model showed different success in 3 classes. The stacking model has been the most successful model in all three classes. Normal, Viral Pneumonia and COVID-19 classes were classified with success rates of 97%, 97.1%, and 99.6%, respectively. The LR model has also been able to classify the COVID-19 class with a success rate of 99.6%. When the ROC and AUC values are examined, it was observed that the models can learn the image features at a pretty good rate.
In this study, more COVID-19 data were used than the studies in Tables 1–3. The average classification success in this workshop was 96.9%. There are studies that have achieved success above this classification success. However, when Tables 1–3 are examined, the number of data in studies with a classification success higher than 96.9%is low or a 2-class classification has been made. As a result, it can be said that higher classification success is achieved when compared to studies using equivalent datasets.
In order to be able to increase the average classification success to higher levels, more images are required. It is thought that the number of these data will increase in time and better results can be obtained in classification. The fact that the medical device elements attached to the patients are included in the X-ray images has been identified as another factor reducing the classification success. In future studies, it is predicted that classification success will increase through chest X-ray images free from the images of different objects and also with a large number of images.
References
[1] | Ouchicha C. , Ammor O. , Meknassi M. , CVDNet: A novel deep learning architecture for detection of coronavirus (COVID-19) from chest x-ray images, Chaos, Solitons & Fractals 140: ((2020) ), 110245. |
[2] | Zu Z.Y. , et al., Coronavirus disease (COVID-19): a perspective from China, Radiology 296: (2) ((2020) ), E15–E25. |
[3] | Khan A.I. , Shah J.L. , Bhat M.M. , Coronet: A deep neural network for detection and diagnosis of COVID-19 from chest x-ray images, Computer Methods Programs in Biomedicine 196: ((2020) ), 105581. |
[4] | Mahase E. , Coronavirus: COVID-19 has killed more people than SARS and MERS combined, despite lower case fatality rate, BMJ, British Medical Journal 368: ((2020) ), m641. |
[5] | Ai T. , et al., Correlation of chest CT and RT-PCR testing in coronavirus disease (COVID-19) in China: a report of cases, Radiology 296: (2) ((2020) ), E32–E40. |
[6] | Minaee S. , et al., Deep-COVID: Predicting COVID-19 from chest x-ray images using deep transfer learning. arXiv preprint arXiv:.09363, 2020. |
[7] | Albahli S. , Albattah W. , Detection of coronavirus disease from X-ray images using deep learning and transfer learning algorithms, Journal of X-ray Science and Technology 28: (5) ((2020) ), 841–850. |
[8] | Pathak Y. , et al., Deep Transfer Learning based Classification Model for COVID-19 Disease, IRBM, 2020. |
[9] | Krizhevsky A. , Sutskever I. , Hinton G.E. , Imagenet classification with deep convolutional neural networks, Communications of the ACM 60: (6) ((2017) ), 84–90. |
[10] | Amyar A. et al., Multi-task deep learning based CT imaging analysis for COVID-19 pneumonia: Classification and segmentation, Computers in Biology Medicine 126: ((2020) ), 104037. |
[11] | Sun L. , et al., Adaptive feature selection guided deep forest for COVID-19 classification with chest ct, IEEE Journal of Biomedical Health Informatics 24: (10) ((2020) ), 2798–2805. |
[12] | Ardakani A.A. , et al., Application of deep learning technique to manage COVID-19 in routine clinical practice using CT images: Results of 10 convolutional neural networks, Computers in Biology Medicine (2020), 103795. |
[13] | Jaiswal A. , et al., Classification of the COVID-19 infected patients using DenseNet201 based deep transfer learning, Journal of Biomolecular Structure Dynamics (2020), 1–8. |
[14] | Barstugan M. , Ozkaya U. , Ozturk S. Coronavirus (COVID-19) classification using ct images by machine learning methods. arXiv preprint arXiv:.09424, 2020. |
[15] | Ozkaya U. , Ozturk S. , Barstugan M. Coronavirus (COVID-19) Classification using Deep Features Fusion and Ranking Technique. arXiv preprint arXiv:.03698, 2020. |
[16] | Ozkaya U. , et al., Classification of COVID-19 in Chest CT Images using Convolutional Support Vector Machines. arXiv preprint arXiv:.05746, 2020. |
[17] | Mahmud T. , Rahman M.A. , Fattah S.A. , CovXNet: A multi-dilation convolutional neural network for automatic COVID-19 and other pneumonia detection from chest X-ray images with transferable multi-receptive feature optimization, Computers in Biology Medicine 122: ((2020) ), 103869. |
[18] | Marques G. , Agarwal D. , de la Torre Díez I. , Automated medical diagnosis of COVID-19 through EfficientNet convolutional neural network, Applied Soft Computing 96: ((2020) ), 106691. |
[19] | Ghoshal B. , Tucker A. Estimating uncertainty and interpretability in deep learning for coronavirus (COVID-19) detection. arXiv preprint arXiv:.10769, 2020. |
[20] | Abbas A. , Abdelsamea M.M. , Gaber M.M. Classification of COVID-19 in chest X-ray images using DeTraC deep convolutional neural network. arXiv preprint arXiv:.13815, 2020. |
[21] | Zhong Y. Using deep convolutional neural networks to diagnose COVID-19 from chest x-ray images. arXiv preprint arXiv:.09695, 2020. |
[22] | Asif S. , et al., Classification of COVID-19 from chest x-ray images using deep convolutional neural networks. medRxiv, 2020. |
[23] | Ahmed S. , et al., Reconet: Multi-level preprocessing of chest x-rays for COVID-19 detection using convolutional neural networks. medRxiv, 2020. |
[24] | Civit-Masot J. , et al., Deep learning system for COVID-19 diagnosis aid using X-ray pulmonary images, Applied Sciences 10: (13) ((2020) ), 4640. |
[25] | Nour M. , Cömert Z. , Polat K. , A novel medical diagnosis model for COVID-19 infection detection based on deep features and Bayesian optimization, Applied Soft Computing 97: ((2020) ), 106580. |
[26] | Ozturk T. , et al., Automated detection of COVID-19 cases using deep neural networks with X-ray images, Computers in Biology Medicine (2020), 103792. |
[27] | Togacar M. , Ergen B. , Comert Z. COVID-19 detection using deep learning models to exploit Social Mimic Optimization and structured chest X-ray images using fuzzy color and stacking approaches, Computers in Biology Medicine (2020), 103805. |
[28] | Ucar F. , Korkmaz D. COVIDiagnosis-Net: Deep Bayes-SqueezeNet based Diagnostic of the Coronavirus Disease 2019 (COVID-19) from X-Ray Images, Medical Hypotheses (2020), 109761. |
[29] | Kassani S.H. , et al., Automatic Detection of Coronavirus Disease (COVID-19) in X-ray and CT Images: A Machine Learning-Based Approach. arXiv preprint arXiv:.10641, 2020. |
[30] | Dansana D. , et al., Early diagnosis of COVID-19-affected patients based on X-ray and computed tomography images using deep learning algorithm, Soft Computing (2020), 1–9. |
[31] | Sarker L. , et al., COVID-densenet: A deep learning architecture to detect COVID-19 from chest radiology images (2020). |
[32] | Haghanifar A. , Majdabadi M.M. , Ko S. COVID-cxnet: Detecting COVID-19 in frontal chest x-ray images 302 using deep learning. arXiv preprint arXiv:2006.13807, 2020. |
[33] | Chowdhury M.E. , et al., Can AI help in screening viral and COVID-19 pneumonia? arXiv preprint arXiv:2003.13145, 2020. |
[34] | Yang A. , et al., Research on feature extraction of tumor image based on convolutional neural network, IEEE Access 7: ((2420) ), 24204–24213. |
[35] | Prasad S. , Savithri T.S. , Krishna I.V.M. , Comparison of Accuracy Measures for RS Image Classification using SVM and ANN Classifiers, International Journal of Electrical Computer Engineering 7: (3) ((2017) ), 1180–1187. |
[36] | Agarap A.F. An architecture combining convolutional neural network (CNN) and support vector machine (SVM) for image classification. arXiv preprint arXiv:.03541, 2017. |
[37] | Ahmed A. , Jalal A. , Kim K. , A novel statistical method for scene classification based on multi-object categorization and logistic regression, Sensors 20: (14) ((2020) ), 3871. |
[38] | Warton D.I. , Penalized normal likelihood and ridge regularization of correlation and covariance matrices, Journal of the American Statistical Association 103: (481) ((2008) ), 340–349. |
[39] | Ghalejoogh G.S. , Kordy H.M. , Ebrahimi F. , A hierarchical structure based on Stacking approach for skin lesion classification, , Expert Systems with Applications 145: ((2020) ), 113127. |
[40] | Kannan R. , Vasanthi V. Machine learning algorithms with ROC curve for predicting and diagnosing the heart disease, in Soft Computing and Medical Bioinformatics. (2019) , Springer. 63–72. |


