
Screening of COVID-19 based on the extracted radiomics features from chest CT images
Abstract
BACKGROUND AND OBJECTIVE:
Radiomics has been widely used in quantitative analysis of medical images for disease diagnosis and prognosis assessment. The objective of this study is to test a machine-learning (ML) method based on radiomics features extracted from chest CT images for screening COVID-19 cases.
METHODS:
The study is carried out on two groups of patients, including 138 patients with confirmed and 140 patients with suspected COVID-19. We focus on distinguishing pneumonia caused by COVID-19 from the suspected cases by segmentation of whole lung volume and extraction of 86 radiomics features. Followed by feature extraction, nine feature-selection procedures are used to identify valuable features. Then, ten ML classifiers are applied to classify and predict COVID-19 cases. Each ML models is trained and tested using a ten-fold cross-validation method. The predictive performance of each ML model is evaluated using the area under the curve (AUC) and accuracy.
RESULTS:
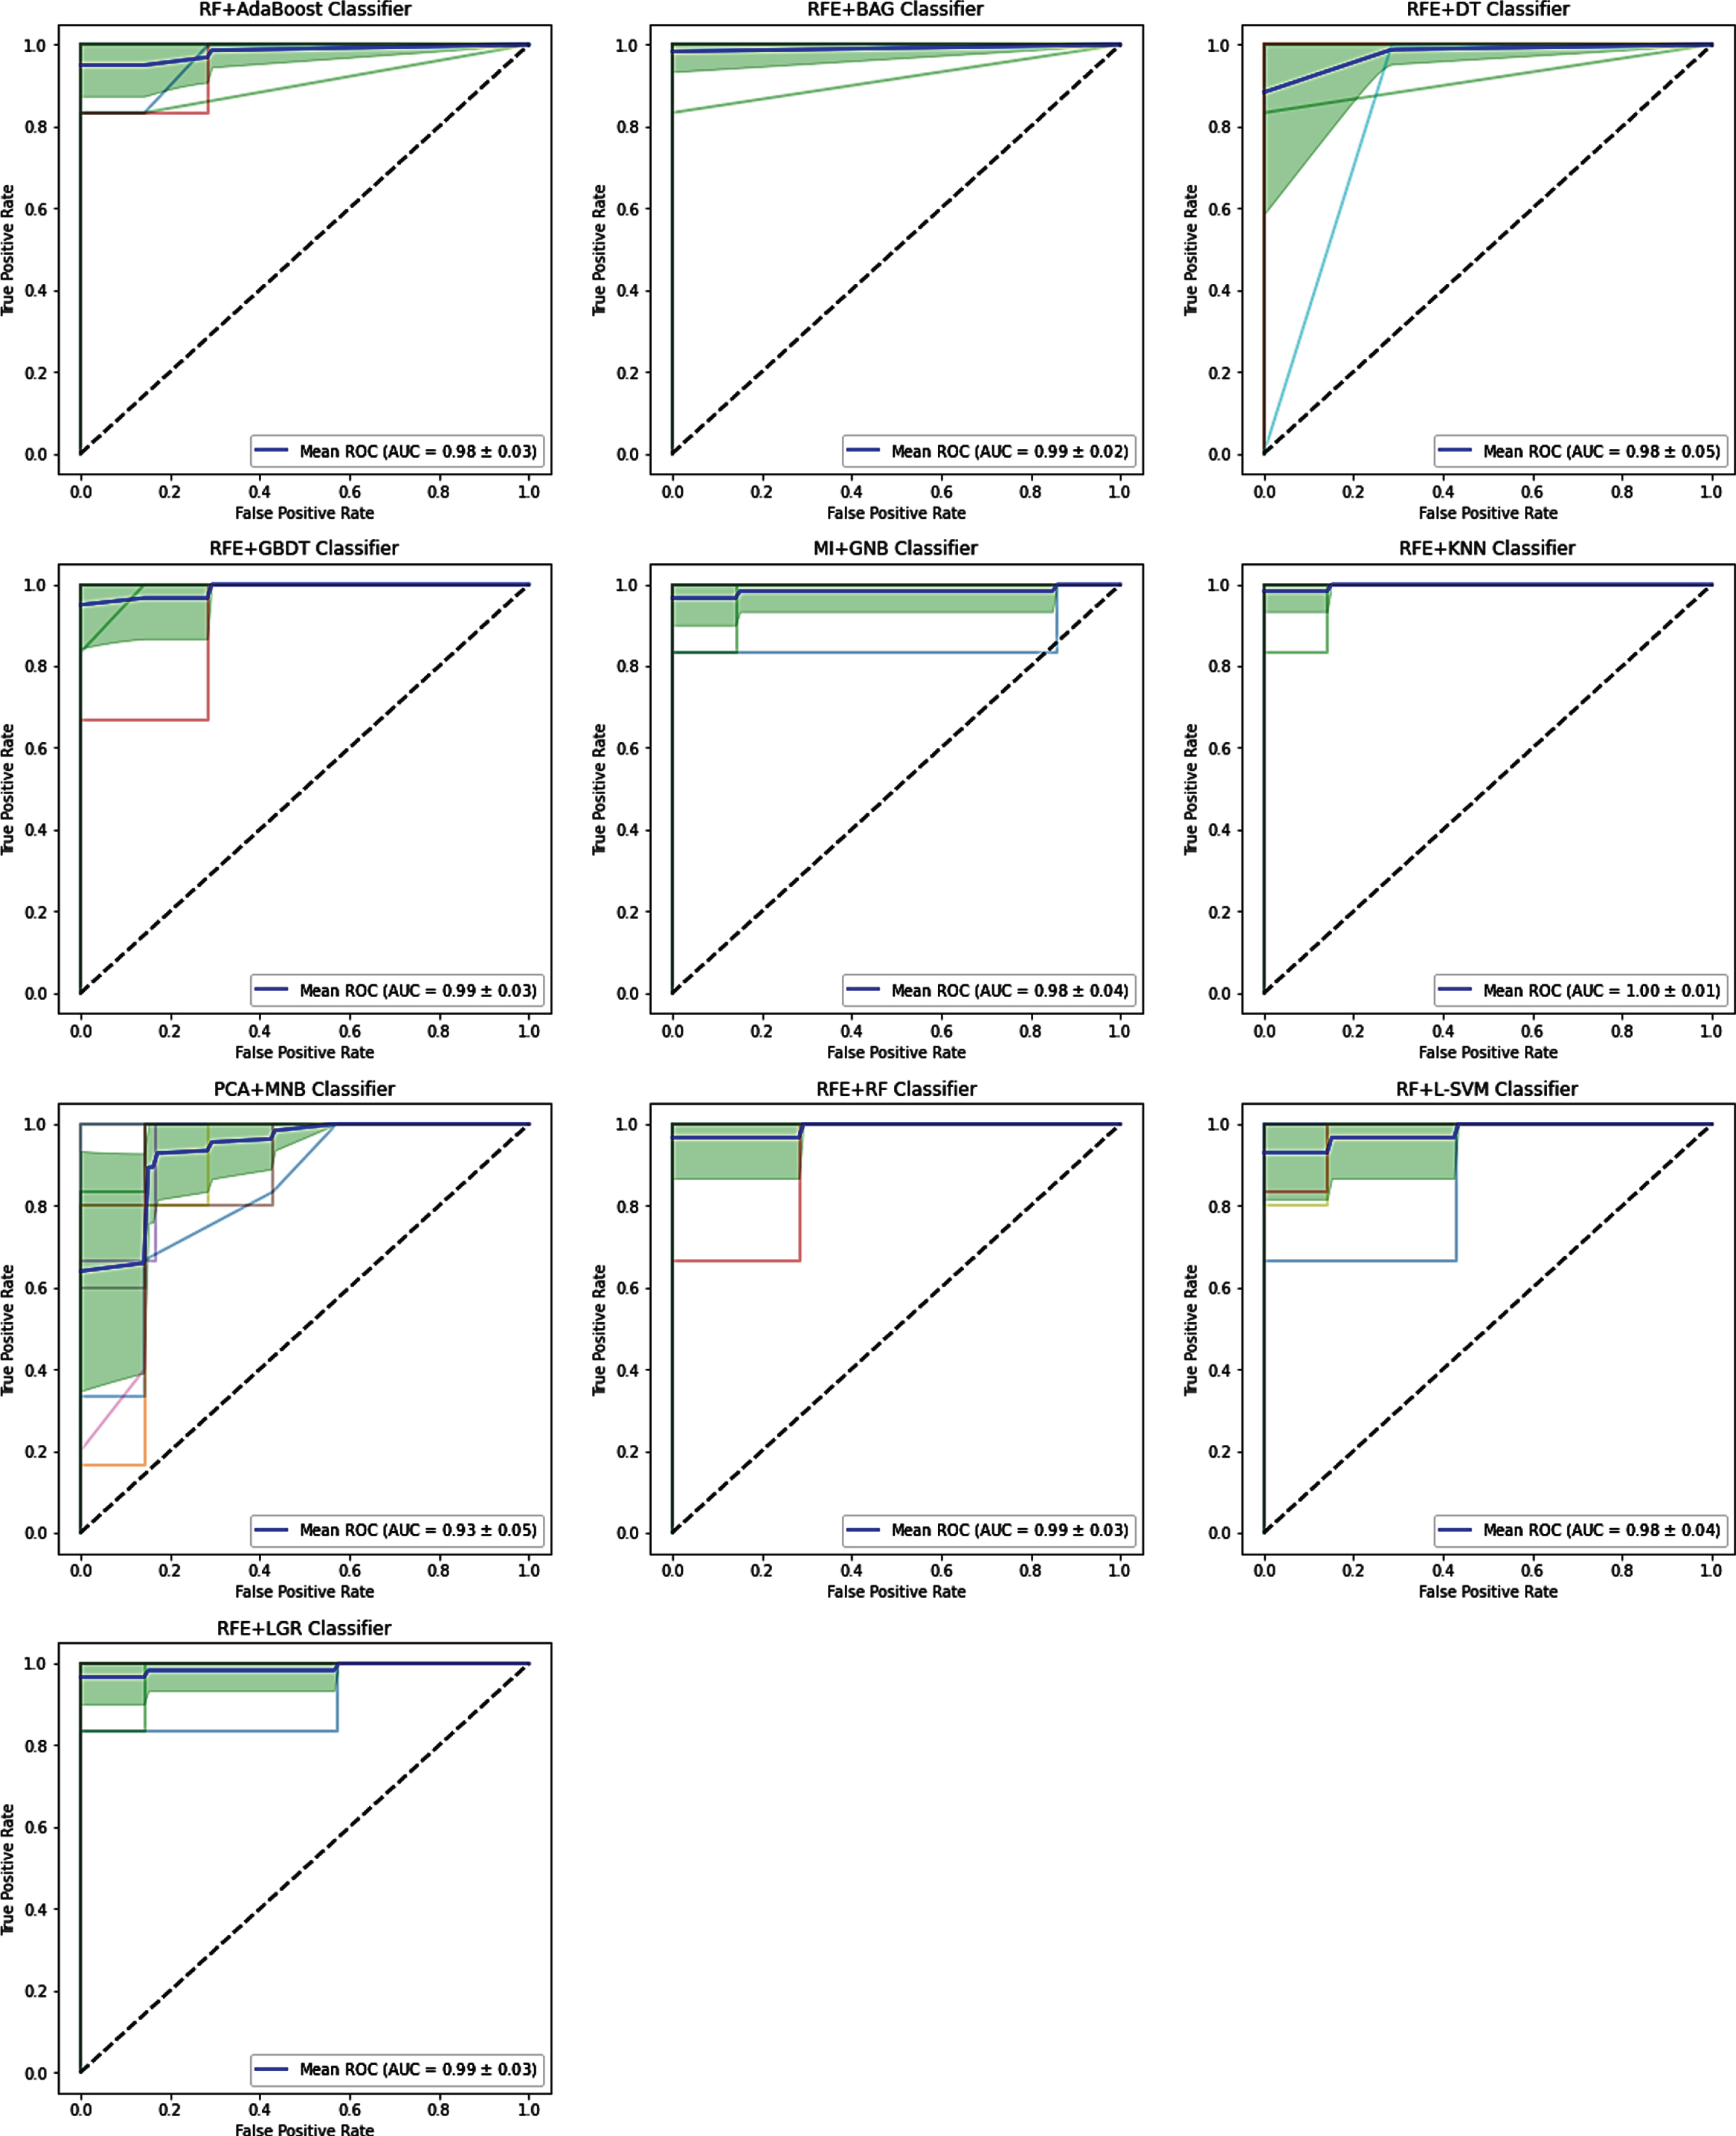
The range of accuracy and AUC is from 0.32 (recursive feature elimination [RFE]+Multinomial Naive Bayes [MNB] classifier) to 0.984 (RFE+bagging [BAG], RFE+decision tree [DT] classifiers) and 0.27 (mutual information [MI]+MNB classifier) to 0.997 (RFE+k-nearest neighborhood [KNN] classifier), respectively. There is no direct correlation among the number of the selected features, accuracy, and AUC, however, with changes in the number of the selected features, the accuracy and AUC values will change. Feature selection procedure RFE+BAG classifier and RFE+DT classifier achieve the highest prediction accuracy (accuracy: 0.984), followed by MI+Gaussian Naive Bayes (GNB) and logistic regression (LGR)+DT classifiers (accuracy: 0.976). RFE+KNN classifier as a feature selection procedure achieve the highest AUC (AUC: 0.997), followed by RFE+BAG classifier (AUC: 0.991) and RFE+gradient boosting decision tree (GBDT) classifier (AUC: 0.99).
CONCLUSION:
This study demonstrates that the ML model based on RFE+KNN classifier achieves the highest performance to differentiate patients with a confirmed infection caused by COVID-19 from the suspected cases.
1Introduction
Coronavirus disease (COVID-19) is a respiratory tract infection caused by severe acute respiratory syndrome coronavirus-2 (SARS-CoV-2). In 2019, this virus’s prevalence was first identified in Wuhan (China) [1, 2]. Coronavirus causes muscle ache, fever, coughing, and dyspnea. Patients with COVID-19 have had a wide range of symptoms reported, ranging from mild symptoms to severe. The incubation period of the coronavirus, the time between becoming infected and symptom onset, falls within the range of 2–14 days [3]. Reported that there is no proven effective therapy; therefore, to control the outbreak of the disease among the people, early diagnosis and isolation can be used [4]. The nucleic acid amplification test (NAAT) is a gold standard test for coronavirus. However, after repeated NAAT, there are false-positive results [5]. Therefore, beneficial and rapid diagnosing modalities like chest computed tomography (CT) is recommended to prevent and control COVID-19 [6–9]. However, in clinics that cannot perform NAAT, CT plays a fundamental role in the diagnosing of COVID-19 [10–15]. For patients with confirmed COVID-19, Ground-glass opacity (GGO) is a radiological finding in CT [16]. GGO is a subjective evaluation which generally dependent on reader experience. Therefore, to evaluate the diagnostic accuracy of the COVID-19, quantitative CT analysis (QCT) is required.
Radiomics is an image quantitative analysis procedure that is widely used in clinical research as well as early detection, prognosis, and prediction of treatment response [17, 18]. The purpose of radiomics is to find the relationship between quantitative data extracted from the images and clinical information. Based on this hypothesis, phenotypic differences can be obtained by feature extraction of images [19]. In summary, radiomics aim to convert images into useable data, with high accuracy and throughput. The radiomics can be divided into four processes, each with its challenges that require to be overcome: image acquisition and reconstruction, image segmentation, feature extraction, and informatics analyses. For example, typical protocols for image acquisition have to be identified. Segmentations have to be healthy and wrap minimal input. To reflect the individual volume’s complexity, features have to be produced but cannot be overly redundant. The statistical methods to analyze data have to be optimized because radiomics is not a mature study field. The difference in results can come from variations in any of these particular methods. Radiomics’ features are divided based on the shape and size, textures extracted from filtered images, features of fractals, image intensity histogram, and the relationships between image voxels [20]. After the feature extraction, feature-selection procedures such as filter, embedded, and the wrapper is used to identify valuable features [21]. Then, machine learning (ML) classifiers are applied to classify and predict diseases [22]. However, it is still unknown whether different feature selection and classification methods affect radiomics-based prediction performance in screening and diagnosing COVID-19. In these regards, extracting useful imaging features and engaging reliable ML procedures are desired to compare in screening COVID-19. Therefore, imaging features extracted from CT scans can be examined as the first-line for COVID-19 diagnosis, and radiomics can provide a potential tool for screening COVID-19. In general, laboratory tests are the standard for screening suspected cases of COVID-19, but this procedure is time-consuming, with significant false-negative results [23].
Fang et al. [24] developed a radiomics method to screen COVID-19 from CT images. They used 75 patients; 46 patients were diagnosed as COVID-19, and 29 were other types of pneumonia. The AUCs’ result using SVM was 0.862 and 0.826 in the training set and the test set, respectively. Wu et al. [25] develop a non-invasive prognostic signature using chest CT to individually predict poor outcomes (death, need for mechanical ventilation, or intensive care unit admission) in patients with COVID-19. The result of AUC for the early-phase group and late-phase group was 0.862 and 0.976, respectively. They have suggested that the chest CT radiomics feature of COVID-19 is more effective and ideal to predict poor outcome in the late-phase COVID-19 patients. Huang et al. [26] assessed the classification performance of CT- based signs and radiomics features to discriminate COVID-19 from other viral pneumonia. They used a total of 181 patients; 89 patients were diagnosed as COVID-19, and 92 ones were diagnosed as non-COVID-19. In the training and the testing cohort, the model achieved an AUC of 0.904 and 0.866, respectively.
In the present study, we studied the diagnostic value of frequently used ML procedures and the effectiveness of different radiomics features for screening COVID-19. Nine feature selection procedures, Pearson Correlation (PC), f_classif, variance threshold (VT), mutual information (MI), logistic regression (LGR), least absolute shrinkage and selection operator (LASSO), random forest (RF), recursive feature elimination (RFE), and principal component analysis (PCA), and ten classification procedures, adaptive boosting (Adaboost), bagging (BAG), Gaussian Naive Bayes (GNB), Multinomial Naive Bayes (MNB), decision tree (DT), gradient boosting decision tree (GBDT), k-nearest neighborhood (KNN), random forest (RF), linear support vector machine (L-SVM), and logistic regression (LGR), were evaluated in terms of their popularity and literature effectiveness. Feature extraction, selection, and classification procedures were adopted to reduce bias. Besides, the roles of the selected feature number were evaluated to optimize the radiomics-based screening COVID-19. As it comes to our knowledge from the literature review, there are not many records for investigating extensively ML-based radiomics for different feature-selection and classification procedures. Therefore, to get the best combination of feature selection and classification procedures, extensive comparative analyses were performed using performance metrics such as accuracy and receiver operator characteristic curve (AUC) statistics. Briefly, in the present study, for screening and diagnosing COVID-19, the ML methods and its radiomics features based on CT chest are suggested.
2Materials and methods
2.1Study Dataset
The study’s general framework is depicted as a diagram in Fig. 1. This framework includes classification of patients, segmentation and visualization of lung volumes, feature selection procedures used, number features evaluated, classification methods used, and evaluation of models with two parameters accuracy and AUC. The plots on the right-hand side of Fig. 1 are the models’ accuracy and AUC. In the current study, the range of selected feature numbers was from 2 to 50, with an interval of 2, as shown in Fig. 2. All procedures performed in the study were in accordance with the ethical standards of the institutional research committee. The present study was carried out between 3 April 2020 to 6 October 2020. The patients’ imaging was acquired in the radiology department, Imam Khomeini Hospital (Tehran, Iran). To manage COVID-19 disease, all patients with a rapid respiratory rate over 30 per minute, fever over 37.8°C, hypoxemia, dyspnea, cardiovascular disease, hypertension, diabetes mellitus, underlying pulmonary diseases, and immunodeficiency underwent non-contrast chest CT examinations.
Fig. 1
The general framework of the study.
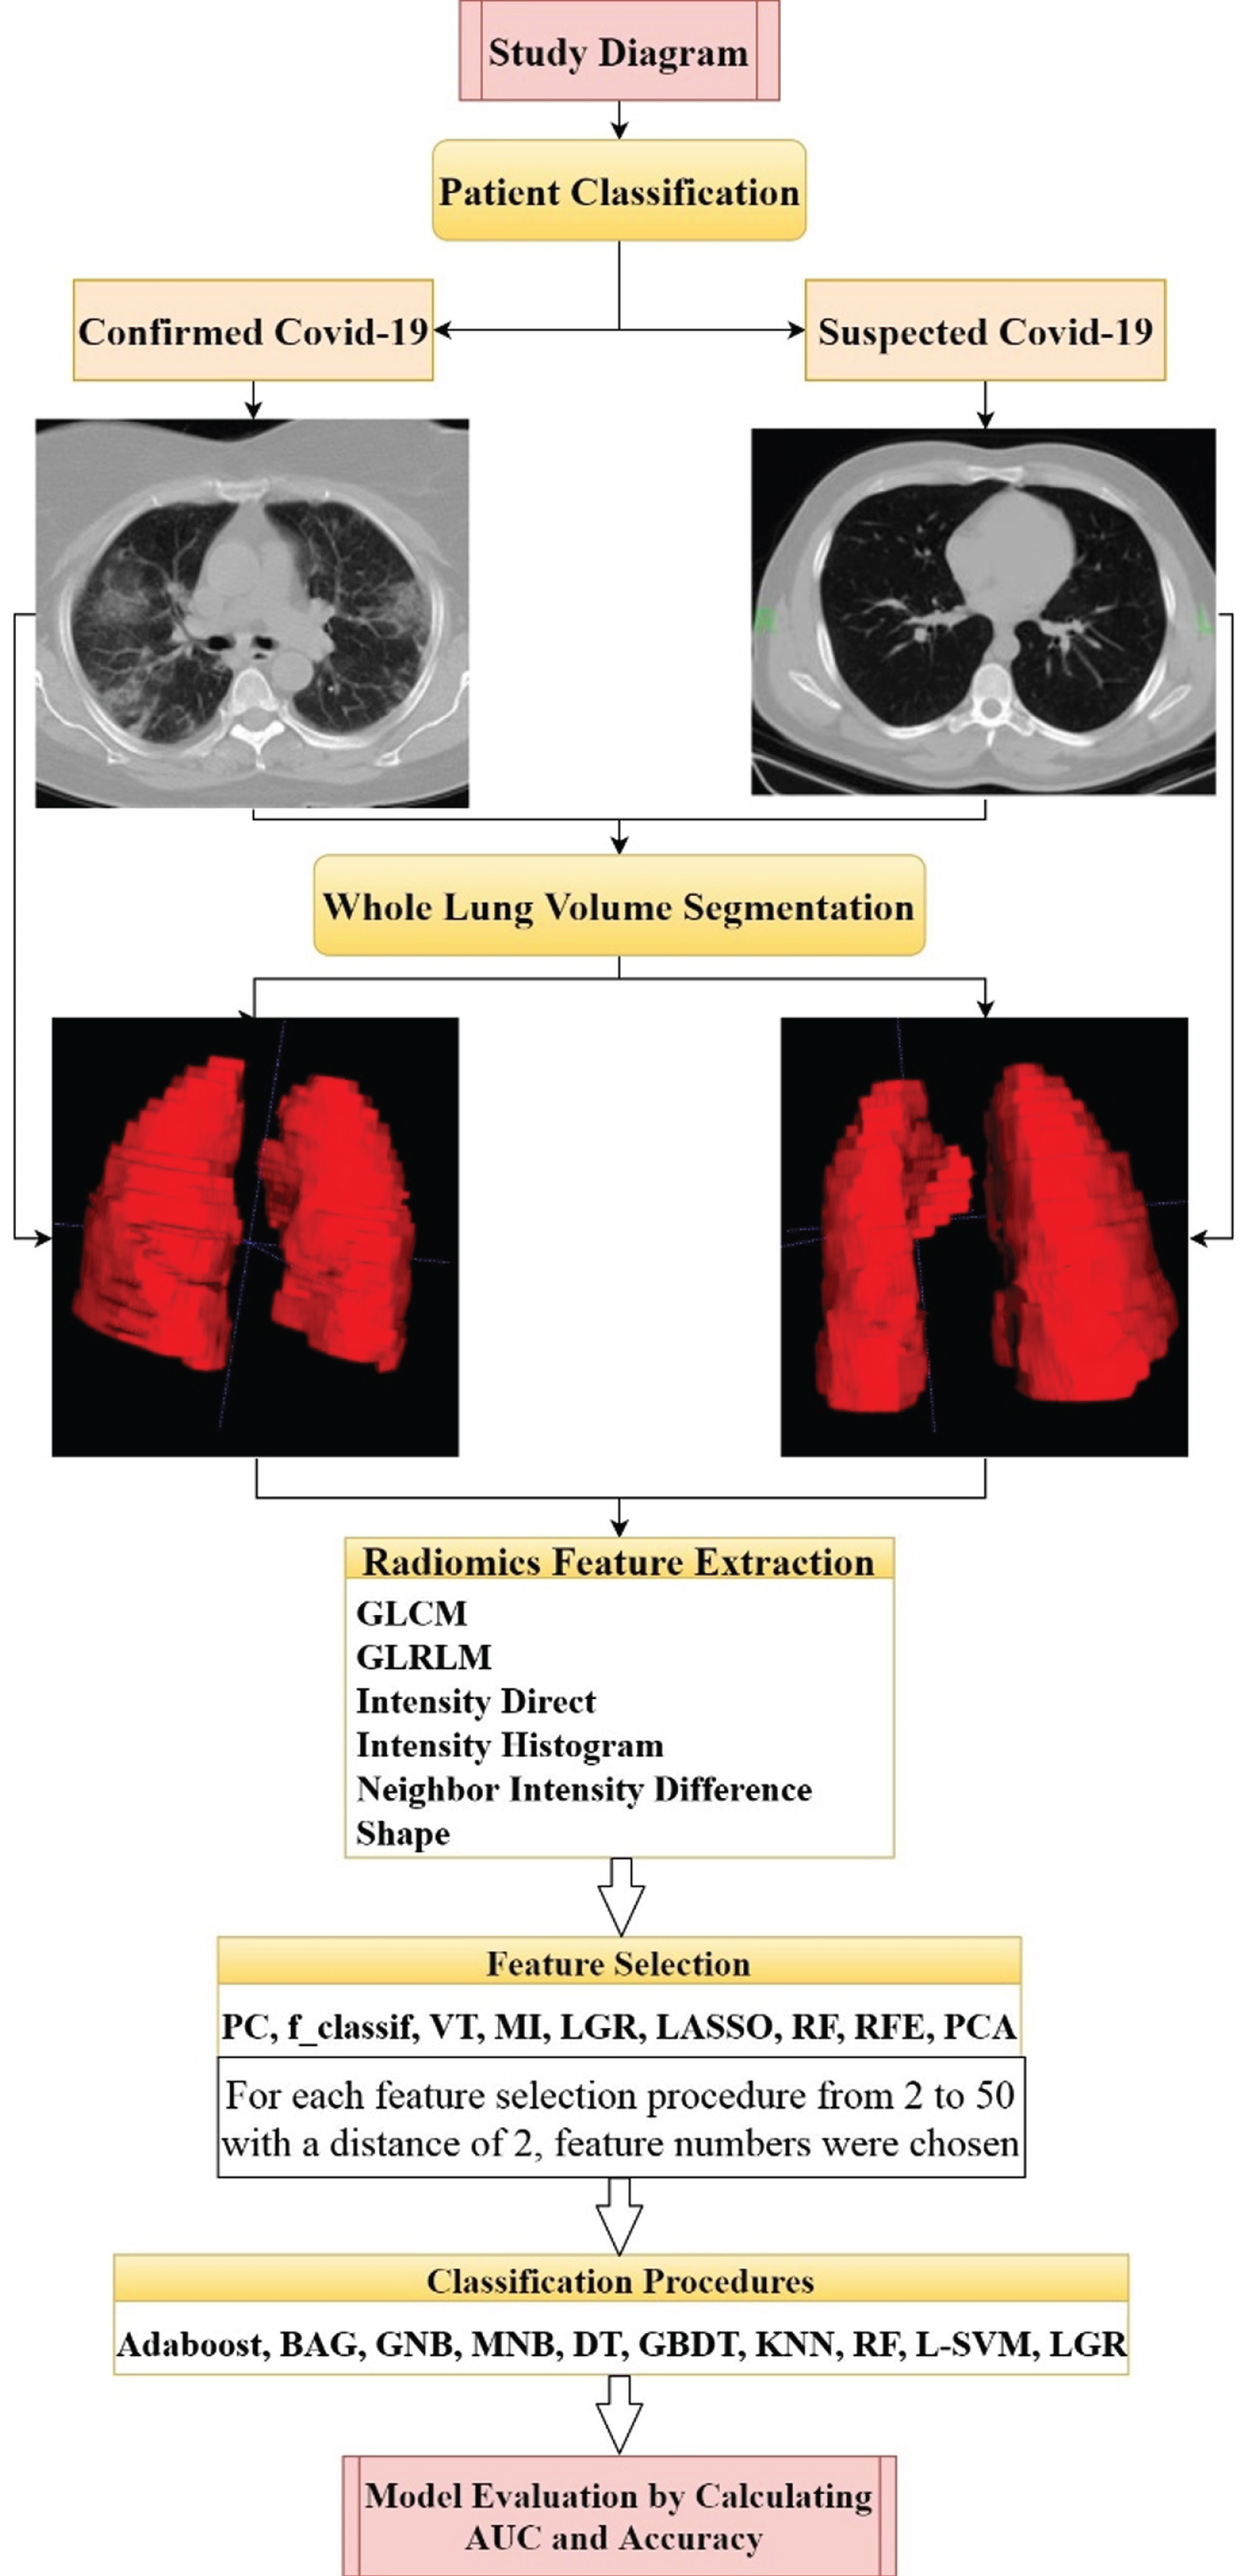
Fig. 2
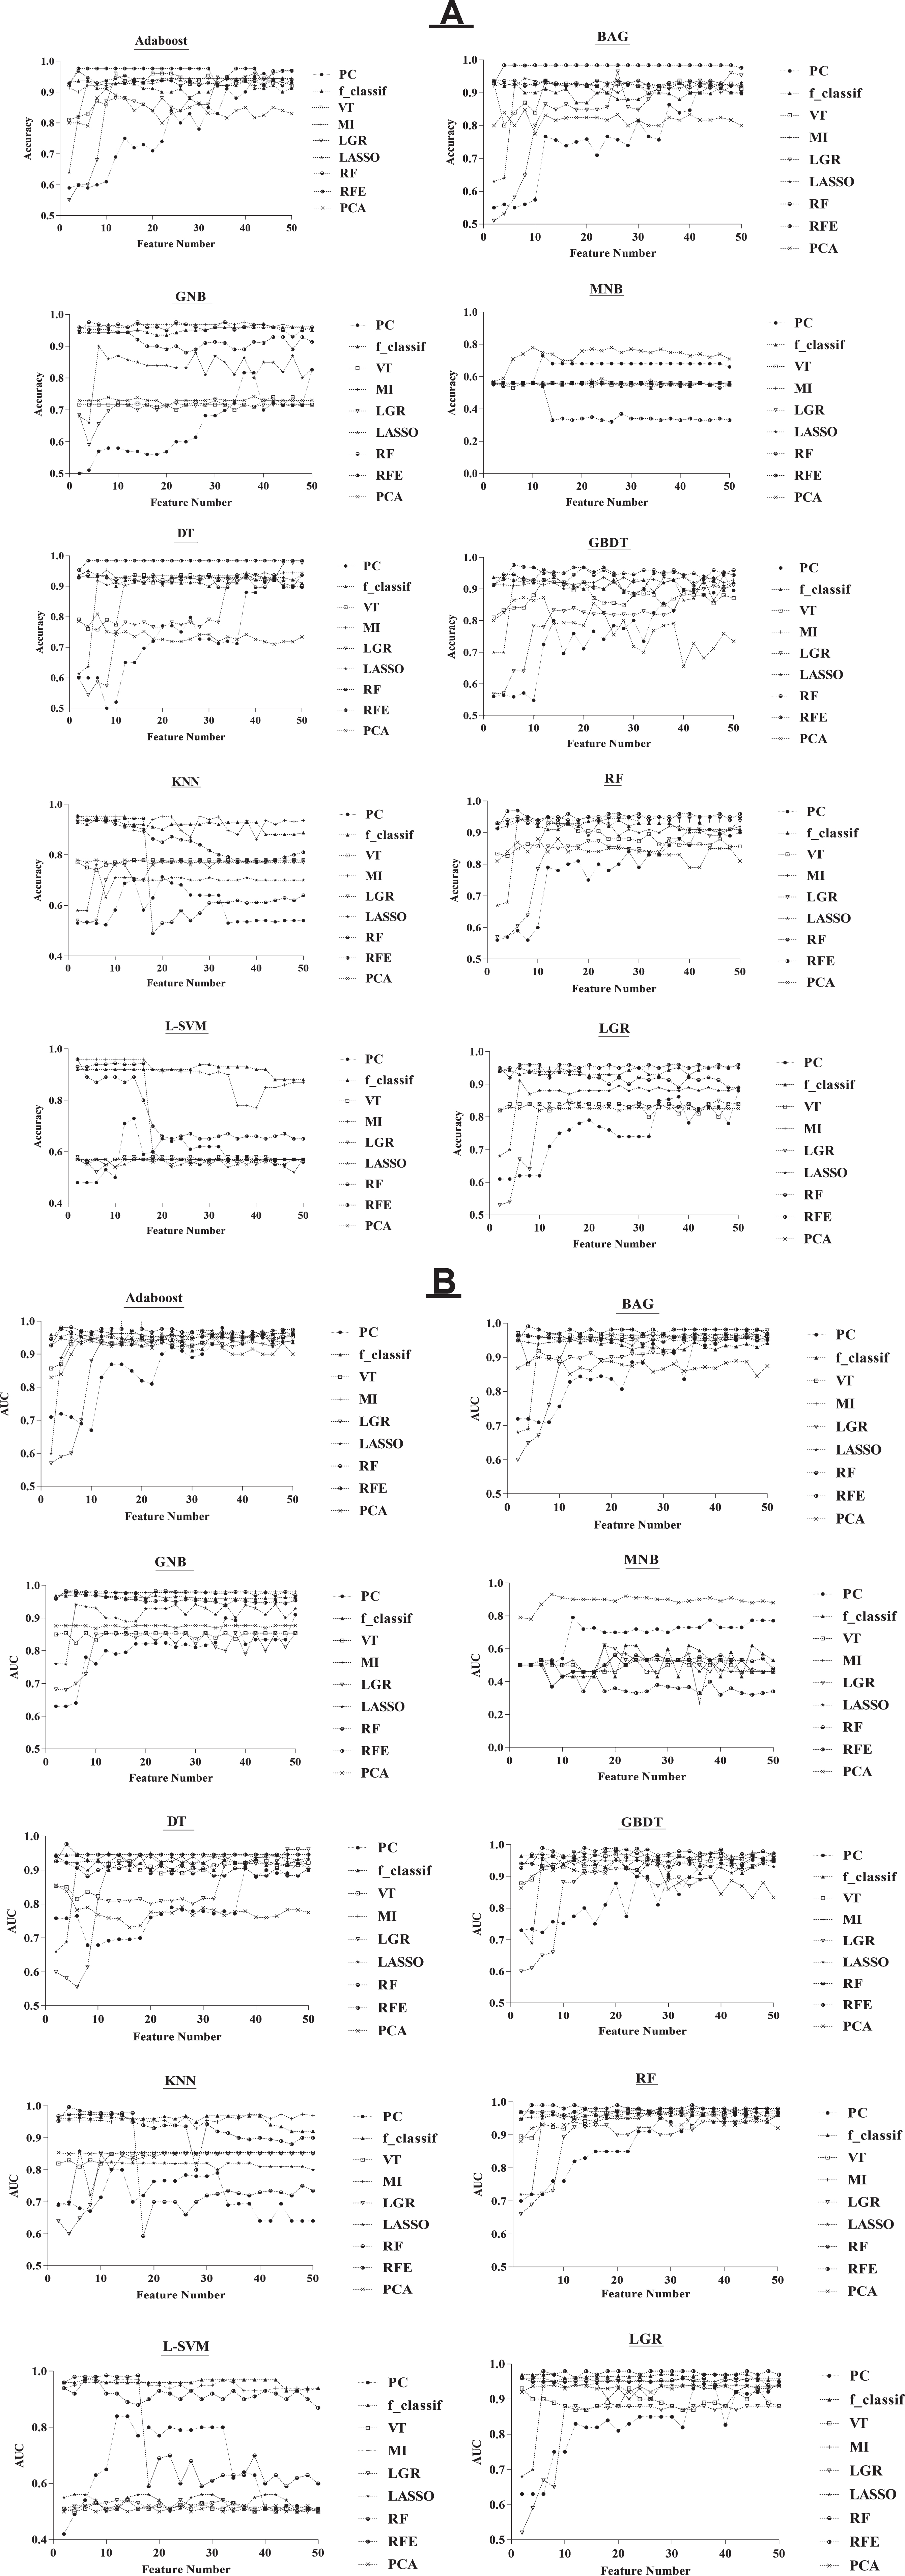
The relationship among selected feature numbers, accuracy (A), and AUC (B) for the feature selection and classification procedures.
The current study is mono-centric, and all patients are referred to the emergency room (ER). Also, they were not treated with steroids. In our center, all patients must perform the PCR test and CT imaging to clarify their problem (COVID-19). The patients visited the doctor immediately after they have some symptoms related to the COVID-19. A physician for screening and diagnosing COVID-19 reviewed medical records and imaging. All patients that both clinical findings and chest CT findings compatible with COVID-19 pneumonia were located in the confirmed COVID-19 group. CT scans and laboratory tests confirmed that some patients had other lung infections. These patients had some common symptoms with confirmed COVID-19 patients. It is notable that in these patients, CT imaging’s initial diagnosis was difficult, so additional laboratory tests were performed. That’s why we named them suspected COVID-19. In summary, the patients who had some symptoms related to the COVID-19 were considered “suspected COVID-19.” After investigating their tests, including PCR, immunologic, and CT scan, their problem was clarified. Also, we consulted with two radiologists for the data from the CT scan. The laboratory results were considered, and after that, the control group and patient group were separated. This study was carried out on two groups of patients, including 138 confirmed COVID-19 and 140 patients with suspected COVID-19. We focused on distinguishing pneumonia caused by COVID-19 from suspected cases by segmentation of whole lung volume and extraction of 86 features. The confirmed group consisted of 89 men and 49 women with a mean age of 52.9 years (28–81 years). There were 85 men and 55 women in the suspected group with a mean age of 50 years (21–89 years).
2.2Image acquisition and pre-processing
Non-contrast chest CT examinations were performed for all the patients as the first imaging. In our study, we did not investigate the contrast-enhanced scan patients. In other words, it is our exclusion criteria. The CT images were performed using a 16-slice CT scanner (Somatom Emotion; Siemens Medical Solutions, Forchheim, Germany). The study’s imaging parameters are as follows: kVp = 110, mAs = 90, slice thickness = 2 mm, matrix size = 512×512, voxel size 0.714×0.714×2 mm3.
Before image feature extraction, an 8-bit depth resampling technique was used for each feature as a pre-processing to reduce noise and increase sensitivity [10]. Also, for noise reduction and image uniformity, images were quantized to 64 gray-level intensities. Moreover, all the numerical features were normalized to 0 and 1. The pre-processing techniques, including noise reduction and image uniformity, were performed using Imaging Biomarker Explorer (IBEX, MD Anderson Cancer Center) software. The IBEX software package was developed under Matlab and C/C++.
2.3Radiomics feature extraction
Image feature extraction was performed from the CT images with a slice thickness of 2 mm. We contoured the whole volume of both lungs. To analyze radiomic features, the region of interest (ROI) for each patient was manually contoured segmented by a physician with lung CT imaging experience. The available open-source IBEX feature extraction software [27] was utilized to extract radiomics features from the lung regions (Table 1). Eighty-six features were calculated with this software: 34 intensity direct features, 22 gray level co-occurrence matrix features (GLCM), 14 shape features,11 gray level run length matrix features (GLRLM), and five neighbor intensity difference features [28, 29].
Table 1
Radiomics features extracted
| Intensity direct | GLCM | Shape | GLRLM | Neighbor intensity |
| difference | ||||
| Energy | Auto Correlation | Compactness1 | Gray Level Nonuniformity | Busyness |
| Energy Norm | Cluster Prominence | Compactness2 | High Gray Level Run Emphasis | Coarseness |
| Global Entropy | Cluster Shade | Convex | Long Run Emphasis | Complexity |
| Global Max | Cluster Tendency | Convex Hull Volume | Long Run High Gray Level Emphasis | Contrast |
| Global Mean | Contrast | ConvexHullVolume3D | Long Run Low Gray Level Emphasis | Texture Strength |
| Global Median | Correlation | Mass | Low Gray Level Run Emphasis | |
| Global Min | Difference Entropy | Max3DDiameter | Run Length Nonuniformity | |
| Global Std | Dissimilarity | Mean Breadth | Run Percentage | |
| Global Uniformity | Energy | Orientation | Short Run Emphasis | |
| Orientation | Entropy | Roundness | Short Run High Gray Level Emphasis | |
| Roundness | Homogeneity | Spherical Disproportion | Short Run Low Gray Level Emphasis | |
| Local Entropy Max | Homogeneity 2 | Sphericity | ||
| Local Entropy Mean | Information Measure Correlation 1 | Surface Area | ||
| Local Entropy Median | Information Measure Correlation 2 | Surface Area Density | ||
| Local Entropy Min | Inverse Difference Moment Norm | |||
| LocalEntropyStd | Inverse Difference Norm | |||
| Local Range Max | Inverse Variance | |||
| Local Range Mean | Max Probability | |||
| Local Range Median | Sum Average | |||
| Local Range Min | Sum Entropy | |||
| Local Range Std | Sum Variance | |||
| LocalStdMax | Variance | |||
| Local Std Mean | ||||
| Local Std Median | ||||
| Local Std Min | ||||
| Local Std Std | ||||
| MeanAbsoluteDeviation | ||||
| Median Absolute Deviation | ||||
| Percentile | ||||
| Quantile | ||||
| Range | ||||
| Root Mean Square | ||||
| Skewness | ||||
| Variance |
2.4Feature selection procedures
Feature selection procedures are used for shorter training times, reducing over fitting, and increasing prediction accuracy. There are three main types of feature selection algorithms: filter, embedded, and wrapper procedures. Filter procedures are commonly used as a pre-processing step and have high generalizability [32]. According to previous studies’ effectiveness and complexity, nine feature selection procedures were selected [30, 31]. These feature selection procedures were included PC, f_classif, VT, MI, LGR, LASSO, RF, RFE, and PCA. PC, f_classif, VT, and MI are feature selection procedures based on the filter. Embedded procedures merge feature selection as a part of the training process, and this procedure is composed of a tree-based and penalty-based method. LGR, LASSO, and RF are feature selection procedures based on the Embedded. Wrappers’ procedures use classifiers’ performance for a specific ML algorithm to select the combination that generates the best result. RFE is a wrapper procedure that purpose of detecting the best performing feature subset. PCA is a dimensionality reduction procedure that generates new specified features, but not a feature selection procedure. PCA transforms features, but feature selection procedures choose features without transforming them.
2.5Classification procedures
We investigated ten ML classifiers: Adaboost, BAG, GNB, MNB, DT, GBDT, KNN, RF, L-SVM, and LGR [33]. By the way, the combination of different feature selection procedures with classification procedures was performed. Hence, extensive comparative analyses were performed to evaluate the performance of ten models. Also, models, including Adaboost, BAG, GNB, MNB, and GBDT, has been applied for the first time for this purpose. The classification procedures were trained using the tenfold cross-validation method [34]. Ten-fold cross-validation split the data into ten parts and then alternately used nine parts for training and the rest for testing. In other words, in the ten-fold cross-validation method, the original sample is randomly partitioned into ten equal size subsamples. Among the ten subsamples, a single subsample is retained as the validation data for testing, and the remaining ten-1 subsamples are used as a training model. This process is repeated ten folds with each of the ten subsamples used exactly once as the validation data. All experiments including feature selection and classification procedures were performed on the Google Cloud computing service “Google Colab” (colab.research.google.com) using programming language Python (python version 3.7.6). The acronym for each feature selection and classification procedure has been presented in Table 2.
Table 2
The used feature selection and classification procedures with the acronyms and full names
| Acronym | Feature selection procedure name | Acronym | Classification procedure name |
| PC | Pearson Correlation | Adaboost | Adaptive boosting |
| f_classif | f_classif | BAG | Bagging |
| VT | Variance threshold | GNB | Gaussian Naive Bayes |
| MI | Mutual information | MNB | Multinomial Naive Bayes |
| LGR | Logistic regression | DT | Decision tree |
| LASSO | Least absolute shrinkage and selection operator | GBDT | gradient boosting decision tree |
| RF | Random forest | KNN | k-nearest neighborhood |
| RFE | Recursive feature elimination | RF | Random forest |
| PCA | Principal component analysis | L-SVM | Linear support vector machine |
| – | – | LGR | Logistic regression |
2.6Statistical data analysis
The cross-combination method was performed to evaluate the performance of feature selection and feature classification procedures. For each feature selection procedure, from 2 to 50 feature with an interval of 2, feature numbers were chosen. By calculating features for every feature selection method, we calculated the maximum values of accuracy and AUC. Followed by, the features selected were evaluated with 10 ML classifiers. Briefly, we got 90 combinations of classification and feature selection procedures. The performance of the feature selection and classification procedures was obtained using two criteria as follows [35]:
(1) Accuracy = (TN + TP) / (TN + TP + FN + FP)
where TP, FP, TN, and FN represent the number of True Positive, False Positive, True Negative, and False Negative, respectively.
(2) AUC: The area under a receiver operating characteristic (ROC) curve. This curve is a method to visualize the tradeoffs between sensitivity and specificity.
3Results
Figure 2 shows the relationship among selected feature number, accuracy, and AUC for the feature selection and classification procedures. Feature numbers were chosen from 2 to 50 with a distance of 2. The range of accuracy and AUC was from 0.32 (RFE+MNB classifier) to 0.976 (RFE+Adaboost classifier, MI + GNB classifier, LGR + DT classifier, RFE+GBDT classifier) and 0.27 (MI + MNB classifier) to 0.997 (RFE+KNN classifier), respectively. As shown in Fig. 2, there is no direct correlation among the number of the selected features, accuracy, and AUC, however, with changes in the number of the selected features, the accuracy and AUC values will change. Therefore, we calculated the maximum values of accuracy and AUC. As increasing of feature chosen number, we observed that the predicted AUC and accuracy were approximately stable for the majority of feature selection procedures. As shown in Fig. 2, the least change with an increasing number of features is related to the RFE+BAG classifier for accuracy. But, for AUC, the least change with a rising number of features is associated with the RFE+DT classifier.
Figures 3 and 4 show the accuracy and AUC results as heatmaps in ten-fold cross-validation. Figure 5 depicts the maximum AUC of the classification procedures. Feature selection procedure RFE+BAG classifier and RFE+DT classifier achieved the highest prediction accuracy (accuracy: 0.984), followed by a MI + GNB classifier (accuracy: 0.976). Feature selection procedure RFE+KNN classifier achieved the highest AUC (AUC: 0.997), followed by RFE+BAG classifier (AUC: 0.991), RFE+GBDT classifier (accuracy: 0.99). The results showed that achieved AUC for the RFE+KNN classifier, and RFE+BAG classifier belonged to the four radiomics’ features: LocalEntropyStd, LocalStdMax, MeanAbsoluteDeviation, and 90–4 SumVariance. As well as, achieved AUC for the RFE+GBDT classifier belonged to the six radiomics’ features: LocalEntropyStd, LocalStdMax, MeanAbsoluteDeviation, 90–4 SumVariance, 90–7SumVariance, and 135–1SumVariance. It is necessary to mention that three features (LocalEntropyStd, LocalStdMax, and MeanAbsoluteDeviation) have belonged to the Intensity Direct feature set, and the other three features (90–4 SumVariance, 90–7SumVariance, and 135–1SumVariance) have belonged to the GLCM feature set. Except for the MNB classifier, RFE, RF, and MI feature selection procedures presented valuable accuracy and AUC performance for the most classifiers. Meanwhile, except for the MNB classifier, the RFE feature selection procedure showed higher stabilities with the most feature selection procedures. However, the MNB classifier for the majority of classifiers showed lower accuracy and AUC.
Fig. 3
Accuracy heatmap of the feature selection and feature classification procedures.
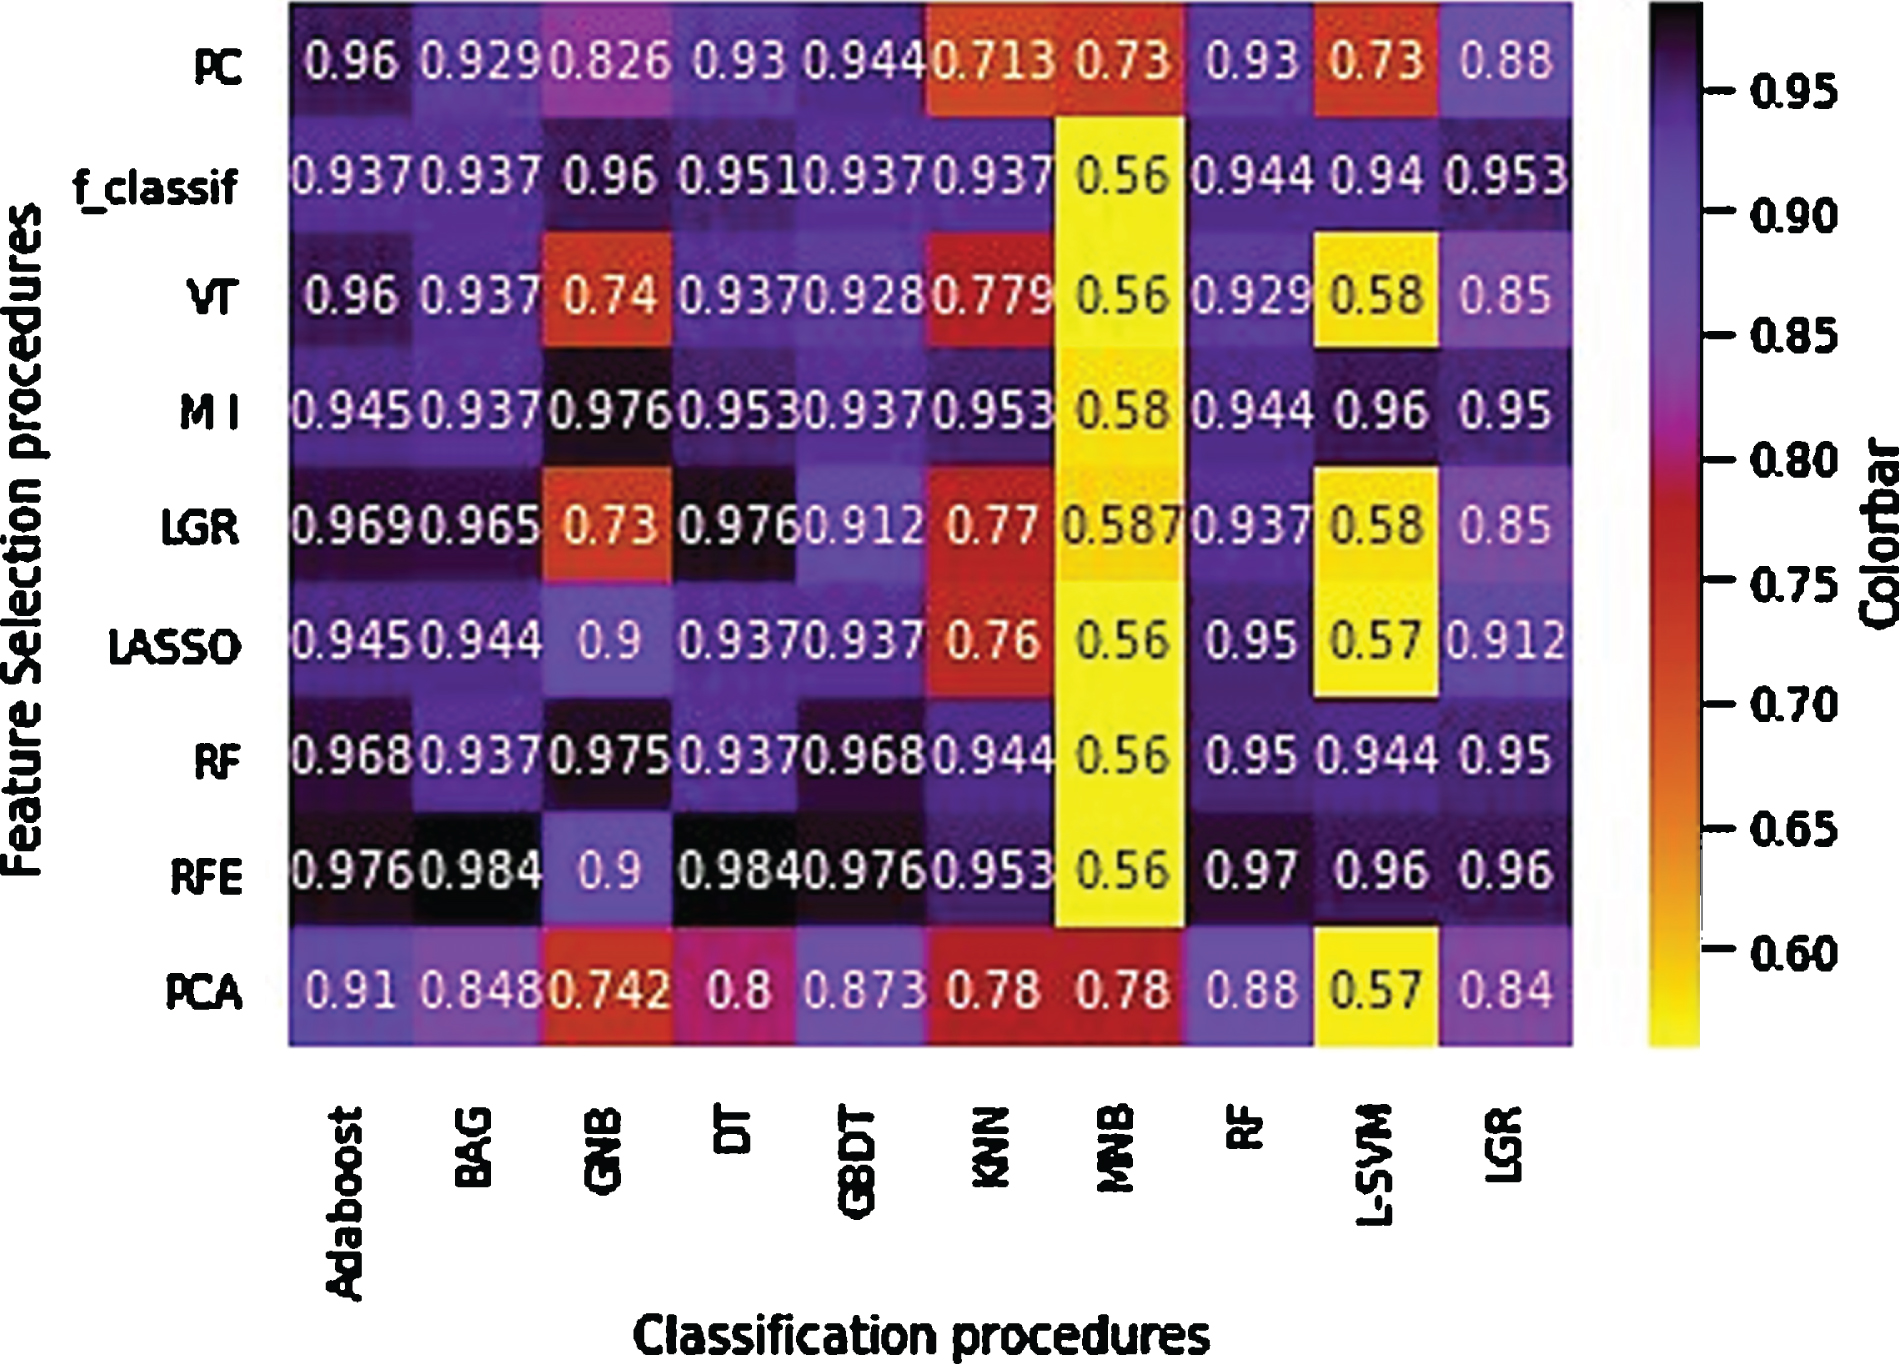
Fig. 4
AUC heatmap of the feature selection and feature classification procedures.
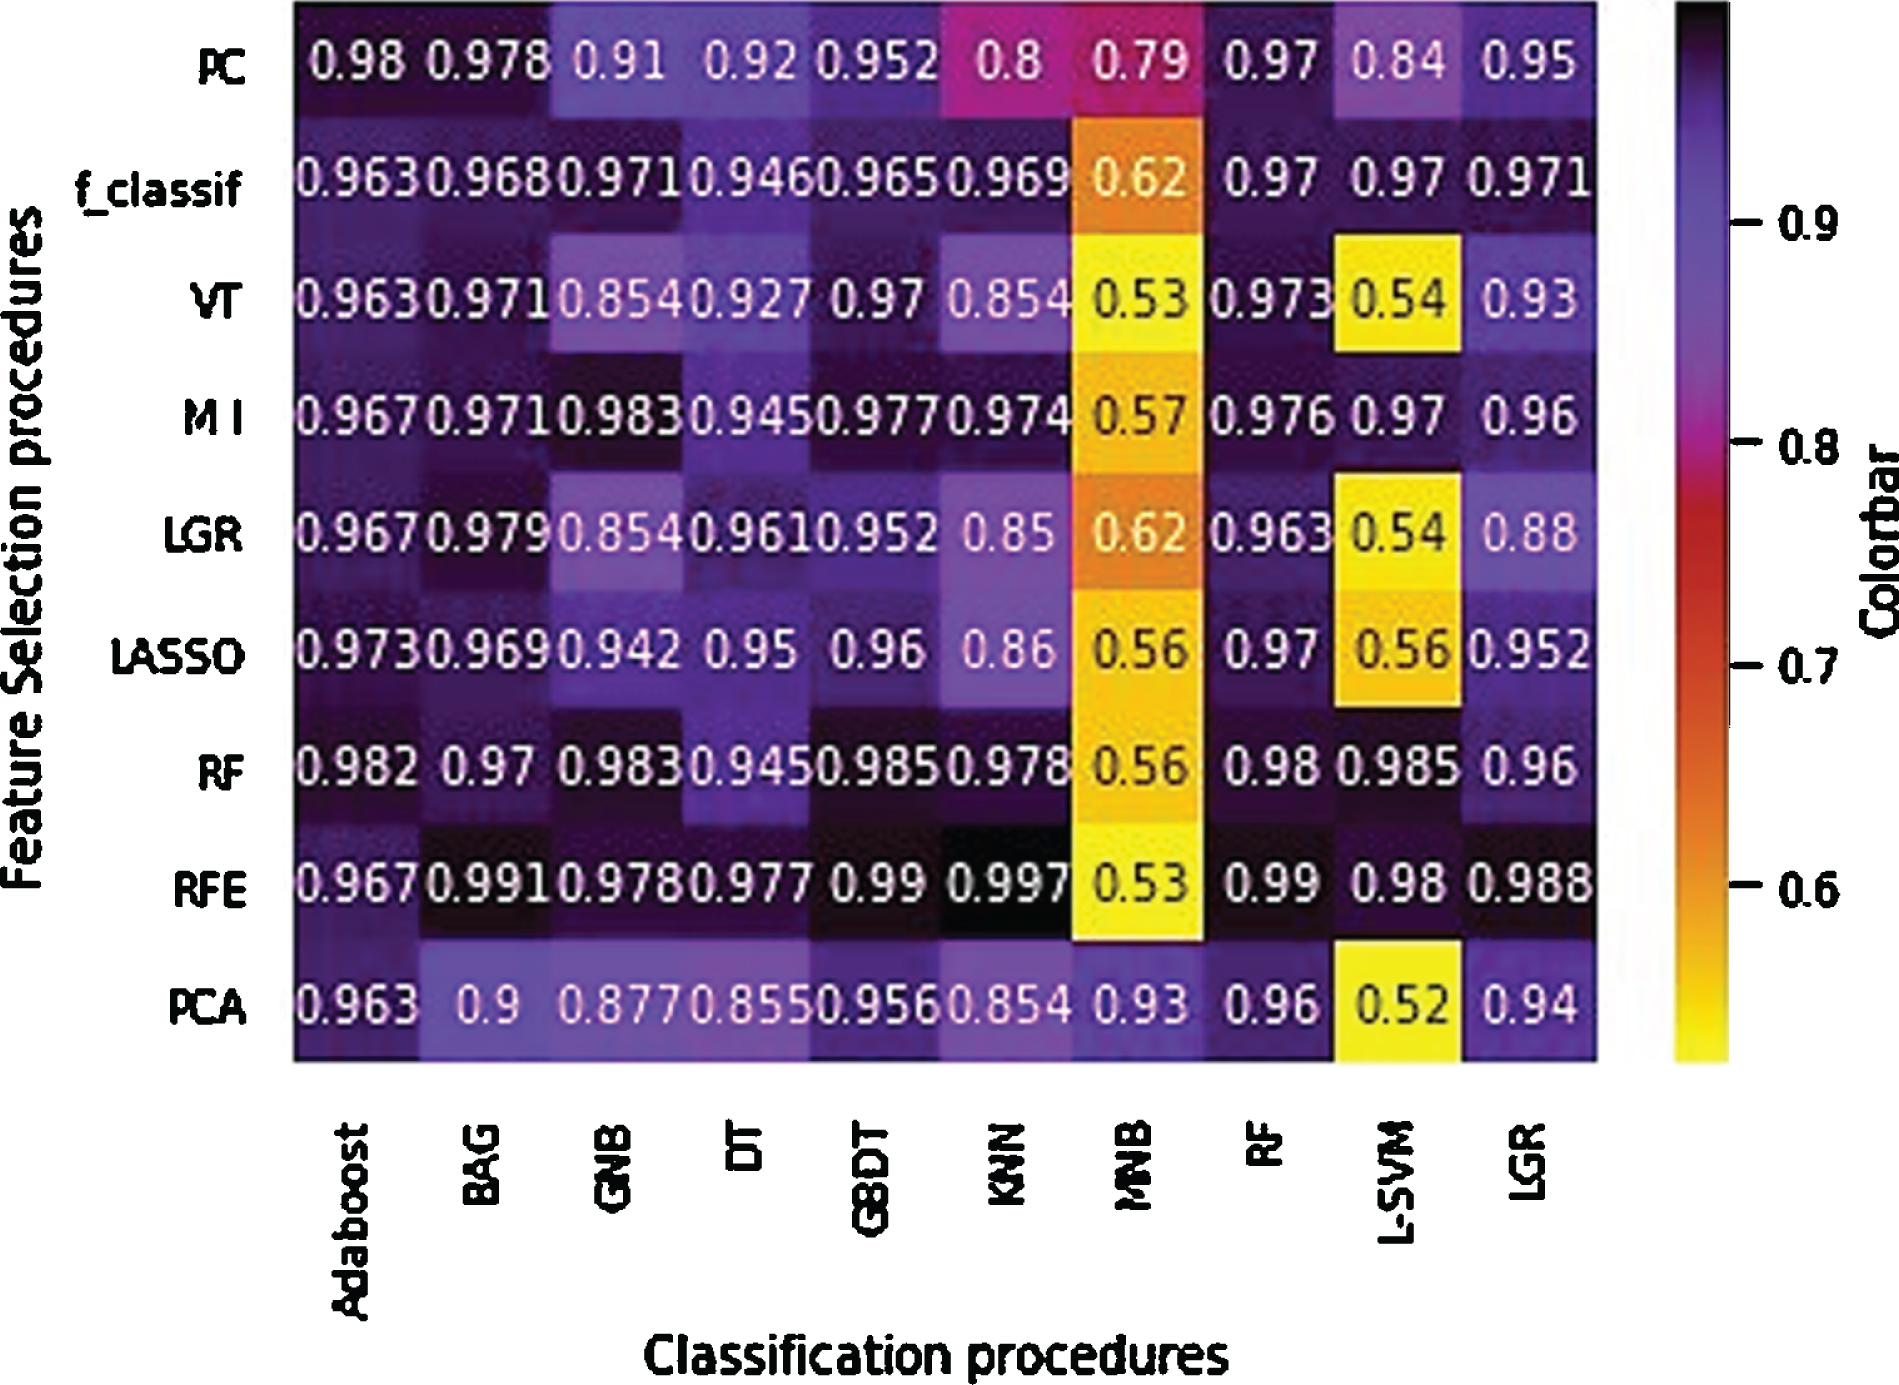
Fig. 5
The maximum AUC of the classification procedures.
4Discussion
Radiomics is an image quantitative analysis procedure that is widely used in clinical research as well as in early detection, prognosis, and prediction of treatment response [36]. In the current study, different feature selection and classification procedures were investigated to screen COVID-19 based on the whole lung’s extracted radiomics features. Feature selection is an efficient method to improve radiomics-based predictive studies. In the feature number and feature selection method analysis, we observed that the selected features had a broad coverage feature type for the high accuracy feature selection method than the low accuracy feature selection methods. This may be because different feature types encompass other tumor characteristics. Thus, a comprehensive feature extraction method is likely to improve clinical outcome prediction. These results provide a dimension for feature extraction, which is critical for the feature selection and classification, hence the overall clinical analysis. Also, to get the best combination of feature selection and classification procedures, extensive comparative studies were performed for several feature selection and classification algorithms.
Moreover, the effect of the number of selected features and feature type on accuracy and AUC was investigated. We found that feature selection procedure RFE+KNN classifier achieved the highest AUC, followed by RFE+BAG classifier, RFE+GBDT classifier, and RFE+RF classifier. RFE feature selection procedure presented valuable accuracy and AUC performance for the majority of classifiers. The RFE feature selection procedure and four radiomics features, including LocalEntropyStd, LocalStdMax, MeanAbsoluteDeviation, and 90–4 SumVarianc, presented valuable accuracy and AUC performance for the majority of classifiers. We observed that the high accuracy prediction procedures belonged to the Intensity Direct and GLCM feature set in the feature type analysis. This finding suggests that the accuracy prediction benefited from feature selection. In other words, to improve studies based on radiomics, feature selection is an effective method. Limited studies have examined the effect of radiomics’ features on the diagnosis of COVID-19. Yue et al. [37] investigated ML-based CT radiomics methods for predicting hospital stay in patients with COVID-19 pneumonia based on LGR and RF classification procedures. Announced that to predict hospital stay in patients with COVID-19 pneumonia, ML-based CT radiomics features indicated the high feasibility (AUC of 0.97 and 0.92 by LGR and RF, respectively). However, in the present study, different classification procedures were presented, and we obtained better results for the AUC that KNN obtained a max value of 0.997.
Xie et al. [38] developed a CT-based radiomics model to differentiate COVID-19 from other pulmonary diseases. Thirteen radiomics features were selected using LASSO feature selection and SVM classifier to build the model. They achieved the AUC and accuracy of 0.905 and 89.5%, respectively. Our study obtained better results; feature selection procedure RFE+SVM classifier and MI + SVM achieved 96% accuracy. Also, the feature selection procedure RFE+SVM classifier achieved an AUC of 0.98.
Liu et al. [39] investigated the efficiency of chest CT radiomics to diagnose COVID-19 pneumonia compared with a clinical model. The proposed model obtained better results in distinguishing COVID-19 from other viral pneumonia with an AUC of 0.93 compared with the clinical method. However, in our study, the whole lung was delineated, and then, its information was extracted to construct the quantitative characteristics of images. We obtained better results than the study of Liu et al. (AUC of 0.997 by KNN) and declared the whole lung’s radiomics features could be used to differentiate patients with COVID-19 from suspected cases.
Homayounieh et al. [40] predicted pneumonia in the COVID-19 patients using whole lung radiomics, radiologists’ interpretation, and clinical variables. They concluded that radiomics is a priority over other diagnostic methods. Radiomics feature differentiated chest CT in outpatient vs. inpatient with an AUC of 0.84. With high accuracy and AUC, the current study represented that radiomics with the segmentation of the whole lung can differentiate COVID-19 patients from those suspected. Besides, feature sets and important extracted features were reported to differentiate patients.
This study had some limitations, which can be improved in the future. A limited patient dataset is available that eventually impacts the training capacity of the developed procedures. Also, there are several challenges related to the technical complexities of the radiomics. Radiomics is an emerging field of research proposing to extract high-dimensional data from clinical images. These processes can be divided into different steps, including determinable inputs and outputs, such as image acquisition, image segmentation, feature extraction, analysis, and model building. Despite the large number of tools developed to calculate the radiomics quantitative features, it is still challenging to carefully check the input data quality and select appropriate parameters to guarantee a reliable output. Furthermore, there are several challenges related to technical complexities in various aspects of the radiomics. More significantly, radiomic features quantification is sensitive to data acquisition parameters (artifacts, reconstruction procedures, and sampling) and variations of feature extraction procedures. Also, lesion segmentation and feature extraction algorithms are user-dependent. Ideally, independent validation is needed to confirm the predictive value of the same radiomics features.
5Conclusion
In the present study, for screening COVID-19 from the chest CT images, machine-learning (ML) methods based on extracted radiomics features were proposed. It can be concluded that RFE+KNN, RFE+BAG, and RFE+GBDT classifiers, and four radiomics’ features belonged to the intensity direct and GLCM feature set including LocalEntropyStd, LocalStdMax, MeanAbsoluteDeviation, and 90–4 SumVariance, can be used to differentiate patients with a confirmed infection caused by COVID-19 from the suspected cases. Also, the RFE+KNN classifier, as the ML method with the best performance, can differentiate patients with a confirmed infection caused by COVID-19 from the suspected cases. Therefore, these methods can be used in low- and middle-income countries and laboratory equipment with limited resources to overcome a shortage of radiologists.
Funding
No funding was received for this study.
Conflict of interest
The authors declare that they have no conflict of interest.
Ethical approval
All procedures performed in studies involving human participants were in accordance with the ethical standards of the institutional and/or national research committee and with the 1964 Helsinki declaration and its later amendments or comparable ethical standards.
Acknowledgments
The patients’ imaging was acquisitioned from Department of Radiology, Imam Khomeini Hospital (Tehran, Iran). Therefore, the authors express their sincere appreciation to the staff members of the above center.
References
[1] | Wu D. , Wu T. , Liu Q. , Yang Z. , The SARS-CoV-2 outbreak: what we know, International Journal of Infectious Diseases 94: ((2020) ), 44–48. |
[2] | Carlos W.G. , Dela Cruz C.S. , Cao B. , et al., Novel Wuhan -nCoV) Coronavirus, Am J Respir Crit Care Med 201: (4) ((2020) ), P7–P8. |
[3] | Linton N.M. , Kobayashi T. , Yang Y. , et al., Incubation period and other epidemiological characteristics of 2019 novel coronavirus infections with right truncation: a statistical analysis of publicly available case data, Journal of Clinical Medicine 9: ((2020) ), 538. |
[4] | Singhal T. , A review of coronavirus disease-2019 (COVID-19), The Indian Journal of Pediatrics (2020), 1–6. |
[5] | Hellou M.M. , Górska A. , Mazzaferri F. , et al., Nucleic-acid-amplification tests from respiratory samples for the diagnosis of coronavirus infections: systematic review and meta-analysis, Clinical Microbiology and Infection (2020), S1198-743X(20)30695-9 |
[6] | Tan A.S. , Nerurkar S.N. , Tan W.C.C. , et al., The virological, immunological, and imaging approaches for COVID-19 diagnosis and research, SLAS Technology 25: (6) ((2020) ), 522–544. |
[7] | Helmy Y.A. , Fawzy M. , Elaswad A. , et al., The COVID-19 pandemic: a comprehensive review of taxonomy, genetics, epidemiology, diagnosis, treatment, and control, Journal of Clinical Medicine 9: ((2020) ), 1225. |
[8] | Tu Y-F. , Chien C.-S. , Yarmishyn A.A. , et al., A review of SARS-CoV-2 and the ongoing clinical trials, International Journal of Molecular Sciences 21: ((2020) ), 2657. |
[9] | Phan T. , Novel coronavirus: From discovery to clinical diagnostics, Infection, Genetics and Evolution 79: ((2020) ), 104211. |
[10] | Dai W-C. , Zhang H-W. , Yu J. , et al., CT imaging and differential diagnosis of COVID-19, Canadian Association of Radiologists Journal 71: ((2020) ), 195–200. |
[11] | Ye Z. , Zhang Y. , Wang Y. , et al., Chest CT manifestations of new coronavirus disease 2019 (COVID-19): a pictorial review, European Radiology 30: (8) ((2020) ), 4381–4389. |
[12] | Zhang H. , Liu X. , Yu P. , et al., Dynamic CT assessment of disease change and prognosis of patients with moderated COVID-19 pneumonia, Journal of X-ray Science and Technology 28: (5) ((2020) ), 851–861. |
[13] | Zhao W. , Zhong Z. , Xie X. , et al., Relation between chest CT findings and clinical conditions of coronavirus disease (COVID-19) pneumonia: a multicenter study, American Journal of Roentgenology 21: ((2020) ), 1072–1077. |
[14] | Xia W. , Shao J. , Guo Y. , et al., Clinical and CT features in pediatric patients with COVID-19 infection: Different points from adults, Pediatric Pulmonology 55: ((2020) ), 1169–1174. |
[15] | Gu Q. , Ouyang X. , Xie A. , et al., A retrospective study of the initial chest CT imaging findings in 50 COVID-19 patients stratified by gender and age, Journal of X-ray Science and Technology 28: (5) ((2020) ), 875–884. |
[16] | Li Y. , Xia L. , Coronavirus disease 2019 (COVID-19): role of chest CT in diagnosis and management, American Journal of Roentgenology 214: ((2020) ), 1280–1286. |
[17] | Mayerhoefer M.E. , Materka A. , Langs G. , et al., Introduction to radiomics, Journal of Nuclear Medicine 61: ((2020) ), 488–495. |
[18] | Liu P. , Gu Q. , Hu X. , et al., Applying a radiomics-based strategy to preoperatively predict lymph node metastasis in the resectable pancreatic ductal adenocarcinoma, Journal of X-ray Science and Technology 28: (6) ((2020) ), 1113–1121. |
[19] | Rizzo S. , Botta F. , Raimondi S. , et al., Radiomics: the facts and the challenges of image analysis, European Radiology Experimental 2: (1) ((2018) ), 36. |
[20] | Parekh V. , Jacobs M.A. , Radiomics: a new application from established techniques, Expert Review of Precision Medicine and Drug Development 1: ((2016) ), 207–26. |
[21] | Rodriguez-Galiano V. , Luque-Espinar J. , Chica-Olmo M. , Mendes M. , Feature selection approaches for predictive modelling of groundwater nitrate pollution: An evaluation of filters, embedded and wrapper methods, Science of the Total Environment 624: ((2018) ), 661–672. |
[22] | Erickson B.J. , Korfiatis P. , Akkus Z. , Kline T.L. , Machine learning for medical imaging, Radiographics 37: ((2017) ), 505–515. |
[23] | Hao W. , Li M. , Clinical diagnostic value of CT imaging in COVID-19 with multiple negative RT-PCR testing, Travel Medicine and Infectious Disease 34: ((2020) ), 101627. |
[24] | Fang M. , He B. , Li L. , et al., CT radiomics can help screen the coronavirus disease 2019 (COVID-19): a preliminary study, Science China Information Sciences 63: ((2020) ). |
[25] | Wu Q. , Wang S. , Li L. , et al., Radiomics Analysis of Computed Tomography helps predict poor prognostic outcome in COVID-19, Theranostics 10: ((2020) ), 7231. |
[26] | Huang Y. , Zhang Z. , Li X. , et al., CT-based radiomics combined with signs: A valuable tool to help physician discriminate COVID-19 and other viral pneumonia, Research Square (2020), doi:10.21203/rs.3.rs-63088/v1 |
[27] | Zhang L. , Fried D.V. , Fave X.J. , et al., IBEX: an open infrastructure software platform to facilitate collaborative work in radiomics, Medical Physics 42: ((2015) ), 1341–1353. |
[28] | Lambin P. , Rios-Velazquez E. , Leijenaar R. , et al., Radiomics: extracting more information from medical images using advanced feature analysis, European Journal of Cancer 48: ((2012) ), 441–446. |
[29] | Larue R.T. , Defraene G. , De Ruysscher D. , et al., Quantitative radiomics studies for tissue characterization: a review of technology and methodological procedures, The British Journal of Radiology 90: ((2017) ), 20160665. |
[30] | Parmar C. , Grossmann P. , Bussink J. , et al., Machine learning methods for quantitative radiomic biomarkers, Scientific Reports 17: ((2015) ), 13087. |
[31] | Yin P. , Mao N. , Zhao C. , et al., Comparison of radiomics machine-learning classifiers and feature selection for differentiation of sacral chordoma and sacral giant cell tumour based on 3D computed tomography features, European Radiology 29: ((2019) ), 1841–1847. |
[32] | Saeys Y. , Inza I. , Larrañaga P. , A review of feature selection techniques in bioinformatics, Bioinformatics 23: ((2007) ), 2507–2517. |
[33] | Kotsiantis S.B. , Zaharakis I.D. , Pintelas P.E. , Machine learning: a review of classification and combining techniques, Artificial Intelligence Review 26: ((2006) ), 159–190. |
[34] | Purushotham S. and Tripathy B.K. , Evaluation of classifier models using stratified tenfold cross validation techniques. In International Conference on Computing and Communication Systems (2011), Springer, Berlin, Heidelberg. |
[35] | Barboza F. , Kimura H. , Altman E. , Machine learning models and bankruptcy prediction, Expert Systems with Applications 83: ((2017) ), 405–417. |
[36] | Liu Z. , Wang S. , Di Dong J.W. , et al., The applications of radiomics in precision diagnosis and treatment of oncology: opportunities and challenges, Theranostics 9: ((2019) ), 1303. |
[37] | Yue H. , Yu Q. , Liu C. , et al., Machine learning-based CT radiomics method for predicting hospital stay in patients with pneumonia associated with SARS-CoV-2 infection: a multicenter study, Annals of Translational Medicine 8: (14) ((2020) ), 859. |
[38] | Xie C. , Ng M-Y. , Ding J. , et al., Discrimination of pulmonary ground-glass opacity changes in COVID-19 and non-COVID-19 patients using CT radiomics analysis, European Journal of Radiology Open 7: ((2020) ), 100271. |
[39] | Liu H. , Ren H. , Wu Z. , Xu H. , Zhang S. , Li J. , et al., CT radiomics facilitates more accurate diagnosis of COVID-19 pneumonia: compared with CO-RADS, Journal of Translational Medicine 19: ((2021) ), 29. |
[40] | Homayounieh F. , Ebrahimian S. , Babaei R. , et al., CT radiomics, radiologists and clinical information in predicting outcome of patients with COVID-19 pneumonia, Radiology: Cardiothoracic Imaging 2: ((2020) ), e200322. |


