
Computer aid screening of COVID-19 using X-ray and CT scan images: An inner comparison
Abstract
The objective of this study is to conduct a critical analysis to investigate and compare a group of computer aid screening methods of COVID-19 using chest X-ray images and computed tomography (CT) images. The computer aid screening method includes deep feature extraction, transfer learning, and machine learning image classification approach. The deep feature extraction and transfer learning method considered 13 pre-trained CNN models. The machine learning approach includes three sets of handcrafted features and three classifiers. The pre-trained CNN models include AlexNet, GoogleNet, VGG16, VGG19, Densenet201, Resnet18, Resnet50, Resnet101, Inceptionv3, Inceptionresnetv2, Xception, MobileNetv2 and ShuffleNet. The handcrafted features are GLCM, LBP & HOG, and machine learning based classifiers are KNN, SVM & Naive Bayes. In addition, the different paradigms of classifiers are also analyzed. Overall, the comparative analysis is carried out in 65 classification models, i.e., 13 in deep feature extraction, 13 in transfer learning, and 39 in the machine learning approaches. Finally, all classification models perform better when applying to the chest X-ray image set as comparing to the use of CT scan image set. Among 65 classification models, the VGG19 with SVM achieved the highest accuracy of 99.81%when applying to the chest X-ray images. In conclusion, the findings of this analysis study are beneficial for the researchers who are working towards designing computer aid tools for screening COVID-19 infection diseases.
1Introduction
The COVID-19 is a deadly acute disease caused by SARS-Cov-2 coronavirus and was first reported in Wuhan province, China, in December 2019. COVID-19 outbreaks continue to spread worldwide, with over 18.6 million people across 200 countries [1]. “At present COVID-19 pandemic is the most pressing issue confronting our whole world due to its massive negative impact on public health [2].” Although governments and rulers imposing various new schemes, policies and created new lifestyles to combat COVID-19. Science and technology have a major contribution in implementing these new schemes and policies [3].
On the other hand, recently, artificial intelligence and computer-aided screening have been widely adopted and successfully applied to accelerate biomedical research and development [4]. Machine learning, deep learning, and transfer learning have been used in many applications, including data classification [5] and image detection and segmentation [6]. There exist numerous open online databases, including chest X-Ray and CT scan datasets. Various studies have recently pointed out that X-Ray and CT scan images play an essential evaluation in screening and diagnosing COVID- 19 infection. The epidemic of Coronavirus Disease 2019 (COVID-19) has recently spread widely around the globe. Owing to a vast number of infected patients and extensive medical practice, computer-aided diagnostics with modern algorithms such as Image Processing, Machine Learning, Deep Learning, and Transfer Learning are required and could significantly reduce clinicians’ efforts and enhance the diagnostic process. X-ray and CT scans have been used as insightful tools for the diagnosis of various disorders. Various studies have recently pointed out that X-Ray and CT images play an essential evaluation in screening and diagnosing COVID-19 infection.
Using X-ray images, a deep learning-based methodology is proposed for detecting COVID-19 infected patients. In the study, the classification model “Resnet50 plus SVM” has shown impressive results, i.e., accuracy (95.38%), FPR (95.52), F1 score 91.41%, and MCC & Kappa are 90.76%[7].” Similarly, for the detection of coronavirus pneumonia infected patient, CNN based models are suggested including Resnet50, Resnet101, Resnet152, InceptionV3, and Inception-ResNetV2 [8].” Among which Resnet50 model provides the highest accuracy of 99.5%. Based on deep Bayes-SqueezeNet, one study [9] proposed a methodology for diagnosing coronavirus disease 2019 with the support of chest X-Ray radiographs. The SqueezeNet is tuned with the lightest network along with a Bayesian optimization additive. Using the DarkNet model, another study [10] had presented 17 Convolutional layers for evaluating binary classification, i.e., COVID vs. No-finding and multi-class classification, i.e., COVID vs. No-findings vs. Pneumonia. The highest accuracy obtained was for binary classification of 98.08%in the study, whereas it was about 87.07%for multi-class classification.
Based on the performance of CT scans, study [11] had suggested that CT was also a good method for diagnosis and management of COVID-19. For optimize management and rapid diagnosis of COVID-19, the chest CT scans had a low missed diagnosis of COVID-19, i.e., 3.9%and 2/51, which may be useful as a standard method. Again, a deep learning model was proposed to segment and quantify the infected lungs with the support of CT scans [12]. The study included 549 CT images and the Dice similarity 2 coefficient concept was adopted and obtained 91.6%. Also, mentioned that delineation time is reduced by about four times. The innovative frequency domain algorithm (FFT)-Gabor was suggested by [13] for the digital test of COVID-19 patients using CT scan images with machine learning. The results obtained in the study were quite promising with 95.37%accuracy along with sensitivity and specificity of 95.99%and 94.76%, respectively. According to the study, FFT-Gabor supports the visual examination as well as in the final diagnostic.
The National Cancer Institute conducted a National Lung Screening Trial (NLST) and reported that X-Ray imaging is better than CT scan images for the screening of any lung-related diseases [14]. “X-rays or scans produce an image of the organs and structures (heart, lungs, and airways) in the chest. They can detect blockages, inflammation, and excess fluid. X-rays (radiography) use a small amount of radiation to produce a 2-D image. They are usually carried out in hospitals using fixed equipment by a radiographer but may also be carried out using a portable machine. Computed tomography (CT) scans use a computer to merge multiple X-ray images from different angles to produce a 2-D image converted to a 3-D image. They require highly specialized equipment and are carried out in the hospital by a specialist radiographer [14].” Again, the operational setting variability is more in the CT scan machine than the X-ray machines. So, there are chances of more variations of CT scan images than the X-Ray images. In addition, computer diagnosis in any learning method takes 2-D images as its input. But the CT scan is a 3-D image. When it converts to 2-D slices, there is a chance of loss of information. “Also, according to COCHRANE, chest CT correctly identified an infection in 93%of people with confirmed COVID-19 but incorrectly identified infections in 82%of people who were not infected with COVID-19 (suspected) [15]. This finding indicates that chest CT is sensitive but not specific for the diagnosis of COVID-19 in suspected patients, meaning that CT may not be capable of differentiating SARS-CoV-2 infection from other causes of respiratory illness [15].” Further, because of large scale data availability, easy X-Ray imaging, low cost, widely available X-Ray imaging machines, and significantly less variability within X-Ray images, the X-Ray image is preferable to use computer aid diagnosis towards screening of COVID-19.
As still there are many confusions towards the contribution of X-ray and CT scan images for the screening of COVID-19 based on computer aid tools, we are motivated to do a comparative study. The main objective of this article is to provide a comparative analysis of various models of machine learning, deep learning, and transfer learning used for screening of COVID-19 using X-Ray and CT scan images. This comparative analysis provides a complete remark about the contribution of X-ray and CT scan images towards the screening of COVID-19 based on computer aid diagnosis. The remaining of the article is as follows. Section 2 describes the data samples with their resources. The methodology is presented in section 3. Section 4 offers experimental outcomes. The contribution of this research is discussed in section 5. Finally, section 6 concludes the article.
2Image data
To build a consistent and robust model, it is essential to ensure the same number of samples while considering all the cases for each class. For this study, we have used the chest X-ray and CT scan image available in Github [16] and Kaggle repository [17]. The publicly accessible database comprises X-Ray and CT scans for both the class, i.e., Non-COVID-19 images and COVID-19 infected images. Figure 1 illustrated the COVID-19 and non-COVID-19 X-ray and CT scan images. The image samples involved in this comparative analysis are detailed in Table 1.
Fig. 1
Medical image samples (a) COVID-19 X-ray (b) Non-COVID-19 X-ray (c) COVID-19 CT Scan (d) Non-COVID-19 CT Scan.
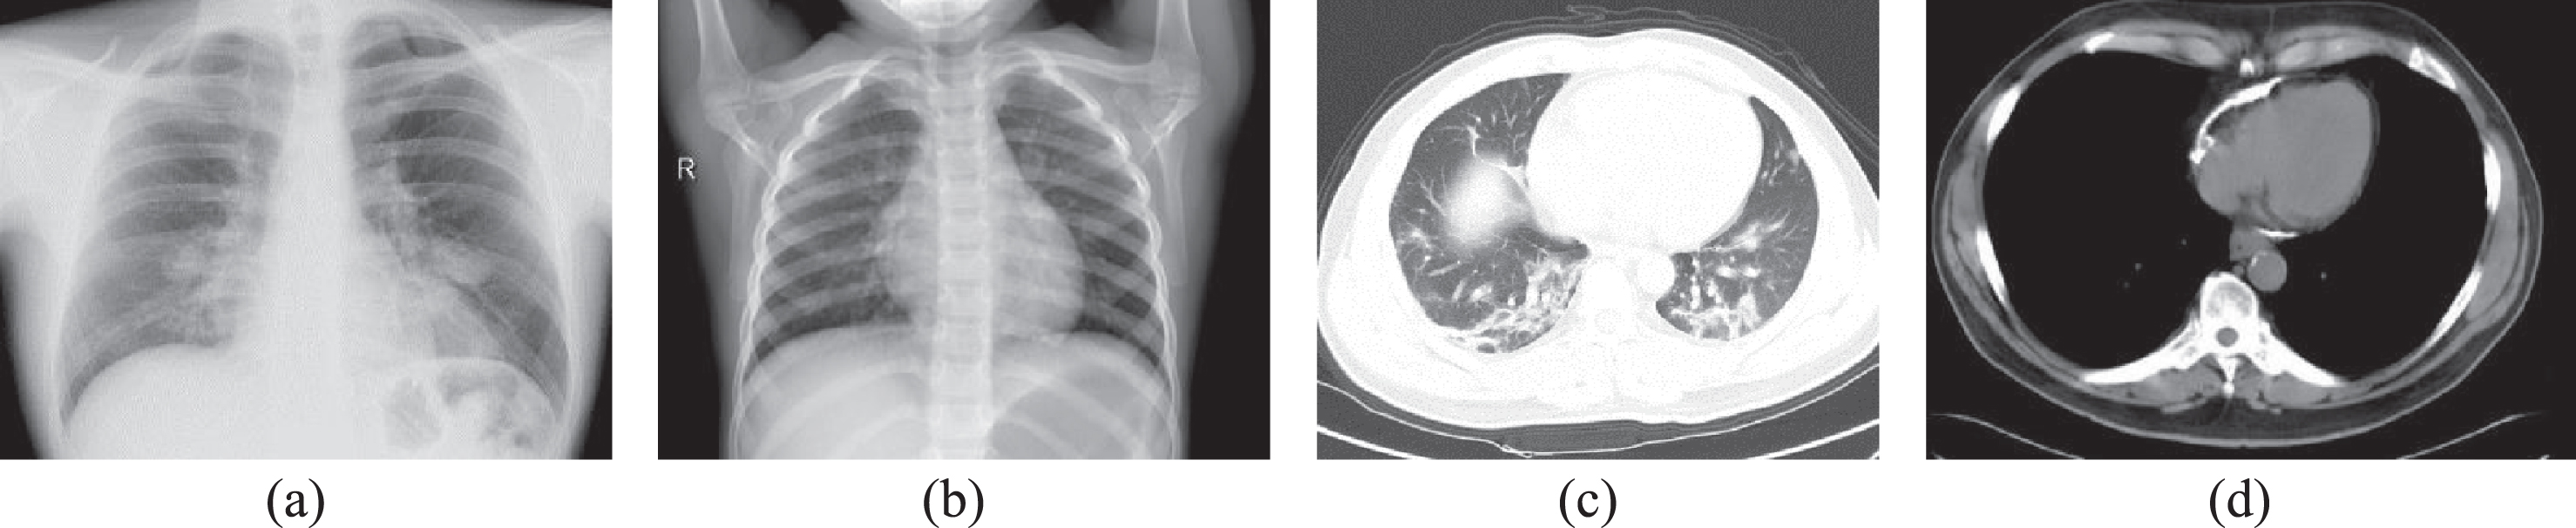
Table 1
The distribution of study samples
| Dataset | Class | No. of samples |
| X-Ray | COVID-19 | 350 |
| Non-COVID-19 | 350 | |
| CT Scan | COVID-19 | 350 |
| Non-COVID-19 | 350 |
3Methodology
In this section, the details of the methods adopted for the screening of COVID-19 using X-ray and CT Scan images are presented in appropriate subheadings.
3.1Deep feature extraction approach
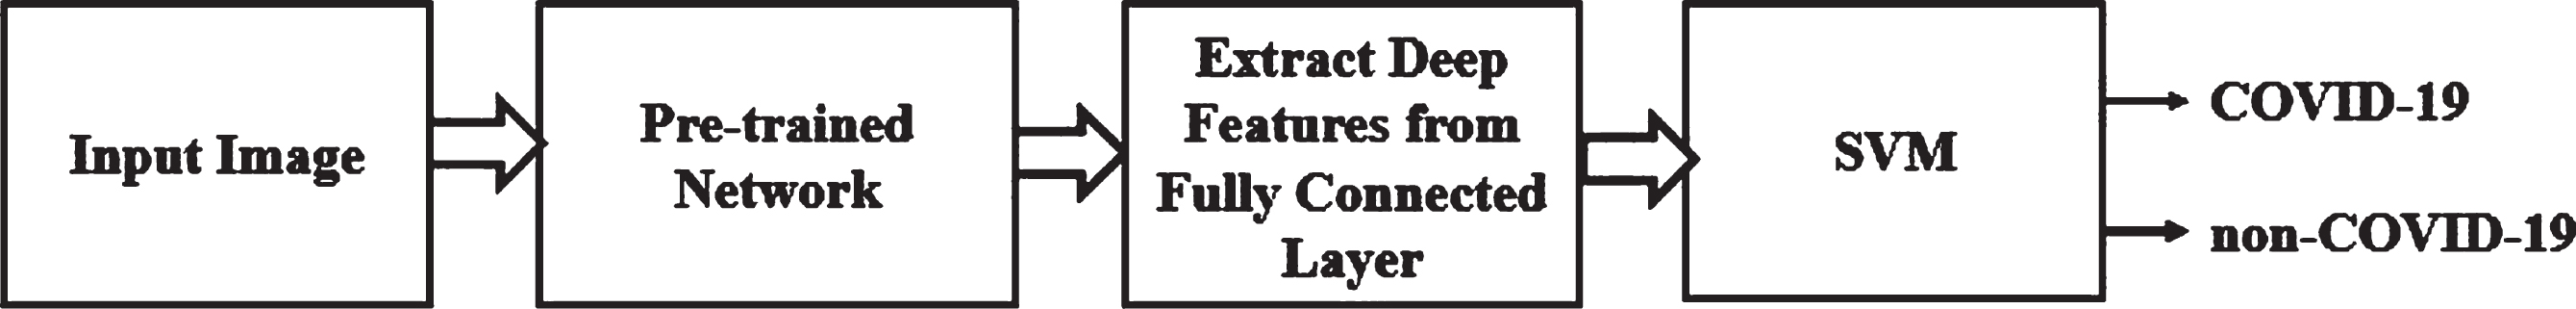
Deep feature extraction is based on the extraction of features acquired from a pre-trained CNN. The deep features are extracted from fully connected layer and feed to the classifier for training purposes. Here, all the 13 pre-trained networks are considered for deep features extraction including alexnet, googlenet, vgg16, vgg19, densenet201, resnet18, resnet50, resnet101, inceptionv3, inceptionresnetv2, xception, mobilenetv2 and shufflenet. The deep features of a pre-trained network fed to the SVM for classification. The classification model in the deep feature extraction approach is illustrated in Fig. 2.
Fig. 2
Deep Feature Extraction Approach for Screening of COVID-19.
The deep features of CNN models are extracted from a particular layer, and a feature vector is obtained. The mathematics behind the process of feature extraction from the CNN model is explained in [18]. The features are fed to the SVM classifier for the classification of COVID-19 and non-COVID-19. The details of the feature layer and feature vector of CNN models are illustrated in Table 2. “The CNN is a multilayer structure network, and each layer produces a response. The layers extract the essential image feature and pass it to the next layer. The activation in GPU with a minibatch size of 64 and GPU memory has enough space to fit the image dataset. The activation output is in the form of the column to fit in linear SVM training. To train the SVM, the function ‘fit class error-correcting output codes (‘fitcecoc’) is used. This function returns the full trained multi-class error-correcting output of the model. The function ‘fitcecoc’ uses K(K-1)/2, binary SVM model, using One-Vs-All coding design. Here, K is a unique class label. Because of error-correcting output codes and one-Vs-all coding design of SVM, the performance of classification models is enhanced [19].”
Table 2
Details of feature layer and feature vector of CNN models
| CNN Models | Feature Layer | Feature Vector | CNN models | Feature Layer | Feature Vector |
| AlexNet | fc6 | 4096 | Xception | predictions | 1000 |
| Vgg16 | fc6 | 4096 | Resnet18 | Fc1000 | 1000 |
| Vgg19 | Fc6 | 4096 | Resnet50 | Fc1000 | 1000 |
| Inceptionv3 | predictions | 1000 | Resnet101 | Fc1000 | 1000 |
| MobileNetV2 | Logits | 1000 | Densenet201 | Fc1000 | 1000 |
| ShuffleNet | Node_202 | 1000 | Inceptionresnetv2 | predictions | 1000 |
| GoogleNet | loss3-classifier | 1000 |
3.2Transfer learning approach
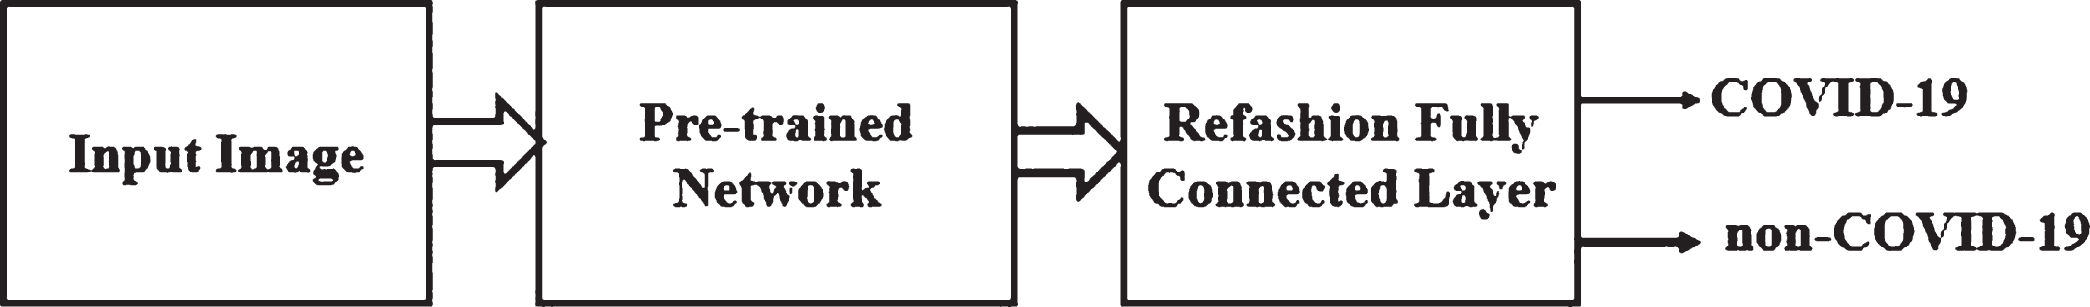
The transfer learning approach is a subset of machine learning that utilizes pre-collected knowledge from the established model. This section deals with the screening of COVID-19 in the transfer learning approach. In this approach 13 pre-trained network such as alexnet, googlenet, vgg16, vgg19, densenet201, resnet18, resnet50, resnet101, inceptionv3, inceptionresnetv2, xception, mobilenetv2 and shufflenet are evaluated. The classification model in the transfer learning approach is illustrated in Fig. 3.
Fig. 3
Transfer Learning Approach for Screening of COVID-19.
3.3Machine learning approach
The screening of COVID-19 using the machine learning approach includes HOG, LBP, and GLCM features. “The histogram of oriented gradients (HOG) is a feature descriptor used in computer vision and image processing for object detection. The technique counts occurrences of gradient orientation in localized portions of an image [20].” “Local binary patterns (LBP) are a type of visual descriptor used for classification in computer vision [21].” “A statistical method of examining texture that considers the spatial relationship of pixels is the Gray-level co-occurrence matrix (GLCM), also known as the Gray-level spatial dependence matrix [22, 23].” Using these features, the classifier such as Naïve bayes, KNN, and SVM with their different paradigms are evaluated. The machine learning classifiers are evaluated with the similar approach adopted in deep feature extraction and transfer learning approaches, i.e., training: testing ratio is 80:20.
4Experimental results
This section provides a comparative analysis of various models of deep learning, transfer learning and machine learning approach using X-Ray and CT scan images for the screening of COVID-19. The exploration study was actualized utilizing the MATLAB 2019a. All the applications were run on a laptop, i.e., HP Pavilion Core i5 5th Generation with basic NVIDIA GEFORCE GTX 1050Ti. Each classifier’s performance is measured using six evaluation indicators, namely accuracy, sensitivity, specificity, false-positive rate (FPR), F1 Score and computational time in both deep learning feature extraction and transfer learning approach. The accuracy and area under the curve (AUC) are used in the machine learning approach to measure the performance of the classifiers. The most reliable classifier, namely support vector machine (SVM), is employed to classify the COVID-19 and non-COVID-19 images in the deep feature extraction method. Here we are not adopting any augmentation technique to increase the volume of the dataset. The introduction of augmentation techniques to increase the dataset has many disadvantages, such as (1) easy generation of anatomically incorrect samples (2) not trivial to implement (3) mode collapse problem. Further, our main aim is to provide the efficacy of X-ray and CT scan images towards coronavirus diagnosis. The data samples are split randomly into 80:20 proportions for training and testing, respectively. All the images are resized to 227× 227× 3 dimensions. The evaluation indicators are expressed in (1) to (6) equations.
(1)
(2)
(3)
(4)
(5)
(6)
where TP = true positive, TN = true negative, FP = false positive, and FN = false negative.
The hyperparameters used in all of the experiments in deep feature extraction and transfer learning approaches are: “solver type: stochastic gradient descent, the initial learning rate is 0.001, learning rate policy: Step (decreases by a factor of 10 every 50/5 epochs), momentum: 0.9, drop out is 0.2, Number of Epochs is 50 and minibatch size: 64”. Subsection 4.1, subsection 4.2, and subsection 4.3 presented the experimental result outcomes of deep feature extraction, transfer learning, and machine learning approach for classification of COVI19 and NON-COVID respectively.
4.1Results based on deep feature extraction methods
In this subsection, 13 pre-trained CNN models based on deep feature extraction approach using X-Ray and CT Scan images are examined. We have made 30 independent runs for the experiments, and its mean & standard deviation of all evaluation indicators was recorded in Table 3.
Table 3
Comparative Results of X-ray and CT Scan Images in Deep Feature Extraction with SVM Approach
| Pre-Trained Model | X-ray Image | CT Scan Image | ||||||||||
| Accuracy | Sensitivity | Specificity | FPR | F1 Score | Computational Time (in Second) | Accuracy | Sensitivity | Specificity | FPR | F1 Score | Computational Time (in second) | |
| AlexNet | 0.991±0.005 | 0.991±0.011 | 0.999±0.003 | 0.001±0.003 | 0.995±0.005 | 28.48±0.88 | 0.698±0.072 | 0.623±0.257 | 0.773±0.206 | 0.227±0.206 | 0.643±0.166 | 20.017±2.046 |
| MobileNetV2 | 0.996±0.006 | 0.991±0.011 | 1.0±0.0 | 0.0±0.0 | 0.996±0.006 | 38.34±0.60 | 0.750±0.030 | 0.731±0.105 | 0.772±0.061 | 0.230±0.061 | 0.743±0.038 | 35.503±0.35 |
| ShuffleNet | 0.993±0.006 | 0.987±0.013 | 1.0±0.0 | 0.0±0.0 | 0.993±0.007 | 32.22±9.367 | 0.753±0.062 | 0.695±0.198 | 0.810±0.137 | 0.190±0.137 | 0.721±0.128 | 25.700±1.812 |
| Densenet201 | 0.996±0.005 | 0.993±0.010 | 1.0±0.0 | 0.0±0.0 | 0.996±0.005 | 131.1 + 8.3 | 0.783±0.043 | 0.748±0.139 | 0.890±0.158 | 0.181±0.158 | 0.771±0.054 | 151.1±6.6 |
| GoggleNet | 0.996±0.004 | 0.914±0.008 | 1.0±0.0 | 0.0±0.0 | 0.996±0.008 | 28.768±0.267 | 0.723±0.054 | 0.735±0.185 | 0.711±0.189 | 0.289±0.189 | 0.717±0.089 | 25.18±0.32 |
| Inception Resnet V2 | 0.994±0.007 | 0.988±0.014 | 1.0±0.0 | 0.0±0.0 | 0.9942±0.0073 | 171.6±2.9 | 0.753±0.049 | 0.747±0.148 | 0.758±0.166 | 0.241±0.167 | 0.746±0.075 | 175.93±2.5 |
| InceptionV3 | 0.994±0.006 | 0.988±0.013 | 1.0±0.0 | 0.0±0.0 | 0.994±0.007 | 79.442±3.841 | 0.744±0.046 | 0.783±0.110 | 0.704±0.144 | 0.295±0.144 | 0.752±0.047 | 77.863±0.561 |
| Resnet18 | 0.996±0.005 | 0.992±0.007 | 0.999±0.005 | 0.001±0.005 | 0.996±0.005 | 31.62±9.98 | 0.739±0.061 | 0.692±0.197 | 0.786±0.196 | 0.213±0.196 | 0.713±0.106 | 26.56±0.17 |
| Resnet50 | 0.997±0.005 | 0.993±0.011 | 1.0±0.0 | 0.0±0.0 | 0.996±0.006 | 31.680±2.265 | 0.783±0.069 | 0.739±0.185 | 0.827±0.175 | 0.173±0.175 | 0.762±0.110 | 53.44±11.15 |
| Resnet101 | 0.990±0.007 | 0.985±0.011 | 0.996±0.009 | 0.004±0.010 | 0.991±0.007 | 77.56±0.01 | 0.767±0.064 | 0.738±0.182 | 0.797±0.159 | 0.203±0.159 | 0.749±0.106 | 79.35±1.88 |
| VGG 16 | 0.9945±0.005 | 0.990±0.009 | 0.998±0.008 | 0.001±0.008 | 0.995±0.005 | 95.37±2.55 | 0.813±0.050 | 0.769±0.132 | 0.857±0.083 | 0.142±0.083 | 0.799±0.078 | 95.46±1.24 |
| VGG19 | 0.998±0.003 | 0.996±0.007 | 1.0±0.0 | 0.0±0.0 | 0.998±0.003 | 111.869±1.256 | 0.813±0.038 | 0.803±0.134 | 0.823±0.129 | 0.177±0.129 | 0.807±0.051 | 115.911±1.528 |
| X ception | 0.993±0.006 | 0.986±0.013 | 1.0±0.0 | 0.0±0.0 | 0.993±0.007 | 105.810±0.013 | 0.752±0.048 | 0.743±0.156 | 0.762±0.151 | 0.238±0.151 | 0.743±0.080 | 110.51±4.64 |
*The results recorded are the mean and std. dev. of 30 independent runs of each classification models.
It is observed from Table 3; each classification model performed better in the case of X-ray images compared to CT scan images. There is no doubt the computational time is more in the X-ray image than CT scan image in some classification models. Still, the other evaluation indicators like accuracy, sensitivity, specificity, and F1score have better value. Again, the FPR is always less in the X-ray image than the CT scan image in all classification models. Further, among all classification models based on the deep feature extraction method, vgg19 achieved 99.81%accuracy utilizing X-ray image datasets. Again, with the same classification model using CT scan images resulted in 81.35%accuracy.
4.2Results based on transfer learning approach
In this subsection, we performed fine-tuning based on transfer learning using pre-trained CNN models. A total of 13 pre-trained CNN models in the transfer learning approach using X-Ray and CT Scan images are examined. We have made 30 independent runs for the experiments, and its mean & standard deviation of all evaluation indicators was recorded in Table 4.
Table 4
Comparative Results of X-ray and CT Scan Images in Transfer Learning Approach
| Pre-Trained Model | X-ray Image | CT Scan Image | ||||||||||
| Accuracy | Sensitivity | Specificity | FPR | F1 Score | Computational Time (in Second) | Accuracy | Sensitivity | Specificity | FPR | F1 Score | Computational Time (in second) | |
| AlexNet | 0.984±0.014 | 0.980±0.021 | 0.988±0.017 | 0.012±0.017 | 0.984±0.014 | 65.04±7.32 | 0.621±0.062 | 0.369±0.075 | 0.611±0.064 | 0.363±0.0.075 | 0.611±0.064 | 36.87±4.78 |
| MobileNet V2 | 0.986±0.013 | 0.983±0.015 | 0.989±0.018 | 0.011±0.018 | 0.986±0.013 | 66.209±8.652 | 0.642±0.043 | 0.638±0.062 | 0.646±0.066 | 0.354±0.066 | 0.640±0.045 | 39.02±5.28 |
| ShuffleNet | 0.985±0.012 | 0.975±0.021 | 0.994±0.012 | 0.006±0.012 | 0.984±0.012 | 65.84±8.12 | 0.642±0.041 | 0.641±0.055 | 0.643±0.063 | 0.357±0.063 | 0.641±0.042 | 39.19±7.73 |
| Densenet201 | 0.986±0.009 | 0.981±0.012 | 0.990±0.014 | 0.010±0.014 | 0.985±0.009 | 76.58±9.015 | 0.633±0.056 | 0.618±0.074 | 0.648±0.075 | 0.352±0.075 | 0.6263±0.059 | 50.94±6.31 |
| GoggleNet | 0988±0.011 | 0.985±0.014 | 0.991±0.017 | 0.009±0.017 | 0.988±0.011 | 65.152±10.034 | 0.611±0.059 | 0.619±0.066 | 0.603±0.081 | 0.396±0.081 | 0.615±0.058 | 37.82±4.90 |
| Inception Resnet V2 | 0.984±0.010 | 0.982±0.015 | 0.987±0.017 | 0.013±0.017 | 0.984±0.015 | 82.01±9.01 | 0.630±0.042 | 0.630±0.057 | 0.631±0.045 | 0.369±0.045 | 0.629±0.05 | 55.53±4.04 |
| InceptionV3 | 0.996±0.009 | 0.985±0.014 | 0.993±0.011 | 0.007±0.011 | 0.989±0.009 | 80.91±21.01 | 0.621±0.057 | 0.614±0.0748 | 0.629±0.074 | 0.371±0.074 | 0.618±0.060 | 39.32±4.17 |
| Resnet18 | 0.985±0.005 | 0.983±0.007 | 0.979±0.004 | 0.001±0.004 | 0.975±0.004 | 33.66±9.98 | 0.639±0.062 | 0.632±0.197 | 0.767±0.195 | 0.223±0.195 | 0.613±0.105 | 35.46±0.17 |
| Resnet50 | 0.982±0.016 | 0.798±0.017 | 0.985±0.019 | 0.015±0.019 | 0.982±0.015 | 65.75±9.39 | 0.644±0.055 | 0.628±0.072 | 0.660±0.061 | 0.339±0.061 | 0.637±0.059 | 39.073±4.757 |
| Resnet101 | 0.987±0.010 | 0.985±0.016 | 0.988±0.013 | 0.012±0.013 | 0.987±0.011 | 75.171±10.660 | 0.612±0.064 | 0.591±0.078 | 0.634±0.081 | 0.366±0.081 | 0.603±0.068 | 39.93±3.81 |
| VGG 16 | 0.984±0.010 | 0.985±0.013 | 0.988±0.015 | 0.012±0.015 | 0.986±0.011 | 81.68±21.65 | 0.634±0.042 | 0.638±0.071 | 0.658±0.048 | 0.342±0.048 | 0.644±0.051 | 47.33±12.64 |
| VGG19 | 0.984±0.011 | 0.978±0.012 | 0.990±0.016 | 0.010±0.016 | 0.984±0.011 | 78.96±13.74 | 0.648±0.042 | 0.617±0.075 | 0.652±0.056 | 0.347±0.055 | 0.627±0.054 | 39.95±4.56 |
| X ception | 0.987±0.010 | 0.981±0.002 | 0.994±0.009 | 0.006±0.009 | 0.987±0.010 | 75.83±12.08 | 0.617±0.061 | 0.603±0.075 | 0.615±0.075 | 0.369±0.075 | 0.611±0.064 | 36.78±4.78 |
*The results recorded are the mean and std. dev. of 30 independent runs of each classification models.
It is observed from Table 4; the classification model based on the transfer learning approach performed better in the case of X-ray images compared to CT scan images like the deep feature extraction method. Further, among all classification models based on transfer learning approaches, Inceptionv3 achieved the highest accuracy of 98.95%using X-ray images. Again, 62.17%of accuracy was achieved by Inceptionv3 in the case of CT scan images. Furthermore, using CT scan images, VGG19 achieved the highest accuracy in the transfer learning approach, i.e., 64.80%.
4.3Results based on machine learning approach
In this subsection, the three machine learning classifiers, namely naïve Bayes, SVM and KNN are examined to classify COVID-19 and non-COVID-19 images with their different paradigms. The evaluation process is the same as deed feature extraction and transfer learning approach, i.e., training and testing ratio is 80:20. The performance of classification models in machine learning approaches is in terms of accuracy and AUC. Table 5 noted the measures of classification models.
Table 5
Comparative Results of X-ray and CT Scan Images in machine learning Approach
| Classifier | X-ray Image | CT Scan Image | |||||||||||
| GLCM | HOG | LBP | GLCM | HOG | LBP | ||||||||
| Accuracy | AUC | Accuracy | AUC | Accuracy | AUC | Accuracy | AUC | Accuracy | AUC | Accuracy | AUC | ||
| (%) | (%) | (%) | (%) | (%) | (%) | ||||||||
| Naïve Bayes | Kernel Naïve Bayes | 98 | 0.99 | 92.9 | 0.95 | 92.1 | 0.95 | 69.3 | 0.76 | 60 | 0.68 | 67.1 | 0.7 |
| SVM | Linear SVM | 99.3 | 1 | 97.1 | 1 | 97.9 | 1 | 63.6 | 0.65 | 66.4 | 0.74 | 82.9 | 0.88 |
| Quadratic SVM | 99.3 | 1 | 99.3 | 1 | 99.5 | 1 | 83.6 | 0.92 | 67.1 | 0.77 | 85.7 | 0.89 | |
| Cubic SVM | 99.0 | 1 | 99.0 | 1 | 99.1 | 1 | 83.6 | 0.88 | 67.1 | 0.72 | 85.0 | 0.87 | |
| Fine Gaussian SVM | 99.1 | 1 | 97.9 | 0.99 | 99.0 | 1 | 85.0 | 0.95 | 57.1 | 0.73 | 83.6 | 0.92 | |
| Medium Gaussian SVM | 99.2 | 1 | 98.6 | 1 | 97.9 | 1 | 77.1 | 0.85 | 67.9 | 0.75 | 81.4 | 0.86 | |
| Coarse Gaussian SVM | 98.6 | 1 | 95.0 | 0.99 | 92.1 | 1 | 64.3 | 0.67 | 69.3 | 0.74 | 67.1 | 0.74 | |
| KNN | Fine KNN | 98.6 | 0.99 | 94.3 | 0.99 | 97.9 | 0.98 | 85.0 | 0.85 | 71.4 | 0.71 | 80.7 | 0.81 |
| Medium KNN | 98.6 | 0.99 | 88.6 | 0.98 | 94.3 | 0.99 | 74.3 | 0.83 | 70.0 | 0.75 | 73.6 | 0.84 | |
| Coarse KNN | 92.9 | 1 | 82.1 | 0.90 | 83.6 | 0.99 | 65.0 | 0.72 | 66.4 | 0.71 | 65.7 | 0.72 | |
| Cosine KNN | 97.9 | 0.99 | 93.6 | 0.99 | 95.7 | 0.98 | 76.6 | 0.82 | 60.0 | 0.69 | 79.3 | 0.84 | |
| Cubic KNN | 98.6 | 0.99 | 91.4 | 0.98 | 94.3 | 0.98 | 74.3 | 0.82 | 67.9 | 0.73 | 71.4 | 0.83 | |
| Weighted KNN | 98.6 | 0.99 | 92.9 | 0.99 | 96.4 | 0.99 | 81.4 | 0.91 | 74.3 | 0.75 | 76.4 | 0.88 | |
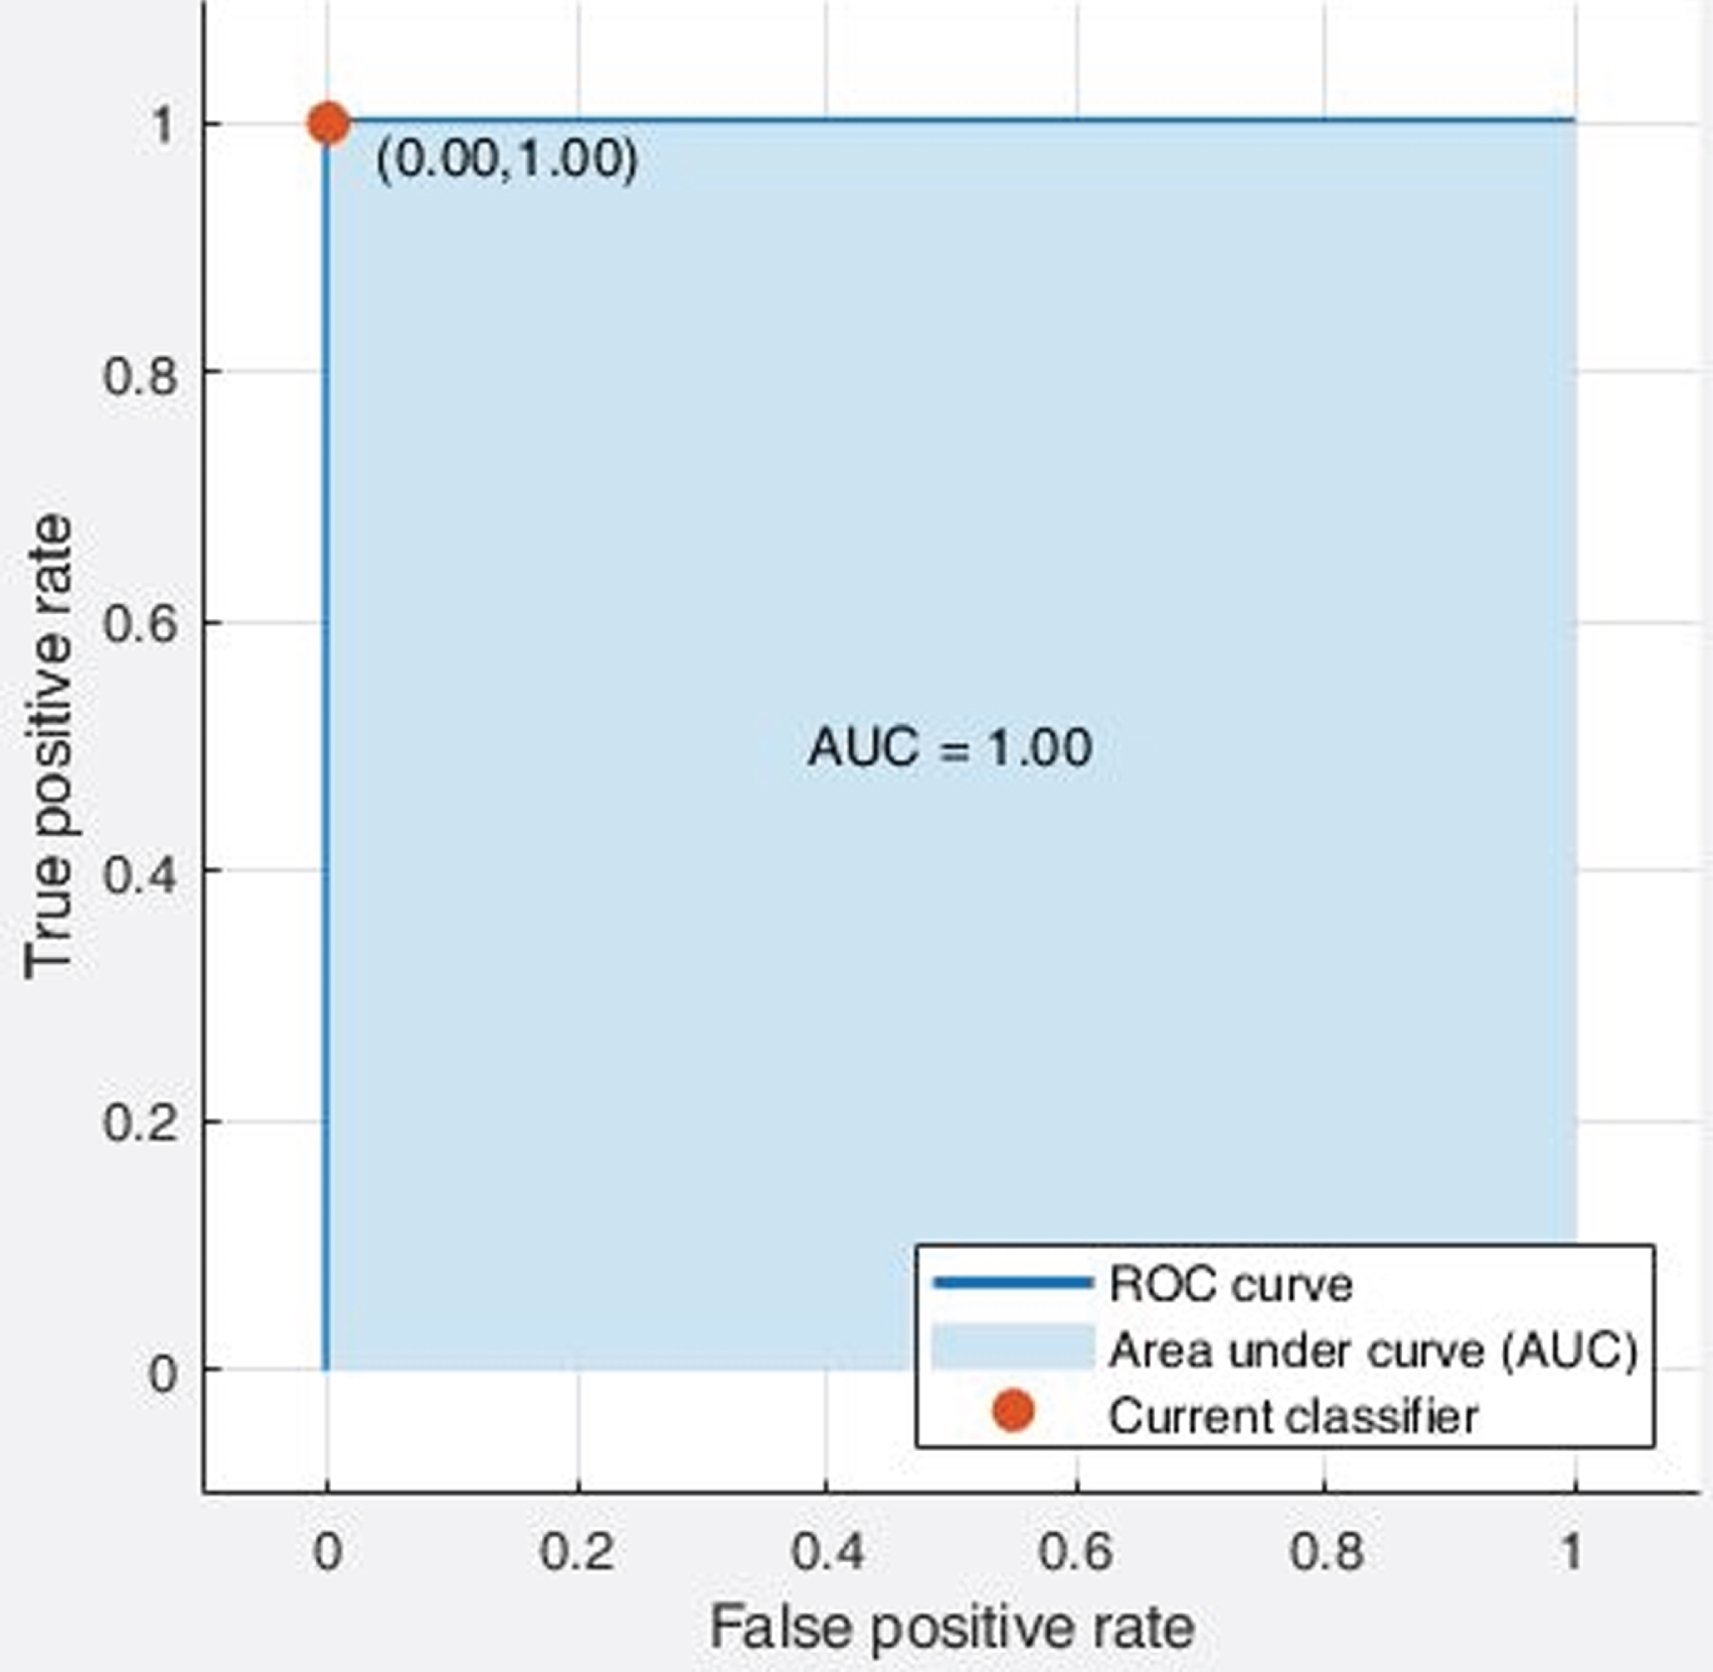
It was observed from Table 5; the effectiveness of X-ray images is better than the CT Scan images towards the diagnosis of coronaviruses irrespective of the classifiers and handcrafted features. Further, the highest accuracy achieved in the machine learning approach is the quadratic SVM with LBP features using X-ray images, i.e., 99.50%. However, in the case of CT scan images, that same classification model resulted in 85.70%accuracy. As an example, the screenshot of the confusion matrix and ROC plot resulted from quadratic SVM with LBP feature using X-Ray images is illustrated in Fig. 4 and Fig. 5, respectively. Thus, the results of analysis and comparison of 65 classification models in this study indicate that developing computer aided classification models using chest X-ray images can achieve better performance than using CT scan images to screen COVID-19 infected diseases.
Fig. 4
Confusion Matrix of Quadratic SVM classifier with LBP features using X-ray images.
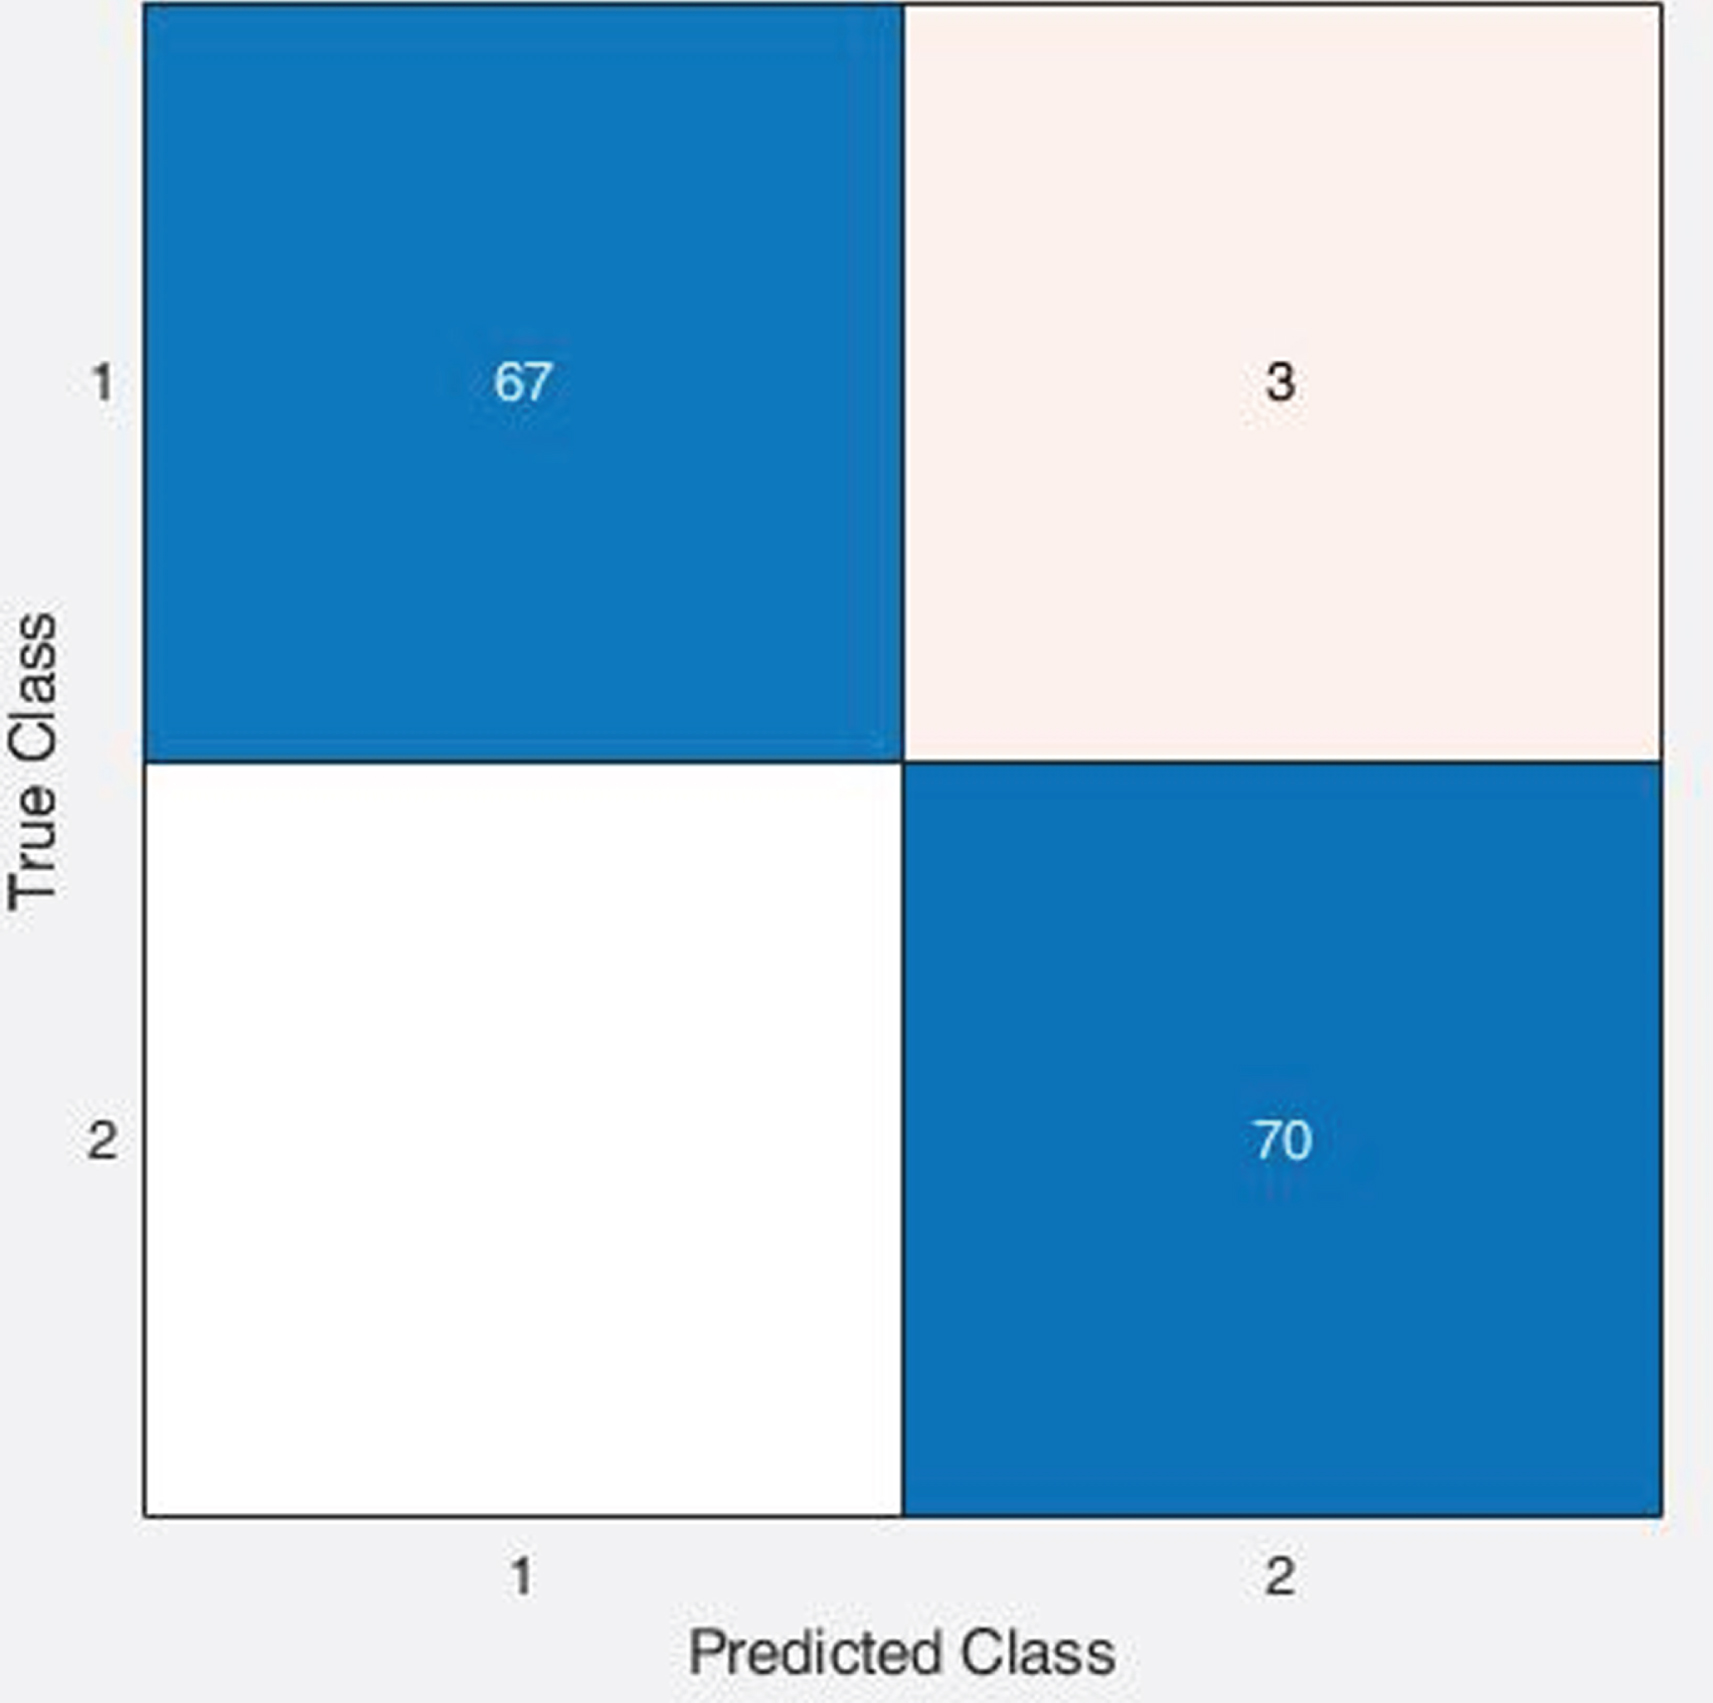
Fig. 5
ROC curve of Quadratic SVM classifier with LBP features using X-ray images.
5Discussion
Various studies have pointed out that chest X-ray images [24] and CT [25] images can play an essential evaluation role for screening and diagnosing COVID- 19 infection [26] using various methods and techniques such as Structured Latent Multi-View Representation Learning [27], CXR features [28], Deep features and Bayesian Optimization [29] and nCOVnet [30], etc. Studies related to detection and early diagnosis of coronavirus using CT scans and X-ray images are continuing. Table 6 illustrated the various techniques with their achievements for screening COVID-19.
Table 6
Various techniques with their achievements for the screening of COVID-19
| Reference | Datasets | Class/Subjects | Methods | Accuracy (%) |
| Hemdan et al. [31] | X-Ray | COVID-19 (positive): 25 | CovidX Network | 90 |
| Normal: 25 | ||||
| Wang and Wong [32] | X-Ray | COVID-19 (positive): 53 | Covid Network | 92.4 |
| Healthy:8066 | ||||
| COVID-19 (negative): 5526 | ||||
| Ghoshal et al. [33] | X-Ray | COVID-19(positive): 25 | Convolutional Neural Network | 92.9 |
| Others - #Not available | ||||
| Ioannis et al. [34] | X-Ray | COVID-19(positive): 224 | VGG-19 Network | 93.48 |
| Healthy: 504 | ||||
| Pneumonia: 700 | ||||
| Sethy et al. [7] | X-Ray | COVID-19 (positive): 25 | ResNet-50 and Support Vector Machine | 95.38 |
| COVID-19 (negative): 25 | ||||
| Narin et al. [8] | X-Ray | COVID-19 (positive): 50 | ResNet-50 and Deep CNN | 98 |
| COVID-19 (negative): 50 | ||||
| Tulin et al. [10] | X-Ray | No Findings: 500 | DarkCovidNet | 98.08 |
| COVID-19 (positive): 125 | ||||
| Pneumonia: 500 | ||||
| Wang et al. [35] | CT Scan | COVID-19 (positive): 195 | M-Inception | 82.9 |
| COVID-19 (negative): 258 | ||||
| Ying et al. [36] | CT Scan | Healthy: 708 | DRE-Net | 86 |
| COVID-19 (positive): 777 | ||||
| Xu et al. [37] | CT Scan | Healthy: 175 | Location Attention + ResNet | 86.7 |
| COVID-19 (positive): 219 | ||||
| Viral pneumonia: 224 | ||||
| Zheng et al. [38] | CT Scan | COVID-19 (positive): 313 | 3D Deep Network + UNet | 90.8 |
| COVID-19 (negative): 219 | ||||
| Chen et al. [39] | CT Scan | COVID-19 (positive): 51 | UNet plus + Network | 95.2 |
| Others: 55 | ||||
| Purohit et al. [40] | X-Ray | COVID-19 (positive): 536 | Multi-image Augmentation + CNN | 99.44 |
| COVID-19 (negative): 536 | ||||
| CT Scan | COVID-19 (positive): 2760 | 95.38 | ||
| COVID-19 (negative): 2760 | ||||
| In the deep feature Extraction approach, the maximum accuracy achieved by VGG19 + SVM | 99.81% | |||
| In transfer, learning approach the maximum accuracy achieved by inceptionV3 | 99.64% | |||
| Proposed work | X-Ray | COVID-19:350 Non-COVID-19:350 | In the machine learning approach, the maximum accuracy achieved by LBP feature + quadratic SVM | 99.5% |
| CT Scan | COVID-19:350 Non-COVID-19:350 | In the deep feature Extraction approach, the maximum accuracy achieved by VGG19 + SVM | 81.35% | |
| In transfer, learning approach the maximum accuracy achieved by VGG19 | 64.80% | |||
| In the machine learning approach, the maximum accuracy achieved by LBP feature + quadratic SVM | 85.7% |
It is observed from state-of-art, the maximum accuracy achieved using X-Ray images is 99.44%and using CT scan images is 95.38%[40]. Here, the researcher used 536 X-ray images of COVID-19 and non-COVID-19, resulted 99.44%. But, 95.38%of accuracy is resulted using 2760 CT scan images of COVID-19 and non-COVID-19. Hence, there is a conflict between various researchers regarding the X-ray and CT scans, i.e., which plays as an informatics tool for the early detection and diagnosis of COVID-19 disease. In this research, the same number of X-ray and CT scan images is applied in various classification models based on deep feature extraction, transfer learning, and machine learning approaches. So, we prepare two sets of datasets, i.e., the X-Ray dataset & CT scan dataset. The X-Ray dataset consists of 700 X-Ray images, which include 350 non-COVID-19 and 350 COVID-19. Similarly, the CT scan dataset consists of 700 X-Ray images, which have 350 non-COVID-19 and 350 COVID-19. This research includes 65 classification methods, i.e.,13 deep extraction, 13 transfer learning, and 39 machine learning methods.
In the deep feature extraction approach, the maximum accuracy achieved by VGG19 + SVM using X-ray images is 99.81%, which is higher than the existing work. However, the same classification model resulted 81.35%accuracy using CT scan images. In the transfer learning approach, the maximum accuracy achieved by inceptionV3 using X-ray images is 99.64%. But, 64.80%of accuracy is resulted by VGG19 using CT scan images in the transfer learning approach. Also, in the machine learning approach, the maximum accuracy achieved by LBP feature + quadratic SVM in the case of X-ray as well as CT scan images and resulted 99.5%and 85.7%of accuracy. Hence, it is clear that comparing two popular image modalities of the classification models, chest X-ray images are more useful for screening of COVID-19.
6Conclusion
The comparative study for the screening of COVID19 in deep feature extraction, transfer learning, and machine learning approach is carried out. Here, 65 classification models are evaluated to judge the betterment among the X-ray and CT scan images. It is implicated from the experimentation, with the same dimension of the X-ray and CT scan dataset, the X-ray images are better for computer aid diagnosis. This comparative study clarifies the limitations and supremacy of X-ray and CT scan images towards the computer aid diagnosis system design. Also, this article offers the performance ability of different classification models for the screening of COVID-19. Among all classification models based on deep feature extraction with SVM, the VGG19 with SVM achieved the highest accuracy of 99.81%using X-ray images. Again, with the same classification model, using CT scan images resulted in 81.35%accuracy. Further, among all classification models based on transfer learning approaches, Inceptionv3 achieved the highest accuracy of 99.64%using X-ray images. Again, 62.17%of accuracy was achieved by Inceptionv3 in the case of CT scan images. Similarly, the highest accuracy achieved in the machine learning approach is the quadratic SVM with LBP features using X-ray images, i.e., 99.50%. But, in the case of CT scan images, that same classification model resulted in 85.7%accuracy. Hence, overall, the VGG19 with SVM performs better using X-ray images.
This comparative study offers additional insight among the research community working towards the development of computer aid diagnosis system for screening COVID19. This comparative analysis implicated the contribution of X-ray images is more effective than CT scan images for the screening of COVID-19. Further, X-ray is cost-effective and readily available at rural or small hospitals. We want to share our study findings, given the urgent need for different strategies to manage the COVID-19 patients better and diminish the spread of SARS-CoV-2 and its prognosis in the current pandemic context.
Funding
None.
Conflict of interest
The authors declare that they have no known competing financial interests or personal relationships that could have appeared to influence the work reported in this paper.
Ethical approval
This article does not contain any studies with human participants or animals performed by any authors.
References
[1] | WHO: Novel Coronavirus, http://www.who.int/csr/don/archive/disease/novel_coronavirus/en/ last accessed: 2020/08/06. |
[2] | Toğaçar M. , Ergen B. , Cömert Z. , COVID-19 detection using deep learning models to exploit Social Mimic Optimization and structured chest X-ray images using fuzzy color and stacking approaches, Computers in Biology and Medicine 121: ((2020) ), 103805. |
[3] | Ceylan Z. , Estimation of COVID-19 prevalence in Italy, Spain, and France, Science of the Total Environment 729: ((2020) ), 138817. |
[4] | Alimadadi A. , Aryal S. , Manandhar I. , et al., Artificial intelligence and machine learning to fight COVID-19, Physiological Genomics 52: ((2020) ), 200–202. |
[5] | Pirouz B. , ShaffieeHaghshenas S. , ShaffieeHaghshenas S. , Piro P. , Investigating a serious challenge in the sustainable development process: Analysis of confirmed cases of COVID-19 (new type of coronavirus) through a binary classification using artificial intelligence and regression analysis, Sustainability 12: ((2020) ), 2427. |
[6] | Cohen J.P. , Morrison P. , Dao L. , et al.COVID-19 image data collection: prospective predictions are the future, Arvix preprint. ArXiv: 2006.11988. (2020). |
[7] | Sethy P.K. , Behera S.K. , Ratha P.K. , Biswas P. Detection of coronavirus disease (COVID-19) based on deep features and support vector machine, International Journal of Mathematical, Engineering and Management Sciences 5: ((2020) ), 643–651. |
[8] | Narin A. , Kaya C. , Pamuk Z. , Automatic detection of coronavirus disease (COVID-19) using X-ray images and deep convolutional neural networks, ArXiv preprint. ArXiv: 2003.10849 (2020). |
[9] | Ucar F. , Korkmaz D. , COVIDiagnosis-Net: Deep Bayes-SqueezeNet based diagnosis of the coronavirus disease (COVID-19) from X-ray images, Medical Hypotheses 140: ((2020) ), 109761. |
[10] | Ozturk T. , Talo M. , Yildirim E.A. , et al., , Automated detection of COVID-19 cases using deep neural networks with X-ray images, Computers in Biology and Medicine 121: ((2020) ), 103792. |
[11] | Lei P. , Huang Z. , Liu G. , et al., Clinical and computed tomographic (CT) images characteristics in the patients with COVID-19 infection: What should radiologists need to know? Journal of X-ray Science and Technology 28: ((2020) ), 369–381. |
[12] | Shan F. , Gao Y. , Wang J. , et al., Lung infection quantification of COVID-19 in CT Images with deep learning, arXiv preprint arXiv:2003.04655. (2020). |
[13] | Al-karawi D. , Al-Zaidi S. , Polus N. , Jassim S. , Machine learning analysis of chest CT scan images as a complementary digital test of coronavirus (COVID-19) patients, medRxiv. 2020.04.13.20063479, (2020). |
[14] | National Cancer Institute: National Lung Screening Trial (NLST), https://www.cancer.gov/types/lung/research/nlst last accessed 2020/11/06. |
[15] | Cochrane: Featured Review: Thoracic imaging tests for the diagnosis of COVID-19, https://www.cochrane.org/news/featured-review-thoracic-imaging-tests-diagnosis-covid-19, last accessed 2020/11/06. |
[16] | GitHub: GitHub, https://github.com/last accessed 2020/11/06. |
[17] | Kaggle: Kaggle, https://www.kaggle.com/, last accessed 2020/11/06. |
[18] | Wiatowski T. , Bolcskei H. A mathematical theory of deep convolutional neural networks for feature extraction, IEEE Trans Inf Theory 64: (3) ((2018) ), 1845–1866. |
[19] | Sethy P.K. , Barpanda N.K. , Rath A.K. , et al., Deep feature based rice leaf disease identification using support vector machine, Computers and Electronics in Agriculture 175: ((2020) ), 105527. |
[20] | Dong G. , Liu H. , Feature engineering for machine learning and data analytics. (2018) (Eds.). CRC Press. |
[21] | Nosaka R. , Ohkawa Y. , Fukui K. , Feature extraction based on co-occurrence of adjacent local binary patterns. In Pacific-Rim Symposium on Image and Video Technology (2012), pp. 82–91. |
[22] | Mohanaiah P. , Sathyanarayana P. , GuruKumar L. , Image texture feature extraction using GLCM approach, International Journal of Scientific and Research Publications 3: (5) ((2013) )1–5. |
[23] | Gao C.C. , Hui X.W. , GLCM-based texture feature extraction, Computer Systems & Applications 6: (048) ((2010) ). |
[24] | Tuncer T. , Dogan S. , Ozyurt F. , An automated residual exemplar local binary pattern and iterative ReliefF based corona detection method using lung X-ray image, Chemometrics and Intelligent Laboratory Systems 203: ((2020) ), 104054. |
[25] | Li Z. , Zeng B. , Lei P. , et al., Differentiating pneumonia with and without COVID-19 using chest CT images: from qualitative to quantitative, Journal of X-ray Science and Technology 28: ((2020) ), 583–589. |
[26] | Lalmuanawma S. , Hussain J. , Chhakchhuak L. , Applications of machine learning and artificial intelligence for Covid-19 (SARS-CoV-2) pandemic: A review. Chaos, Solitons and Fractals 139: ((2020) ), 110059. |
[27] | Kang H. , Xia L. , Yan F. , et al., Diagnosis of coronavirus disease (COVID-19) with structured latent multi-view representation learning, IEEE Transactions on Medical Imaging 39: ((2020) ), 2606–2614. |
[28] | Oh Y. , Park S. , Ye J.C. , Deep learning COVID-19 features on CXR using limited training data sets, IEEE Transactions on Medical Imaging 39: ((2020) ), 2688–2700. |
[29] | Nour M. , Cömert Z. , Polat K. , A novel medical diagnosis model for COVID-19 infection detection based on deep features and Bayesian optimization, Applied Soft Computing Journal (2020), 106580. |
[30] | Panwar H. , Gupta P.K. , Siddiqui M.K. , et al., Application of deep learning for fast detection of COVID-19 in X-Rays using nCOVnet, Chaos, Solitons and Fractals 138: ((2020) ), 109944. |
[31] | Hemdan E.E.-D. , Shouman M.A. , Karar M.E. ,COVIDX-Net: A framework of deep learning classifiers to diagnose COVID-19 in X-ray images, Arxiv preprint. ArXiv: 2003.11055. (2020). |
[32] | Wang L. , Wong A. , COVID-Net: A tailored deep convolutional neural network design for detection of COVID-19 cases from chest X-ray images, Arxiv preprint. ArXiv: 2003.09871. 1–12 (2020). |
[33] | Ghoshal B. , Tucker A. , Estimating uncertainty and interpretability in deep learning for coronavirus (COVID-19) detection. Arvix preprint. ArXiv: 2003.10769. (2020). |
[34] | Apostolopoulos I.D. , Mpesiana T.A. , Covid-19: automatic detection from X-ray images utilizing transfer learning with convolutional neural networks, Physical and Engineering Sciences in Medicine 43: ((2020) ), 635–640. |
[35] | Wang S. , Kang B. , Ma J. , et al., A deep learning algorithm using CT images to screen for Corona Virus Disease (COVID-19), medRxiv. 2020.02.14.20023028, (2020). |
[36] | Song Y. , Zheng S. , Li L. , et al., Deep learning enables accurate diagnosis of novel coronavirus (COVID-19) with CT images, medRxiv. 2020.02.23.20026930, (2020). |
[37] | Xu X. , Jiang X. , Ma C. , et al., A deep learning system to screen novel coronavirus disease 2019 pneumonia, Engineering 6: ((2020) ), 1122–1129. |
[38] | Wang X. , Deng X. , Fu Q. , et al., A weakly-supervised framework for COVID-19 classification and lesion localization from chest CT, IEEE Transactions on Medical Imaging 39: ((2020) ), 2615–2625. |
[39] | Chen J. , Wu L. , Zhang J. , et al., Deep learning-based model for detecting 2019 novel coronavirus pneumonia on high-resolution computed tomography: a prospective study, medRxiv. 2020.02.25.20021568, (2020). |
[40] | Purohit K. , Kesarwani A. , Kisku D.R. , Dalui M. , COVID-19 detection on chest X-ray and CT scan images using multi-image augmented deep learning model, bioRxiv. 2020.07.15.205567, (2020). |


