
Using artificial intelligence to assist radiologists in distinguishing COVID-19 from other pulmonary infections
Abstract
Background:
Accurate and rapid diagnosis of coronavirus disease (COVID-19) is crucial for timely quarantine and treatment.
Purpose:
In this study, a deep learning algorithm-based AI model using ResUNet network was developed to evaluate the performance of radiologists with and without AI assistance in distinguishing COVID-19 infected pneumonia patients from other pulmonary infections on CT scans.
Methods:
For model development and validation, a total number of 694 cases with 111,066 CT slides were retrospectively collected as training data and independent test data in the study. Among them, 118 are confirmed COVID-19 infected pneumonia cases and 576 are other pulmonary infection cases (e.g. tuberculosis cases, common pneumonia cases and non-COVID-19 viral pneumonia cases). The cases were divided into training and testing datasets. The independent test was performed by evaluating and comparing the performance of three radiologists with different years of practice experience in distinguishing COVID-19 infected pneumonia cases with and without the AI assistance.
Results:
Our final model achieved an overall test accuracy of 0.914 with an area of the receiver operating characteristic (ROC) curve (AUC) of 0.903 in which the sensitivity and specificity are 0.918 and 0.909, respectively. The deep learning-based model then achieved a comparable performance by improving the radiologists’ performance in distinguish COVOD-19 from other pulmonary infections, yielding better average accuracy and sensitivity, from 0.941 to 0.951 and from 0.895 to 0.942, respectively, when compared to radiologists without using AI assistance.
Conclusion:
A deep learning algorithm-based AI model developed in this study successfully improved radiologists’ performance in distinguishing COVID-19 from other pulmonary infections using chest CT images.
1Introduction
The coronavirus disease (COVID-19) is now a pandemic worldwide [1]. In the face of such high risk of contagion for COVID-19, timely diagnosis is one of the key factors to prevent further spread and the rising trend of confirmed cases. The sudden increased workload put medical workers in the endemic area under unprecedented pressure, and lack of experience results in missed cases [2, 3]. In addition, a lack of nucleic acid diagnostic kits in some areas became a barrier for accurate and fast diagnosis [4]. In the 6th version of the Diagnosis and Treatment Protocols of COVID-19 Infection issued by the National Health Commission of the People’s Republic of China [5], the radiographic characteristic of pneumonia was considered as one of the diagnostic standards, which highlighted the importance of computed tomography (CT). Chest X-ray is the most convenient imaging method to quickly diagnose COVID-19 at the beginning of the outbreak, however, current evidence suggests that X-ray images are not specific enough to either diagnose or rule out COVID-19 due to their low-resolution and overlapping projection [6, 7]. Therefore, CT scans are recommended for the screening of COVID-19 to detect possible imaging features in suspicious patients.
As one of the most effective and available methods, CT scan has been widely used for COVID-19 suspicious patients to guide the follow-up therapies with improved outcomes, and furthermore, to help control the rapid spread of disease [8]. However, imaging features of COVID-19 are difficult to distinguish from other pulmonary infection and/or non-infectious diseases due to its overlapping features, particularly for radiologists with little experience [9, 10]. In many outbreak areas, there is an urgent shortage of experienced radiologists, and artificial intelligence (AI) has been considered as a potentially powerful tool to fight COVID-19.
In recent years, AI has shown great success in medical applications that require complex image-processing [11, 12], even in this COVID-19 epidemic [13]. Current literature has revealed that it is possible for AI to identify COVID-19 from other pneumonia with good accuracy [14]. However, published studies have limitations such as lack of external validation [15], and there was little research being conducted to compare the performance of radiologists in distinguishing COVID-19 from other pulmonary infectious diseases with or without the assistance of AI. In this study, a deep learning-based automatic detection algorithm was developed, including an evaluation of its impact on the performance of radiologists to distinguish CT scans of confirmed COVID-19 pneumonia patients from controls.
2Materials and methods
2.1Image data
Due to the suddenness of the outbreak of COVID-19 and time urgency, 32 patients with confirmed positive COVID-19 by Nucleic acid amplification testing and CT imaging were collected from January 6th, 2020 to April 14th, 2020, to develop the training model. Considering the similarity of CT with lung disease in low-dimensional features, based on our previous research on tuberculosis, pneumonia and other pulmonary infections, 337 cases with tuberculosis, 83 cases with common pneumonia, 57 cases with non-COVID-19 viral pneumonia and 32 cases with COVID-19 pneumonia were used as training data set. Among them, COVID-19 cases were collected from Guangzhou Eighth People’s Hospital of China. The others were from the Affiliated Hospital of Hebei University of China and the First Affiliated Hospital of Guangzhou Medical University of China. Information about training data is shown in Table 1; 13,853 normal slices were were added to training set.
Table 1
Distribution of training dataset
| Category | Total (case) | Sex | Average±standard deviation age | Maximum age | Minimum age | Number of CT slices with lesions | |
| Male | Female | ||||||
| Tuberculosis | 337 | 237 | 100 | 44±20 | 89 | 12 | 7728 |
| Common pneumonia | 83 | 49 | 34 | 64±16 | 89 | 14 | 4552 |
| Non-COVID-19 viral pneumonia | 57 | 29 | 28 | 60±18 | 91 | 18 | |
| COVID-19 pneumonia | 32 | 20 | 12 | 50±14 | 68 | 26 | 1566 |
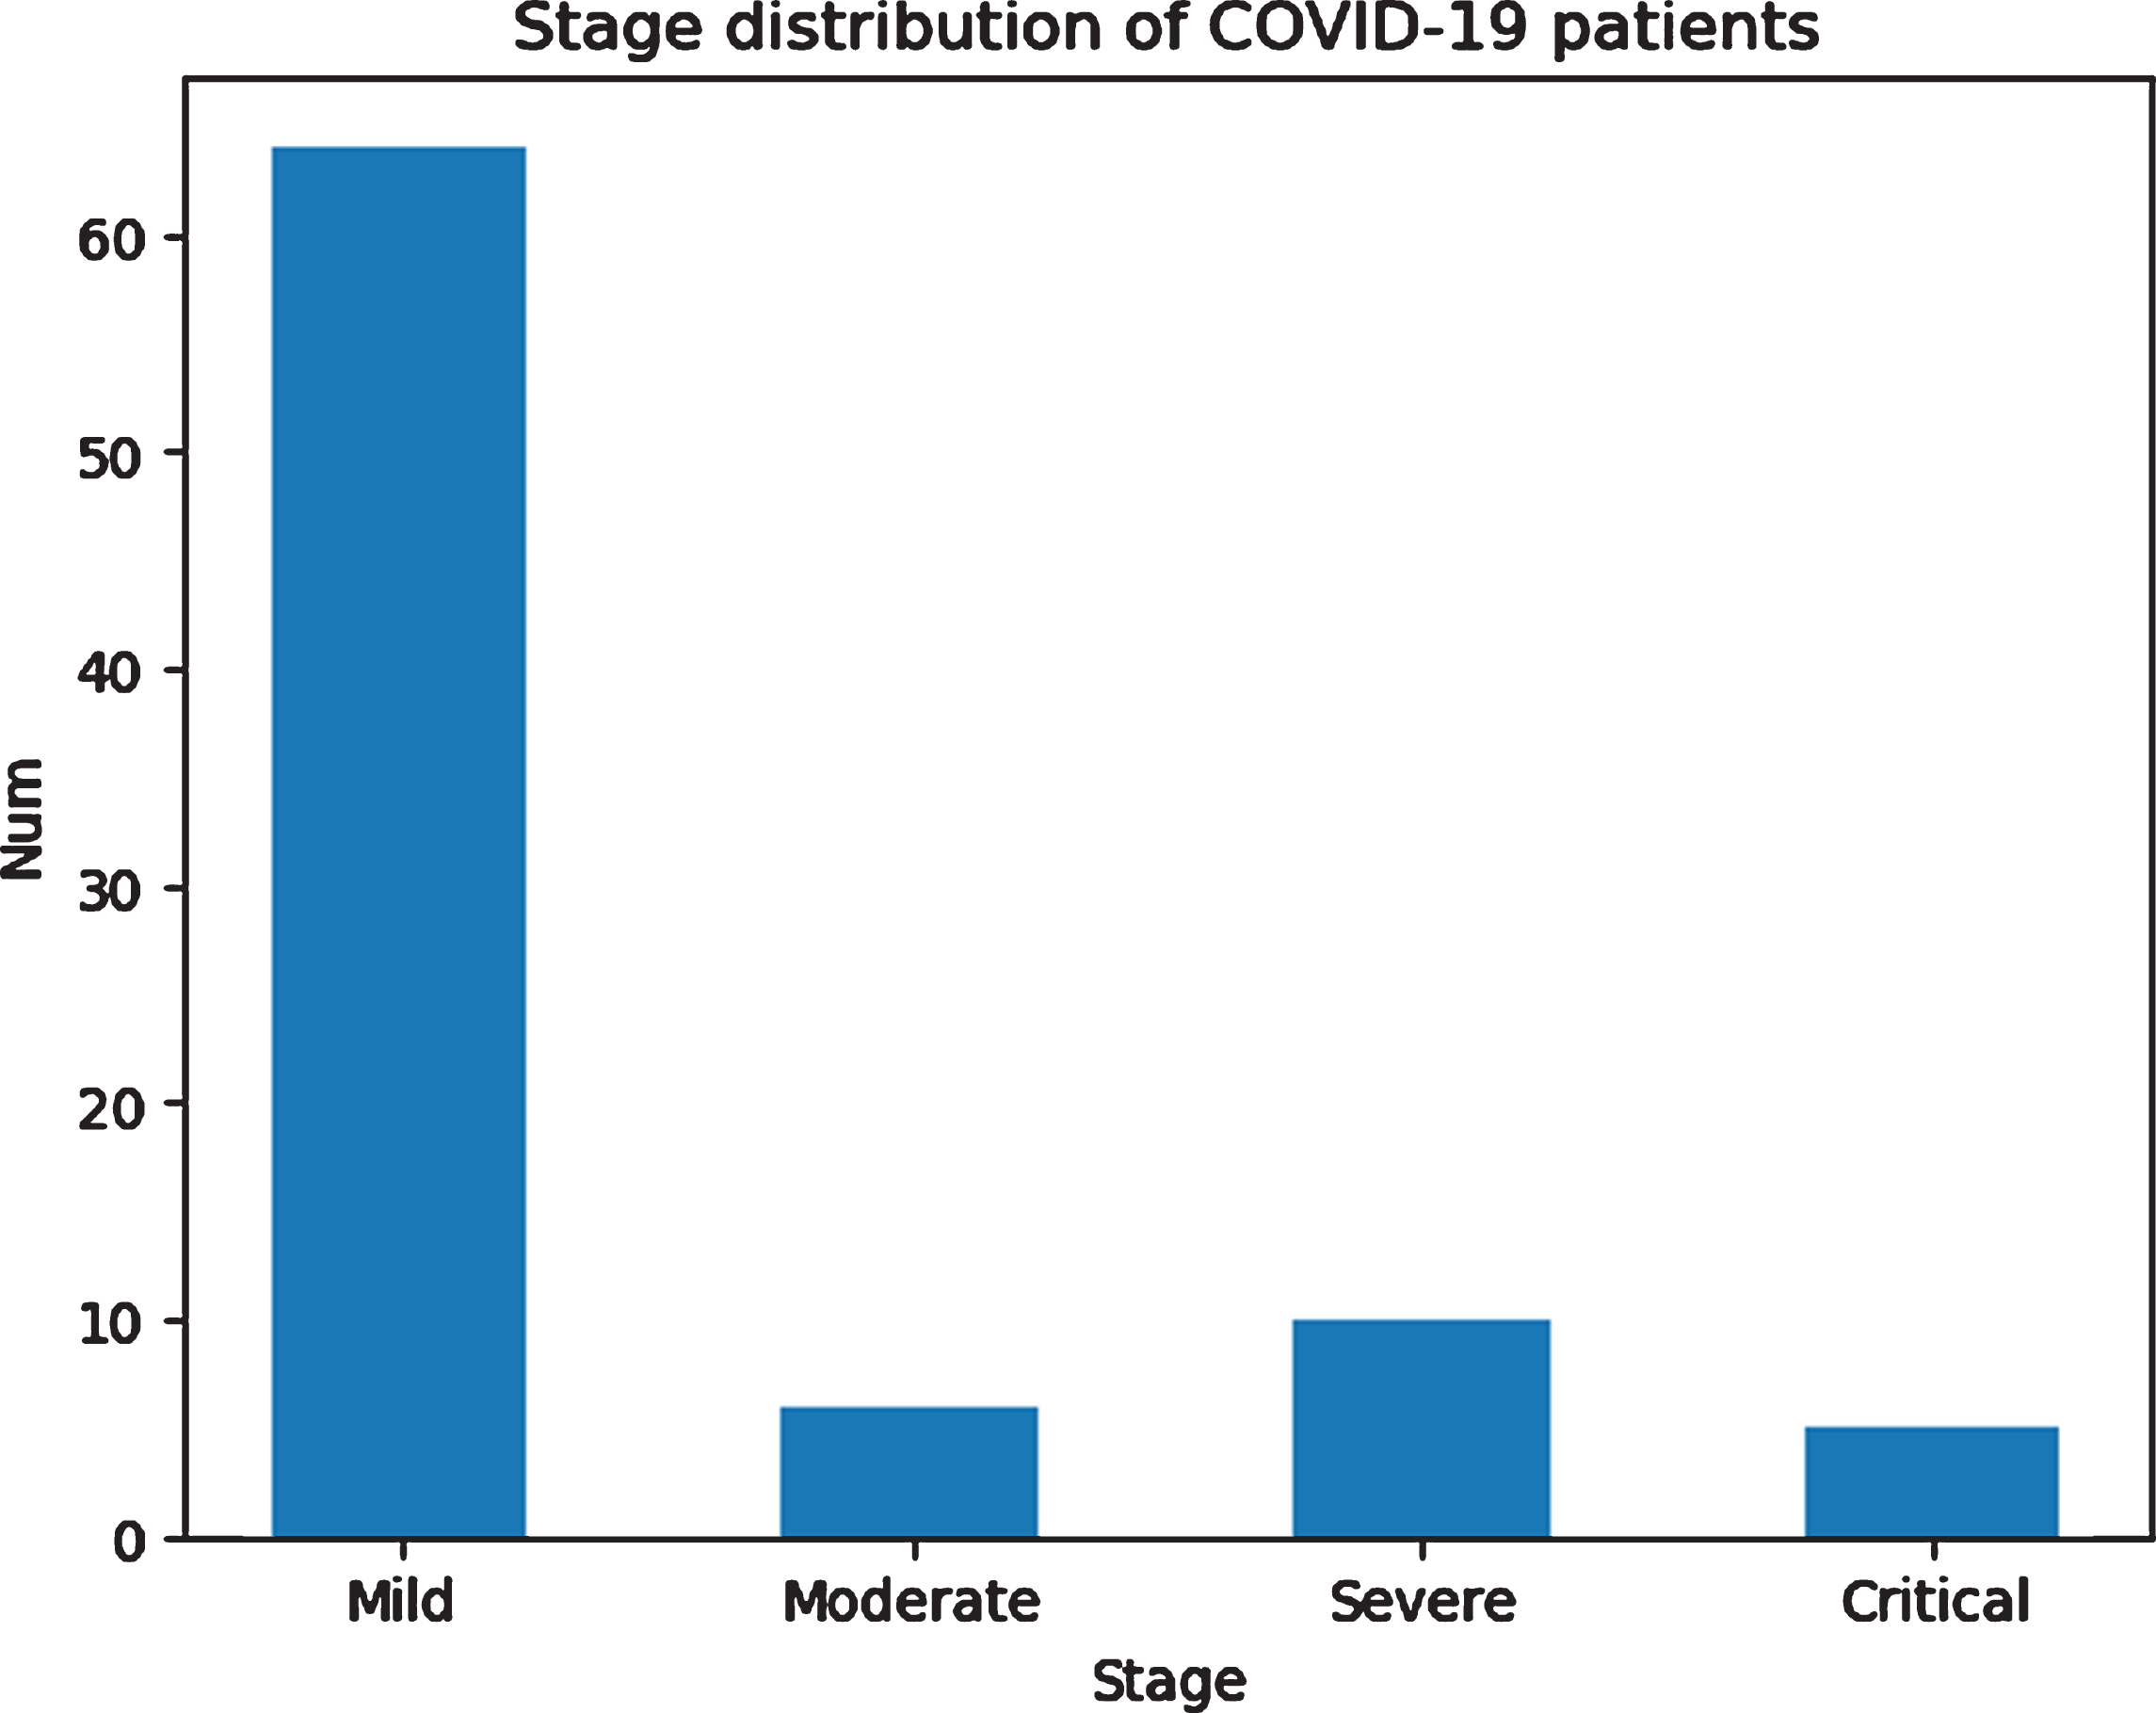
The independent test data set included 86 cases with positive COVID-19 and 99 negative cases, 185 cases totally from Guangzhou Eighth People’s Hospital of China from January 6th, 2020, to April 14th, 2020. The age distribution of the two classes are shown in Table 2 and Fig. 1. The positive cases are divided into mild, moderate, severe and critical types, of which the majority are moderate cases, based on the 6th version of the Diagnosis and Treatment Protocols of COVID-19 Infection issued by the National Health Commission of the People’s Republic of China [5]. The distribution of the severity of positive cases is shown in Fig. 2.
Table 2
Distribution of testing dataset
| Category | Total (case) | Sex | Average±standard deviation age | Maximum age | Minimum age | Total number of CT slices with lesions | |
| Male | Female | ||||||
| COVID-19 Positive | 86 | 41 | 45 | 51±15 | 82 | 15 | 38211 |
| COVID-19 Negative | 99 | 73 | 26 | 44±16 | 87 | 12 | 45156 |
Fig. 1
Age distribution of patients in the testing dataset.
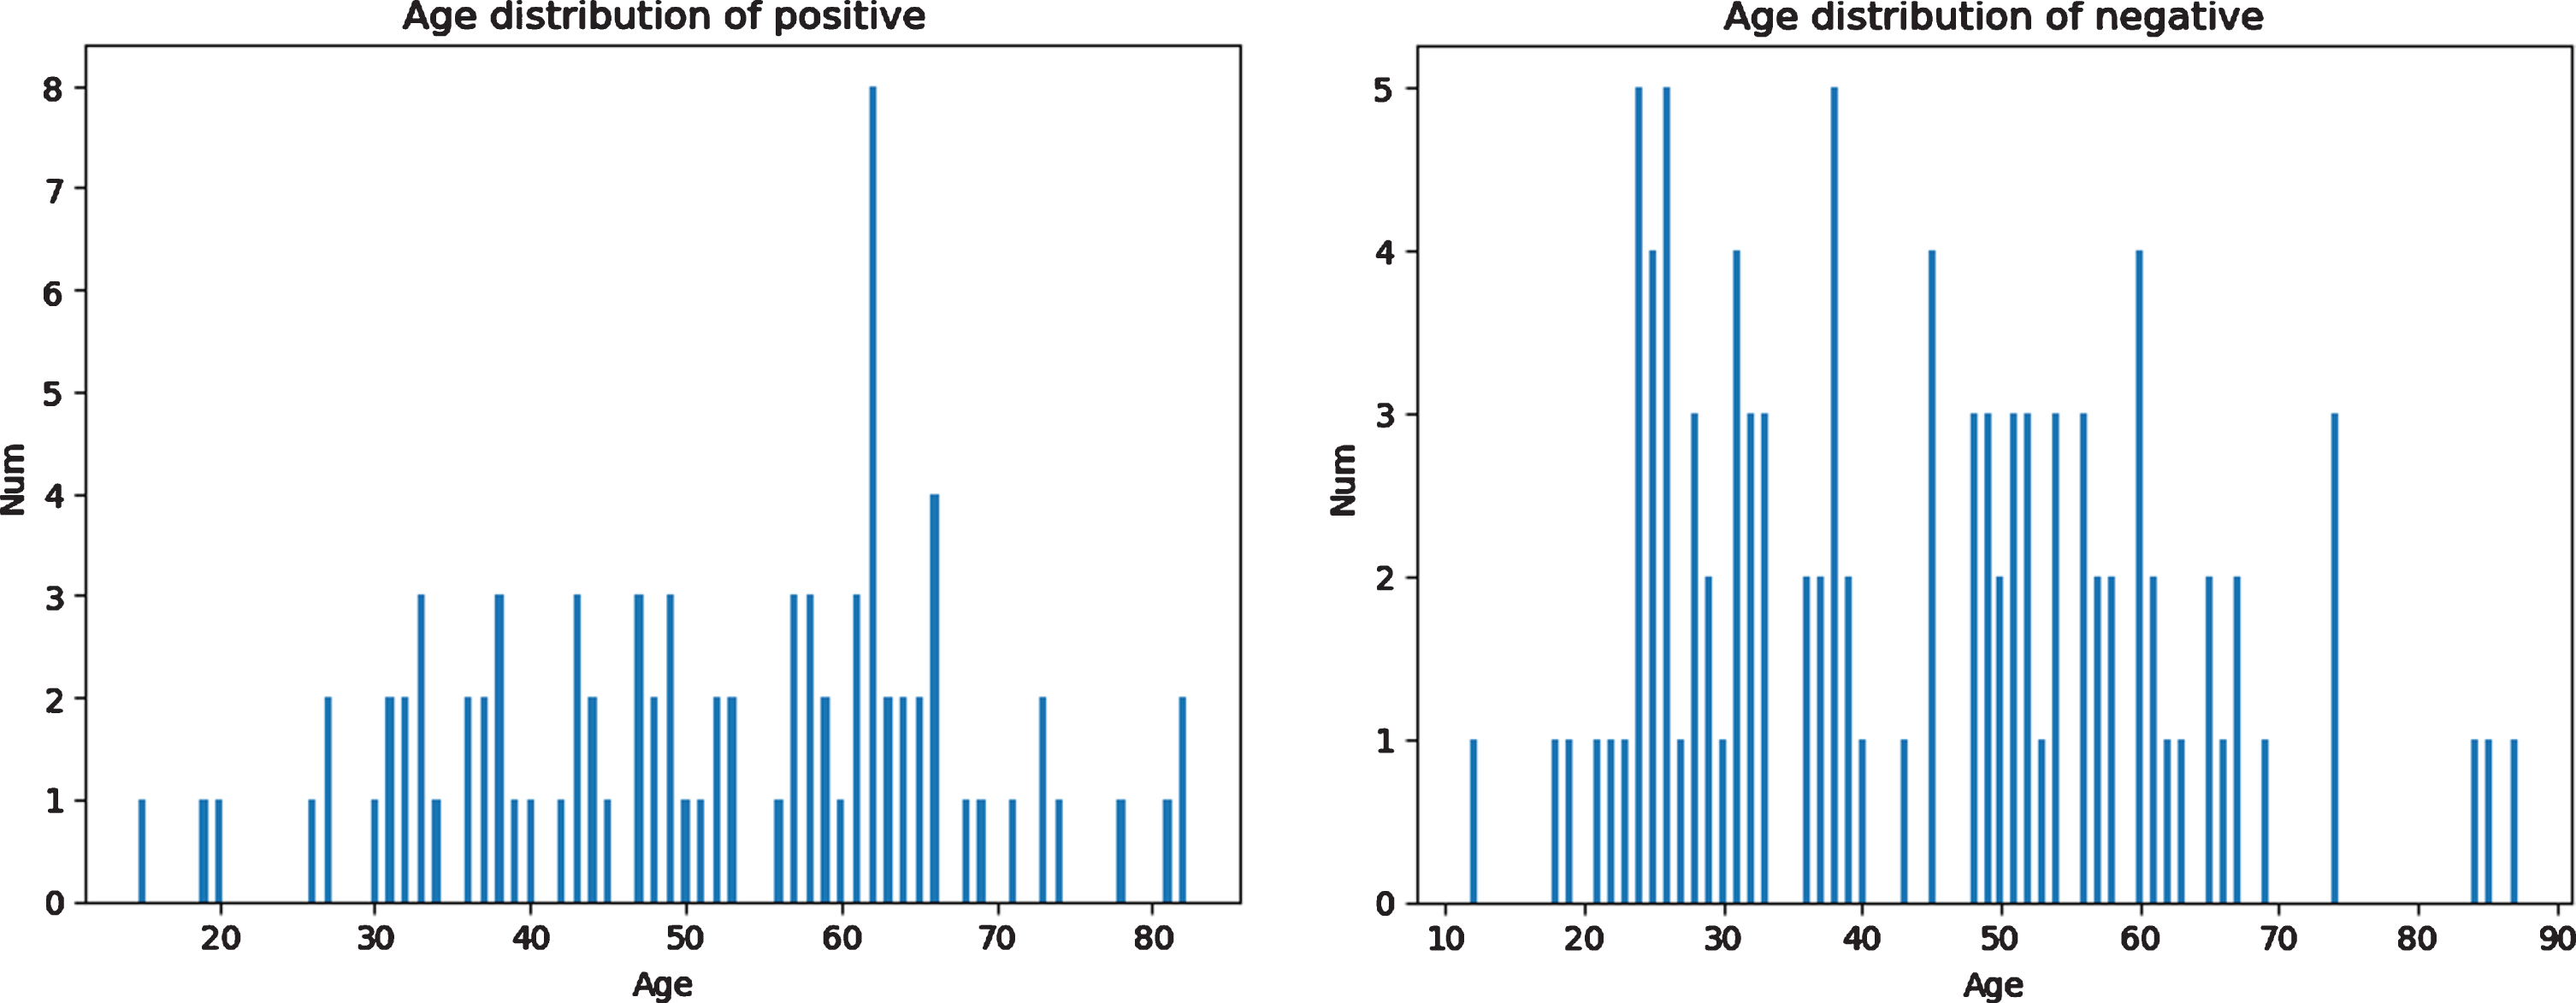
Fig. 2
Distribution of the severity of positive cases in the testing dataset.
All confirmed cases of COVID-19 were defined as patients who tested positive by nucleic acid diagnostic kits for nasal and pharyngeal swab specimens and finally confirmed by clinicians. Other related information, including the report of CT image diagnosis and underlying diseases were also acquired from the institution.
2.2Artificial intelligence (AI) based detection system
The development and evaluation of the AI model for detecting COVID19 pneumonia included data preparation, model establishment, probability calculation and comparison of results, which is displayed in Fig. 3. In the stage of data preparation, CT slices of patients with tuberculosis, common pneumonia, non-COVID-19 viral pneumonia and COVID-19 pneumonia were labeled by radiologists, and then used as training set and validation set. Test set are all CT slices of COVID-19 pneumonia, which are also labeled by radiologists. After data preparation, a segmentation model based on ResUNet was built for detection of lesion location, from which lesion continuity judgment and lesion class prediction were obtained. Utilizing the output of the segmentation model, we calculated AI probability by weighted combination of lesion classes, proportion of lesion to the lung, bilateral lungs and lung periphery.
Fig. 3
Workflow diagram for the development and evaluation of the AI model for detecting COVID19 pneumonia.
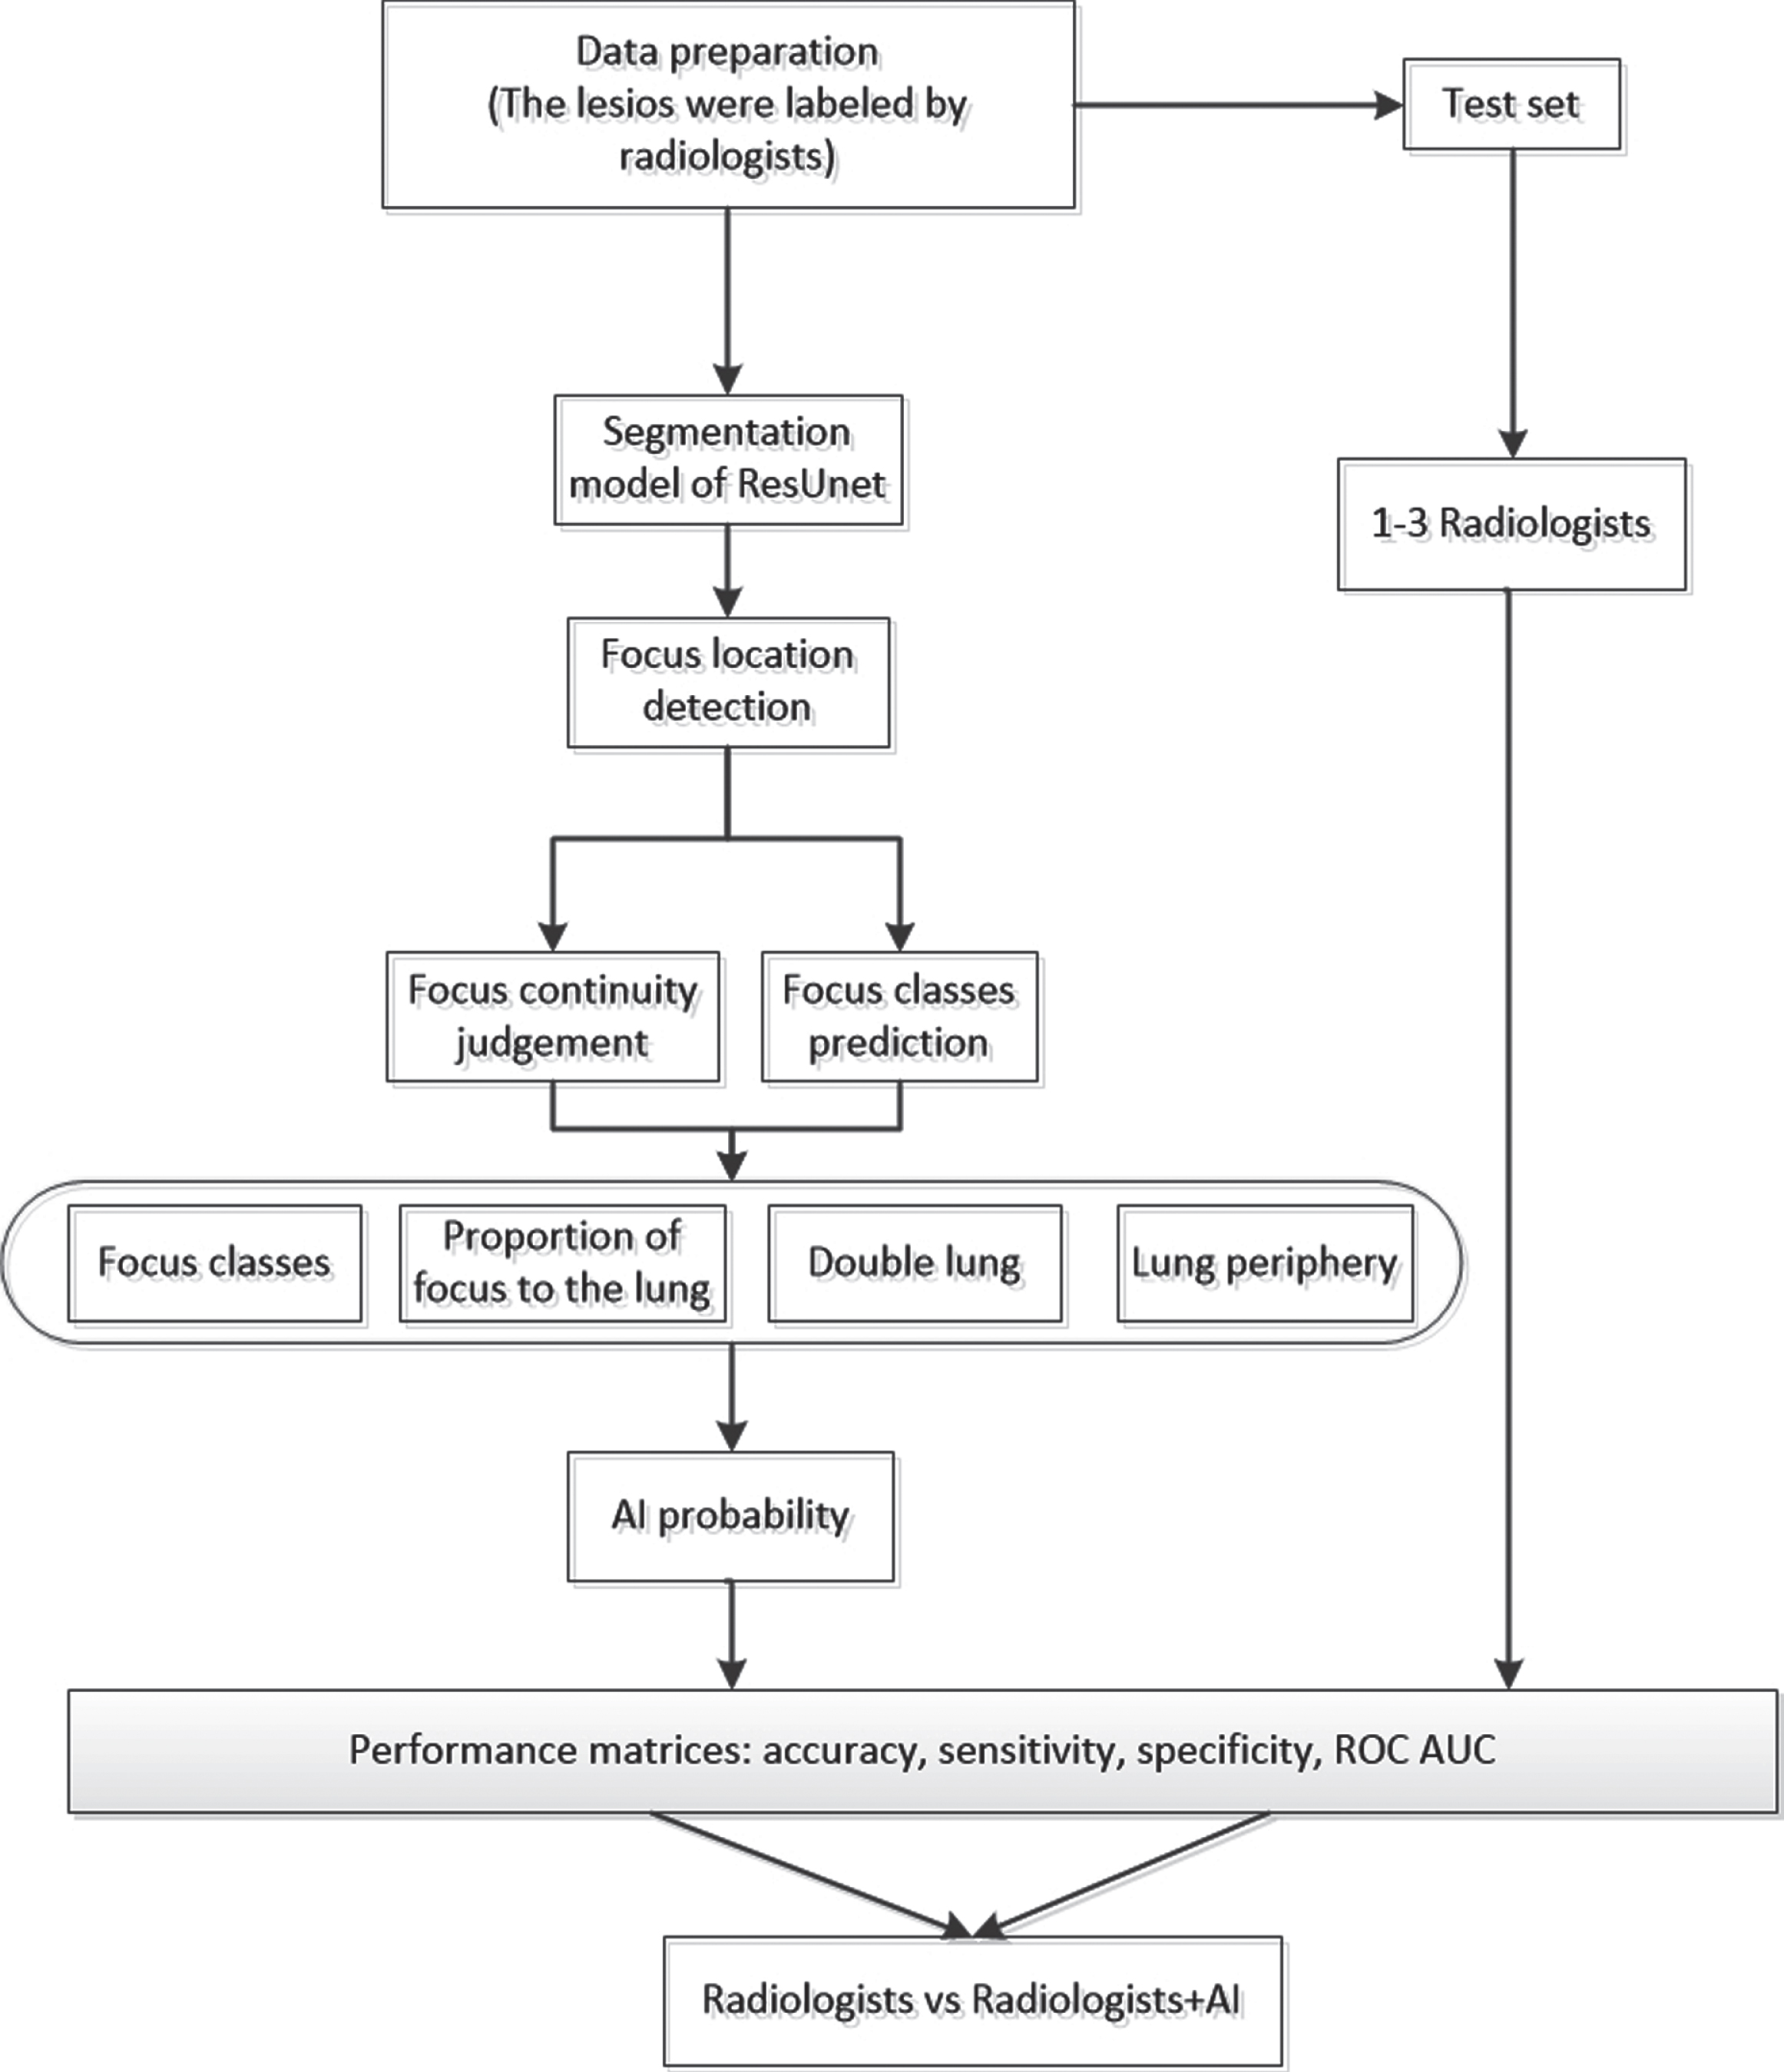
More specifically, after image segmentation, there are still two post-processing steps. The first step is classification of lesions. In this step, our AI model will detect every single slice of each case and determine what kind of lesion they are, then the AI model will make the final determination according to the majority rule, that is, if the majority of slices are defined as COVID-19 pneumonia, then this case will be classified as COVID-19. The second step is to determine the continuity of the lesion region by the value of Intersection over Union (IOU). In this step, the isolated and disconnected lesions (IOU = 0) will be deleted, and the volume ratio of the lesions in the left or right lung is quantified, then a weighted approach is used to get the possibility about whether it is COVID-19. Finally, if the COVID-19 probability is higher than a threshold (0.5) the case will be defined as COVID-19 positive, otherwise, it is negative. In conclusion, we compared and evaluated the prediction result among radiologists with the help of AI. The following is the main procedure of this method.
2.2.1Preprocessing
The whole dataset was preprocessed by setting the CT window width and level to the lung window (WL: – 490; WW: 1600). The slices with lesions (COVID-19 or pneumonia) were manually labeled by three radiologists and used as gold standard for training the deep neural network for identifying slices with abnormal lung findings. The details of radiologist interpretation are described in Section 2.3. Images were padded, if necessary, to equal height and width and rescaled to 512×512 pixels. Lung windowing was applied to the Hounsfield units to generate an 8-bit image for each individual 2D axial slice in a CT scan. Images were preprocessed by first normalizing pixel values from the range [0, 255] to [0, 1], then augmented by random transformation of bright, contrast and saturation.
2.2.2Model—ResUNet
In this study, we use an up-to-date network—ResUNet, which uses a UNet encoder/decoder backbone, in combination with residual blocks [16]. In ResUNet, each sub-module of UNet is replaced with a form of residual connection. Therefore, the network can take advantage of UNet to learn low-dimensional and high-dimensional features simultaneously, avoiding the disappearance of gradients when deepening the network and improving the optimization efficiency [17]. It can also take advantage of residual blocks to make feedforward and backpropagation smooth, making it easier to optimize deeper models [18]. The framework of our AI system is shown in Fig. 4.
Fig. 4
Main framework of AI detection system.
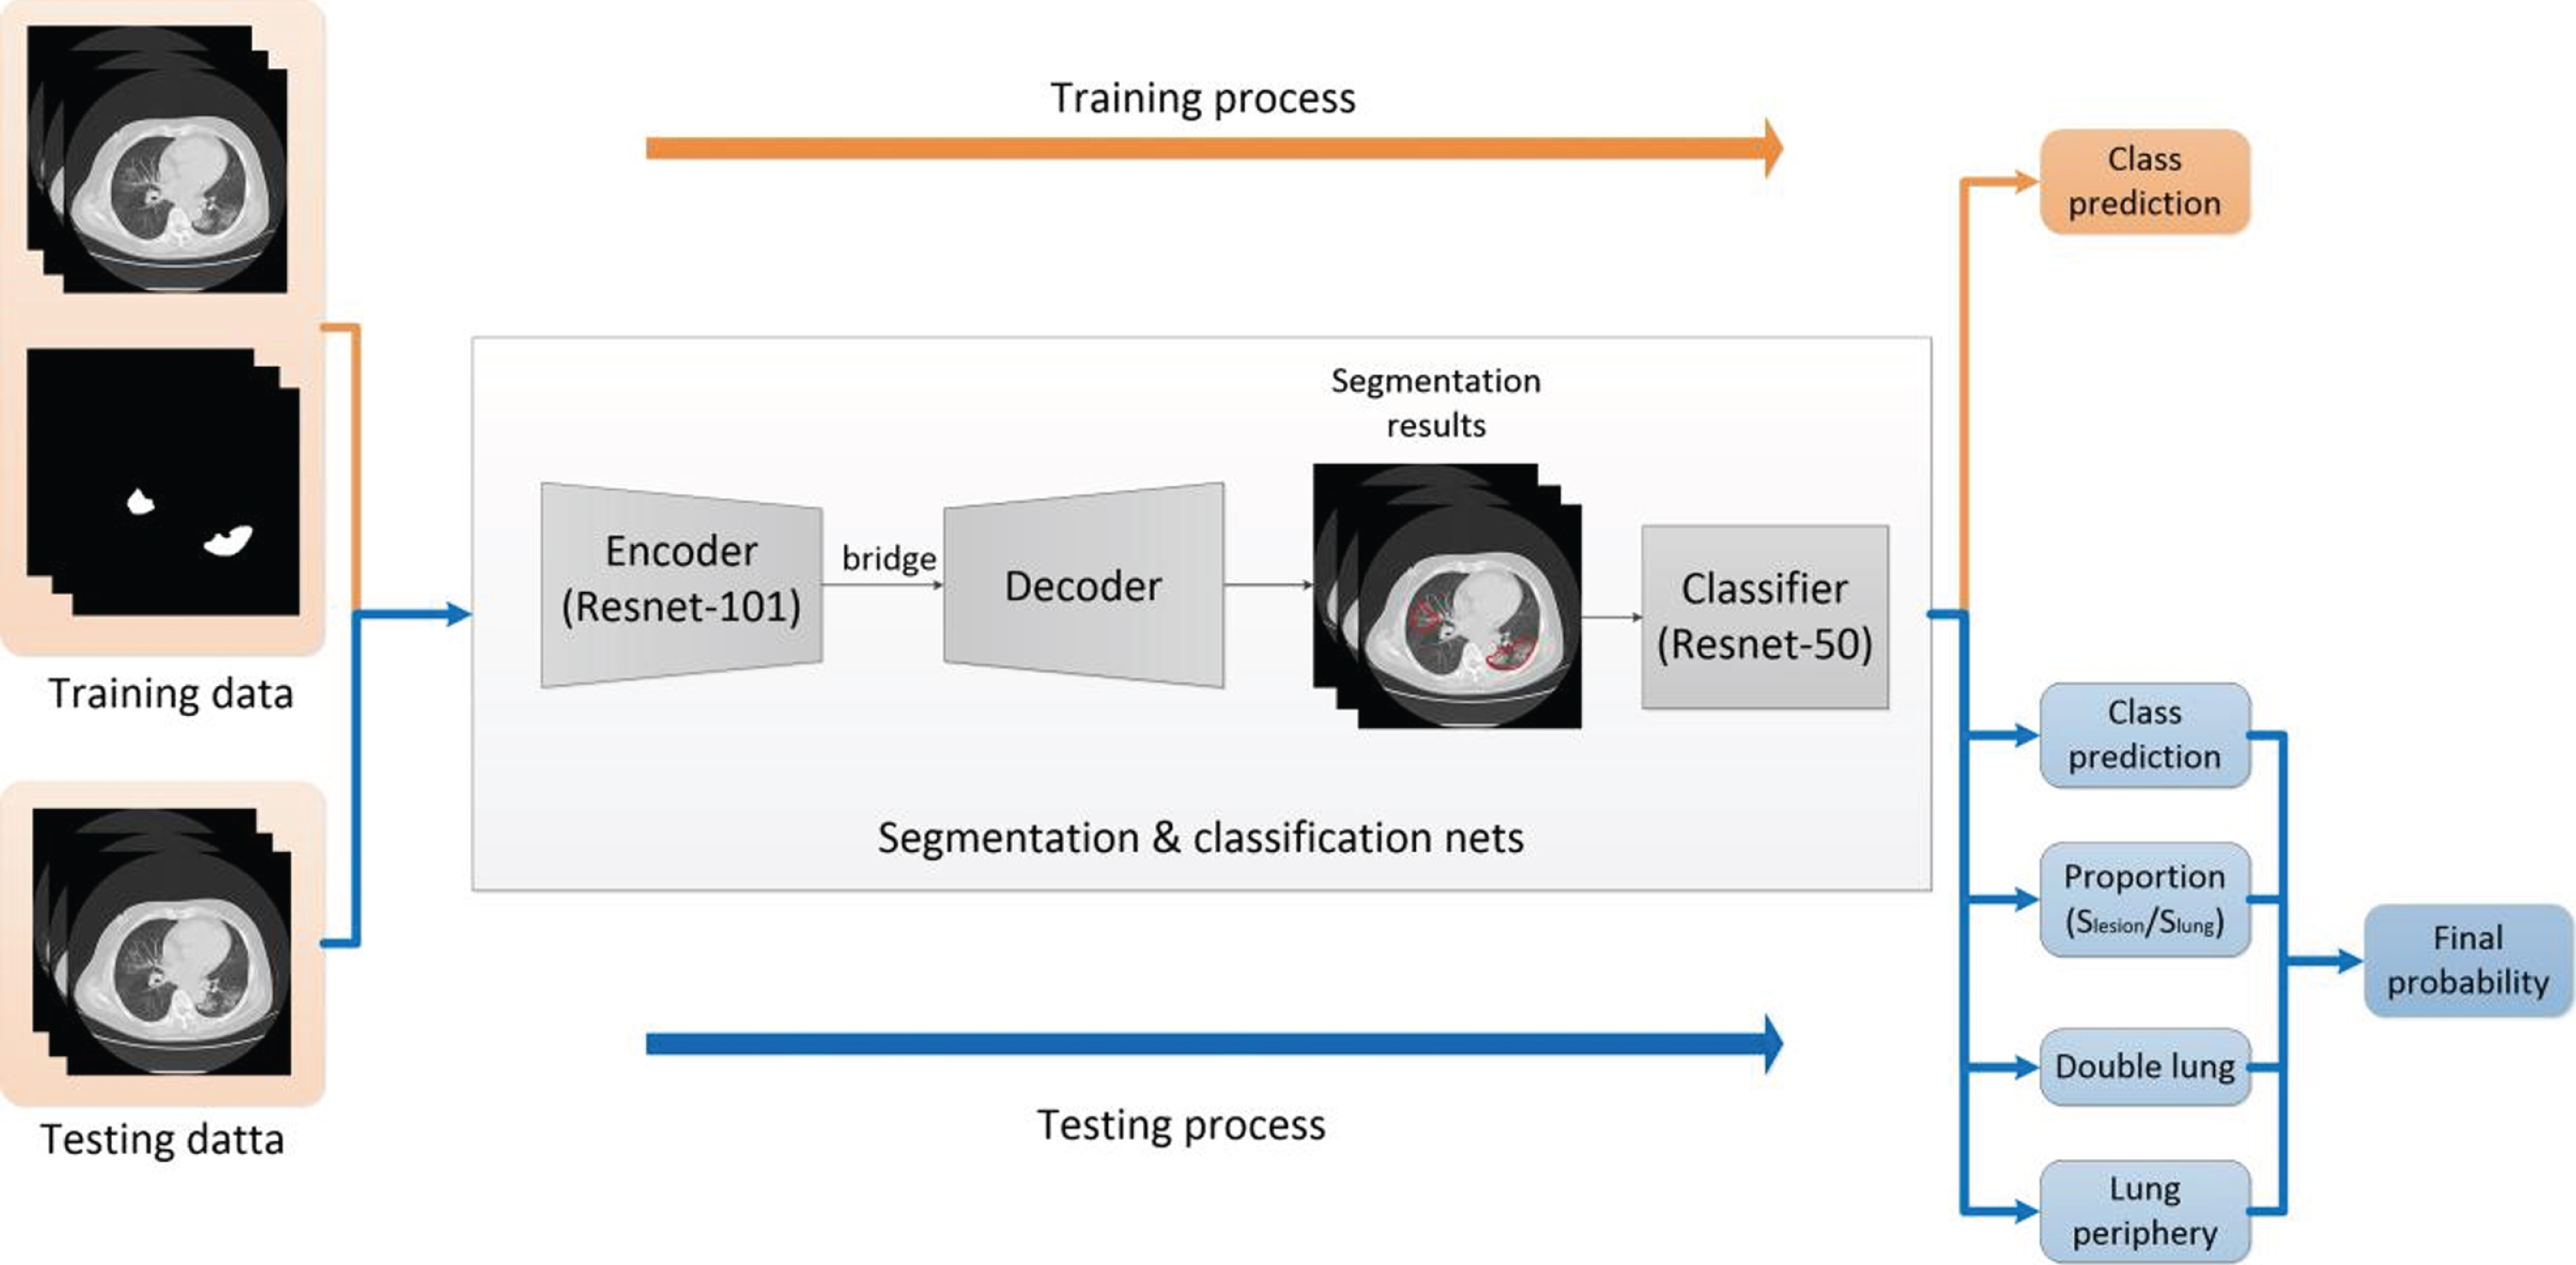
In the training process, we first train a segmentation model based on ResUNet with original CT images and corresponding segmented masks labeled by radiologists. Then, we train a Resnet-50 classifier with the lesion masks, and four classes including tuberculosis, common pneumonia, non-COVID-19 viral pneumonia and COVID-19 pneumonia. In the testing process, we first obtain segmentation results and class prediction from segmentation and classification nets. To acquire the final probability, we define a ‘confidence’ in terms of four parameters—‘class prediction’, ‘proportion’, ‘double lung’ and ‘lung periphery’. The first parameter ‘class prediction’ can be acquired directly by the segmentation and classification nets. ‘Proportion’ is the radio of lesion occupying the entire lung area, and ‘double lung’ represents whether there exist lesions on both 2 sides of the lung. ‘Lung periphery’ represents whether the lesion is located against the edge of the lung.
2.2.3Confidence
We define Confidence, scoring of the images, to evaluate the performance of the model. The Confidence is calculated using the following equation, and P, Q, S, T are the respective weights.
Confidence = P×class prediction+Q×proportion+S×double lung+T×lung periphery
2.3Radiologist interpretation
Three radiologists with over 20 years (Radiologist A), nearly 20 years (Radiologist B) and 5∼10 years (Radiologist C) of chest CT experience reviewed the test set consisting of 185 chest CT images and scored each case as COVID-19 from 0 to 5 (i.e. 0,1,2,3,4,5). In the first session, the radiologists scored each case based on their own experience without using the AI system, and no feedback on their performance was given back. In the second session, all radiologists reviewed the test set again and scored each case. More specifically, the radiologists viewed the prediction result from the developed AI system of each case first, and then scored each case from the CT images.
2.4Statistical data analysis
The classification results were evaluated based on the area-under-curve (AUC) criterion of the receiver operating characteristic curve (ROC), sensitivity, specificity, accuracy, positive predictive value (PPV), and negative predictive value (NPV). Given a threshold, samples that scored below this threshold were defined as negative samples, while samples that scored above this threshold were defined as positive samples. After calculating the true positive rate (y-axis) and false positive rate (x-axis) for each threshold, the ROC curve was produced. Radiologist performance without AI assistance was compared with that with AI assistance. The p-values were calculated using the permutation method.
3Results
3.1Patient characteristics
According to the severity of disease, COVID-19 patients were divided into four sets which are mild type, moderate type, severe type and critical type. The analysis of their CT features is shown in Table 3.
Table 3
Clinical Characteristics of COVID-19 and non-COVID-19 pneumonia patient cohorts
| COVID-19 | non-COVID-19 | |
| (n = 86) | (n = 99) | |
| Age | ||
| mean | 51.37±15.38 | 43.81±16.82 |
| <20 | 2 | 3 |
| 20–39 | 21 | 45 |
| 40–59 | 31 | 31 |
| > =60 | 32 | 20 |
| Sex | ||
| Male | 41 | 73 |
| Female | 45 | 26 |
| Underlying Diseases | ||
| None (22) | Aids (56) | |
| Proteinemia (12) | None (21) | |
| Lipemia (10) | Liver disease (21) | |
| Hypokalemia (10) | ||
| CT findings | ||
| Patch | Bronchovascular Bundle thickening and increasing | |
| Ground-glass opacity (GGO) | Nodules | |
| Patch | ||
| Severity | ||
| Mild type (6) | ||
| Moderate type (65) | ||
| Severe type (10) | ||
| Critical type (5) |
In the CT reports of moderate type patients, patchy and ground-glass opacity (GGO) are the two most common symptoms with 78.5% and 63.1% frequency respectively. Following these two most common symptoms are Bronchovascular bundle thickening and fibrous stripe, which occur in almost 37% of moderate type patients. Similarly, GGO and patchy are the top two symptoms in severe type patients which could be observed in 90% and 80% of the patients, respectively. It seems that, with COVID-19 spreading, GGO and patchy are becoming more common in CT reports. Compared with COVID-19 patients, 60% of people with lung infections and pulmonary tuberculosis show thickening and increasing bronchovascular bundle. In addition, nodules and patches could be found in these patients’ CT symptoms as well.
3.2Evaluation of developed AI system
The output that the AI predicts is Confidence, and the gold standard is the final diagnosis decision from the hospital. Figure 5 shows the ROC curve of the AI system. The AUC is 0.903; accuracy of the model is 0.914 and sensitivity is 0.918. Other testing results are shown in Table 4.
Fig. 5
ROC curve of COVID-19 vs notCOVID-19.
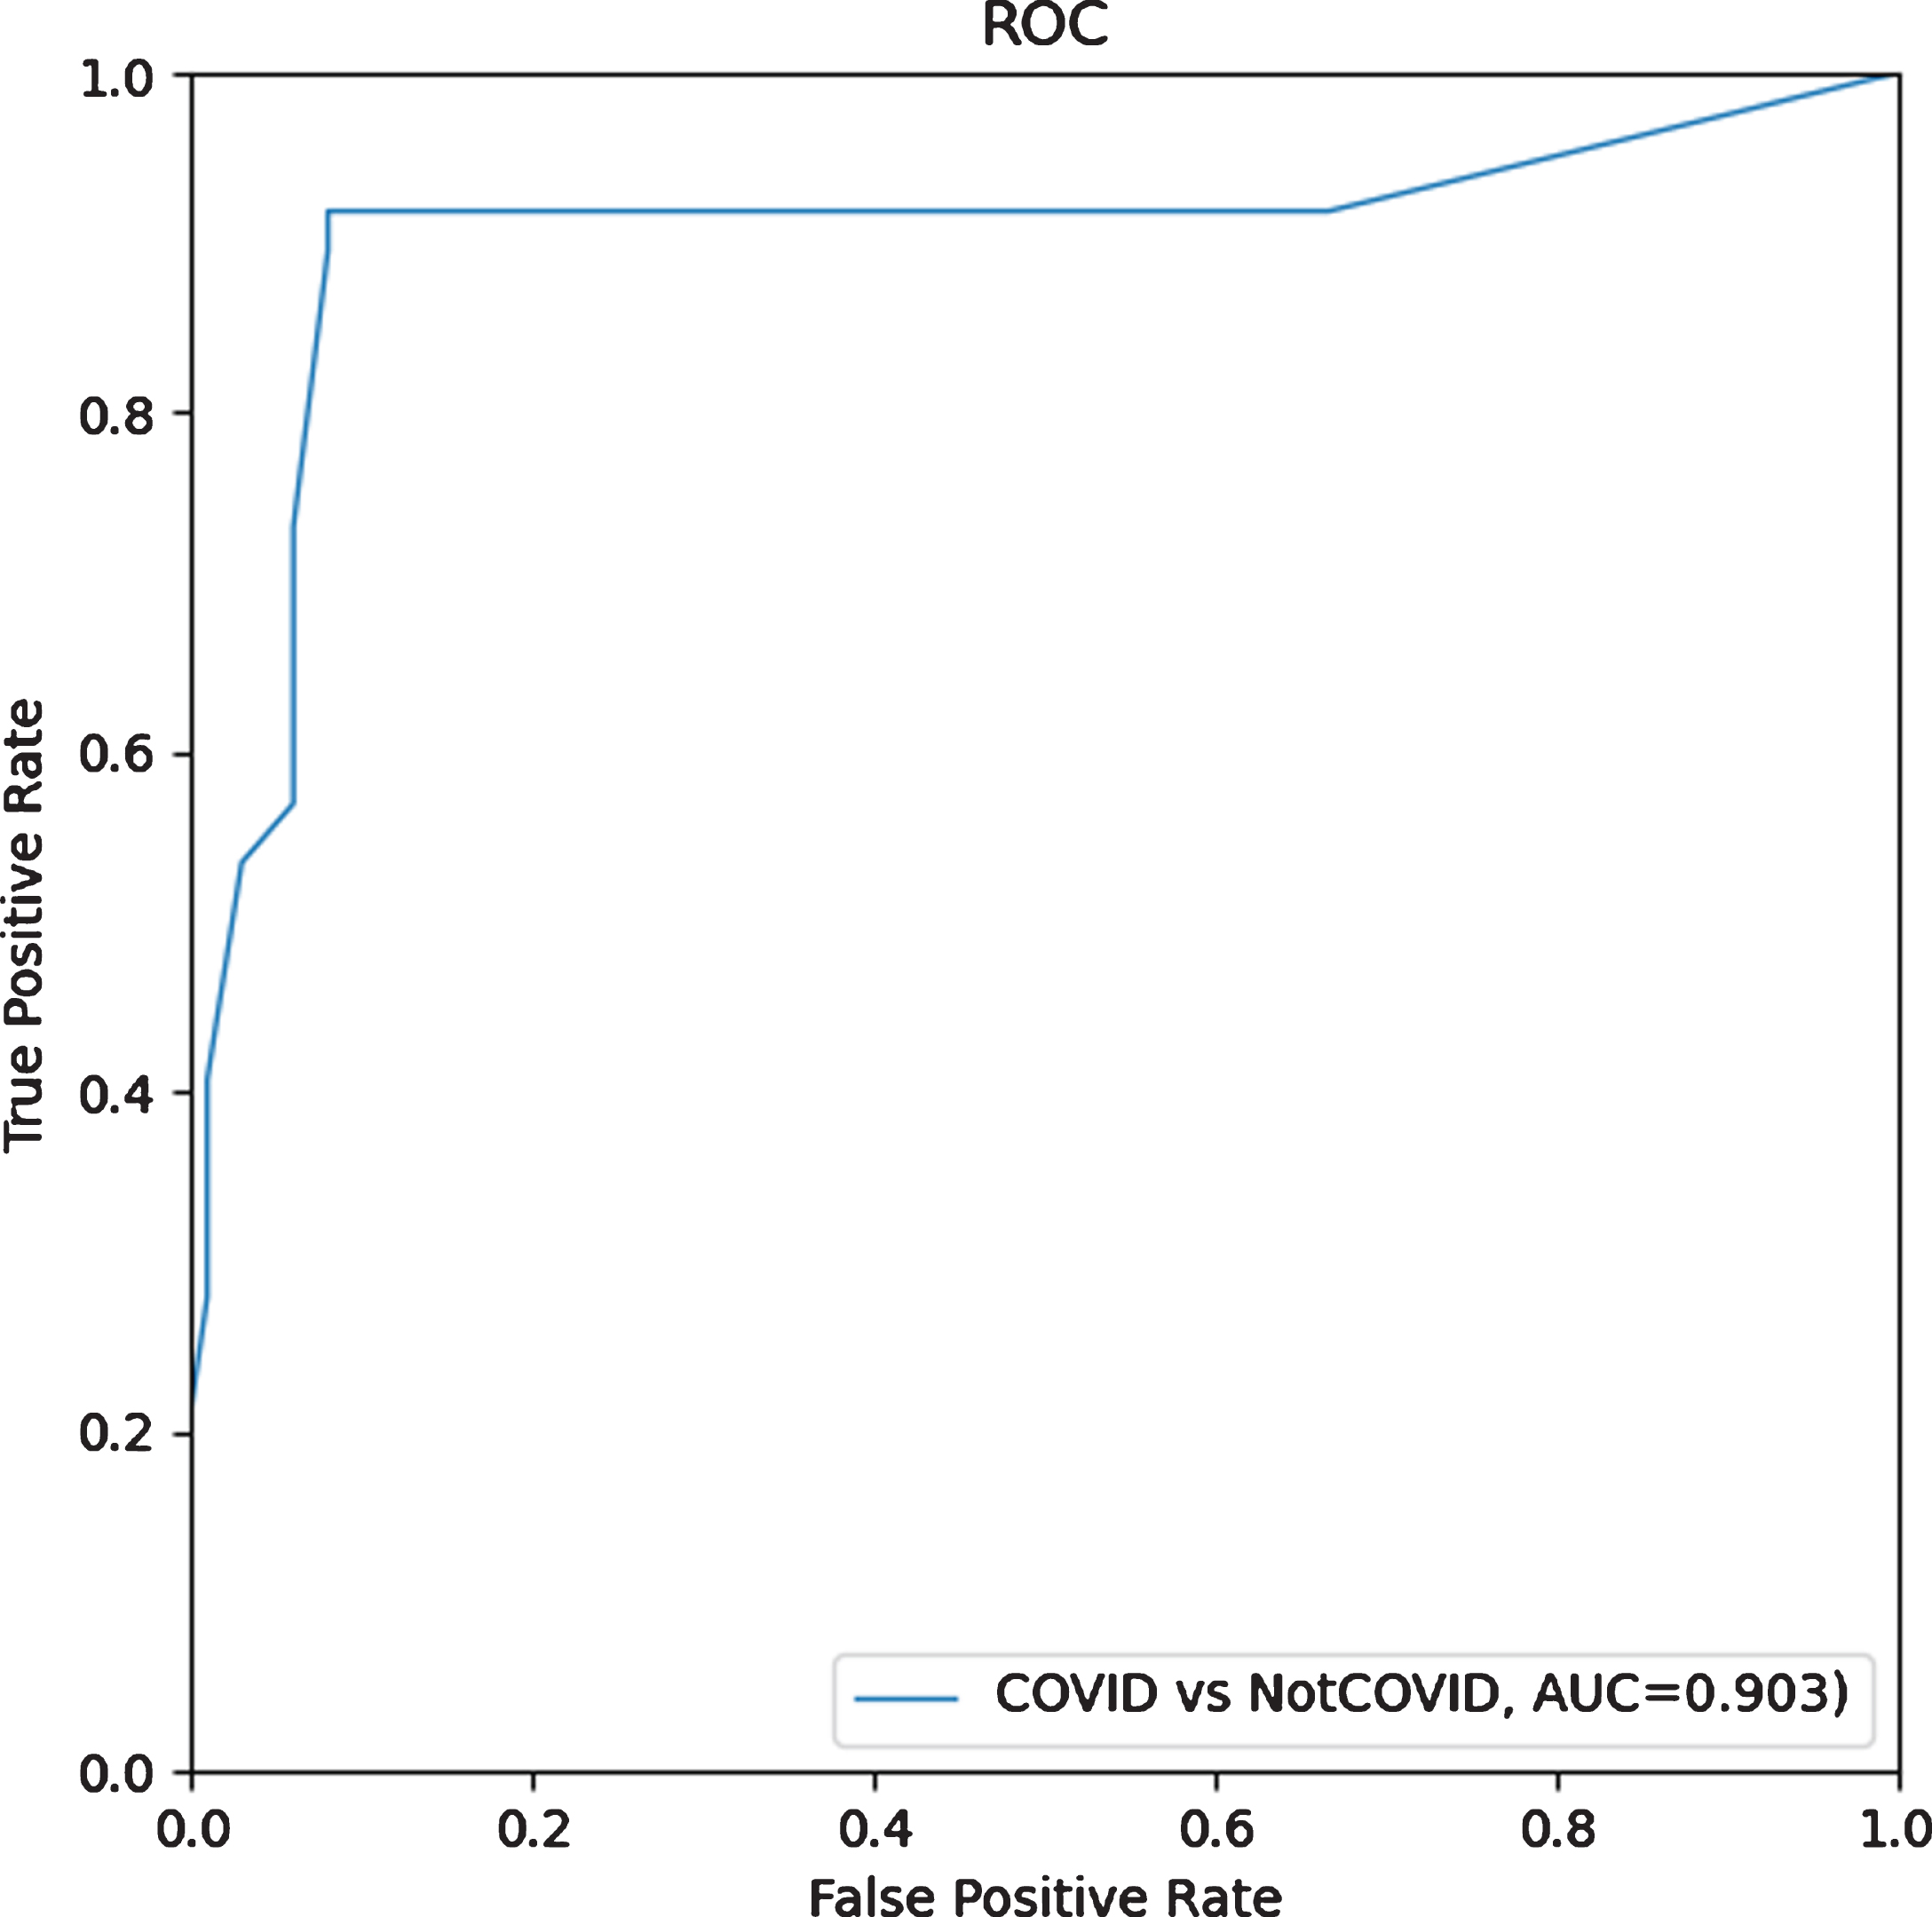
Table 4
Evaluation indicators of AI detection software for the test data diagnosis results
| Evaluation index | AUC | Accuracy | SS | SP | PPV | NPV |
| Result | 0.903 | 0.914 | 0.918 | 0.909 | 0.898 | 0.928 |
Notation: AUC = area under curve; SS = sensitivity; SP = specificity; PPV = positive predictive value; NPV = negative predictive value.
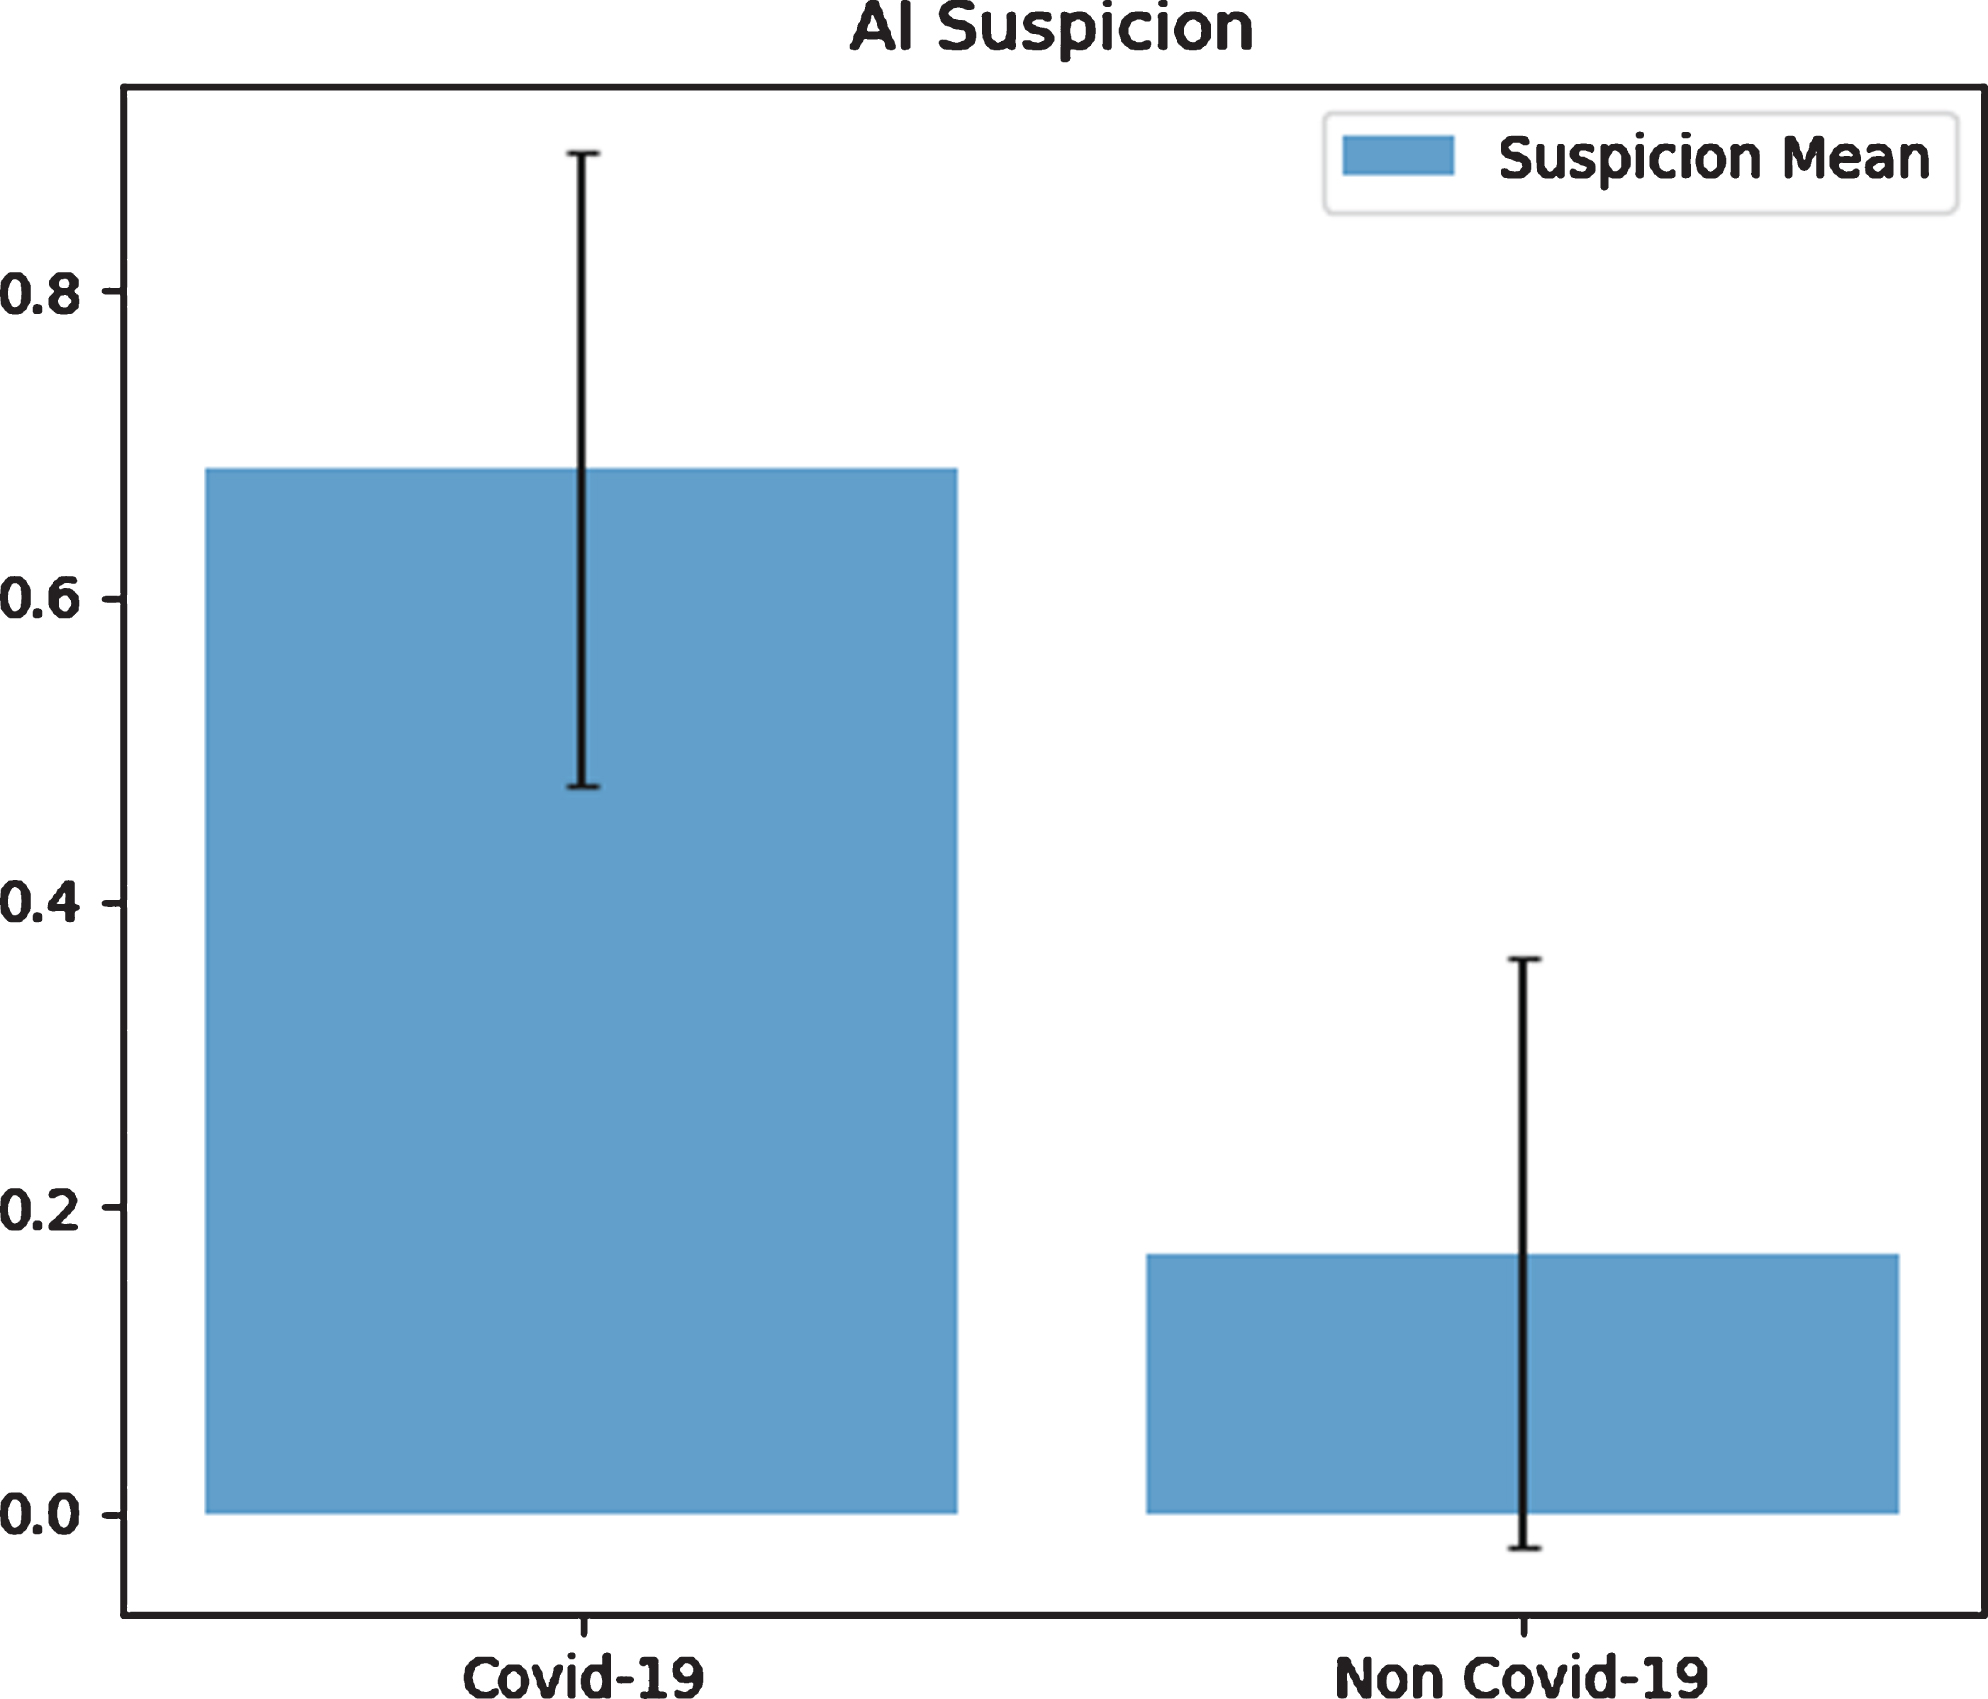
Table 5 and Fig. 6 show the statistics of AI-predicted COVID-19 and non-COVID-19 suspicion. The value 0.5 is chosen as the threshold value to distinguish whether the patient was COVID-19 positive or not. The averaged AI-predicted confidence for COVID-19 is 0.683±0.207 (95% CI: 0.639–0.727), and for non-COVID-19 is 0.170±0.192 (95% CI: 0.132–0.208).
Table 5
COVID-19 suspicion
| Diagnosis conclusion | AI prediction - COVID-19 suspicion | ||
| COVID-19 | Positive | Average | 0.683 |
| Standard deviation | 0.207 | ||
| 95% CI | [0.639, 0.727] | ||
| Negative | Average | 0.170 | |
| Standard deviation | 0.192 | ||
| 95% CI | [0.132, 0.208] | ||
Fig. 6
COVID-19 and non-COVID-19 suspicion by using AI.
3.3Comparison between the performance of radiologists with or without the assistance of AI
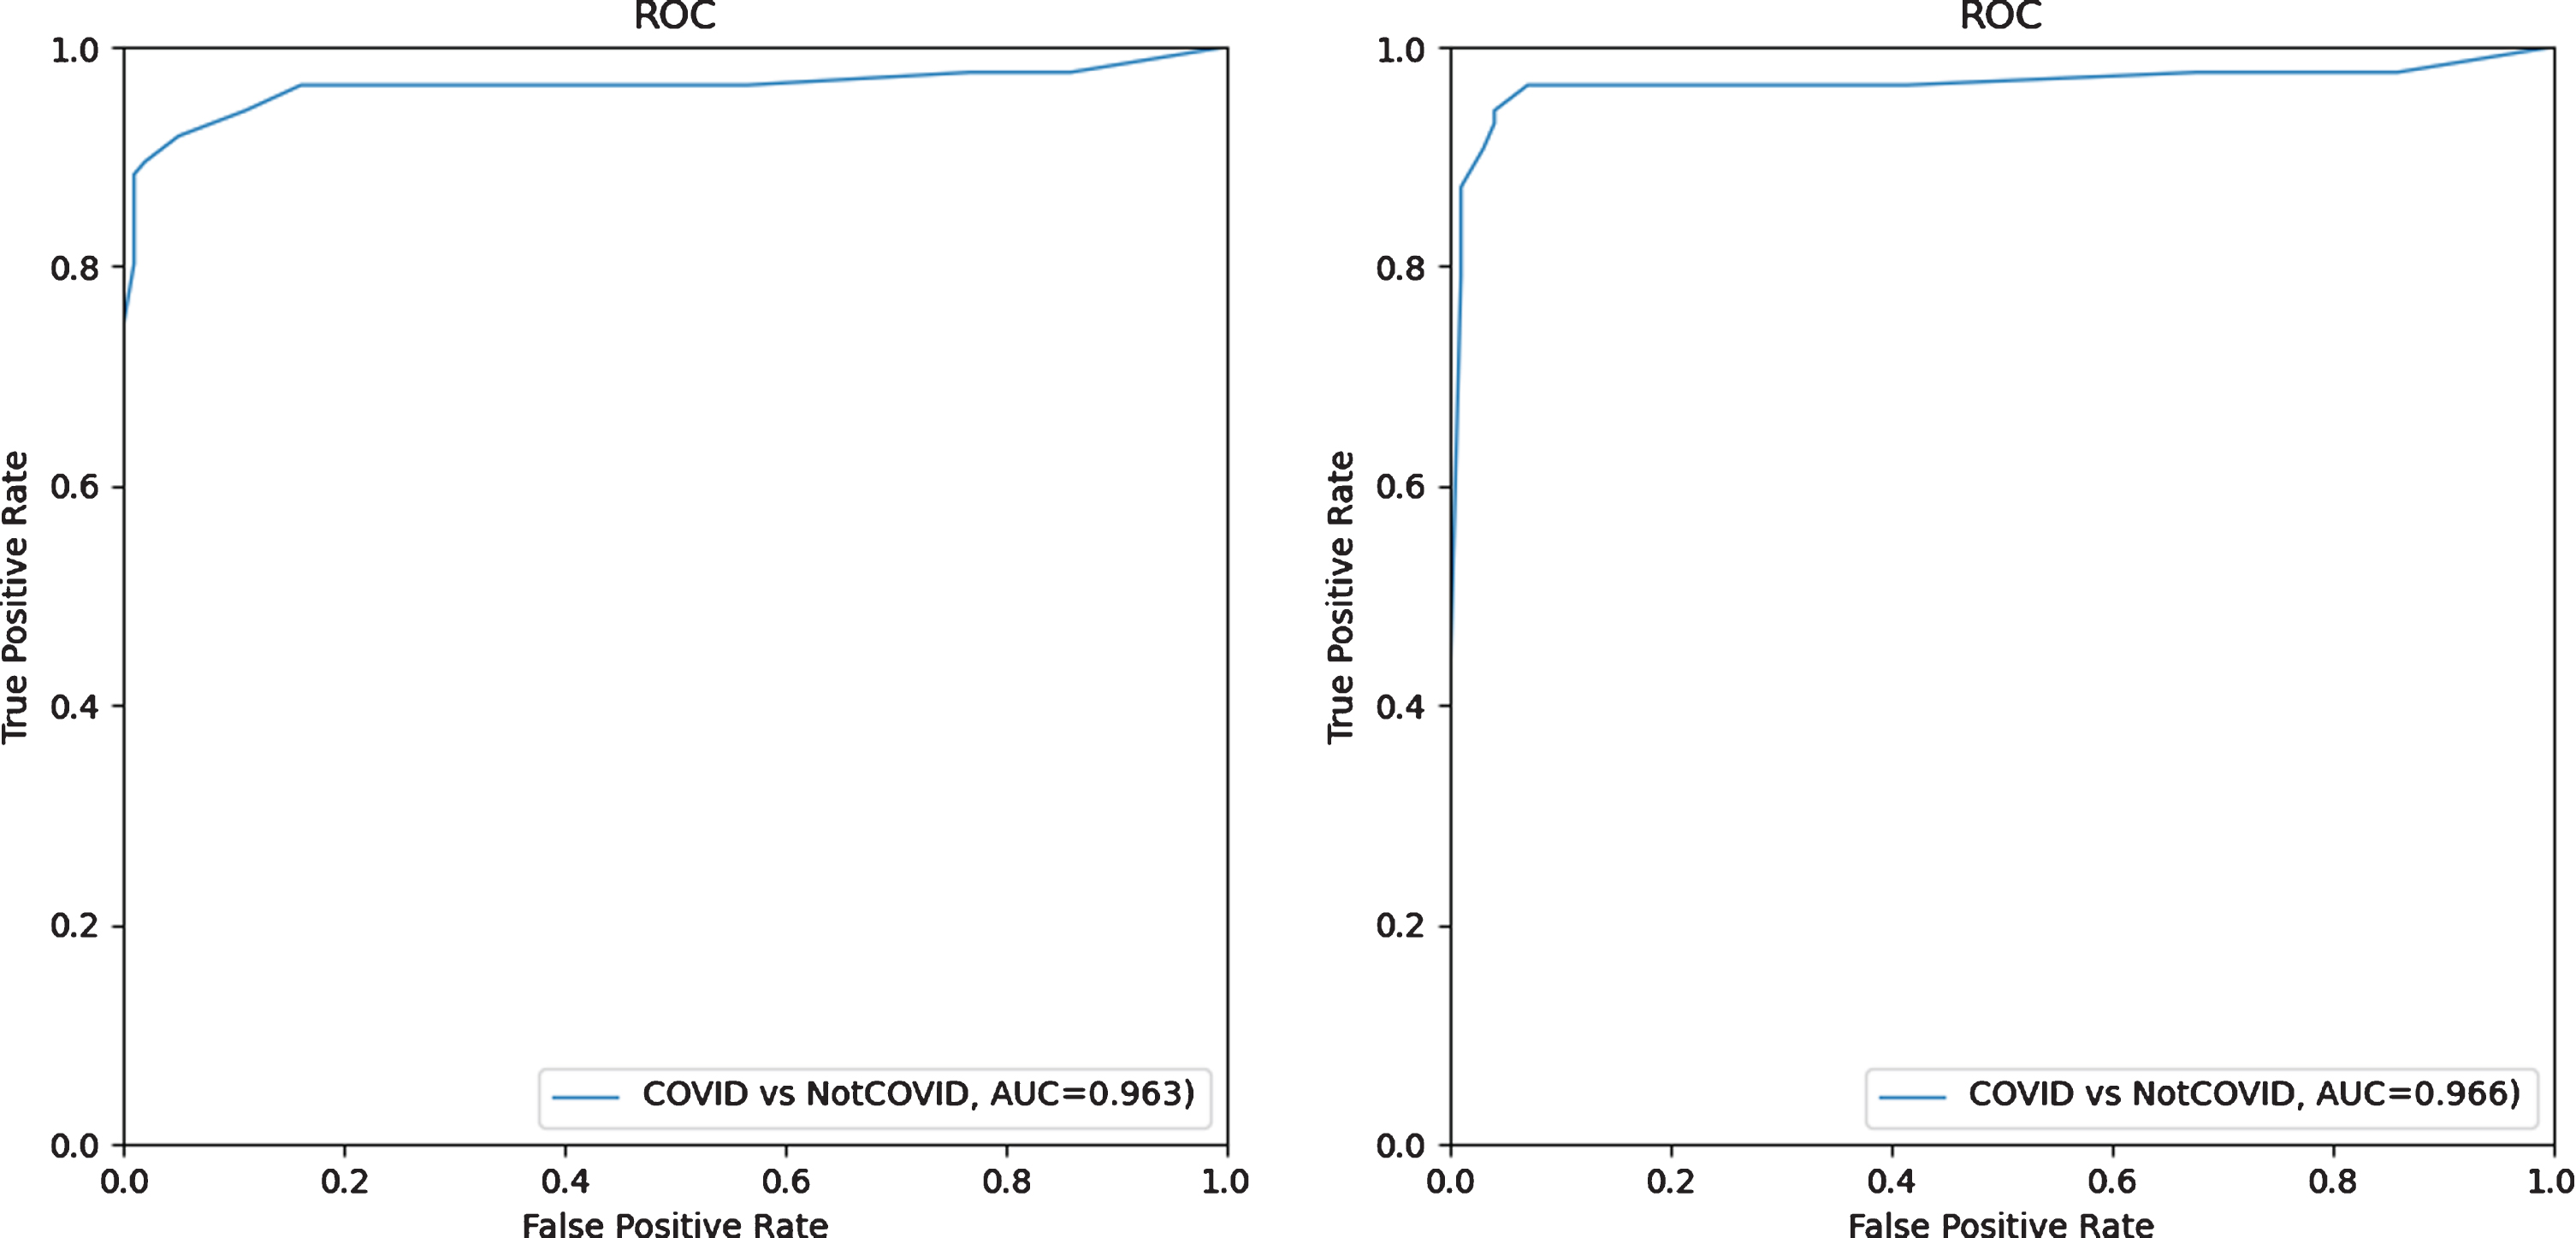
First, the radiologists read CT scan images from the independent test set without AI assistance. The given scores for each case by the radiologists were converted into 0 to 1 (i.e. 0 to 0, 1 to 0.2, 3 to 0.6, 4 to 0.8 and 5 to 1) and the average for each case was computed, followed by generating the ROC curve shown in Fig. 7 on the left. For the second session with AI assistance, similar procedures were conducted to generate the ROC curve shown in Fig. 7 right. The results of the first session resulted a test AUC of 0.963, and it was slightly increased to 0.966 when AI assistance was involved in the second session for the radiologists, indicating that the deep-learning model could improve the radiologists’ confidence in making a diagnosis.
Fig. 7
ROC curves of radiologist average on the test set without AI assistance (left) and with (right) AI assistance.
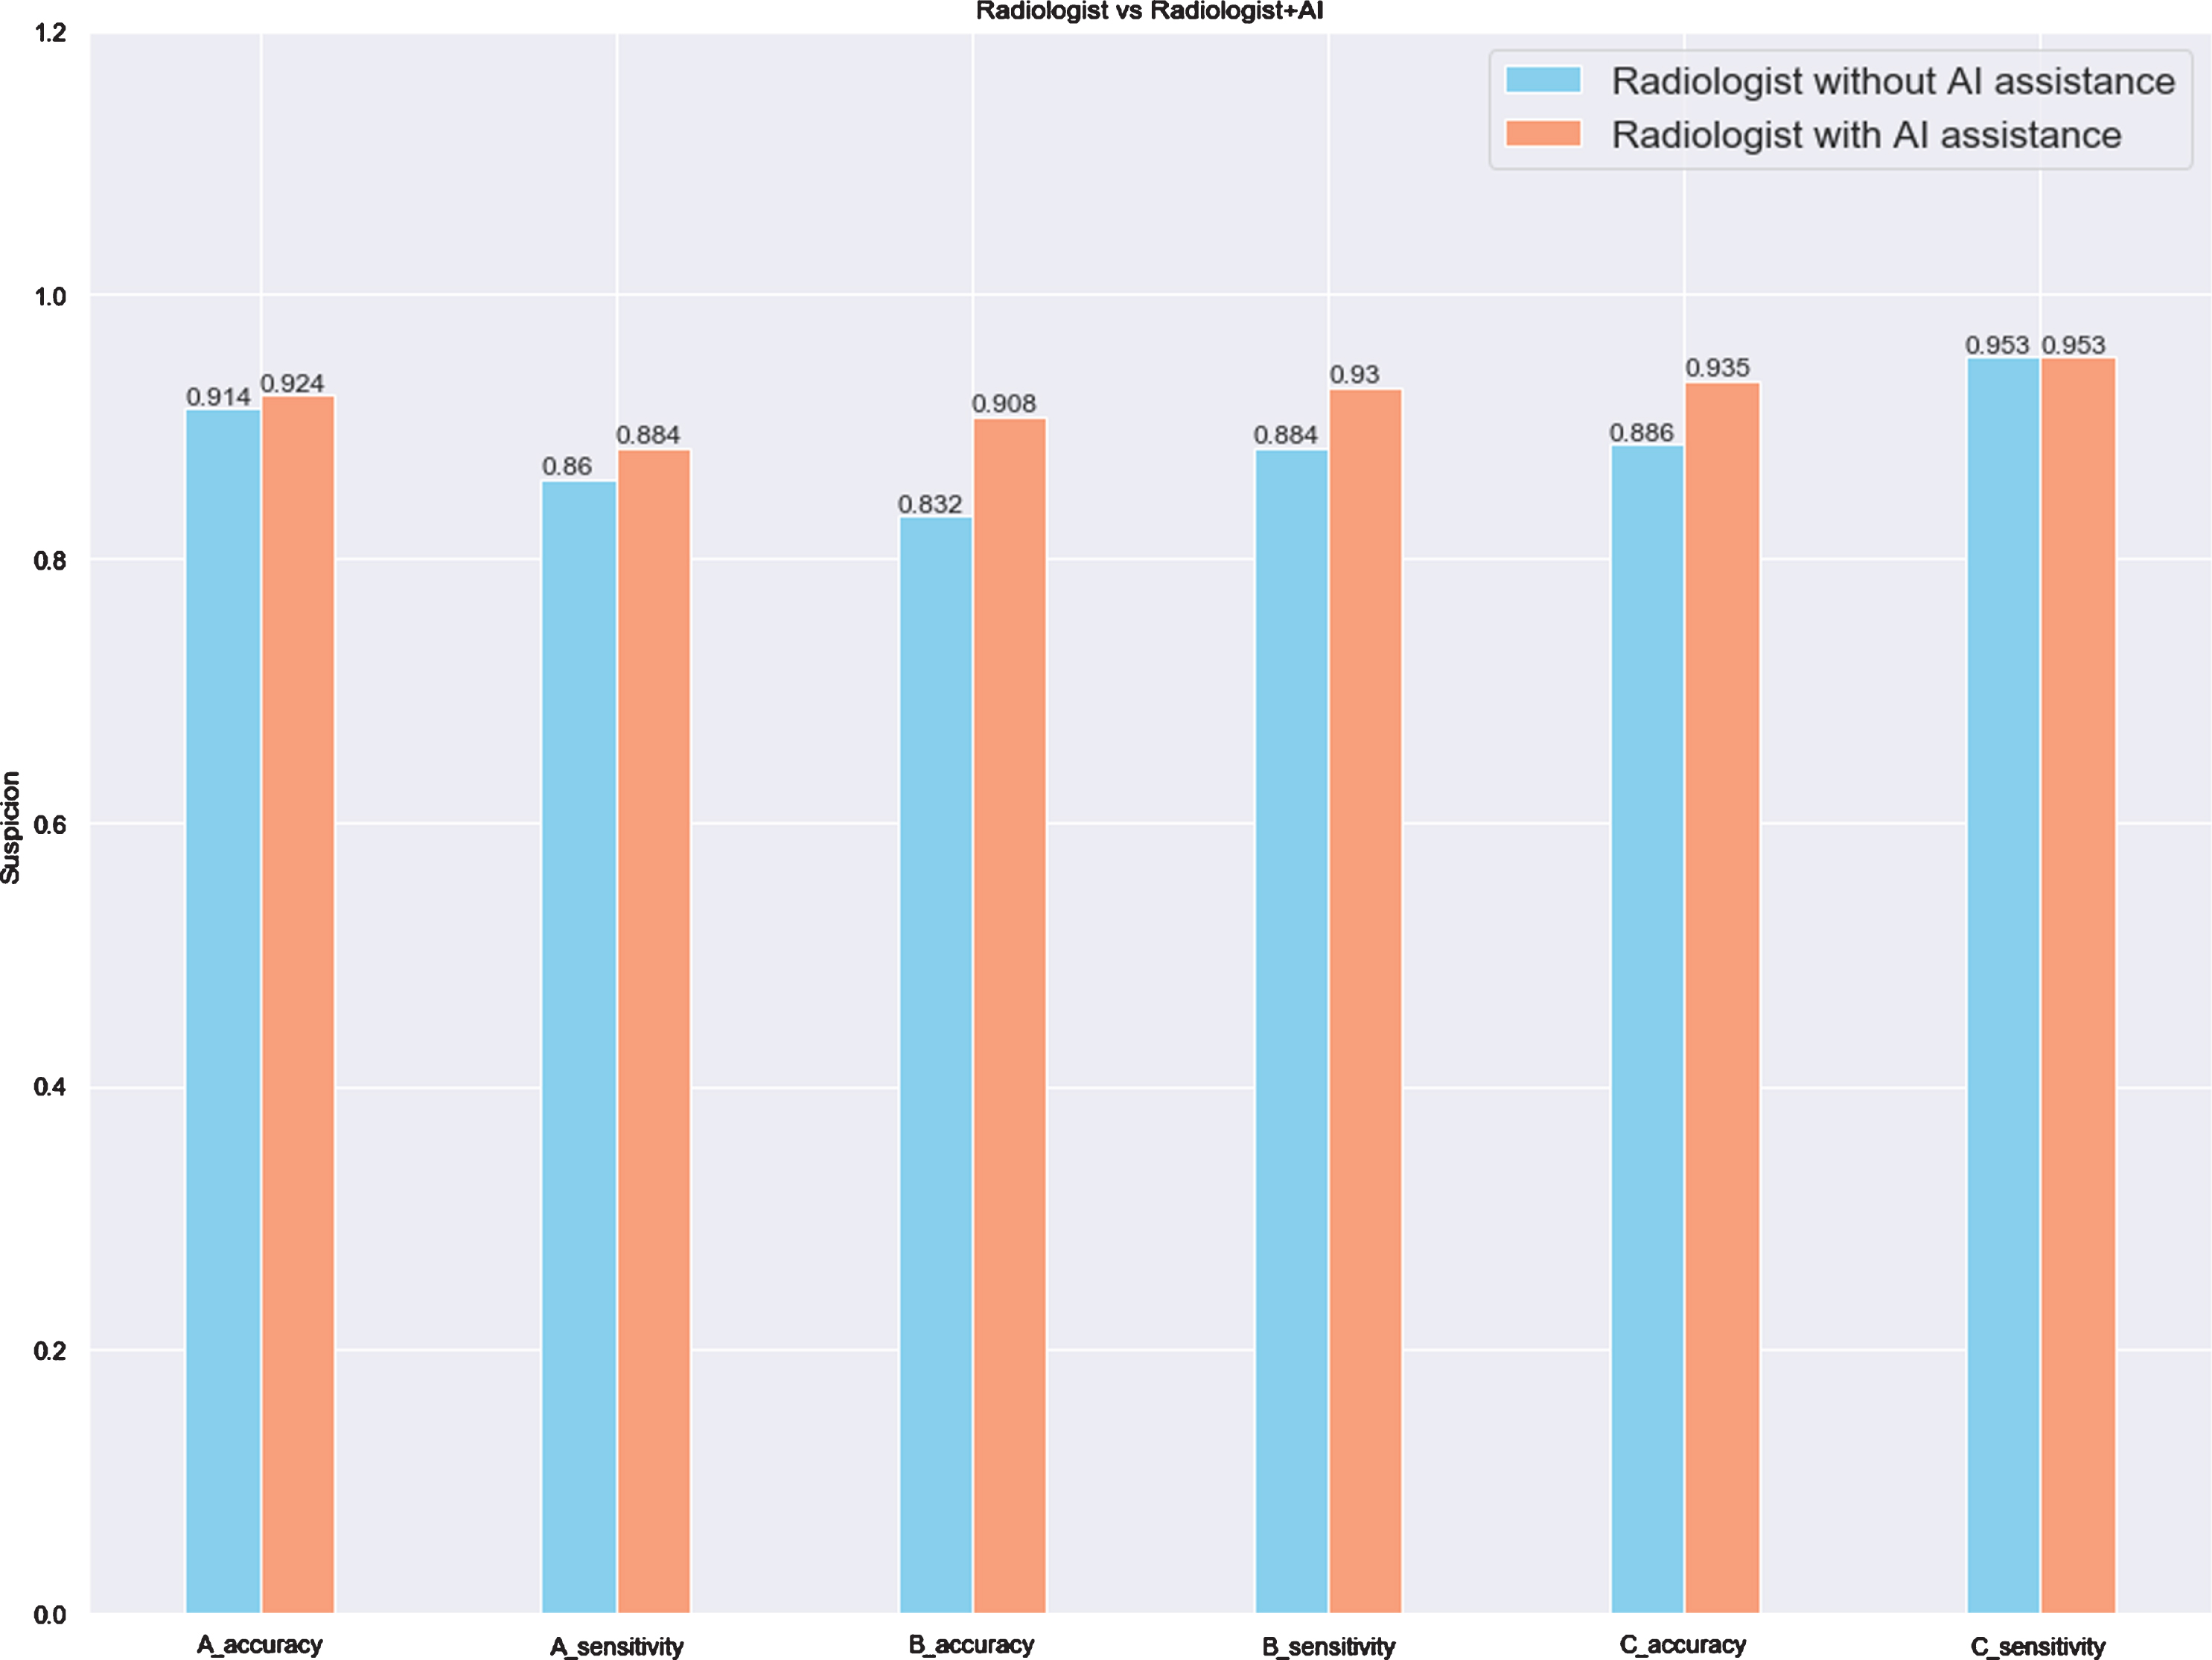
The radiologists’ performance on the test set is demonstrated in Table 6. For the blind review without AI assistance, the three radiologists had an average accuracy of 0.941 and sensitivity of 0.895. The average accuracy was not simply computed by averaging the accuracy of each radiologist (i.e. 0.914, 0.832 and 0.886), but by averaging the scores of the three radiologists for each case, and choosing 2.5 as the threshold value to distinguish whether the patient was infected or not. Assisted by the AI prediction, the radiologists achieved a higher average accuracy (0.951 vs. 0.941, Δ= 0.010) and sensitivity (0.942 vs. 0.895, Δ= 0.047). Despite the different levels of experience of the three radiologists, the accuracy and sensitivity for each radiologist were improved or at least remained unchanged (i.e. the sensitivity of Radiologist C remained 0.953, no matter without or with AI assistance). Table 6 and Fig. 8 summarize and display the comparison of the radiologists’ performance without and with AI assistance in differentiating between COVID-19 and non-COVID-19.
Table 6
The results of three radiologists without and with AI assistance on the test set (n = 185) in differentiating between COVID-19 and non-COVID-19
| Without AI assistance (95% CI) | With AI assistance (95% CI) | Radiologist with AI assistance minus radiologist without AI assistance (Δ) | ||
| Radiologist A | Accuracy | 0.914 (0.863–0.947) | 0.924 (0.876–0.955) | 0.01 |
| Sensitivity | 0.86 (0.77–0.92) | 0.884 (0.76–0.94) | 0.024 | |
| Radiologist B | Accuracy | 0.832 (0.772–0.88) | 0.908 (0.857–0.943) | 0.076 |
| Sensitivity | 0.884 (0.79–0.94) | 0.93 (0.85–0.97) | 0.046 | |
| Radiologist C | Accuracy | 0.886 (0.832–0.925) | 0.935 (0.889–0.964) | 0.049 |
| Sensitivity | 0.953 (0.909–0.976) | 0.953 (0.910–0.976) | 0 | |
| Radiologist Average | Accuracy | 0.941 (0.896–0.968) | 0.951 (0.909–0.976) | 0.010 |
| Sensitivity | 0.895 (0.845–0.934) | 0.942 (0.896–0.968) | 0.047 |
Fig. 8
The comparison of three radiologists without and with AI assistance on the test set (n = 185).
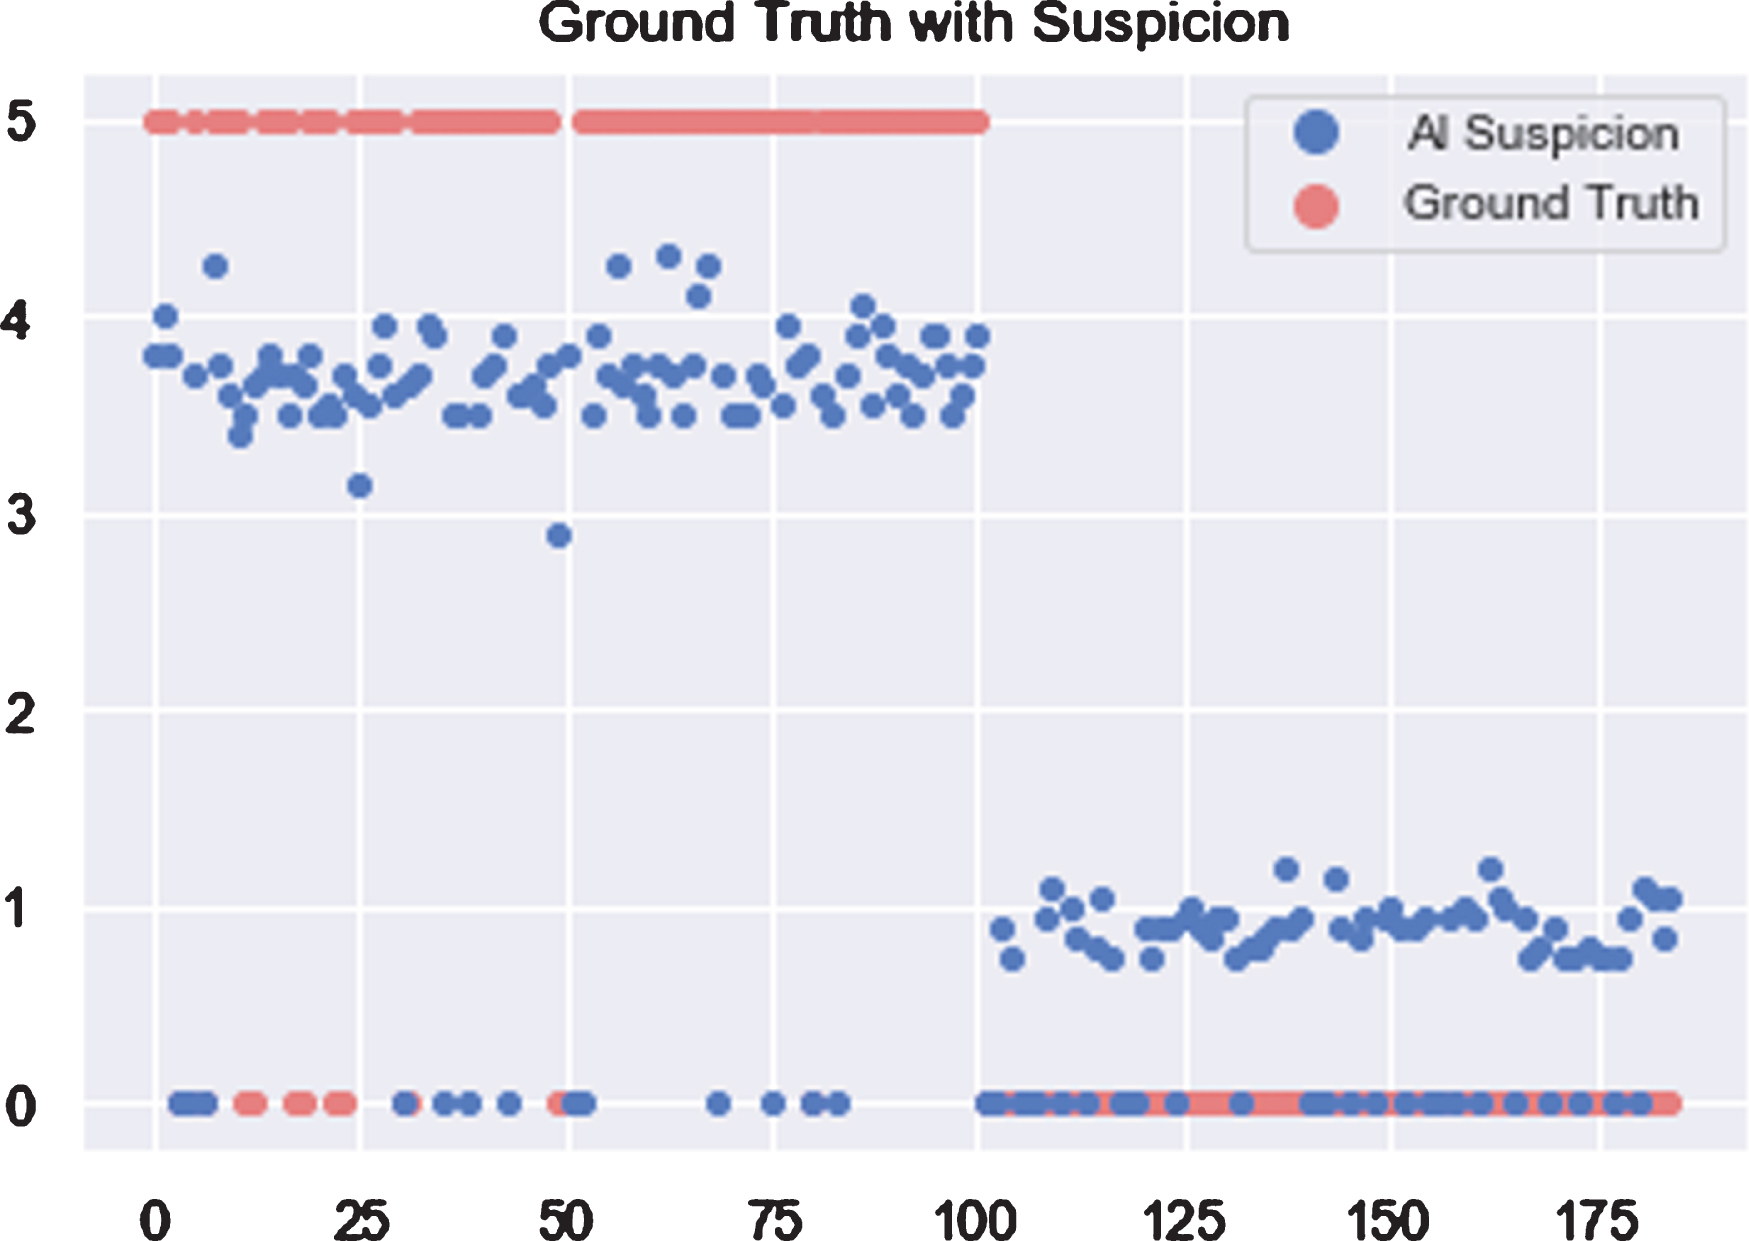
With the data consisting of 185 patients indexed from 1 to 185, all COVID-19 patients are distributed within index 1 to 100. As shown in Fig. 9, horizontal and vertical axes represent patient index and score of COVID-19 Suspicion. Based on the assumption that patients with larger scores are more likely infected with COVID-19, 2.5 is chosen as the threshold value to distinguish whether the patient was infected or not.
Fig. 9
Scores of COVID-19 suspicion for each patient when using AI.
In order to evaluate whether the AI system is helpful in making a clinical diagnosis, the three radiologists (named A, B and C) participated in the experiment and collaborated with the AI system. Figure 10 shows their results for 185 patients before and after using the AI assistant system.
Fig. 10
Scores of COVID-19 suspicion for each patient by three radiologists without and with AI assistance. Blue dots represent AI suspicion and green dots represent radiologist suspicion.
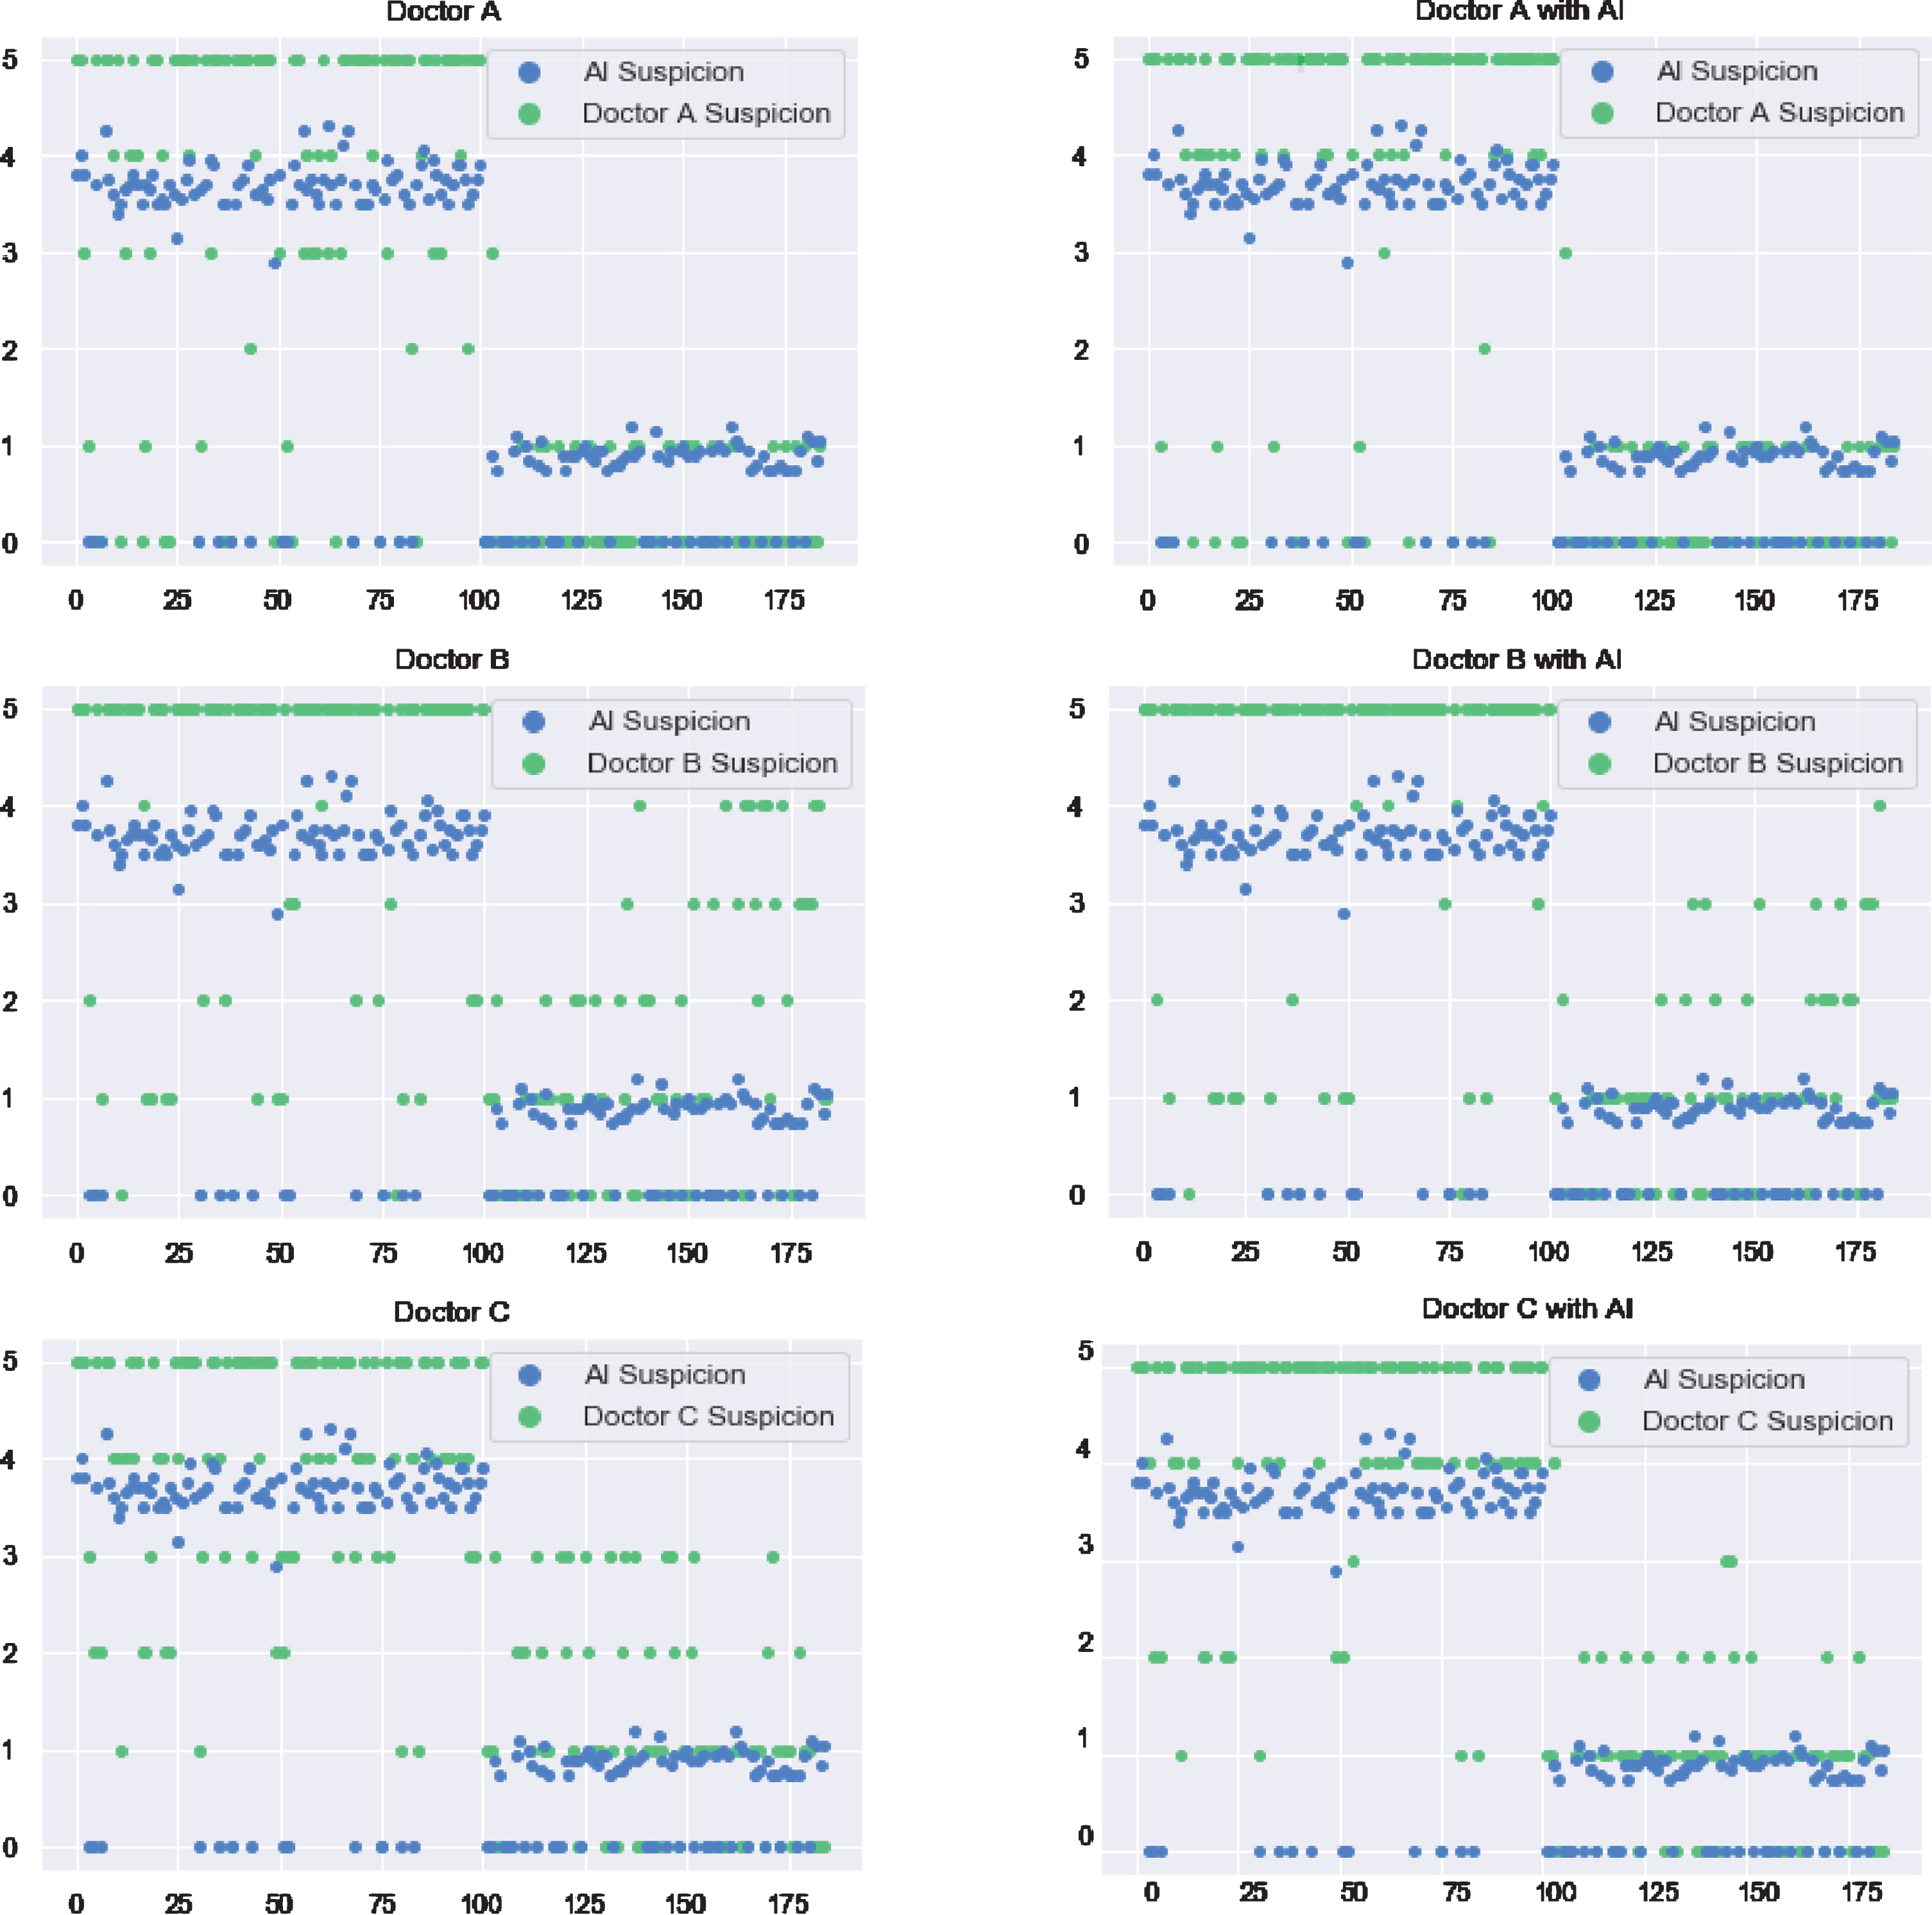
Radiologists’ judgments are reliable because radiologist A and B have around 20 years working experience, and Radiologist C, who is younger, has more than 5 years working experience. According to the comparison of the radiologists’ results, with and without assistance of AI algorithms, radiologists adopt suggestions from the AI system by adjusting their rating results to some extent after seeing the AI system results; details are discussed in the following paragraphs.
Diagnosis of radiologist A on patients with an index number larger than 100 is highly consistent with the AI system. While, for the rest of the patients, radiologist A’s results differ from the AI results. Radiologist A corrected the diagnosis based on the AI suggestions. Comparing the scatter plot of Radiologist B before and after using the AI system, it is obvious that Radiologist B insisted on his previous judgement among most of the tested patients. With respect to the younger radiologist C, in contrast to the experienced radiologists A and B, many patients were rated with values of 2, 3 and 4, which means that Radiologist C is not very confident.
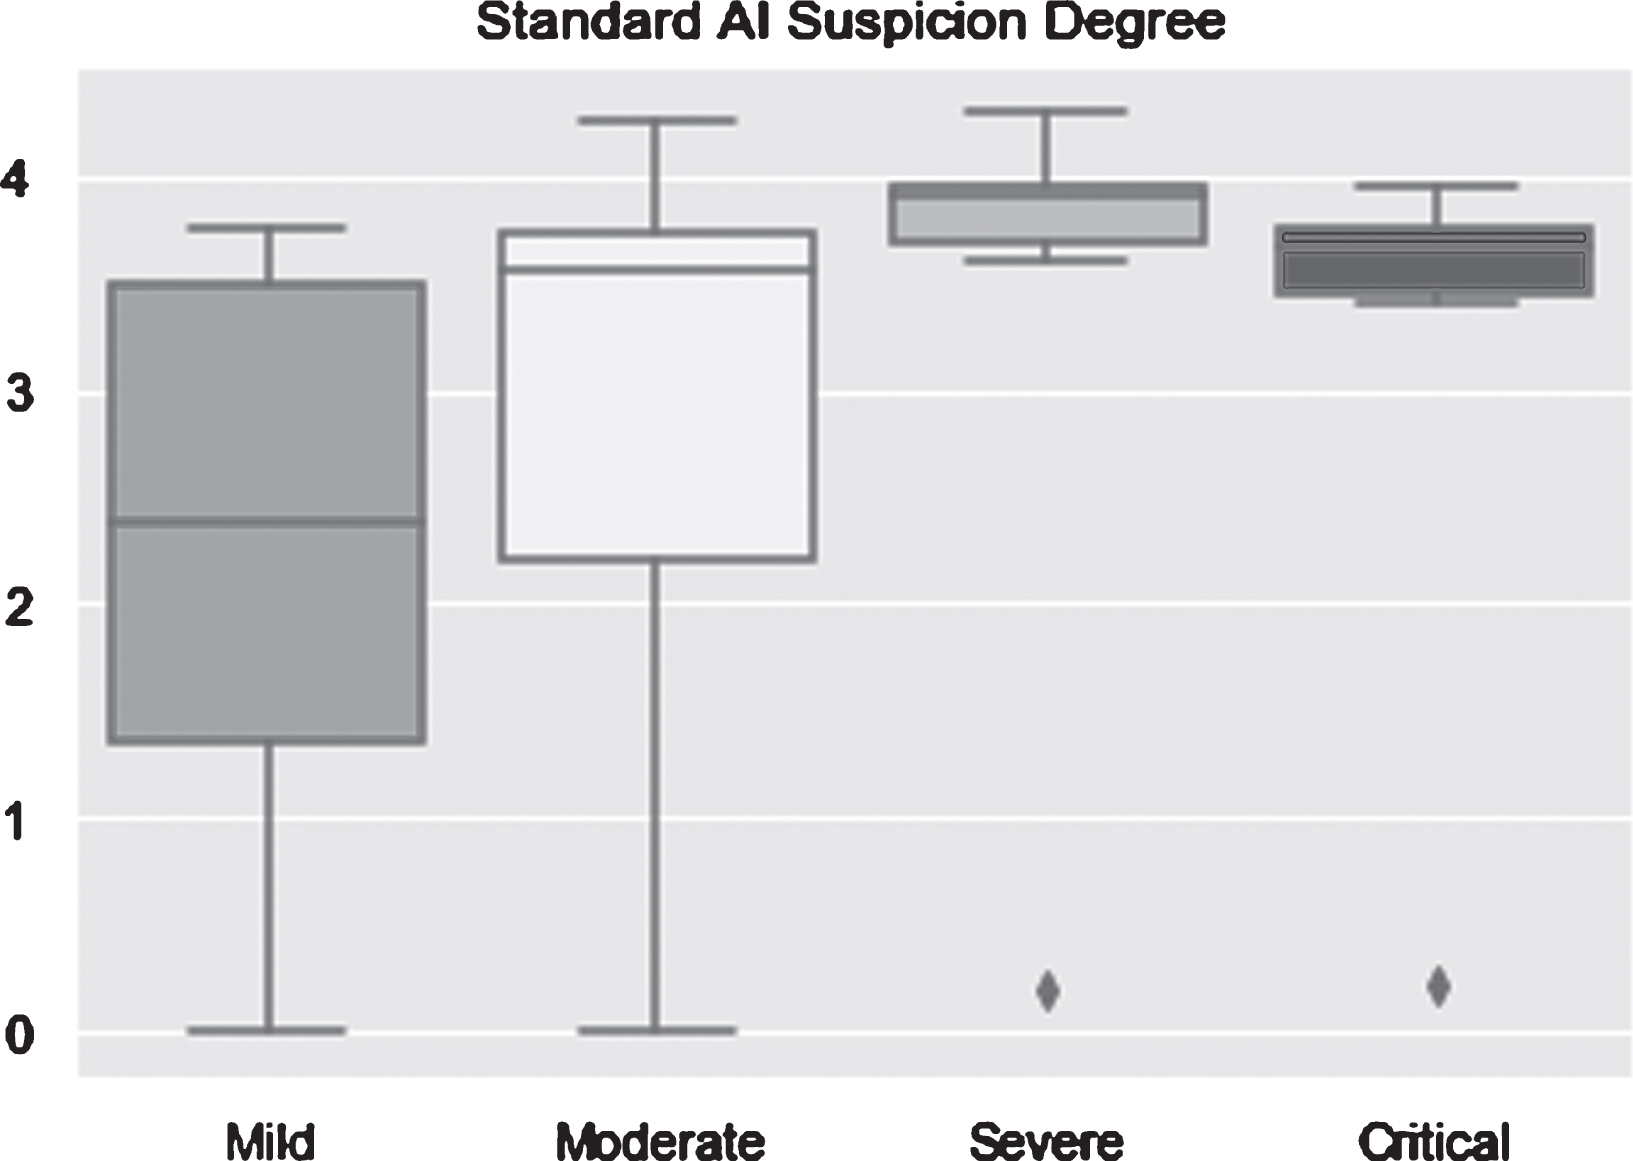
For a deeper analysis, a boxplot was chosen as a tool to graphically display the AI algorithms’ performance. A boxplot always consists of two main parts which are bounds and box body. Bounds are the maximum and minimum value of data represented by two lines in the top and bottom of the plot. The box body contains 50 percent of the data; the first quartile marks one end of the box and the third quartile marks the other end of the box, and the horizontal line in the box is the median. For patients who are infected with COVID-19, whatever type they are, the optimal result is a boxplot compressed into a horizontal line with the suspicion degree equal to 5. As seen in Fig. 11, AI algorithms performed very well in severe type and critical illness for which the minimum values are still larger than 3.5. The performance on moderate type is acceptable because the median is closed to 4 and most data points are located in the upper part of the plot. However, the result on mild type is unsatisfactory because the median is smaller than the threshold value.
Fig. 11
AI suspicion degree on the test set (n = 185) in differentiating among COVID-19 in mild, moderate, severe and critical types.
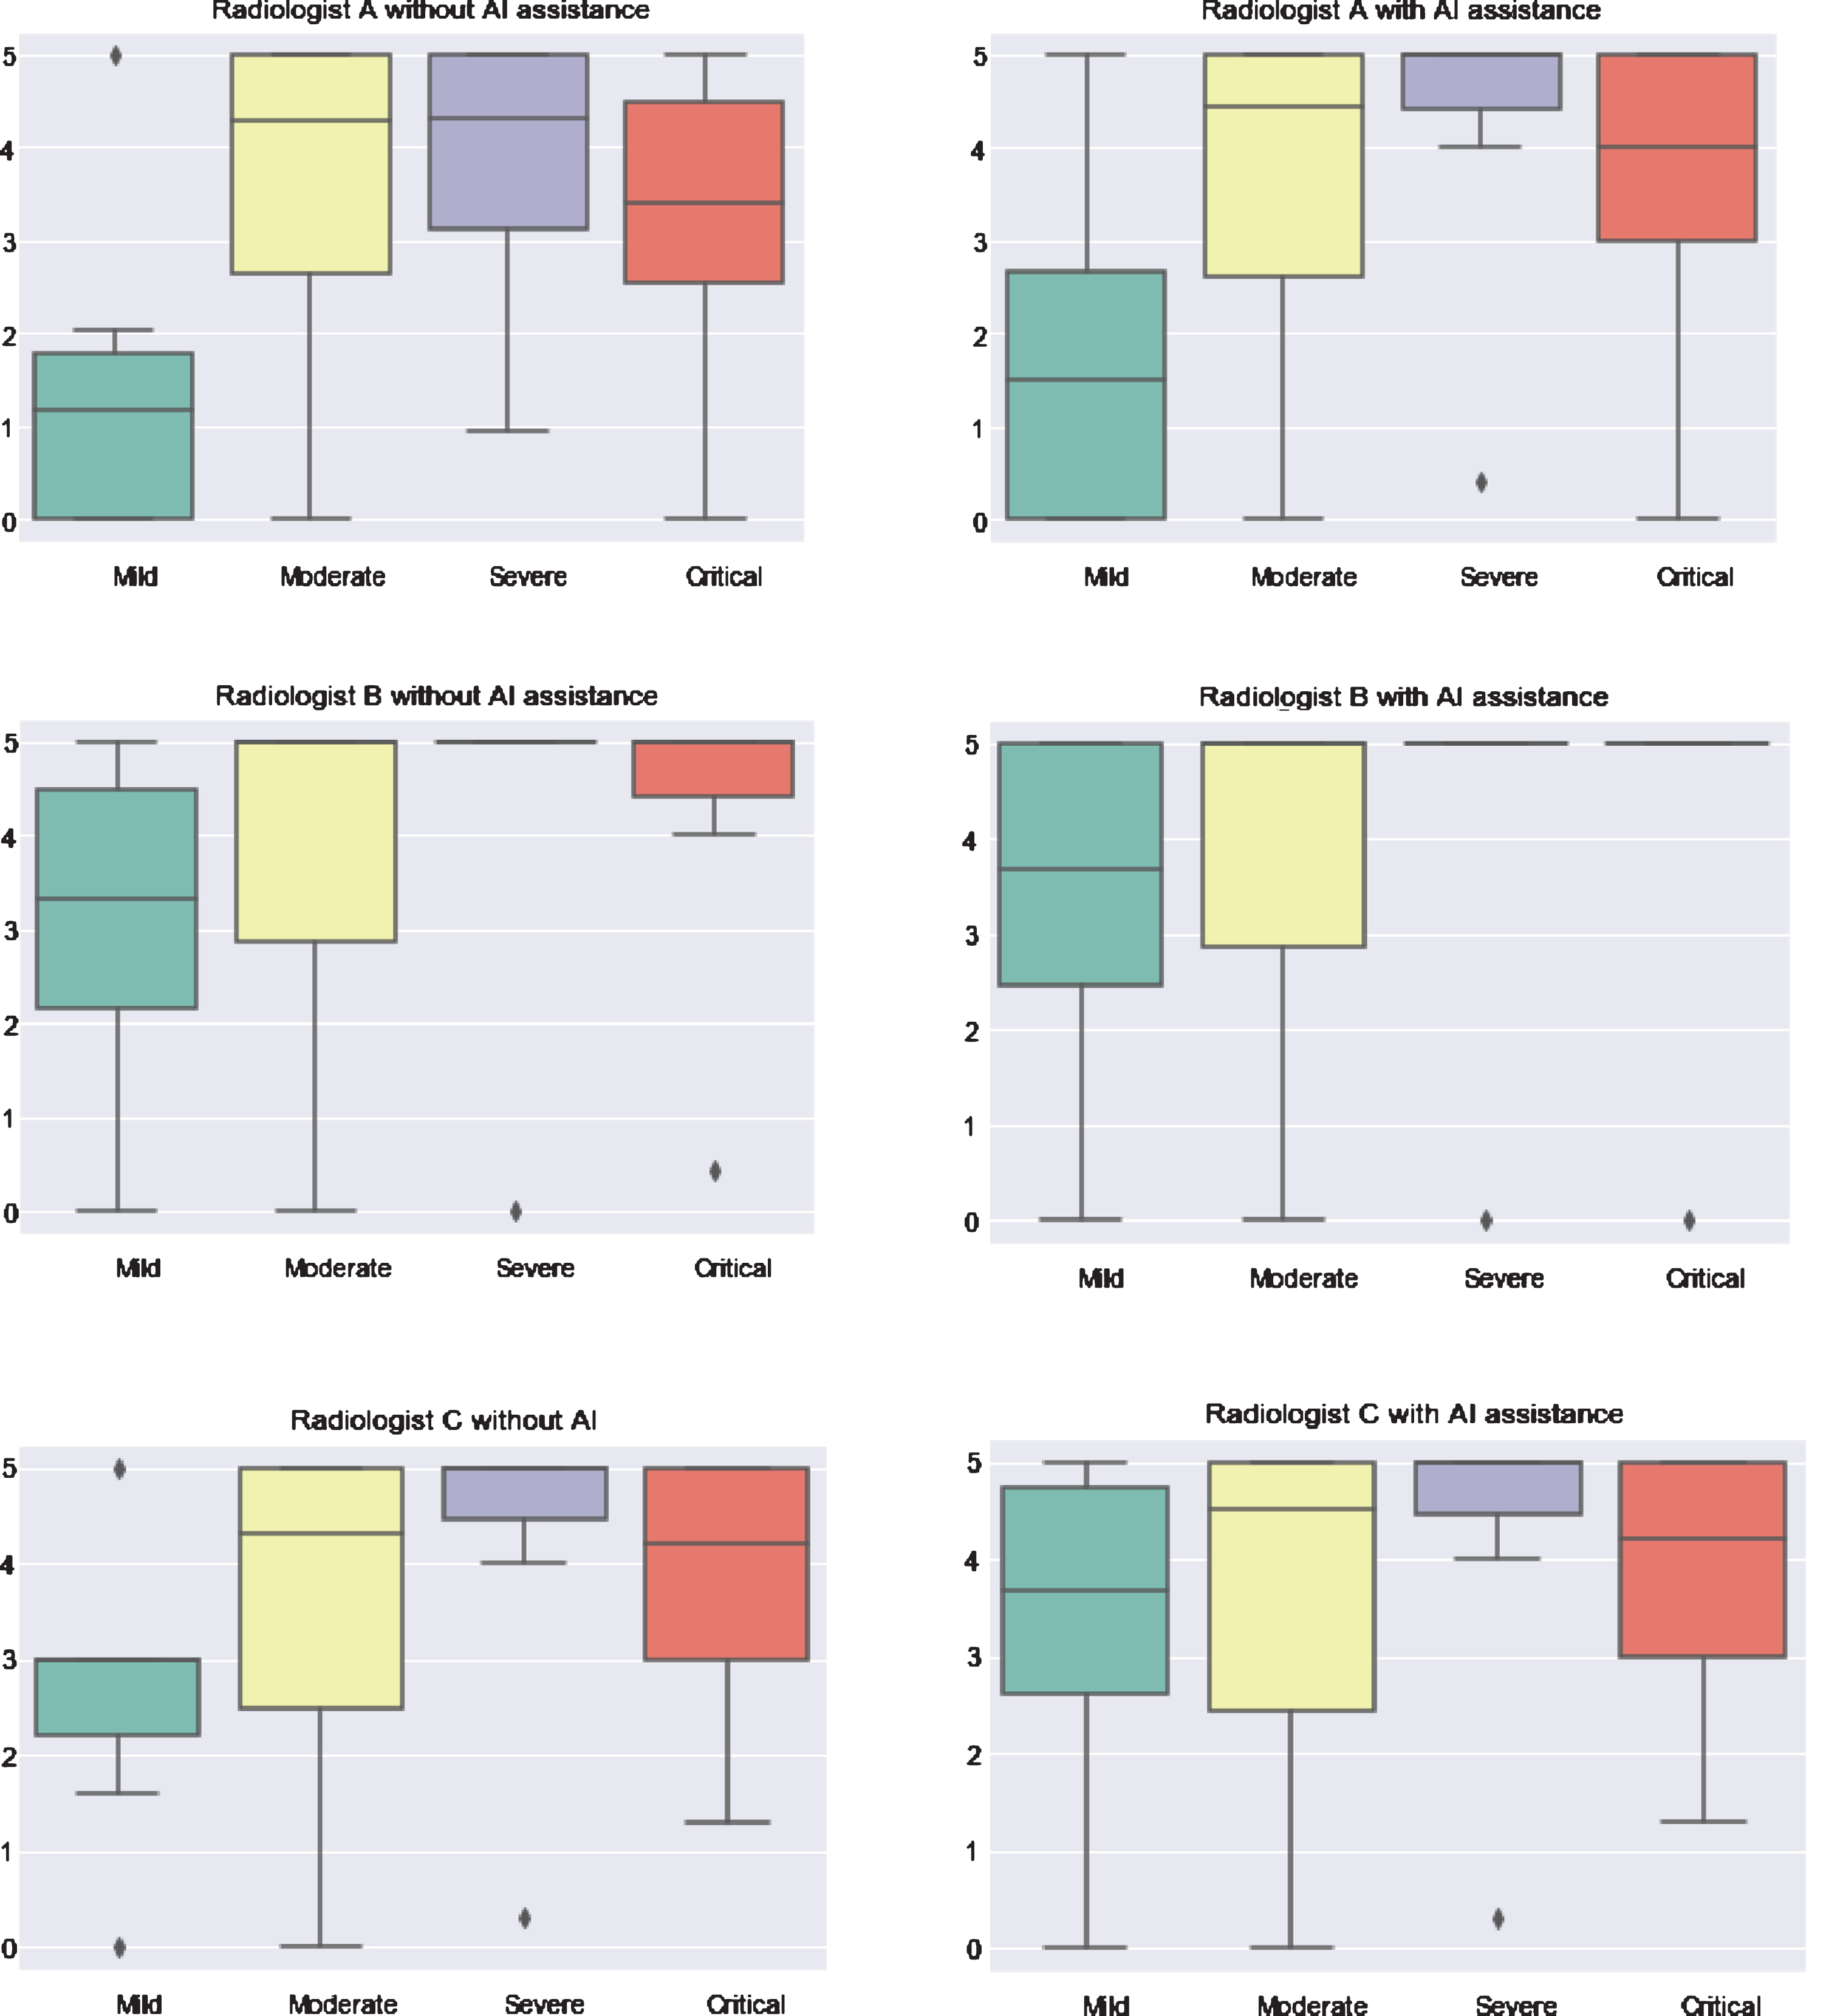
In the infected COVID-19 case, by comparing the radiologists’ suspicion degree with and without assistance of AI algorithms, we see that the AI system improves the radiologists’ performance a lot (Fig. 12). Although the improvement is not distinct for moderate type cases in which the boxplot stays the same, diagnosis of the other three types was improved. In the case of severe type, Radiologist A corrected his result with the help of AI and that is represented as a purple box shrinking to top. Because radiologists B and C already performed well for the severe type, there is no improvement with AI assistance. For all three radiologists, their performance on mild type improved to some extent.
As shown in Fig. 12, all of the three radiologists rated higher than before when assisted by AI for mild cases. Moreover, for radiologist A and B, the upper bound of the box body improved up to 5 compared with the results without AI assistance. Unlike the medians of radiologists A and B, which improved only a little, median of Radiologist C changed a lot. With respect to critical illness, except for Radiologist C who insists on his previous judgement, the other two corrected their diagnoses, in which Radiologist B improved the result reaching the optimal state. To be more specific, as shown in Fig. 12, the horizontal line in the case of critical type for Radiologist B, which means upper bound, bottom bound, first quarter, median and third quarter are all equal to 5, representing no mistakes for this case.
Fig. 12
Comparison of three radiologists without and with assistance of AI on the test set (n = 185) in differentiating among COVID-19 cases.
4Discussion
According to the reported patient cohorts from previous studies, the early imaging manifestation of COVID-19 from CT findings are ground glass opacity (GGO) and consolidation with subpleural, peripheral or peribronchovascular distribution [19–21], which may vary with age, immunity status, disease stage, underlying diseases, etc. of the patients [22]. The CT findings in the current study are consistent with reported evidence for COVID-19 infected patients, as described in Section 3.1. Since the imaging manifestations of COVID-19 are somewhat overlapping with other pulmonary infections, especially other common viral infections, it might not be easy to distinguish COVID-19 infected patients among them. Automated detection of COVID-19 from chest CT images by using AI would have great advantages. It can help overcome the shortage of radiologists, which can delay the diagnosis and affect the treatment and the overall control of the COVID-19 epidemic. It can also help to reduce diagnostic bias and increase diagnostic efficiency and speed.
Deep learning shows great promise for medical application, especially in medical diagnosis from images due to numerous reported impressive outcomes, including diagnostic AI tools for tuberculosis, lung nodules, breast cancer, and others [12–14, 23–25]. The selection of deep learning models is of vital importance for building a successful detection system in this COVID-19 epidemic, and several studies have already reported the utilization of 2D and 3D convolutional neural network (CNN) models to classify CT samples and achieved considerable performance by using these models. Yet, the practical application of AI augmentation in COVID-19 diagnosis has been rarely explored in the literature, much less the differentiation of COVID-19 from other pulmonary infections.
In this study, a deep learning algorithm was first trained to diagnose COVID-19 using chest CT images of different types of pulmonary diseases, including tuberculosis, common pneumonia, non-COVID-19 viral pneumonia, and COVID-19 pneumonia. The deep learning-based model then improved the radiologists’ performance in distinguishing COVID-19 from other pulmonary infections, yielding better average accuracy and sensitivity, from 0.941 to 0.951 and from 0.895 to 0.942, respectively, when compared to radiologists without AI assistance. Radiologists vary in their skills, and their performance can be affected by heavy workload, outside pressure, and subjective status, leading to misdiagnosis. The deep learning-based model in this study is highly stable and would never be affected by factors such as overwork and pressure, thus showing great potential to help radiologists as a screening tool.
5Conclusion
In the present study, an up-to-date network — ResUNet has been successfully applied with high accuracy, showing the usefulness of AI augmentation for distinguishing COVID-19 from other pulmonary infectious diseases in chest CT images. This can help to decrease the workload and to relieve the pressure of frontline medical workers, and to accelerate the efficiency of the diagnosis, which will be beneficial in the fight against COVID-19. Future studies will focus on investigating the real-time application of AI to assist radiologists in detecting COVID-19.
Conflicts of interest
All authors have read the journal’s policy on disclosure of potential conflicts of interest and have none to declare.
Acknowledgments
The research was supported by Shenzhen Science and Technology Program (Grant No. KQTD2017033110081833), as well as partially supported by the Intramural Research Program of the Lister Hill National Center for Biomedical Communications (LHNCBC) at the U.S. National Library of Medicine (NLM), National Institutes of Health (NIH). The content is solely the responsibility of the authors and does not necessarily represent the official views of the Shenzhen Science and Technology Program.
References
[1] | Wang C. , Horby P.W. , Hayden F.G. , et al., A novel coronavirus outbreak of global health concern, The Lancet 395: (10223) ((2020) ), 470–473. |
[2] | Han Y. and Yang H. , The transmission and diagnosis of 2019 novel coronavirus infection disease (COVID-19): A Chinese perspective, Journal of Medical Virology 92: (6) ((2020) ), 639–644. |
[3] | Du J. , Dong L. , Wang T. , et al., Psychological symptoms among frontline healthcare workers during COVID-19 outbreak in Wuhan, Gen Hosp Psychiatry 2020; doi:10.1016/j.genhosppsych.2020.03.011 |
[4] | Li Y. and Xia L. , Coronavirus Disease 2019 (COVID-19): Role of Chest CT in Diagnosis and Management, American Journal of Roentgenology 214: (6) ((2020) ), 1280–1286. |
[5] | Diagnosis and Treatment Protocols of COVID-19 Infection (Trial Version 6). The National Health Commission of the People’s Republic of China. |
[6] | Fan L. , Li D. , Xue H. , et al., Progress and prospect on imaging diagnosis of COVID-19, Chinese Journal of Academic Radiology 3: ((2020) ), 4–13. |
[7] | Chinese Society of Radiology, Radiological diagnosis in novel coronavirus pneumonia: expert recommendation from the Chinese Society of Radiology (version 1), Chin J Radiol 54: ((2020) ), E001. |
[8] | Li Z. , Zeng B. , Lei P. , et al., Differentiating pneumonia with and without COVID-19 using chest CT images: from qualitative to quantitative, Journal of X-ray Science and Technology 28: (4) ((2020) ), 583–589. |
[9] | Guan C.S. , Lv Z.B. , Yan S. , et al., Imaging Features of Coronavirus disease 2019 (COVID-19): Evaluation on Thin-Section CT, Academic Radiology 27: (5) ((2020) ), 609–613. |
[10] | Lei P. , Huang Z. , Liu G. , et al., Clinical and computed tomographic (CT) images characteristics in the patients with COVID-19 infection: What should radiologists need to know? Journal of X-ray Science and Technology 28: (3) ((2020) ), 369–381. |
[11] | Tomasev N. , Glorot X. , Rae J.W. , et al., A clinically applicable approach to continuous prediction of future acute kidney injury, Nature 572: (7767) ((2019) ), 116–119. |
[12] | Bi W.L. , Hosny A. , Schabath M.B. , et al., Artificial intelligence in cancer imaging: Clinical challenges and applications, CA Cancer J Clin 69: (2) ((2019) ), 127–157. |
[13] | Mei X. , Lee H.C. , Diao K.Y. , et al., Artificial intelligence–enabled rapid diagnosis of patients with COVID-19, Nature Medicine 26: ((2020) ), 1224–1228. |
[14] | Heidari M. , Mirniaharikandehei S. , Khuzani A.Z. , et al., Improving the performance of CNN to predict the likelihood of COVID-19 using chest X-ray images with preprocessing algorithms, International Journal of Medical Informatics 144: ((2020) ), 104284. |
[15] | Xu X. , Jiang X. , Ma C. , et al., Deep learning systemto screen coronavirus disease 2019 pneumonia, arXiv:2020.09334. |
[16] | Diakogiannis F.I. , Waldner F. , Caccetta P. , et al., ResUNet-a: A deep learning framework for semantic segmentation of remotely sensed data, ISPRS Journal of Photogrammetry and Remote Sensing 162: ((2020) ), 94–114. |
[17] | Ronneberger O. , Fischer P. and Brox T. , U-net: Convolutional networks for biomedical image segmentation, in International Conference on Medical image computing and computer-assisted intervention, (2015) . Springer. |
[18] | He K. , Zhang X. , Ren S. , et al., Deep Residual Learning for Image Recognition, in 2016 IEEE Conference on Computer Vision and Pattern Recognition (CVPR), (2016) . |
[19] | Zheng Q. , Lu Y. , Lure F. , Jaeger S. and Lu P. , Clinical and radiological features of novel coronavirus pneumonia, Journal of X-ray Science and Technology 28: (3) ((2020) ), 391–404. |
[20] | Fu L. , Wang B. , Yuan T. , et al., Clinical characteristics of coronavirus disease 2019 (COVID-19) in China: a systematic review and meta-analysis, Journal of Infection 80: (6) ((2020) ), 656–665. |
[21] | Ai T. , Yang Z. , Hou H. , et al., Correlation of chest CT and RT-PCR testing in coronavirus disease 2019 (COVID-19) in China: a report of 1014 cases, Radiology 296: (2) ((2020) ), E32–E34. |
[22] | Jin Y.H. , Cai L. , Cheng Z.-S. , et al., A rapid advice guideline for the diagnosis and treatment of 2019 novel coronavirus (2019-nCoV) infected pneumonia (standard version), Military Medical Research 7: (1) ((2020) ), 4. |
[23] | Lakhani P. and Sundaram B. , Deep learning at chest radiography: automated classification of pulmonary tuberculosis by using convolutional neural networks, Radiology 284: (2) ((2017) ), 574–582. |
[24] | Campanella G. , Hanna M.G. , Geneslaw L. , et al., Clinical-grade computational pathology using weakly supervised deep learning on whole slide images, Nature Medicine 25 (: ((2019) ), 1301–1309. |
[25] | Cheng J.Z. , Ni D. , Chou Y.H. , et al., Computer-aided diagnosis with deep learning architecture: applications to breast lesions in US images and pulmonary nodules in CT scans, Scientific Reports 6: ((2016) ), 24454. |


