
Identification of COVID-19 samples from chest X-Ray images using deep learning: A comparison of transfer learning approaches
Abstract
BACKGROUND:
The novel coronavirus disease 2019 (COVID-19) constitutes a public health emergency globally. The number of infected people and deaths are proliferating every day, which is putting tremendous pressure on our social and healthcare system. Rapid detection of COVID-19 cases is a significant step to fight against this virus as well as release pressure off the healthcare system.
OBJECTIVE:
One of the critical factors behind the rapid spread of COVID-19 pandemic is a lengthy clinical testing time. The imaging tool, such as Chest X-ray (CXR), can speed up the identification process. Therefore, our objective is to develop an automated CAD system for the detection of COVID-19 samples from healthy and pneumonia cases using CXR images.
METHODS:
Due to the scarcity of the COVID-19 benchmark dataset, we have employed deep transfer learning techniques, where we examined 15 different pre-trained CNN models to find the most suitable one for this task.
RESULTS:
A total of 860 images (260 COVID-19 cases, 300 healthy and 300 pneumonia cases) have been employed to investigate the performance of the proposed algorithm, where 70% images of each class are accepted for training, 15% is used for validation, and rest is for testing. It is observed that the VGG19 obtains the highest classification accuracy of 89.3% with an average precision, recall, and F1 score of 0.90, 0.89, 0.90, respectively.
CONCLUSION:
This study demonstrates the effectiveness of deep transfer learning techniques for the identification of COVID-19 cases using CXR images.
1Introduction
The out of coronavirus disease 2019 (COVID-19) proceeds to have an emerging impact on public health and global well-being. The virus was first recognized in Wuhan, Hubei, China, in December 2018, and on March 11, 2020, the world health organization (WHO) perceived as a pandemic [1– 3]. Over 12.7 million peoples have been affected with COVID-19 to date (July 12, 2020) globally, with more than 565,219 losses of life [4]. Studies have discovered that the transmission rate (TR) of the virus is extremely frightening, with a generative rate between 2.24 to 3.58, which is enormously higher than any other type of virus flu [5]. The remedy for this viral infection is symptomatic and supportive cure since there are no acknowledged vaccines or drugs [6].
Early diagnosis and separation of possibly infectious subjects is a significant step to fight against COVID-19. The gold standard screening approach for identifying the coronavirus is reverse transcription-polymerase chain reaction (RT-PCR) by gene sequencing of respiratory or blood samples [7, 8]. However, this diagnosis practice has a shortage of testing kits, insufficient laboratory, time-consuming, laborious, and low sensitivity, which indicates that in contemporary public health emergencies, many patients will not identify instantly [9]. So, it will further develop the risk of contaminating a healthy community. Therefore, healthcare workers have discovered an alternative screening method that is fast and more sensitive such as chest radiographs (Chest X-ray) or computed tomography (CT) imaging that can show visual indicators connected with COVID-19 viral infection [10, 11]. Studies have found that patients present deformities in chest radiographs if they are affected with COVID-19. The imaging tool is considered to be a rapid screening tool for the speedy identification of suspected patients in the epidemic area. One considerable drawback for CT imaging is that in many underdeveloped and developing countries, CT scanners are not widely available.
Usually, when a patient has indications of COVID-19, like fever, cough, or shortness of breath, they are recommended to get a chest X-Ray (CXR). The most unusual finding is “ground-glass opacities”, which suggests that some portion of lungs resembles a hazy shade of grey instead of being black with excellent white lung markings for blood vessels. In critical type COVID-19 patients, multifocal or diffuse consolidation can be seen in both lungs, showing as “white lung”. Though the CXR is not very sensitive for mild types of patients, it has been proven effective previously in other types of coronaviruses, such as severe acute respiratory syndrome (SARS) and the Middle East respiratory syndrome (MERS) [12– 15].
Most of the hospitals all over the world have conventional radiographs or CXR machines that can produce 2-dimensional (2D) images of a patient’s chest. However, the requirement of expert radiologists and considerable time to analyze the CXR is the main challenge during the pandemic. Therefore, to develop an automated computer-aided diagnostic (CAD) system that can help the doctor to track the COVID-19 infection more efficiently and accurately. The performance of a CAD method entirely depends on image representations (or features). In favor of obtaining a good representation of image data, a significant effort is demanded in image preprocessing and conversion, which is arduous and highlights the inability of automatic learning. Therefore, a deep learning (DL) approach can optimize the training process in this regard by extracting the hierarchical image features without human intervention. In the last few years, DL models have been successfully implemented in numerous medical image analysis tasks such as breast cancer [16], cervical cancer, lung cancer [17, 18], classification of lung nodules [19, 20] and achieving state of the art result over other machine learning models. The main challenge to obtain an efficient CAD system is not only due to the low contrast images and overlapping of soft tissues by chest ribs but also insufficient of annotated dataset. Deep learning technique requires a large amount of dataset to obtain excellent performance [21].
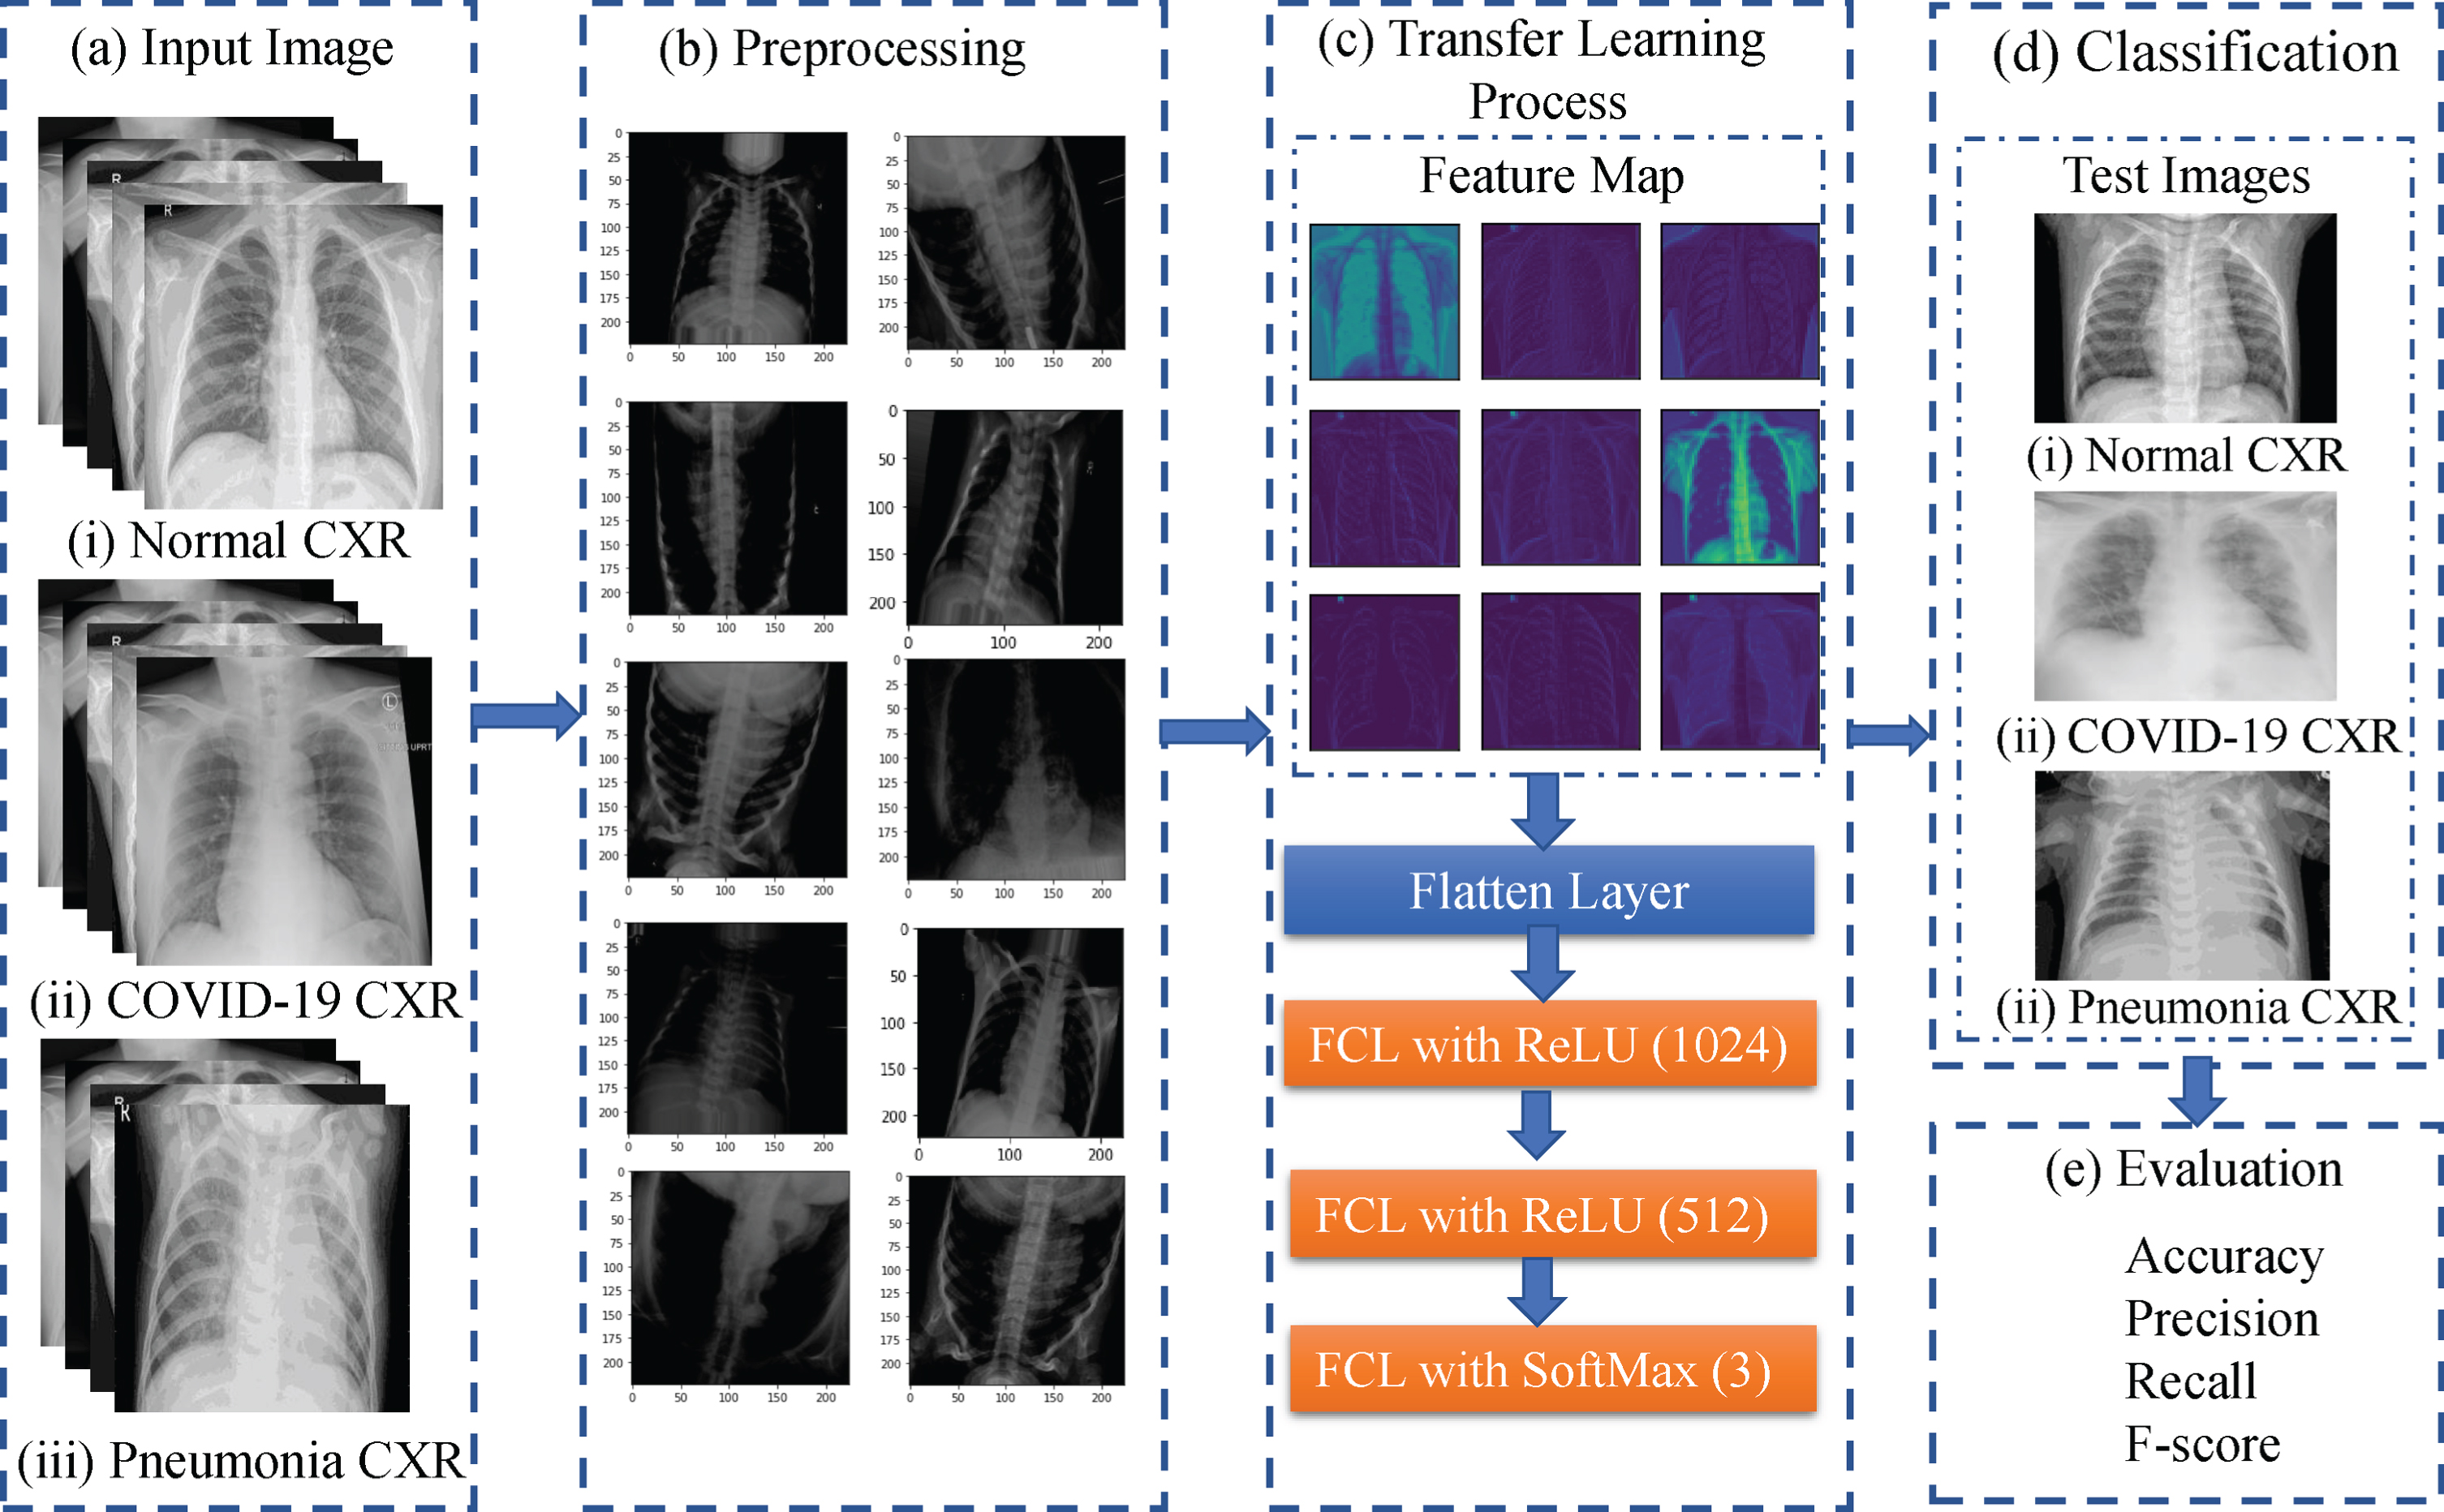
In this study, an automated CAD system is introduced based on deep convolutional neural networks to recognize COVID-19 CXR images from normal and pneumonia cases. Moreover, we have adopted a deep transfer learning technique to overcome the insufficient data and training time that is pre-trained on the ImageNet dataset. We have utilized 15 different state of the art pre-trained CNN models and compare their results to find a suitable model for this task. The workflow diagram of the proposed method is presented in Fig. 1. Here, the CXR images are first acquired from publicly accessed databases and used as training samples. Then, in the preprocessing step, images are augmented to enhance the classification performance and resized since the acquired images appeared with various sizes. Later, the transfer learning technique is employed to extract features and do the classification. Finally, unseen test images are supplied to the network to evaluate the performance by calculating accuracy, precision, recall, and F1-score of the proposed method.
Fig.1
Wokflow of the proposed model for the identification of COVID-19 patients from healthy and pneumonia patients.
While there are many studies of COVID-19 identification using CXR transfer learning, the relative performance results are not apparent when different deep learning models are utilized. This paper focuses on CNN model performance comparisons (a total of 15 models) for CXR COVID-19 identification using transfer learning. The comparative study using 15 different deep learning models and evaluation structure is very important because such an investigation in the field of detecting COVID-19 cases using CXR images has been missing. Researchers have contributed to comparison studies in different research domains. For instance, a comparative study to differentiate ultrasonic breast masses is performed using five different transferred deep learning models [22], six different deep learning models are analyzed to identify plant diseases [23], deep transfer learning techniques are compared for object recognition from digital pathology images [24], a comparative study among deep CNN and edge detectors to detect a crack in concrete images [25], thee machine learning models are employed to compare the accuracy of medical images [26], feature learning methods are compared to recognize human activity [27] and so on. Therefore, we want to contribute to this domain. To the best of our knowledge, no paper, therefore, presents a rigorous comparison of the state of the art deep learning approaches similar to this paper.
The structure of this paper is as follows: Sec 2 illustrates the related work about COVID-19 in the medical domain, in the CAD field and transfer learning area. Sec 3 elaborates an overview of the dataset, state of the art deep learning models, and transfer learning process. Sec 4 explains experimental results and analysis, including the experimental setup and evaluation method. Sec 5 summarizes the paper and present prospective work.
2Literature review
An overview of the deep learning approaches for the analysis of COVID-19 CXR images is arranged in this section. Moreover, we have compiled this section in three aspects, specifically, relevant investigations about COVID-19 in the medical domain, related DL works in CAD of COVID-19 and related deep transfer learning works in CAD field. We have reviewed the proposed methodology, dataset, data preprocessing, evaluation method, and the result of each paper.
2.1Relevant investigations about COVID-19 in the medical domain
Fang et al. proposes a study to examine the sensitivity of chest CT image and viral nucleic acid detection technique using real-time polymerase chain reaction (RT-PCR) for the detection of COVID-19 cases [28]. Fifty-one subjects who had a travel or residency history in Wuhan within 14 days and had a fever or acute respiratory symptoms, with an average age of 45 years, are taken part of this study. Thirty-six patients diagnosed positive for COVID-19 in the 1st RT-PCR test. Twelve of them get positive results on the 2nd RT-PCR tests (1 to 2 days). Two patients get positive by 3rd RT-PCR tests (2-5 days) and one patient by four tests (7 days). However, 98% of the 51 patients shown evidence of viral pneumonia on the 1st day. Therefore, the finding of this study is that the sensitivity of chest CT is higher than RT-PCR (98% vs. 71%, respectively).
Bernheim et al. analyzed chest CTs of 121 symptomatic positive COVID-19 patients and finds the relationship of the outcome of chest CTs in time between symptom onset of the initial CT scan (i.e., early, 0 to 2 days (36 patients), intermediate 3 to 5 days (36 patients) and late 6 to 12 days (25 patients)) [29]. The observation of this investigation is that 28% of the early patients (10/36), 76% of intermediate patients (25/33), and 88% of late patients (22/25) show bilateral lung disease.
Tao et al. examines 1014 patients in Wuhan from 6th January to 6th February and observes that chest CT is more sensitive for the diagnosis of COVID-19 over RT-PCR [11]. Out of 1014 patients, 601 patients test positive in RT-PCR, while 888 of them tests positive in chest CT. They also analyze that the mean interval time is 5.1 ± 1.5 days from initial negative to positive and 6.9 ± 2.3 days from positive to negative in RT-PCR.
In order to find the role of chest CT and CXR in the management of COVID-19, Rubin et al. in [30] comprise a multidisciplinary panel of radiologists and pulmonologists from 10 different countries with experience of managing COVID-19 patients. Fourteen key questions and corresponds to 11 decision points are presented on three aspects, such as varying risk factors, community condition, and resource constraints. The results are analyzed and found that there are five primary and three additional recommendations for the medical practitioners to use of CXR and CT in the management of COVID-19.
2.2Related DL works in CAD of COVID-19
Farooq et al. recommend a deep learning-based approach, namely COVID-ResNet, to differentiate COVID-19 cases form other types of pneumonia cases in [31]. The author also builds an open-access dataset for CXR image research. A pre-trained ResNet is used, which is followed by three steps of fine-tunes work. In the three fine-tuned steps, input images are resized continuously form 128 × 128 × 3, 224 × 224 × 3 to 229 × 229 × 3. Among 6009 images they utilize in the proposed algorithm, 68 of them are COVID-19 cases. They obtained an overall accuracy of 96.23% for four-class classification.
In [32], Afshar et al. suggests a binary classification of the CXR images based on the Capsule Network framework known as COVID-CAPS to identify COVID-19 cases. 90% of the total dataset is employed for training, and 10% is for validation. The advanced framework reaches an accuracy of 95.7%, and the pre-trained framework achieves an accuracy of 98.3%.
Wang et al. introduce COVID-Net [33], which is a deep CNN based approach to detect COVID-19 cases form CXR images. The network is trained on publicly available 13,800 CXR images. Among them, 183 are COVID cases. The model achieves an overall accuracy of 92.6% in a three-class classification.
A new deep learning-based framework, namely COVIDX-Net, is suggested by Hemdan et al. [34] to diagnose COVID-19 from CXR images automatically. The network is composed of VGG19, DenseNet121, ResNetV2, InceptionV3, InceptionResNetV2, Xception and MobileNetV2. A total of 50 CXR images is considered for testing the representation of the proposed algorithm; among them, 25 are positive COVID-19 images. 80% of the images are used for training, and rests are used for testing. All images are resized to 224 × 224 pixels. VGG19 and DenseNet201 achieve an accuracy of 90%.
Shety et al. [35] suggests a deep learning-based framework for the detection of COVID-19 from CXR images. The proposed methodology utilizes different CNN models to extract features and fed into SVM for classification. Twenty-five normal and 25 COVID-19 images are used to evaluate the performance. 60%, 20%, and 20% of images are used for training, validation, and testing the model. ResNet50 achieves the highest classification accuracy of 95.38%.
Maghdid et al. proposes an AI tools that can help radiologists to diagnose COVID-19 cases from X-rays and CT scan images quickly [36]. Modified pre-trained AlexNet is used as the backbone of the network. 170 CXR and 361 CT images are utilized in this model. 50% of the overall dataset is granted for training, and 50% is for validation. Modified CNN achieves an accuracy of 94.1%, and a pre-trained network obtains 98% accuracy in binary classification.
Apostolopoulos et al. [37], employ state of the art CNN model called MobileNet from 3905 X-Ray images, correspond to six different classes. Moreover, 455 COVID-19 CXR images are also incorporated. The images are resized to 200 × 200 pixels, and the augmentation task is performed in the preprocessing step. They achieved an accuracy of 99.18% in binary classification tasks and 87.66% for the seven class classification tasks.
Loey et al. suggests Generative Adversarial Network (GAN) with deep transfer learning for the detection of COVID-19 from CXR images in [38]. Since there is a shortage of COVID-19 CXR images; therefore, to generate more images, they employ GAN. A total number of 307 images are collected in four different classes, such as COVID-19, normal, bacterial pneumonia, and viral pneumonia. In the training and validation step with GAN, 90% of the dataset is utilized, while 10% is kept for testing. Pretrained AlexNet, GoogleNet, and Resnet18 are used as transfer learning. In the proposed model they achieved an accuracy of 80.6%, 85.3% and 100% on four class (GoogleNet), three class (AlexNet) and two class (GoogleNet) classification problem respectively.
As discussed above, promising COVID-19 identification results have been obtained using CXR with transfer learning and various deep learning models, mostly CNN, have been utilized. However, the relative performance results of various CNN transfer learning are unclear. This paper focuses on the performance comparison of CNN models (15 total) for CXR COVID-19 identification using transfer learning.
2.3Related deep transfer learning works in CAD fields
Zhang et al. proposes a deep transfer learning-based classification approach for the classification of the cervical cell into normal and abnormal [39]. One private dataset called HEMLBC and publicly available Herlev dataset are considered to evaluate the performance of the proposed method. In the preprocessing work, they perform the patch extraction and image augmentation operations. They achieve an accuracy of 98.3% and 98.6% on the Herlev and HEMLBC dataset individually.
Chen et al. introduces a deep transfer learning-based framework based on the Inception-V3 network for the classification of cervical immunohistochemistry images in [40]. The data augmentation task is performed in the preprocessing step. They obtain an average accuracy of 77.3%.
Song et al. carries out a transfer learning-based CNN that is pre-trained on the ImageNet dataset for the classification of breast histopathology images [41]. First, the images are represented in the Fisher Vector (FV) encoding of local features. Then, an adaptation layer is designed for fine-tuning. Finally, an overall accuracy of 87% obtained with 30% testing data.
Hall et al. [42] explore that chest X-ray images are beneficial for the diagnosis of COVID-19 viral infection. They utilize pre-trained ResNet50 and tuned on 102 COVID-19 cases and 102 other pneumonia cases and achieves an overall accuracy of 90.7%. Moreover, in another experiment, they combine pre-trained VGG16, ResNet50, and custom made CNN train and test on 33 unseen COVID-19 CXR and 208 pneumonia cases and obtained an overall accuracy of 94.4%.
In [43], Zhang et al. proposes a deep learning model to identify COVID-19 CXR images from standard CXR images. Pretrained ResNet is used as a backbone of the network. 50% of 100 COVID-19 and 1430 Normal CXR images are considered for training, and rest are regarded for testing. This algorithm can detect 96% of COVID-19 cases and 70.65% non-COVID-19 cases.
Abbas et al. suggests that their previously developed CNN, namely Decompose, Transfer and Compose network (DeTraC-Net), utilize pre-trained ResNet-50 as transfer learning to classify COVID-19 chest X-ray images from normal and severe acute respiratory syndrome cases [44]. 50 standard, 105 COVID-19, and 11 SARS CXR images are applied to evaluate the performance of their proposed method and achieve an accuracy of 95.12%.
Narin et al. [45] proposes a CNN based approach to detect coronavirus pneumonia among patients using CXR. Here, three pre-trained network models are utilized, namely, ResNet50, InceptionV3, and Inception-ResNetV2. 50 COVID-19 CXR and 50 normal CXR are used to check the performance of the proposed model. 80% of the dataset employed for training and 20% is for testing. They observed that ResNet50 gives the highest classification accuracy of 98% in binary classification, among other models.
3Materials and Methods
3.1Dataset
3.1.1Dataset organization
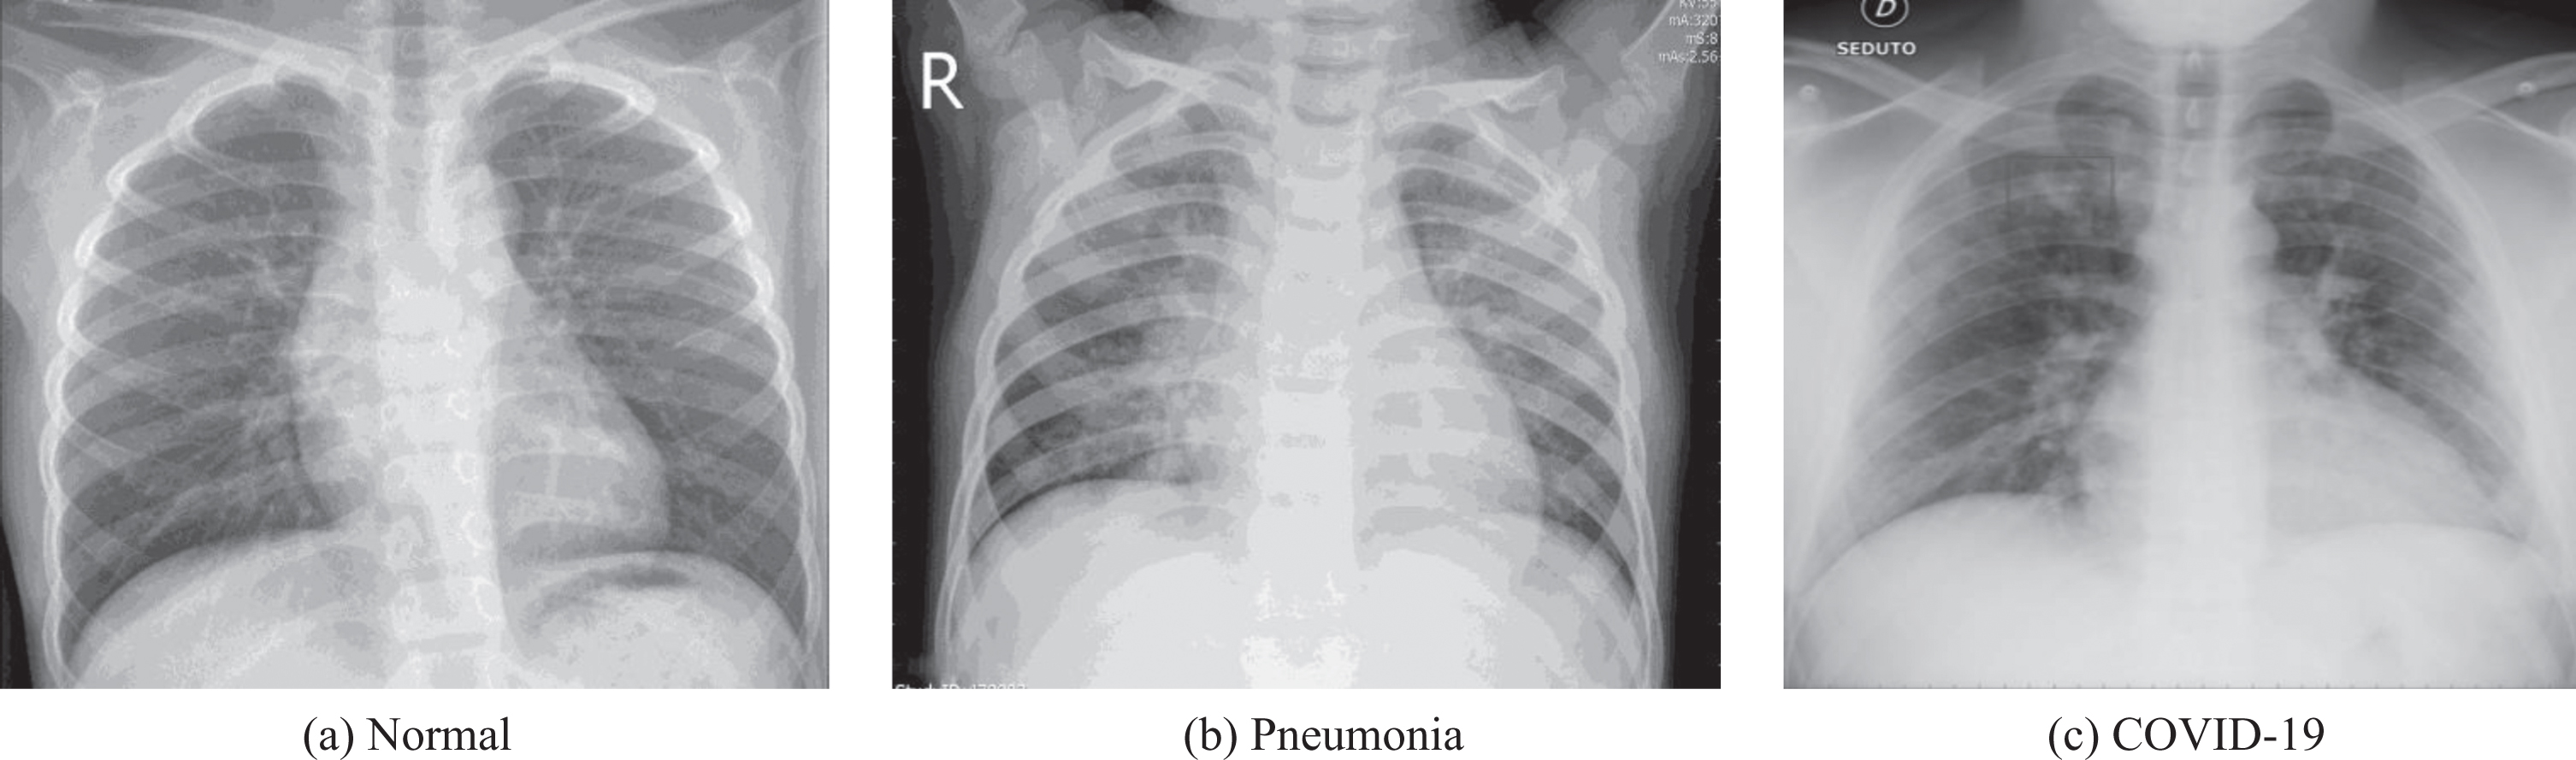
To test the effectiveness of our proposed method, we have utilized CXR images from COVID-19 patients, regular pneumonia patients, and healthy patients. We have collected the images from two publicly available databases. Dr. Joseph Cohan created a publicly accessible CXR and CT image database in the GitHub repository for positive COVID-19 patients, which also includes severe acute respiratory syndrome (SARS), Middle East respiratory syndrome (MARS) and acute respiratory distress syndrome (ARDS) [46]. This repository also incorporated publicly available medical image repositories, such as the Radiological Society of North America (RSNA), and the Italian Society of Medical and Interventional Radiology (SIRM). The database is regularly updating with new cases. For the benefit of our experiment, we have only considered the CXR images. Moreover, the healthy and pneumonia CXR images are collected from the Kaggle repository called “Chest X-Ray Images (Pneumonia)” [47]. An example of the collected dataset is presented in Fig. 2
Fig.2
An example of Normal, Pneumonia, and COVID-19 CXR images.
3.1.2Data setting
COVID-19 image dataset contains around 340 CXR and CT images. Among those 340 samples, 260 frontal CXR images are found and considered for this experiment. The Kaggle chest X-ray dataset consists of 5863 copies in two categories. One is Normal, and another is Pneumonia. To construct a balanced dataset, we have randomly selected 300 Normal and 300 Pneumonia cases.1 The distribution of training, validation, and test datasets are presented in Table 1.
Table 1
The arrangements of training, validation, and test datasets
| Dataset / CLass | COVID-19 | Normal | Pneumonia | Total |
| Train | 180 | 200 | 200 | 580 |
| Validation | 40 | 50 | 50 | 140 |
| Test | 40 | 50 | 50 | 140 |
| Total | 260 | 300 | 300 | 860 |
3.1.3Data Preprocessing
The COVID CXR images in the GitHub repository are in JPEG format with various sizes ranging from 508 × 500 to 4248 × 3480 pixels. The Kaggle CXR images also vary in sizes. Therefore, for the experimental arrangement, we kept target size to 224 × 224 pixels. The Keras “preprocess_input” function transforms the input image according to the model requirement. Then, various data augmentation techniques are applied to the training samples to improve the model’s performance. The Keras “ImageDataGenerator” API is used for this purpose. In this experiment, we follow “in place” and “on the fly” data augmentation technique, where the images are randomly transformed and returned to the network during training time. Therefore, examples are not generated before training. The main benefit of this strategy is that the network views new images at every epoch, which increase the model generalizability.
In this process, first, we rescale the photos. Then, we set the rotation range to 20 degrees. After we set the width and height shift range to 10%, sheer scale to 10%. After that, we set the zoom range to 20%, and finally, we keep the horizontal and vertical flip true. We also combine the preprocess input of each pretrained model.
3.2State of the art deep learning models
In this subsection, we have provided a brief overview of the state of the art deep learning models that are used in this experiment and their significant points in a tabular form. Table 2 exhibits all-important attributes of a deep neural network, such as the number of parameters, total depth of the network (including activation layer, batch normalization and so on), top 5 accuracies on ImageNet dataset, and significant remarks.
Table 2
An overview of deep learning models (Here, Network depth includes all the layers in a model, top-5 accuracy is on the ImageNet validation dataset)\label t2
| CNN Model | Ref. | Parameters | Network depth | Top-5 accuracy | Major remarks |
| VGG16 | [48] | 138M | 23 | 90% | a. ReLU activation function introduce after every convolutional layer. b. Capable of providing very good result on a specific task. c. Training from scratch takes very long time. |
| VGG19 | 143M | 26 | 90% | ||
| ResNet50 | [49] | 25.6M | 50 | 92.1% | a. Introduced skip connections. b. Residual layer can be increased to hundreds or thousands of layers. |
| ResNet101 | 44.7M | 101 | 92.8% | ||
| ResNet152 | 60.4M | 152 | 93.1% | ||
| ResNet50V2 | [50] | 25.6M | 50 | 93% | a. ResNetV2 has a different arrangement in the residual block. b. Batch normalization and ReLU activation function is placed before the convolutional layer. |
| ResNet101V2 | 44.7M | 101 | 93.8% | ||
| ResNet152V2 | 60.7M | 152 | 94.2% | ||
| InceptionV3 | [51] | 23.8M | 159 | 93.7% | a. Incorporate RMSProp optimizer. b. Factorized 7 × 7 convolutions. |
| InceptionResNetV2 | [52] | 55.87M | 572 | 95.3% | a. The residual connection is introduced that added output of convolution operation to the inception module input. b. This model is capable of producing higher accuracies at a lower epoch. |
| Xception | [53] | 22.9M | 126 | 94.5% | a. It is an expansion of inception design. b. It follows inception modules with depth wise separable convolution. |
| MobileNet | [54] | 4.25M | 88 | 89.5% | a. The standard convolution layer is substituted by depth wise separable convolution. b. The model size is small and less complicated. |
| DenseNet121 | [55] | 8M | 121 | 92.3% | a. It reduces the vanishing gradient problem. |
| DenseNet169 | 14.31M | 169 | 93.2% | b. Achieve one of the highest accuracy on the CIFAR dataset. | |
| DenseNet201 | 20.2M | 201 | 93.6% |
3.3Transfer Learning
Nowadays, a prevalent deep learning method in a computer vision system is transfer learning (TL). TL helps us to build an accurate model without starting the learning process from scratch instead start from patterns that have been learned on solving different problem [56, 57]. Therefore, it saves time and shows excellent results on a small dataset. The transfer learning process can be comprised of two steps. Selecting a pre-trained DL model is the first step of transfer learning. There is a wide range of pre-trained models available in the literature that is trained on a large scale of benchmark dataset to solve a similar problem that we intend to solve. For example, in Keras lot of pre-trained models are available such as VGG, Inception, ResNet. So we only need to choose the suitable one for our task. After that, we need to fine-tune the model based on the size of our dataset and the similarity of our dataset with the pre-trained model. For instance, it is necessary to train the entire model, if we have a large dataset but different from the pre-trained model dataset. Nevertheless, we need to train a few layers and freeze the other layers if we have a small dataset that is different from the pre-trained model dataset.
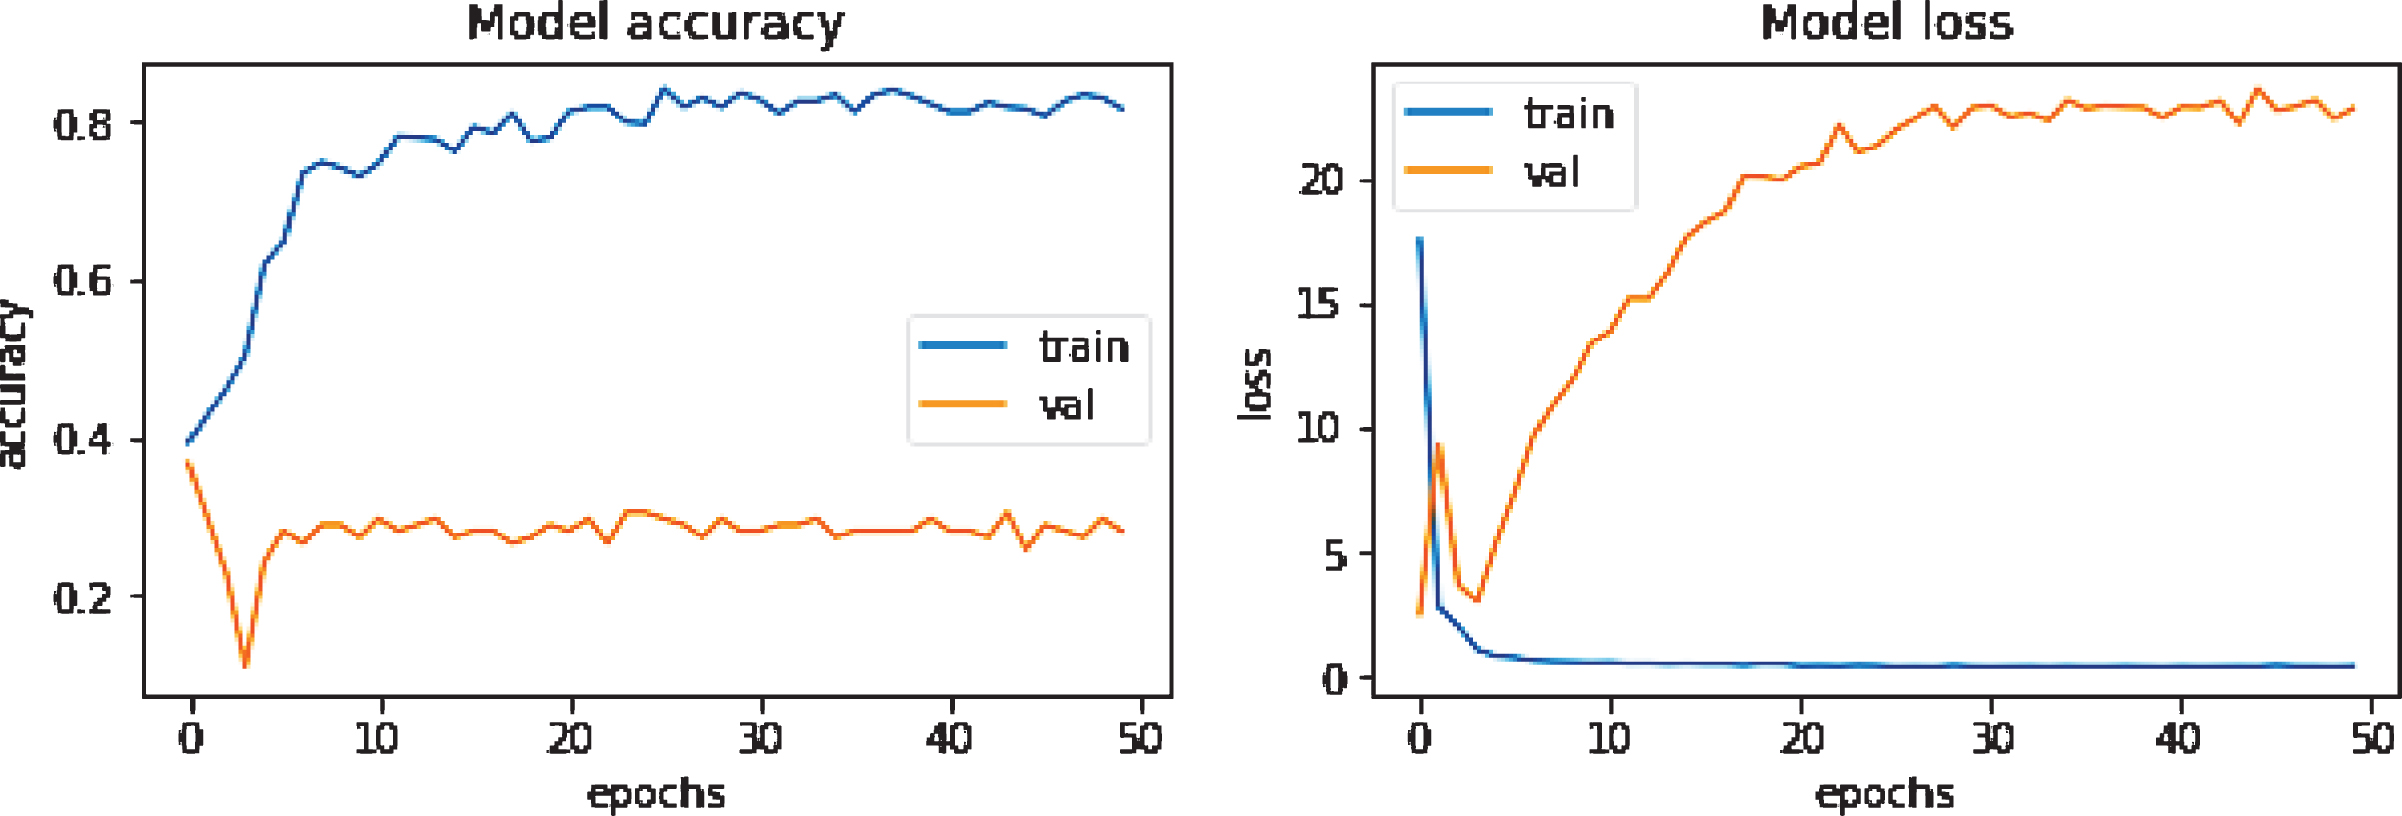
Overfitting is a prevalent issue in machine learning models. It appears when a model memorizes the training dataset without learning important features, trends, or boundaries. Then it can not perform well on unseen data. The clear sign of a machine learning overfitting is if the error on the validation set is much higher than the error on the training set. Alternatively, if the model’s accuracy is very high concerning the training data and drops significantly with new data, it is suspected to have an overfitting problem. Figure 3 illustrates an overfitting problem during training when no data augmentation is performed. There are several techniques to reduce the overfitting problem. First of all, increasing the number of training datasets can help to overcome this problem. Secondly, data augmentation, like rotating the image, zooming in or out, horizontal or vertical flip operations, is beneficial in this regard. Thirdly, dropout, L1, and L2 regularization are also some popular options. Finally, a simple model structure consisting of fewer layers and neurons can reduce the overfitting problem.
Fig.3
An example of an overfitted accuracy/loss curve while training DenseNet201 without data augmentation.
In this study, we have applied VGG series, Xception, ResNetV1 and ResNetV2 series, Inception series, DenseNet series, and MobileNet networks in the transfer learning process, where the weights are pre-trained on ImageNet dataset. In the transfer learning section in Fig. 1-(c), we first import the pre-trained model from Keras, where we freeze the convolutional base and fine-tune the top layers. The convolutional base usually extracts the features. After the convolutional base, we place the flatten layer, which transforms the two-dimensional feature matrix into a vector. After the flatten operation, the fully connected layer (FCL) with the ReLU activation function is used, and the number of neurons is fixed to 1024, 512, respectively. Finally, we fed the output to the softmax activation layer for the final classification. For all these networks, the input size is (224 × 224 × 3), initial learning rate 0.001, the batch size is 32, the number of epochs is 50, and the ’rmsprop’ optimizer is employed. We have adopted "ReduceLROnPlateau" as a Keras callback function to reduce the learning rate when the result stops improving. The learning rate will gradually reduce by a factor of 0.3. This function also helps the network to reduce the overfitting problem. Fig. 1-(c) shows some representative feature maps extracted from the 1st convolution layer of the VGG network. It demonstrates that the TL technique is capable of extracting some necessary information from the images.
4Experiments and Analysis
4.1Experimental Setup
Google Colaboratory (also known as Colab) is a free cloud service based on Jupyter Notebooks for machine learning education and research [58, 59]. In Jupyter Notebook, python 2 and 3 are preconfigured with essential machine learning libraries, such as Tensorflow, Matplotlib, and Keras, that require no installation on a local machine to start. The runtime is fully functional for deep learning applications with GPU support using NVIDIA Tesla K80. Moreover, the code is stored in Google drive. In this experiment, we have used Google Colab Notebooks for training and testing our model.
4.2Evaluation Method
To select a suitable evaluation metric is essential to overcome the bias among the differentiation of algorithms. For the classification standard, precision, recall, F1 score, and accuracy are the most prevalent measures [60, 61]. Precision is the number of correctly identified samples among all the identified samples. The recall is the number of correctly identified samples from all the positive representations. F1 score is the harmonic average of precision and recall. Accuracy is the proportion of correctly classified samples from the total number of samples [62]. Table 3 exhibits the mathematical expression for precision, recall, F1 score, and accuracy. In Table 3, the number of accurately labeled positive samples is TP (True Positive), the correctly detected negative sample is TN (True Negative), the number of negative examples classified as positive is FP (False positive), and the number of positive specimens predicted as unfavorable is FN (False Negative). For multiclass classification finding the values of TP, TN, FP, FN is a bit different than the binary classification problem since there are no positive or negative classes. In a confusion matrix(assuming x axis is the predicted class label and y axis is the true label), the total number of TP for a class is when the predicted class match with the target class. FN for a class is the sum of the values in a corresponding row, excluding the TP value. For a class, FP is the sum of the values in a corresponding column, excluding the TP value. TN for a particular class will be the sum of all columns and rows, excluding that class’s column and row.
Table 3
Evaluation Metrics
| Assessments | Formula | Assessments | Formula |
| Precision, P |
| Recall, R |
|
| F1 score |
| Accuracy |
|
4.3Experimental Results and Analysis
To evaluate the performance of the recommended method, we have calculated the precision, recall, F1 score, and accuracy of each model.
Table 4
Performance analyses for different TL methods
| Precision | Recall | F1 score | Testing Accuracy (%) | ||
| VGG16 | COVID | 0.923 | 0.900 | 0.911 | 88.57 |
| Normal | 0.855 | 0.940 | 0.895 | ||
| Pneumonia | 0.891 | 0.820 | 0.854 | ||
| VGG19 | COVID | 0.950 | 0.950 | 0.950 | 89.3 |
| Normal | 0.800 | 0.960 | 0.873 | ||
| Pneumonia | 0.975 | 0.780 | 0.866 | ||
| ResNet50 | COVID | 0.654 | 0.850 | 0.739 | 64.3 |
| Normal | 0.673 | 0.660 | 0.666 | ||
| Pneumonia | 0.590 | 0.460 | 0.517 | ||
| ResNet50V2 | COVID | 0.846 | 0.825 | 0.835 | 72.85 |
| Normal | 0.650 | 0.780 | 0.709 | ||
| Pneumonia | 0.732 | 0.600 | 0.659 | ||
| ResNet101 | COVID | 0.682 | 0.750 | 0.714 | 65.0 |
| Normal | 0.702 | 0.660 | 0.680 | ||
| Pneumonia | 0.571 | 0.560 | 0.565 | ||
| ResNet101V2 | COVID | 0.837 | 0.900 | 0.867 | 84.28 |
| Normal | 0.800 | 0.880 | 0.838 | ||
| Pneumonia | 0.905 | 0.760 | 0.826 | ||
| ResNet152 | COVID | 0.733 | 0.550 | 0.628 | 62.85 |
| Normal | 0.654 | 0.680 | 0.666 | ||
| Pneumonia | 0.552 | 0.640 | 0.593 | ||
| ResNet152V2 | COVID | 0.875 | 0.875 | 0.875 | 77.14 |
| Normal | 0.662 | 0.900 | 0.762 | ||
| Pneumonia | 0.875 | 0.560 | 0.683 | ||
| DenseNet121 | COVID | 0.680 | 0.850 | 0.756 | 71.43 |
| Normal | 0.735 | 0.720 | 0.727 | ||
| Pneumonia | 0.732 | 0.600 | 0.659 | ||
| DenseNet169 | COVID | 0.707 | 0.725 | 0.716 | 71.42 |
| Normal | 0.689 | 0.840 | 0.757 | ||
| Pneumonia | 0.763 | 0.580 | 0.659 | ||
| DenseNet201 | COVID | 0.805 | 0.825 | 0.814 | 75.71 |
| Normal | 0.714 | 0.800 | 0.755 | ||
| Pneumonia | 0.767 | 0.660 | 0.709 | ||
| MobileNetV1 | COVID | 0.733 | 0.825 | 0.776 | 61.43 |
| Normal | 0.541 | 0.800 | 0.645 | ||
| Pneumonia | 0.619 | 0.260 | 0.366 | ||
| XeptionNet | COVID | 0.735 | 0.625 | 0.675 | 71.43 |
| Normal | 0.733 | 0.880 | 0.799 | ||
| Pneumonia | 0.674 | 0.620 | 0.646 | ||
| InceptionV3 | COVID | 0.745 | 0.875 | 0.805 | 82.14 |
| Normal | 0.833 | 0.800 | 0.816 | ||
| Pneumonia | 0.889 | 0.800 | 0.842 | ||
| InceptionResNetV2 | COVID | 0.652 | 0.375 | 0.476 | 62.14 |
| Normal | 0.691 | 0.760 | 0.724 | ||
| Pneumonia | 0.548 | 0.680 | 0.607 |
Table 4 illustrates the performance metrics of different deep TL models for the identification of COVID-19 cases from healthy and pneumonia cases on the testing dataset. The accuracy of testing data demonstrates the accuracy of any deep learning models.
It can be observed from Table 4 that the highest precision and recall value for distinguishing COVID-19 cases is 0.950, reached by VGG19, followed by VGG16 with a value of 0.923 and 0.900, respectively. The InceptionResNetV2 attains the lowest precision and recall value of 0.652 and 0.375, individually. To detect the normal cases, VGG16 and VGG19 obtain the most considerable precision and recall value of 0.855 and 0.960, sequentially. On the other hand, MobileNetV1 delivers the lowest precision rate of 0.541. Additionally, ResNet50 and ResNet101 produce the lowest recall value of 0.660. For identifying the pneumonia cases, VGG19 and VGG16 achieve the most considerable precision and recall value of 0.975 and 0.820, sequentially, whereas InceptionResNetV2 and MobileNetV1 show the least performance.
Among all the tested models, MobileNetV1, InceptionResNetV2, ResNet50, ResNet101 and ResNet152 provide the lowest classification accuracy of around 60%, while the VGG19 and VGG16 produce the highest accuracy of 89.3% and 88.57%, individually. ResNet101V2 and InceptionV3 also show considerable performance and contribute an accuracy of 84.28% and 82.14%, respectively. ResNetV2, ResNet152V2, DenseNet121, DenseNet169, DenseNet201 and XceptionNet also recorded reasonable accuracy of around 75%.
Figure 4 depicts the resulted confusion matrices on unseen test dataset to show the classification performance of each TL model more intuitively. As we observe from Table 4 that VGG19 and VGG16 attain the highest classification accuracy. Therefore, if we look at their confusion matrix, it is perceived that VGG19 can accurately recognize 38 images in COVID class, though two images are labeled as Normal class. Besides, In the normal image class, 48 images are identified precisely; but, one image is listed in each COVID and Pneumonia class. Lastly, in the Pneumonia class, 39 copies are distinguished correctly, yet 10 images are predicted as normal and one as COVID. In the VGG16 model, it is observed that 36 images are correctly categorized as normal but four images as pneumonia. The model also classifies 47 samples accurately, although two as COVID and one as pneumonia. Finally, 41 images are listed correctly as pneumonia; however, eight as normal and one as COVID. Furthermore, if we observe at the confusion matrix of the least performing algorithms such as MobileNetV1 and InceptionResNetV2, it is apparent that both of the networks are able to detect 33 and 15 copies in COVID class correctly, however, six and four copies as Normal, 1 and 21 samples as Pneumonia, respectively. Additionally, both models can classify 40 and 38 standard samples correctly, though 3 and 5 samples are detected as COVID, and seven samples of both models are identified as Pneumonia. Lastly, MobileNetV1 can identify only 13 images correctly as Pneumonia, yet 9 samples as COVID and 28 as Normal. InceptionResNetV2 can predict 34 samples correctly as Pneumonia, including 3 samples as COVID and 13 samples as Normal. Therefore, it is obvious to implement the VGG19 and VGG16 models for the identification of the patient’s health status using chest x-ray images.
Fig.4
The resulted confusion matrix of different TL models. (a) is the confusion matrix of VGG16 generated on test dataset. Similarly, (b) is generated on VGG19, (c) is on ResNet50, (d) is on ResNet50V2, (e) is on ResNet101, (f) is on ResNet101V2, (g) is on ResNet152, (h) is on ResNet152V2 (i) is on DenseNet121, (j) is on DenseNet169, (k) is on DenseNet201, (l) is on MobileNetV1, (m) is on XceptionNet, (n) is on InceptionV3, (o) is on InceptionResNetV2.
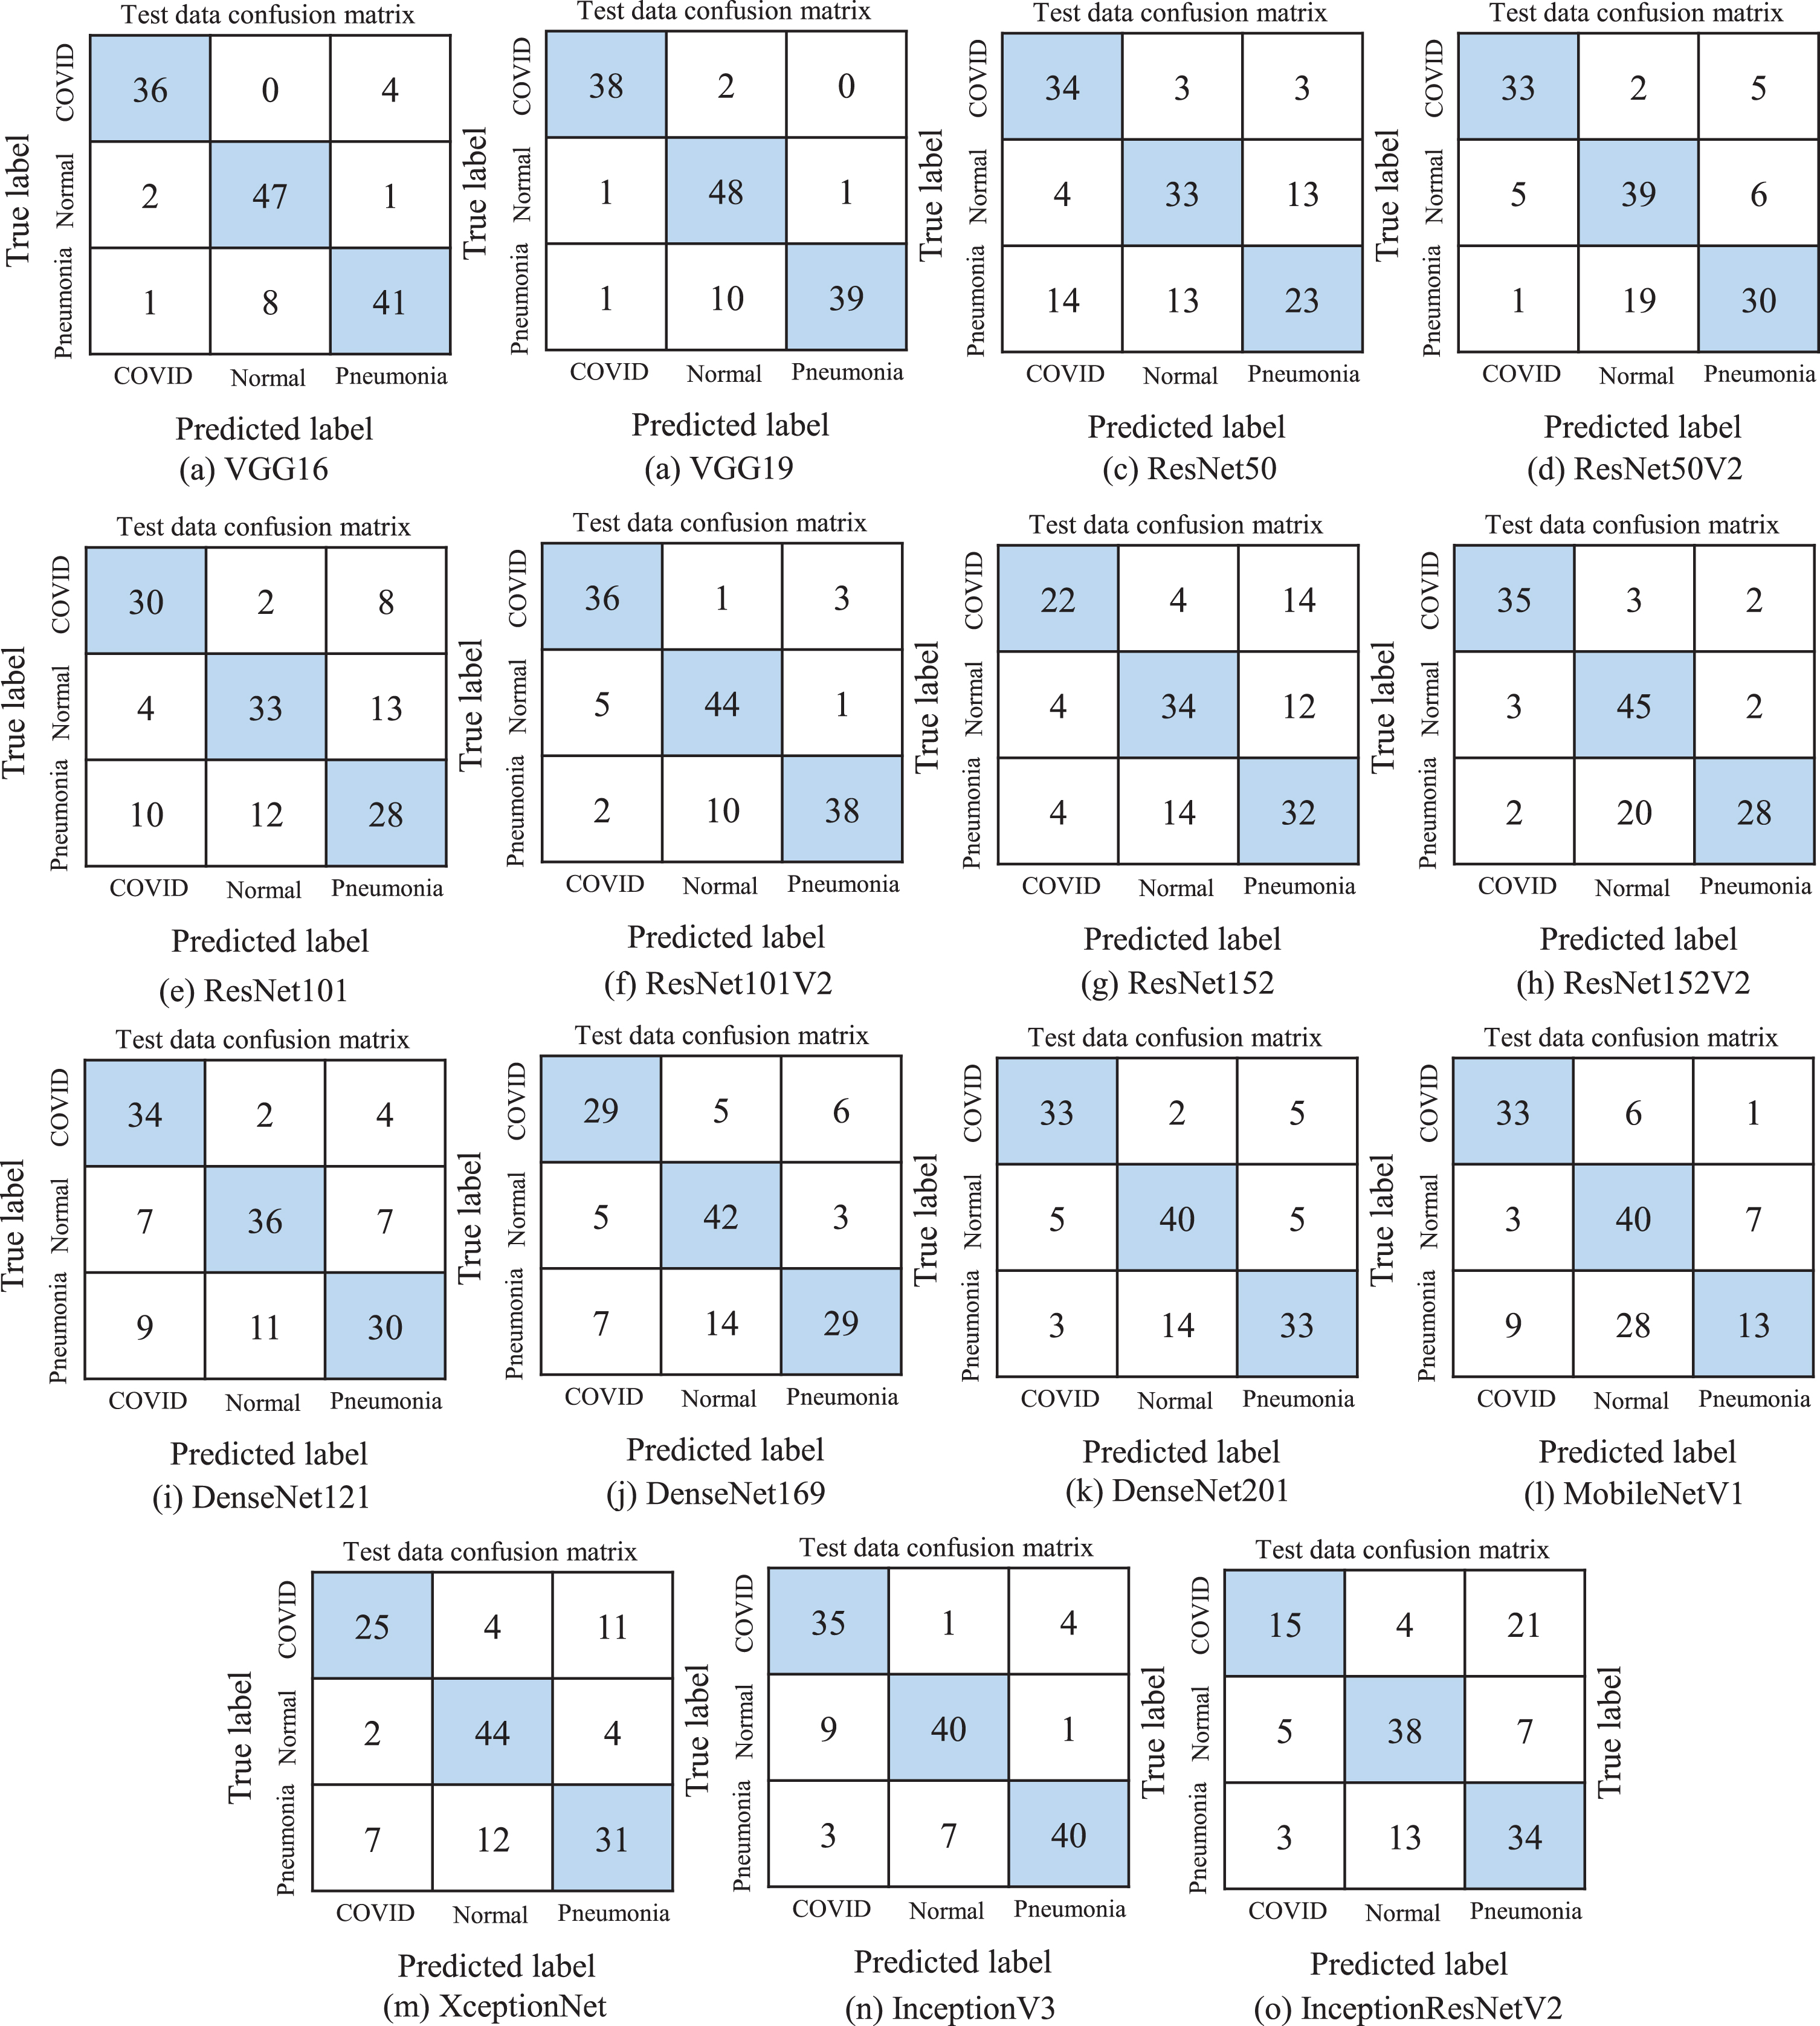
Fig.5
Accuracy and loss curves of selected TL models. Here, (a) exhibits the training and validation accuracy and loss curves of VGG16 model. Similarly, (b) presents the accuracy and loss curves of VGG19 model, (c) is generated on ResNet101V2, (d) is on DenseNet121, (e) is on MobileNetV1, (f) is on XceptionNet, (g) is on InceptionResNetV2, (h) is on InceptionV3.
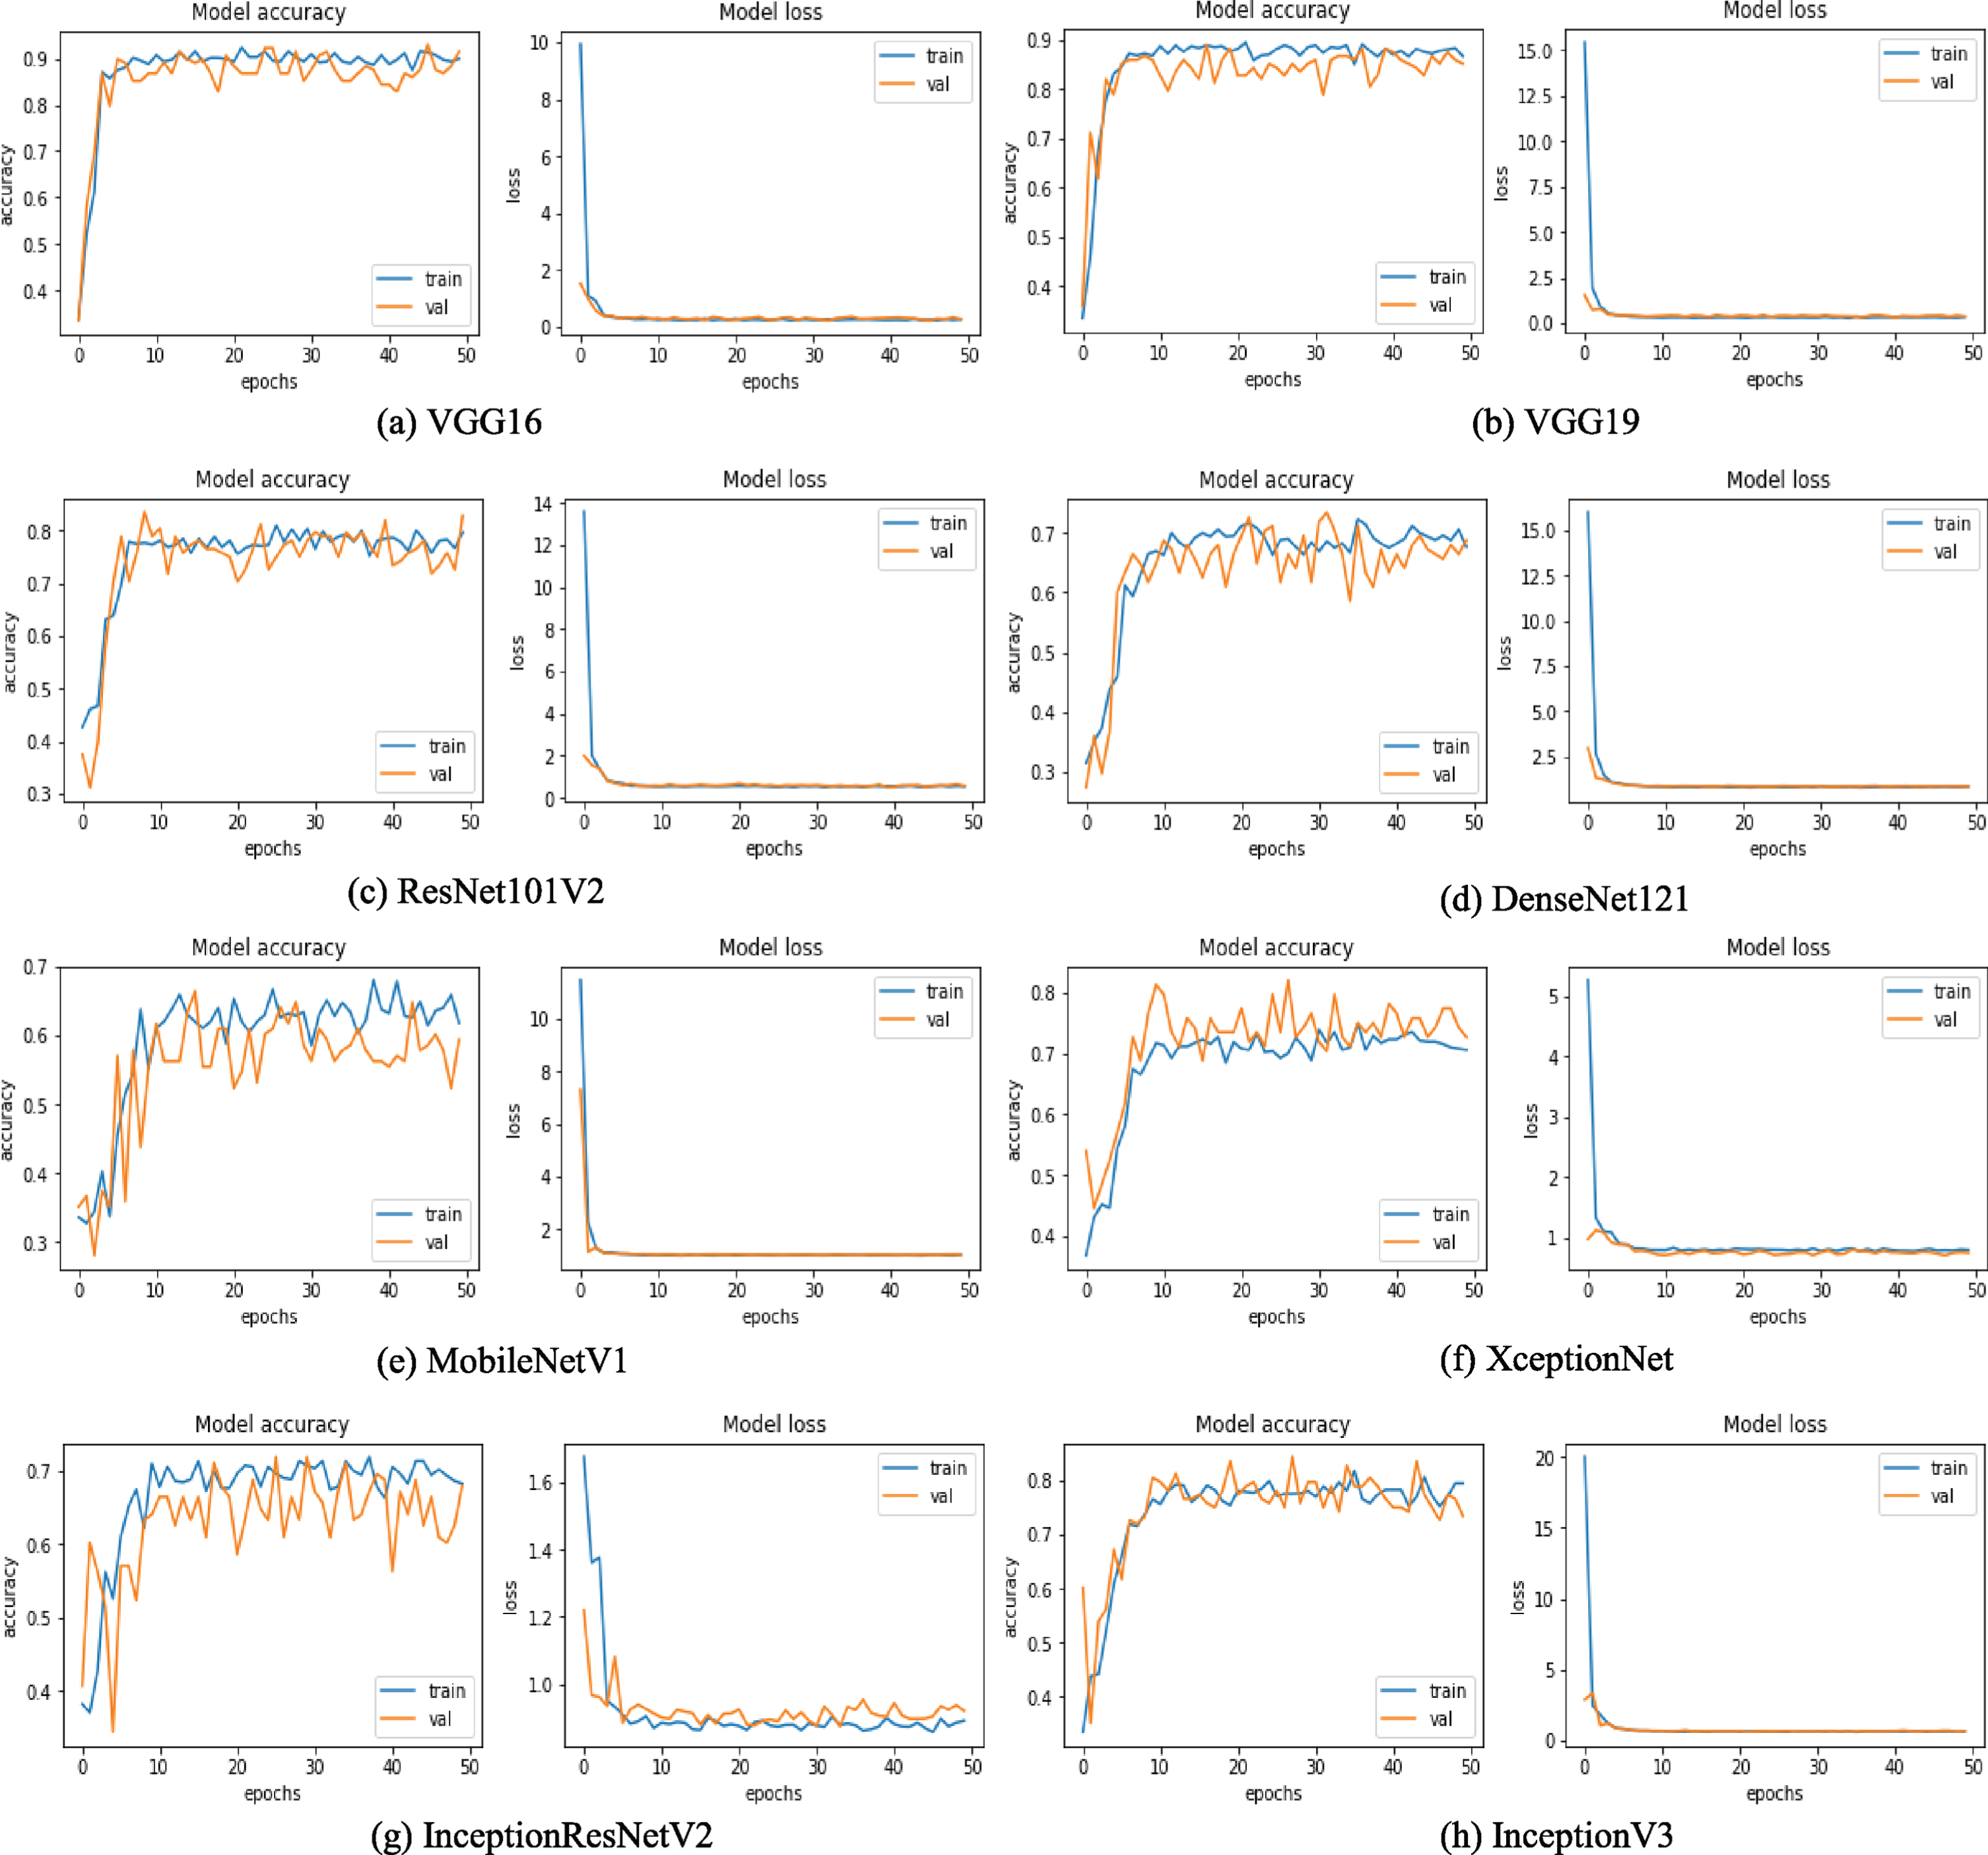
We have selected a few training and loss curves per CNN model series to provide a glimpse of how the networks perform concerning to epoch in Figure 5. It is perceived from the figure that the VGG series has the most stable curves and delivers the highest training and validation accuracy. If we study the accuracy and loss curves of VGG16 and VGG19, it is discerned that both of the operations develop a similar trend. The accuracy curves of train data for both the network is increasing quickly to around 82% form epoch 0 to 10 and converges to a value of over 88% after epoch 50. Similarly, the accuracy curve of validation data reaches to around 88%. For the loss curve of training and validation data, the loss swiftly decreases to approximately 1% within the first five epochs and stays stable until 50 periods. However, if we observe the training and loss curves of the worst accomplishing networks such as MobileNetv1 and InceptionResnetV2, it is regarded that the training and validation accuracy is fluctuating considerably and produce training accuracy of about 61% and 68%, respectively, after 50 epochs. Moreover, it is discerned that there is no significant gap between the training and validation curve. Hence we can not say the model is overfitting or underfitting indeed at some epoch the model converges, where both training and validation accuracies are almost equal. In this experiment, we employ the data augmentation technique on the training set, making the training set challenging to predict and make validation set easy to predict. Therefore, at some point, the validation accuracy is slightly higher. It is also recognized that for XceptionNet, the validation accuracy is slightly higher than the training accuracy is because the Xception model holds dropout configuration, where the training accuracy states with the dropout, but validation accuracy is without dropout.
4.4Computational Time
As we have already mentioned, in this experiment, Google Colaboratory is utilized, which provides the Tesla K80 GPU platform. It is observed from Table 5 that the VGG series has average training time of around 24 seconds per epoch. ResNet50 series demands approximately 27 seconds per period for training, while ResNet101, ResNet101V2, ResNet152V2 needs about 33 seconds per epoch. MobileNet, DenseNet series, and XceptionNet have an average training time roughly 29 seconds per epoch. InceptionV3 and InceptionResNetV2 have an average training time of almost 29 seconds per epoch. ResNet152 takes the longest time to train per epoch, which is around 39s. Though the networks demand quiet time for training, the testing time is less, which is around 5 seconds.
Table 5
Training time per epoch of individual deep TL models
| Classifier | Training time (per epoch) | Classifier | Training time (per epoch) |
| VGG16 | 26s | DenseNet121 | 22s |
| VGG19 | 23s | DenseNet169 | 31s |
| ResNet50 | 27s | DenseNet201 | 32s |
| ResNet50V2 | 27s | MobileNetV1 | 25s |
| ResNet101 | 34s | XceptionNet | 27s |
| ResNet101V2 | 32s | InceptionResNetV2 | 30s |
| ResNet152 | 39s | InceptionV2 | 28s |
| ResNet152V2 | 33s |
4.5Discussion
Recently, Deep learning technique in the field of machine learning has been fascinating researchers significantly. The improvement of its utilization presents an opportunity to analyze medical images and solve critical tasks. Identification and classification of COVID-19 cases from Normal and Pneumonia cases using CXR images can help to isolate the infectious subjects, which is a significant step to fight against the virus. In this study we have trained and tested 15 different deep CNN models in a transfer learning process and their comparative evaluation is presented.
There are some essential factors for an individual model that influence their performance, such as imaging modality, image content, image quantity, distribution of the dataset, the structure of the model, model complexity, loss function, optimizer, number of epochs and so on. The accuracy records in Table 4 illustrate that VGG nets perform relatively well compared to ResNets, InceptionNets, DenseNets, MobileNet, and XceptionNet. Therefore, it is evident that a shallow network performs well than very deep networks in this type of image dataset. It also observed that the number of network parameters for VGGNets is considerably higher than other networks (Table 2). There are few observations on that. If we analyze the architecture of VGG, it is observed that the network architecture is very simple and straightforward. VGG uses a very small receptive field (3 filters), followed by the ReLU activation function. Small filters help to have more weight layers, which helps to improve performance.
If we perceive the ResNets behavior from Table 4, the performance of the ResNetV1 decreases from 64.3% to 62.85% as the network depth increases. As we know, with the progress of network depth, the vanishing gradients and degradation problem become prominent. On the other hand, ResNetV2 provides a better result compare to ResNetV1. The optimal accuracy of 84.28% is achieved by ResNet101V2, whereas ResNet152V2 achieves 77.14% accuracy. So it is remarked that network depth can improve the performance but at a certain label. The improved version of ResNet implies Batch normalization and ReLU activation before the convolution operation, which can be the reason behind its improved performance.
In contrast, the DensNet series provide good performance with the increase of the network layer. It can be because DenseNet concatenates the output from the previous layers, whereas ResNet does the additive operation among the previous layer with the future layer. It is also recognized that the lower version of the Inception network (InceptionV3) performs better on our dataset, compared to InceptionResNetV2. ResNet and InceptionNet demonstrate that extremely deep networks are not suitable for our dataset. Table 5 displays that VGGNets are computationally less expensive than other types of networks. Therefore it is easier to train.
5Conclusion and Future Work
The COVID-19 coronavirus infection is threatening the life of billions of people because of its extremely contagious nature. According to WHO, the number of infected people and deaths are increasing rapidly. This viral infection inflames the lungs of the infected people. Therefore, one of the possible approaches to recognize those inflames by chest x-ray. In this study, we have presented an automated CAD technique to detect COVID-19 cases from pneumonia and healthy cases using chest x-ray images. We have utilized 15 different deep transfer learning models and the performance is evaluated using different performance metrics. The obtained results confirm that the VGG series are the most suitable models in this task.
Though CNN achieves leading results in medical image analysis tasks, there is still scope for development. First of all, researchers can develop a “partly new” CNN model for the analysis of COVID-19 chest X-ray images by selecting the top CNN models and find their separate advantages and merge their “best parts” together to enhance the finial classification performance. Secondly, there is a scarcity of publicly accessible COVID-19 CXR image datasets. Therefore to develop a publicly accessible database would be beneficial for future researchers. In the prospect, we intend to develop a more efficient CNN structure to identify COVID-19 cases from CXR images. Thirdly, to select the top CNN models and combine them with classical image features will be easier to link “machine learnt knowledge” and “human knowledge” together to obtain an even better classification performance. Fourthly, though texture feature is a low-level feature, it is useful at explaining the image content very adequately (such as in the field of fracture detection techniques in bone X-ray images [63]). Therefore, a combination of some texture descriptors such as content descriptor [64] (local binary patterns, edge detection histogram), local density features [65] with deep learning features can lead to a superior performance of the model. Fifthly, Noise is one key factor in digital radiography that is responsible for degrading the model performance. Consequently, in the preprocessing step, generative adversarial network (GAN) [66, 67], non-local mean filter [68], fuzzy genetic filter [69], robust navigation filter [70] based x-ray image denoising method can bring a significant improvement of the model performance. Finally, an application of “feature fusion” (or “ensemble learning”) technique to the best performing CNN models can enhance the final classification performance [71]. Here, it will be easier for the practical development of a software.
Acknowledgments
This work was supported in part by the “National Natural Science Foundation of China” (No. 61806047), the “Fundamental Research Funds for the Central Universities” (No. N2019003, N2024005-2, N2019005), and the “China Scholarship Council” (No. 2018GBJ001757, 2017GXZ026396). We also thank Prof. Dr. Wei Qian, Miss Zixian Li and Mr. Guoxian Li for their important discussion.
Notes
References
[1] | Novel Coronavirus – China, World Health Organization, ((2020) ). https://www.who.int/csr/don/12-january-2020-novel-coronavirus-china/en/. |
[2] | Statement on the second meeting of the International Health Regulations Emergency Committee regarding the out of novel coronavirus -nCoV), World Health Organization, ((2019) ). https://www.who.int/news-room/detail/30-01-2020-statement-on-the-second-meeting-of-the-international-health-regulations-(2005)-emergency-committee-regarding-the-out-of-novel-coronavirus-(2019-ncov). |
[3] | WHO Director-General’s opening remarks at the media briefing on COVID-19 - 11 March World Health Organization, ((2020) ). https://www.who.int/dg/speeches/detail/who-director-general-s-opening-remarks-at-the-media-briefing-on-covid-19—11-march-2020. |
[4] | JHU, COVID-19 Dashboard by the Center for Systems Science and Engineering (CSSE) at Johns Hopkins University (JHU), ((2020) ). https://coronavirus.jhu.edu/map.html. |
[5] | Zhao S. , Lin Q. , Ran J. , Musa S.S. , Yang G. , Wang W. , Lou Y. , Gao D. , Yang L. , He D. , et al., Preliminary estimation of the basic reproduction number of novel coronavirus -nCoV) in China, from to: A data-driven analysis in the early phase of the out, International Journal of Infectious Diseases 92: ((2020) ), 214–217. |
[6] | Liu C. , Zhou Q. , Li Y. , Garner L.V. , Watkins S.P. , Carter L.J. , Smoot J. , Gregg A.C. , Daniels A.D. , Jervey S. , et al., Research and development on therapeutic agents and vaccines for COVID-19 and related human coronavirus diseases, ACS Publications, (2020) . |
[7] | Wang W. , Xu Y. , Gao R. , Lu R. , Han K. , Wu G. , Tan W. , Detection of SARS-CoV-2 in different types of clinical specimens, Jama, ((2020) ). |
[8] | Littrup P.J. , Freeman-Gibb L. , Andea A. , White M. , Amerikia K.C. , Bouwman D. , Harb T. , Sakr W. , Cryotherapy for breast fibroadenomas, Radiology 234: (1) ((2005) ), 63–72. |
[9] | Huang P. , Liu T. , Huang L. , Liu H. , Lei M. , Xu W. , Hu X. , Chen J. , Liu B. , Use of chest CT in combination with negative RT-PCR assay for the novel coronavirus but high clinical suspicion, Radiology 295: (1) ((2020) ), 22–23. |
[10] | Li Y. , Xia L. , Coronavirus disease (COVID-19): role of chest CT in diagnosis and management, American Journal of Roentgenology ((2020) ), 1–7. |
[11] | Ai T. , Yang Z. , Hou H. , Zhan C. , Chen C. , Lv W. , Tao Q. , Sun Z. , Xia L. , Correlation of chest CT and RT-PCR testing in coronavirus disease (COVID-19) in China: a report of cases, Radiology ((2020) ), 200642. |
[12] | Franks T.J. , Chong P.Y. , Chui P. , Galvin J.R. , Lourens R.M. , Reid A.H. , Selbs E. , Mcevoy C.P.L. , Hayden C.D.L. , Fukuoka J. , et al., Lung pathology of severe acute respiratory syndrome (SARS): a study of 8 autopsy cases from Singapore, Human Pathology 34: (8) ((2003) ), 743–748. |
[13] | Kaw G. , Tan D. , Leo Y. , Tsou I. , Wansaicheong G. , Chee T. , Chest radiographic findings of a case of severe acute respiratory syndrome (SARS) in Singapore, Singapore Medical Journal 44: (4) ((2003) ), 201–204. |
[14] | Tsou I.Y. , Loh L.E. , Kaw G.J. , Chan I. , Chee T.S. , Severe acute respiratory syndrome (SARS) in a paediatric cluster in Singapore, Pediatric Radiology 34: (1) ((2004) ), 43–46. |
[15] | Ahmed A.E. , Al-Jahdali H. , Alshukairi A.N. , Alaqeel M. , Siddiq S.S. , Alsaab H. , Sakr E.A. , Alyahya H.A. , Alandonisi M.M. , Subedar A.T. , et al., Early identification of pneumonia patients at increased risk of Middle East respiratory syndrome coronavirus infection in Saudi Arabia, International Journal of Infectious Diseases 70: ((2018) ), 51–56. |
[16] | Wang D. , Khosla A. , Gargeya R. , Irshad H. , Beck A.H. , Deep learning for identifying metastatic breast cancer, arXiv preprint arXiv:1606.05718 ((2016) ). |
[17] | Suk H.-I. , Shen D. , Deep learning-based feature representation for AD/MCI classification, in: International Conference on Medical Image Computing and Computer-Assisted Intervention, Springer ((2013) ), pp. 583–590. |
[18] | Liu S. , Liu S. , Cai W. , Pujol S. , Kikinis R. , Feng D. , Early diagnosis of Alzheimer’s disease with deep learning, in: 2014 IEEE 11th international symposium on biomedical imaging (ISBI), IEEE, ((2014) ), pp. 1015–1018. |
[19] | Cheng J.-Z. , Ni D. , Chou Y.-H. , Qin J. , Tiu C.-M. , Chang Y.-C. , Huang C.-S. , Shen D. , Chen C.-M. , Computer-aided diagnosis with deep learning architecture: applications to breast lesions in US images and pulmonary nodules in CT scans, Scientific Reports 6: (1) ((2016) ), 1–13. |
[20] | Chen J. , Chen J. , Ding H.-Y. , Pan Q.-S. , Hong W.-D. , Xu G. , Yu F.-Y. , Wang Y.-M. , Use of an artificial neural network to construct a model of predicting deep fungal infection in lung cancer patients, Asian Pac J Cancer Prev 16: (12) ((2015) ), 5095–5099. |
[21] | Rahaman M.M. , Li C. , Wu X. , Yao Y. , Hu Z. , Jiang T. , Li X. and Qi S. , A Survey for Cervical Cytopathology Image Analysis Using Deep Learning, IEEE Access ((2020) ). |
[22] | Xiao T. , Liu L. , Li W. , Qin K. , Yu S. and Li Z. , Comparison of transferred deep neural networks in ultrasonic breast masses discrimination, BioMed Research International ((2018) ). |
[23] | Too E.C. , Yujian L. , Njuki S. , Yingchun L. , A comparative study of fine-tuning deep learning models for plant disease identification, Computers and Electronics in Agriculture 161: ((2019) ), 272–279. |
[24] | Mormont R. , Geurts P. , Marée R. , Comparison of deep transfer learning strategies for digital pathology, in: Proceedings of the IEEE Conference on Computer Vision and Pattern Recognition Workshops ((2018) ), pp. 2262–2271. |
[25] | Dorafshan S. , Thomas R.J. , Maguire M. , Comparison of deep convolutional neural networks and edge detectors for image-based crack detection in concrete, Construction and Building Materials 186: ((2018) ), 1031–1045. |
[26] | Maruyama T. , Hayashi N. , Sato Y. , Hyuga S. , Wakayama Y. , Watanabe H. , Ogura A. , Ogura T. , Comparison of medical image classification accuracy among three machine learning methods, Journal of X-ray Science and Technology 26: (6) ((2018) ), 885–893. |
[27] | Li F. , Shirahama K. , Nisar M.A. , Köping L. , Grzegorzek M. , Comparison of feature learning methods for human activity recognition using wearable sensors, Sensors 18: (2) ((2018) ), 679. |
[28] | Fang Y. , Zhang H. , Xie J. , Lin M. , Ying L. , Pang P. , Ji W. , Sensitivity of chest CT for COVID-19: comparison to RT-PCR, Radiology ((2020) ), 200432. |
[29] | Bernheim A. , Mei X. , Huang M. , Yang Y. , Fayad Z.A. , Zhang N. , Diao K. , Lin B. , Zhu X. , Li K. , et al., Chest CT findings in coronavirus disease-19 (COVID-19): relationship to duration of infection, Radiology ((2020) ), 200463. |
[30] | Rubin G.D. , Ryerson C.J. , Haramati L.B. , Sverzellati N. , Kanne J.P. , Raoof S. , Schluger N.W. , Volpi A. , Yim J.-J. , Martin I.B. , et al., The role of chest imaging in patient management during the covid-19 pandemic: A multinational consensus statement from the fleischner society, Chest, ((2020) ). |
[31] | Farooq M. , Hafeez A. , Covid-resnet: A deep learning framework for screening of covid19 from radiographs, arXiv preprint arXiv:2003.14395 ((2020) ). |
[32] | Afshar P. , Heidarian S. , Naderkhani F. , Oikonomou A. , Plataniotis K.N. , Mohammadi A. , Covid-caps: A capsule network-based framework for identification of covid-19 cases from x-ray images, arXiv preprint arXiv:2004.02696 ((2020) ). |
[33] | Wang L. , Wong A. , COVID-Net: A tailored deep convolutional neural network design for detection of COVID-19 cases from chest radiography images, arXiv preprint arXiv:2003.09871 ((2020) ). |
[34] | Hemdan E.E.-D. , Shouman M.A. , Karar M.E. , Covidx-net: A framework of deep learning classifiers to diagnose covid-19 in x-ray images, arXiv preprint arXiv:2003.11055 ((2020) ). |
[35] | Sethy P.K. , Behera S.K. , Detection of coronavirus disease (covid-19) based on deep features, Preprints 00, ((2020) ), 2020. |
[36] | Maghdid H.S. , Asaad A.T. , Ghafoor K.Z. , Sadiq A.S. , Khan M.K. , Diagnosing COVID-19 pneumonia from X-ray and CT images using deep learning and transfer learning algorithms, arXiv preprint arXiv:2004.00038 ((2020) ). |
[37] | Apostolopoulos I. , Aznaouridis S. , Tzani M. , Extracting possibly representative COVID-19 Biomarkers from X-Ray images with Deep Learning approach and image data related to Pulmonary Diseases, arXiv preprint arXiv:2004.00338 ((2020) ). |
[38] | Loey M. , Smarandache F. , Khalifa N.E.M. , Within the Lack of COVID-19 Benchmark Dataset: A Novel GAN with Deep Transfer Learning for Corona-virus Detection in Chest X-ray Images, ((2020) ). |
[39] | Zhang L. , Lu L. , Nogues I. , Summers R.M. , Liu S. , Yao J. , DeepPap: deep convolutional networks for cervical cell classification, IEEE Journal of Biomedical and Health Informatics 21: (6) ((2017) ), 1633–1643. |
[40] | Li C. , Xue D. , Zhou X. , Zhang J. , Zhang H. , Yao Y. , Kong F. , Zhang L. , Sun H. , Transfer Learning Based Classification of Cervical Cancer Immunohistochemistry Images, in: Proceedings of the Third International Symposium on Image Computing and Digital Medicine ((2019) ), pp. 102–106. |
[41] | Song Y. , Zou J.J. , Chang H. , Cai W. , Adapting fisher vectors for histopathology image classification, in: 2017 IEEE 14th International Symposium on Biomedical Imaging (ISBI 2017), IEEE ((2017) ), pp. 600–603. |
[42] | Hall L.O. , Paul R. , Goldgof D.B. , Goldgof G.M. , Finding COVID-19 from Chest X-rays using Deep Learning on a Small Dataset, arXiv preprint arXiv:2004.02060 ((2020) ). |
[43] | Zhang J. , Xie Y. , Li Y. , Shen C. , Xia Y. , Covid-19 screening on chest x-ray images using deep learning based anomaly detection, arXiv preprint arXiv:2003.12338 ((2020) ). |
[44] | Abbas A. , Abdelsamea M.M. , Gaber M.M. , Classification of COVID-19 in chest X-ray images using DeTraC deep convolutional neural network, arXiv preprint arXiv:2003.13815 ((2020) ). |
[45] | Narin A. , Kaya C. , Pamuk Z. , Automatic detection of coronavirus disease (covid-19) using x-ray images and deep convolutional neural networks, arXiv preprint arXiv:2003.10849 ((2020) ). |
[46] | Cohen J.P. , Morrison P. , Dao L. , COVID-19 image data collection, arXiv preprint arXiv:2003.11597 ((2020) );. |
[47] | Mooney P. , Chest X-Ray Images (Pneumonia), ((2018) ). https://www.kaggle.com/paultimothymooney/chest-xray-pneumonia. |
[48] | Simonyan K. , Zisserman A. , Very deep convolutional networks for large-scale image recognition, arXiv preprint arXiv:1409.1556 ((2014) ). |
[49] | He K. , Zhang X. , Ren S. , Sun J. , Deep residual learning for image recognition, in: Proceedings of the IEEE conference on computer vision and pattern recognition ((2016) ), pp. 770–778. |
[50] | He K. , Zhang X. , Ren S. , Sun J. , Identity mappings in deep residual networks, in: European conference on computer vision, Springer ((2016) ), pp. 630–645. |
[51] | Szegedy C. , Vanhoucke V. , Ioffe S. , Shlens J. , Wojna Z. , Rethinking the inception architecture for computer vision, in: Proceedings of the IEEE conference on computer vision and pattern recognition ((2016) ), pp. 2818–2826. |
[52] | Szegedy C. , Ioffe S. , Vanhoucke V. , Alemi A.A. , Inception-v4, inception-resnet and the impact of residual connections on learning, in: Thirty-first AAAI conference on artificial intelligence, (2017) . |
[53] | Chollet F. , Xception: Deep learning with depthwise separable convolutions, in: Proceedings of the IEEE conference on computer vision and pattern recognition ((2017) ), pp. 1251–1258. |
[54] | Howard A.G. , Zhu M. , Chen B. , Kalenichenko D. , Wang W. , Weyand T. , Andreetto M. , Adam H. , Mobilenets: Efficient convolutional neural networks for mobile vision applications, arXiv preprint arXiv:1704.04861 ((2017) ). |
[55] | Huang G. , Liu Z. , Van L. , Der Maaten and K.Q. Weinberger, Densely connected convolutional networks, in: Proceedings of the IEEE conference on computer vision and pattern recognition ((2017) ), pp. 4700–4708. |
[56] | Pan S.J. , Yang Q. , A survey on transfer learning, IEEE Transactions on Knowledge and Data Engineering 22: (10) ((2009) ), 1345–1359. |
[57] | Rawat W. , Wang Z. , Deep convolutional neural networks for image classification: A comprehensive review, Neural Computation 29: (9) ((2017) ), 2352–2449. |
[58] | Bisong E. , Google Colaboratory, in: Building Machine Learning and Deep Learning Models on Google Cloud Platform, Springer ((2019) ), pp. 59–64. |
[59] | Carneiro T. , Da Nóbrega R.V.M. , Nepomuceno T. , Bian G.-B. , De Albuquerque V.H.C. and Reboucas Filho P.P. , Performance analysis of google colaboratory as a tool for accelerating deep learning applications, IEEE Access 6: ((2018) ), 61677–61685. |
[60] | Xie Y. , Xing F. , Kong X. , Su H. , Yang L. , Beyond classification: Structured regression for robust cell detection using convolutional neural network, in: International conference on medical image computing and computer-assisted intervention, Springer ((2015) ), pp. 358–365. |
[61] | Sukumar P. , Gnanamurthy R. , Computer aided detection of cervical cancer using pap smear images based on adaptive neuro fuzzy inference system classifier, Journal of Medical Imaging and Health Informatics 6: (2) ((2016) ), 312–319. |
[62] | Powers D.M. , Evaluation: from precision, recall and F-measure to ROC, informedness, markedness and correlation, ((2011) ). |
[63] | Joshi D. , Singh T. , A Survey of Fracture Detection Techniques in Bone X-ray Images, Artificial Intelligence Review Online first ((2020) ), 1–43. |
[64] | Wang Z. , Xin J. , Huang Y. , Li C. , Xu L. , Li Y. , Zhang H. , Gu H. , Qian W. , A similarity measure method combining location feature for mammogram retrieval, Journal of X-ray Science and Technology 26: (4) ((2018) ), 553–571. |
[65] | Wang Z. , Huang Y. , Li M. , Zhang H. , Li C. , Xin J. , Qian W. , Breast mass detection and diagnosis using fused features with density, Journal of X-ray Science and Technology 27: (2) ((2019) ), 321–342. |
[66] | Sun Y. , Liu X. , Cong P. , Li L. , Zhao Z. , Digital radiography image denoising using a generative adversarial network, Journal of X-ray Science and Technology 26: (4) ((2018) ), 523–534. |
[67] | Yang J. , Zhao Z. , Zhang H. , Shi Y. , Data Augmentation for X-Ray Prohibited Item Images Using Generative Adversarial Networks, IEEE Access 7: (1) ((2019) ), 28894–28902. |
[68] | Al-antari M.A. , Al-masni M.A. , Metwally M.K. , Hussain D. , Park S.-J. , Shin J.-S. , Han S.-M. , Kim T.-S. , Denoising images of dual energy X-ray absorptiometry using non-local means filters, Journal of X-ray Science and Technology 26: (3) ((2018) ), 395–412. |
[69] | Rafati M. , Farnia F. , Taghvaei M.E. , Nickfarjam A.M. , Fuzzy genetic-based noise removal filter for digital panoramic X-ray images, Biocybernetics and Biomedical Engineering 38: (4) ((2018) ), 941–965. |
[70] | Shen L. , Sun H. , Li X. , Liu Y. , Fang H. , Su J. , Zhang L. , A Robust Filtering Method for X-Ray Pulsar Navigation in the Situation of Strong Noises and Large State Model Errors, IEEE Access 7: (1) ((2019) ), 161141–161151. |
[71] | Zhang B. , Qi S. , Monkam P. , Li C. , Yang F. , Yao Y.-D. , Qian W. , Ensemble learners of multiple deep CNNs for pulmonary nodules classification using CT images, IEEE Access 7: ((2019) ), 110358–110371. |
[72] | Szegedy C. , Liu W. , Jia Y. , Sermanet P. , Reed S. , Anguelov D. , Erhan D. , Vanhoucke V. , Rabinovich A. , Going deeper with convolutions, in: Proceedings of the IEEE conference on computer vision and pattern recognition ((2015) ), pp. 1–9. |
[73] | Sandler M. , Howard A. , Zhu M. , Zhmoginov A. , Chen L.-C. , Mobilenetv2: Inverted residuals and linear bottlenecks, in: Proceedings of the IEEE conference on computer vision and pattern recognition ((2018) ), pp. 4510–4520. |
[74] | Zoph B. , Vasudevan V. , Shlens J. , Le Q.V. , Learning transferable architectures for scalable image recognition, in: Proceedings of the IEEE conference on computer vision and pattern recognition ((2018) ), pp. 8697–8710. |


