
Dynamic CT assessment of disease change and prognosis of patients with moderate COVID-19 pneumonia
Abstract
OBJECTIVES:
To assess prognosis or dynamic change from initial diagnosis until recovery of the patients with moderate coronavirus disease (COVID-19) pneumonia using chest CT images.
MATERIALS AND METHODS:
In this retrospective study, 33 patients (18 men, 15 women; median age, 49.0 years) with confirmed with moderate COVID-19 pneumonia in a multicenter hospital were included. The patients underwent at least four chest non-contrast-enhanced computed tomography (CT) scans at approximately 5-day intervals. We analyzed the clinical and CT characteristics of the patients. Moreover, the total CT score and the sum of lung involvement were determined for every CT scan.
RESULTS:
The most widespread presenting symptoms were fever (32/33, 97.0%) and cough (17/33, 51.5%), which were often accompanied by decreased lymphocyte count (15/33, 45.5%) and increased C-reactive protein levels (18/33, 54.6%). Bilateral, multifocal ground glass opacities (32/33, 97.0%), consolidation (25/33, 75.8%), vascular thickening (23/33, 69.7%), and bronchial wall thickening (21/33, 63.6%) with peripheral distribution were the most frequent CT findings during moderate COVID-19 pneumonia. In patients recovering from moderate COVID-19 pneumonia, four stages (stages 1–4) of evolution were identified on chest CT with average CT scores of 3.4±2.3, 6.0±4.4, 5.6±3.8, and 4.9±3.2, respectively, from the onset of symptoms. For most patients, the peak of average total CT score increased for approximately 8 days after the onset of symptoms, after which it decreased gradually. The mean CT score of all patients was 4.7 at the time of discharge.
CONCLUSION:
The moderate COVID-19 pneumonia CT score increased rapidly in a short period of time initially, followed by a slow decline over a relatively long time. The peak of the course occurred in stage 2. Complete recovery of patients with moderate COVID-19 pneumonia with high mean CT score at the time of discharge requires longer time.
1Introduction
Human beings are currently facing a substantial health challenge due to the emergence of a novel coronavirus. The new virus, capable of infecting humans, has been found to cause acute respiratory disease in a cluster of people, or an even more fatal illness recognized as coronavirus disease (COVID-19) [1]. Since its initial identified in Wuhan, China in December 2019, the virus has begun to spread globally. At present, most patients in China with COVID-19 have been cured and discharged. According to our experience, we have summarized the characteristics of COVID-19 pneumonia in the hope that our study will provide help for clinical diagnosis and evaluation of effective treatments.
It has been widely reported that the predominant clinical manifestations of COVID-19 pneumonia are fever, cough, ground glass opacities (GGO) on chest computerized tomography (CT) scan, and pulmonary consolidation within the subpleural area of both lungs [2–4]. However, we have identified vascular thickening and bronchial wall thickening as additional image features. We have also been able to observe the progression of COVID-19 by analyzing dynamic CT scores. Although Pan F et al. have studied changes in COVID-19 pneumonia over time, their subjects were all COVID-19 patients without a determined pneumonia classification. COVID-19 pneumonia cases can be clinically classified as mild, moderate, severe, and critical, and we believe that disease progression differs substantially with varying COVID-19 classification.
In our study, CT imaging characteristics were summarized in 33 patients with moderate COVID-19 infection. Our primary aim was to develop detailed CT scoring criteria with a view to understanding dynamic changes in moderate COVID-19 pneumonia. We also aimed to produce time-disease progression curves for estimating the prognosis of pneumonia lesions. We hope that our findings will provide clinicians with useful information for the diagnosis and treatment of moderate COVID-19 pneumonia.
2Materials and methods
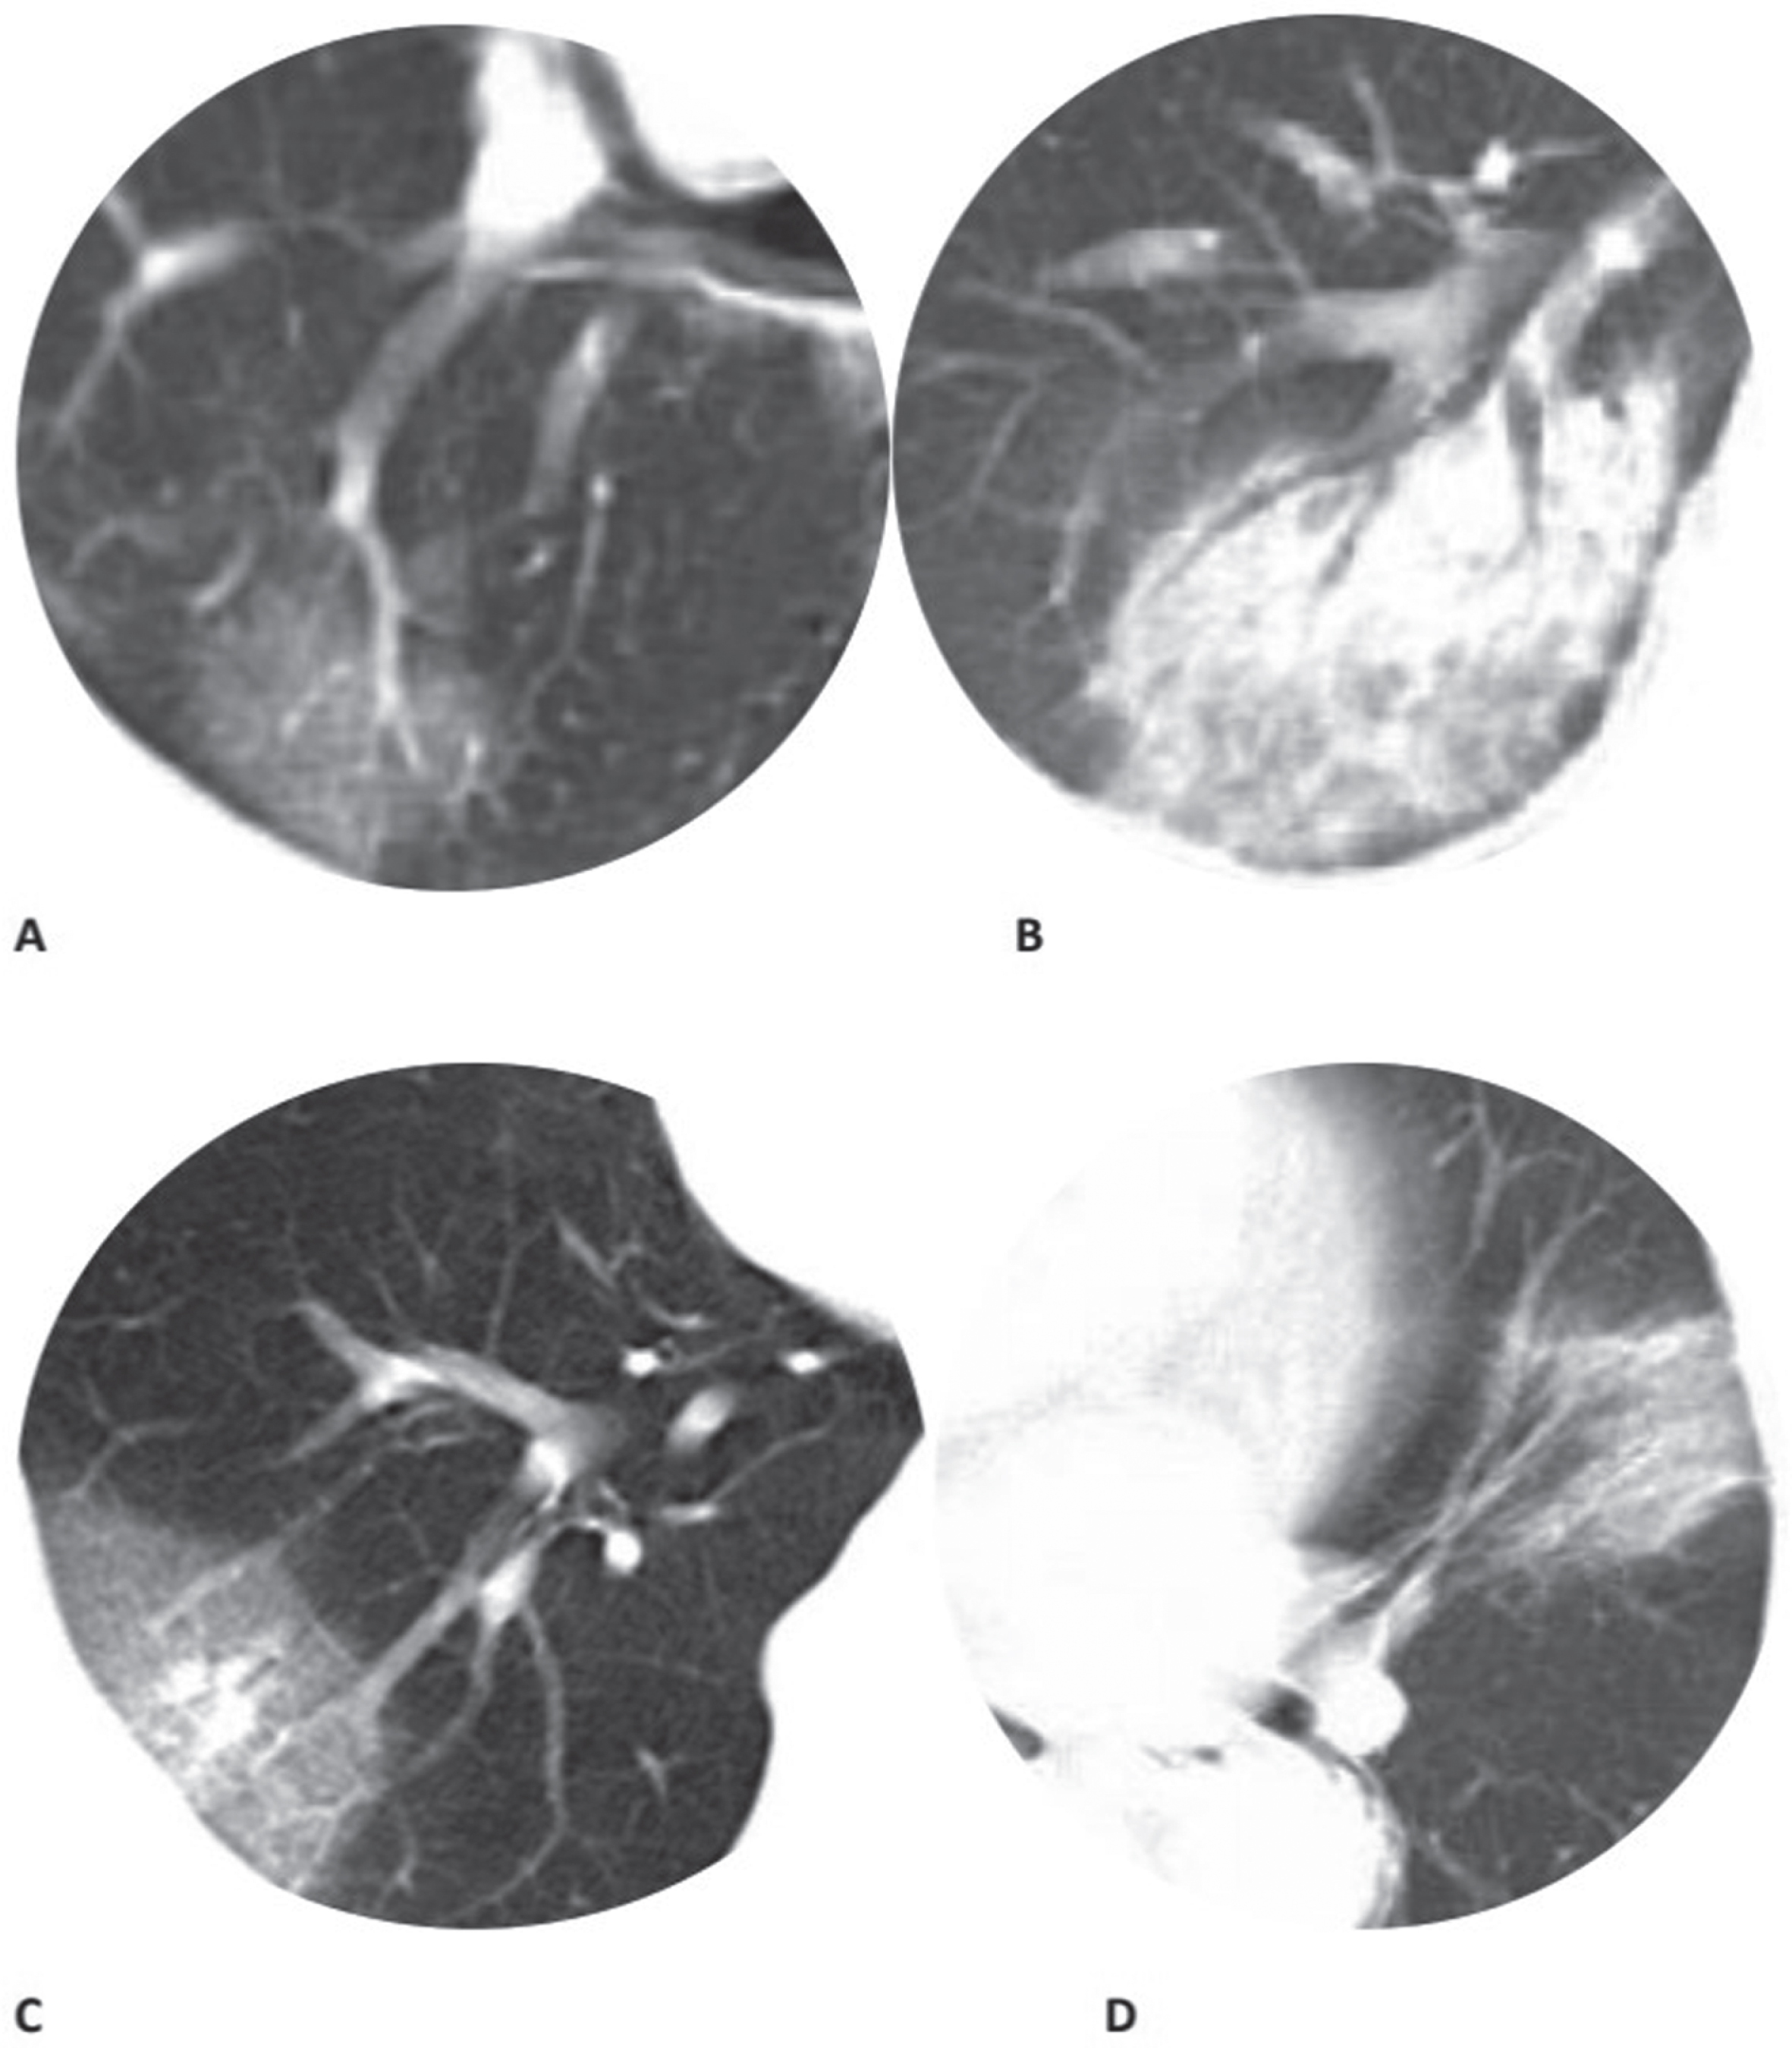
This study was authorized in accordance with the principles of the Declaration of Helsinki. Jiangxi Provincial People’s Hospital Affiliated to Nanchang University institutional review board waived the requirement for written informed consent for this retrospective study, which evaluated clinical data without any risk to patients and with no connection between the patients and the researchers. The anonymous data were analyzed to facilitate better clinical decision-making and treatment. A total of 33 patients (18 men and 15 women) were included in this study. The average age was 49±15.5 years (Table 1). Among these patients, five patients had hypertension and one had chronic obstructive pulmonary disease (COPD). The analyzed clinical data included the following characteristics: age, sex, exposure history, disease course, laboratory results, symptoms, comorbid conditions, and CT score focusing on the characteristics of pulmonary lesions, including (a) lesion size and distribution characteristics, (b) number of lung segments involved, (c) patterns of the lesion including GGO, consolidation, vascular thickening, bronchial wall thickening, crazy-paving pattern, (d) and other signs associated with the lesion (for example, adjacent pleural thickening, pleural effusion, and mediastinal lymphadenopathy). GGO was defined as a hazy opacity that did not obscure underlying bronchial and vascular margins (Fig. 1). Consolidation is a region of normal lung tissue that has filled with liquid instead of air which, on CT, was defined as opacification with obscuration of bronchial structures and pulmonary vessels (Fig. 1) and pathological alteration of the lung tissue from an aerated condition to solid condition [5]; crazy-paving pattern is characterized by the presence of diffuse GGO associated with interlobular septal thickening and intralobular lines [6].
Table 1
Clinical and demographic characteristics of the 33 patients
| Age (y) | 49±15.0 |
| Sex | |
| Male | 18 cases |
| Female | 15 cases |
| Initial symptoms | |
| Fever | (32/33)97.0% |
| Cough | (17/33)51.5% |
| Chills | (10/33)30.3% |
| Throat pain | (9/33)27.3% |
| Fatigue | (5/33)15.2% |
| No symptoms | (1/33)3.0% |
| Laboratory investigations | |
| Increase in C-reactive protein (mg/L) level | (18/33)54.6% |
| Decrease in Lymphocyte count (G/L) | (15/33)45.5% |
| Increase in Lymphocyte count (G/L) | (2/33)6.1% |
| Decrease in white blood cell count (G/L) | (8/33)24.2% |
| Increase in white blood cell count (G/L) | (2/33)6.1% |
| Increase in Neutrophil count (G/L) | (7/33)21.2% |
| Decrease in Neutrophil count (G/L) | (3/33)9.1% |
| Increase in erythrocyte sedimentation rate (S) | (7/33)21.2% |
| Increase in procalcitonin level | (7/33)21.2% |
| Hospitalization period (d) | 20.8±6.1 |
| Interval between the onset of initial symptoms and discharge (d) | 24.0±6.4 |
| Time from the onset of initial symptoms to diagnosis (d) | 3.9±3.3 |
| Time from the onset of initial symptoms to negativity for nucleic acid test (d) | 18.6±8.0 |
Quantitative data are presented as mean±standard deviation, while the count data are presented as numbers (percentage of the total).
Fig.1
Chest CT findings of moderate COVID-19 pneumonia on axial images (a) GGO; (b) Consolidation; (c) Vascular thickening; (d) Bronchial wall thickening. The same window level and width were set on all images.
2.1Inclusion and exclusion criteria
In this study, medical records of patients diagnosed with moderate COVID-19 pneumonia between January 15, 2020 and March 5, 2020, in our multicenter hospital were reviewed retrospectively. Patients with severe and critical pneumonia during treatment were excluded, which was defined as follows: (1) severe respiratory distress (respiratory rate ≥30 breaths/min); (2) oxygen saturation ≤93.0% at a rest state; (3) PaO2/FiO2 = 300 mmHg; and (4) chest CT showing lesions that have progressed more than 50% within 24–48 h [7]. Those with pulmonary abnormalities potentially caused by underlying pulmonary diseases (such as tuberculosis or lung tumor) were excluded from this study.
2.1.1Diagnostic and treatment criteria of COVID-19 pneumonia
According to the seventh edition of diagnosis and treatment protocols from the National Health Commission of the People’s Republic of China [7], the standard of diagnosis for COVID-19 pneumonia are as follows: (1) epidemiological travel or history of exposure to patients with confirmed COVID-19 infection, or exposure to those from Wuhan with fever showing obvious respiratory symptoms within two weeks of the onset of illness; (2) typical clinical manifestations including fever, respiratory symptoms, and/or normal or reduced white blood cell count or decreased lymphocyte count; (3) obvious imaging characteristics of pneumonia and (4) laboratory diagnosis using swabs of the throat or lower respiratory tract via real-time fluorescence polymerase chain reaction (RT-PCR) reveal positivity for COVID-19. The patients with confirmed COVID-19 pneumonia were treated in isolation within the hospital. The discharge criteria were: (1) body temperature returned to normal and remained as such for more than 3 days; (2) respiratory symptoms had improved significantly; (3) improvement in radiological abnormalities were observed on chest CT and (4) two consecutive negative results for COVID-19 nucleic acid detection tests performed at least 24 hpurs apart.
2.2CT protocol
Chest CT scans were performed under breath-holding conditions, in the inspiration phase, using spiral CT scanners (GE OPTIMA CT660, GE Medical Systems, Post-processing software AW4.6 workstation). To minimize motion artifacts, patients were instructed to hold their breath; CT scanning was then performed during a single breath-hold. For CT acquisition, a tube voltage of 120 kVp, tube current of 210 mA, scan type of helical full 0.5 seconds, and total exposure time of 3.4 seconds were used. Using the raw data, the hybrid iterative reconstruction method was used to reconstruct CT images with a matrix size of 512×512, as transverse slice axial images (thickness of 1.3 mm, increment of 1.3 mm).
2.3Chest CT evaluation
The major CT features of moderate COVID-19 pneumonia were described in terms of GGO, consolidation, vascular thickening, bronchial wall thickening, and crazy-paving pattern [8, 9]. A CT scoring system was used to quantify the extent of lung involvement in pulmonary abnormalities based on the lung segments involved [10, 11], and this system was an adaptation of a previously described method. At least four chest CT images were obtained at approximately 5-day intervals. The total CT score, derived from the sum of lung involvement (18 lung segments; score of 0–2 for each lung segment, giving a score ranging from 0 [no pulmonary involvement] to 36 [maximum pulmonary involvement]), was determined. Each lung segment was visually scored from 0 to 2 as follows: 0, no abnormality; 0.5, <50% GGO involvement; (1) >50% GGO involvement or <50% consolidation involvement; and (2) >50% consolidation involvement. CT scores for consolidation and GGO can be added together, but the maximum score is 2 for each lung segment. The distribution characteristics, size, pattern, morphology, and accompanying lung abnormalities were recorded. All image analyses were performed using the institutional digital database system (Winning PACS, version 6.0, Winning Health Technology Group Co., Ltd. China) by two radiologists (B.L., and H.Z. with 13 and 16 years of experience in thoracic radiology, respectively) independently, and final scores were determined by consensus. All the disagreements were solved by discussion. In patients recovering from moderate COVID-19 pneumonia, the evolution of the CT findings can be divided into four stages: early stage (0–5 days); peak stage (6–10 days); absorption stage (11–15 days); and recovery stage (≥16 days).
2.4Statistical data analysis
Statistical analyses were performed using IBM SPSS Statistics Software (version 25; IBM, New York, USA). Quantitative data are presented as “mean±standard deviation” (minimum/maximum), and the count data are presented as the percentage of the total unless otherwise stated. The sum CT score of all lung segments, as a function of time, was quantified and evaluated based on a statistical smoothing model application. A t-test was performed on average the CT scores at four stages. p < 0.05 was defined as a statistically significant threshold.
Kappa statistics were calculated to assess the inter-reader variation as follows: Kappa values <0.20 indicated positive but poor agreement, 0.21–0.40 indicated fair agreement, 0.41–0.60 indicated moderate agreement, 0.61–0.80 indicated good agreement, and >0.81 indicated excellent agreement.
3Results
3.1Clinical analysis
Most of the patients included in this study had a history of exposure to infected patients. The most common symptoms were fever (32/33, 97.0%), cough (17/33, 51.5%), chills (10/33, 30.3%), throat pain (9/33, 27.3%), and fatigue (5/33, 15.2%). It is worth noting that one patient (3.0%) was asymptomatic. Table 1 summarizes patients’ clinical characteristics. Findings of laboratory investigations were often abnormal, as follows: C-reactive protein levels, elevated to some degree (18/33, 54.6%); lymphocyte count, mild decrease (15/33, 45.5%) or increase (2/33, 6.1%); white blood cell count, slight decrease (8/33, 24.2%) or increase (2/33, 6.1%) with the number of patients with decreased white blood cell counts being higher than that of those with increased white blood cell counts; neutrophils, increased (7/33, 21.2%) or decreased (3/33, 9.1%); erythrocyte sedimentation rate, increased (7/33, 21.2%); and procalcitonin, increased (7/33, 21.2%) (Table 1). All patients were discharged after a mean hospitalization period of 20.8±6.1 days (range: 18–37 days), and the average total course was 24.0±6.4 days. Finally, after an average period of 18.6 days (range: 12–35 days) from the onset of initial symptoms, patients showed negativity for COVID-19 nucleic acids on RT- PCR (Table 1).
3.2Medical imaging characteristics
Overall, most patients presented with bilateral, multifocal lung lesions, with peripheral distribution, and subpleural lesions were more common than central lesions during the course of the disease. GGO (32/33), consolidation (25/33), vascular thickening (23/33), bronchial wall thickening (21/33), and crazy paving pattern (10/33) (Fig. 1; Table 2) were the most common CT findings while pleural effusion and pleural thickening were uncommon imaging findings in patients with moderate COVID-19 pneumonia. Moreover, most lesions (64.6%) tended to be distributed in the apical and posterior segments, superior segment, and posterior and lateral basal segments. On an average, each patient underwent 4 (range: 3–7) chest CT scans with a mean interval of 5±1 days (range: 1–6 days). Based on the degree of lung segment involvement from day 0 to day 37, chest CT scans of four stages were identified for analysis: stage-1 (0–5 days), mean duration of 2.8 days (67.5 h); stage-2 (6–10 days), mean duration of 7.5 days (180.7 h); stage-3 (11–15 days), mean duration of 11.6 days (278.7 h); and stage-4 (≥16 days), mean duration of 19.2 days (460.7 h). The course of lesion changes in CT images has been presented (Fig. 2 A, B, C, D), and the major CT findings were compared among the four stages (Table 3).
Fig.2
Typical evolution of CT findings (A1, B1, C1, D1 correspond to the same case). Typical evolution of CT findings in a 45-year-old male presenting with persistent fever (38.0°C) for two days. (A1) At presentation (day 3), there were no abnormalities on chest CT; (B1) day 7, There was a small subpleural GGO with partial consolidation in the lower left lobe; (C1) day 12, partial resolution of the initial GGO and consolidation; (D1) day 16, continued absorption with minimal residual lesions and parenchymal bands were observed. (E2, F2, G2 correspond to the same case) Typical evolution of CT findings in a 46-year-old male presenting with persistent fever (38.0°C) for four days. Bronchial wall thickening can be observed from day 4 to day 8, and its recovery can be observed on day 13. The same window level and width were set on all images.
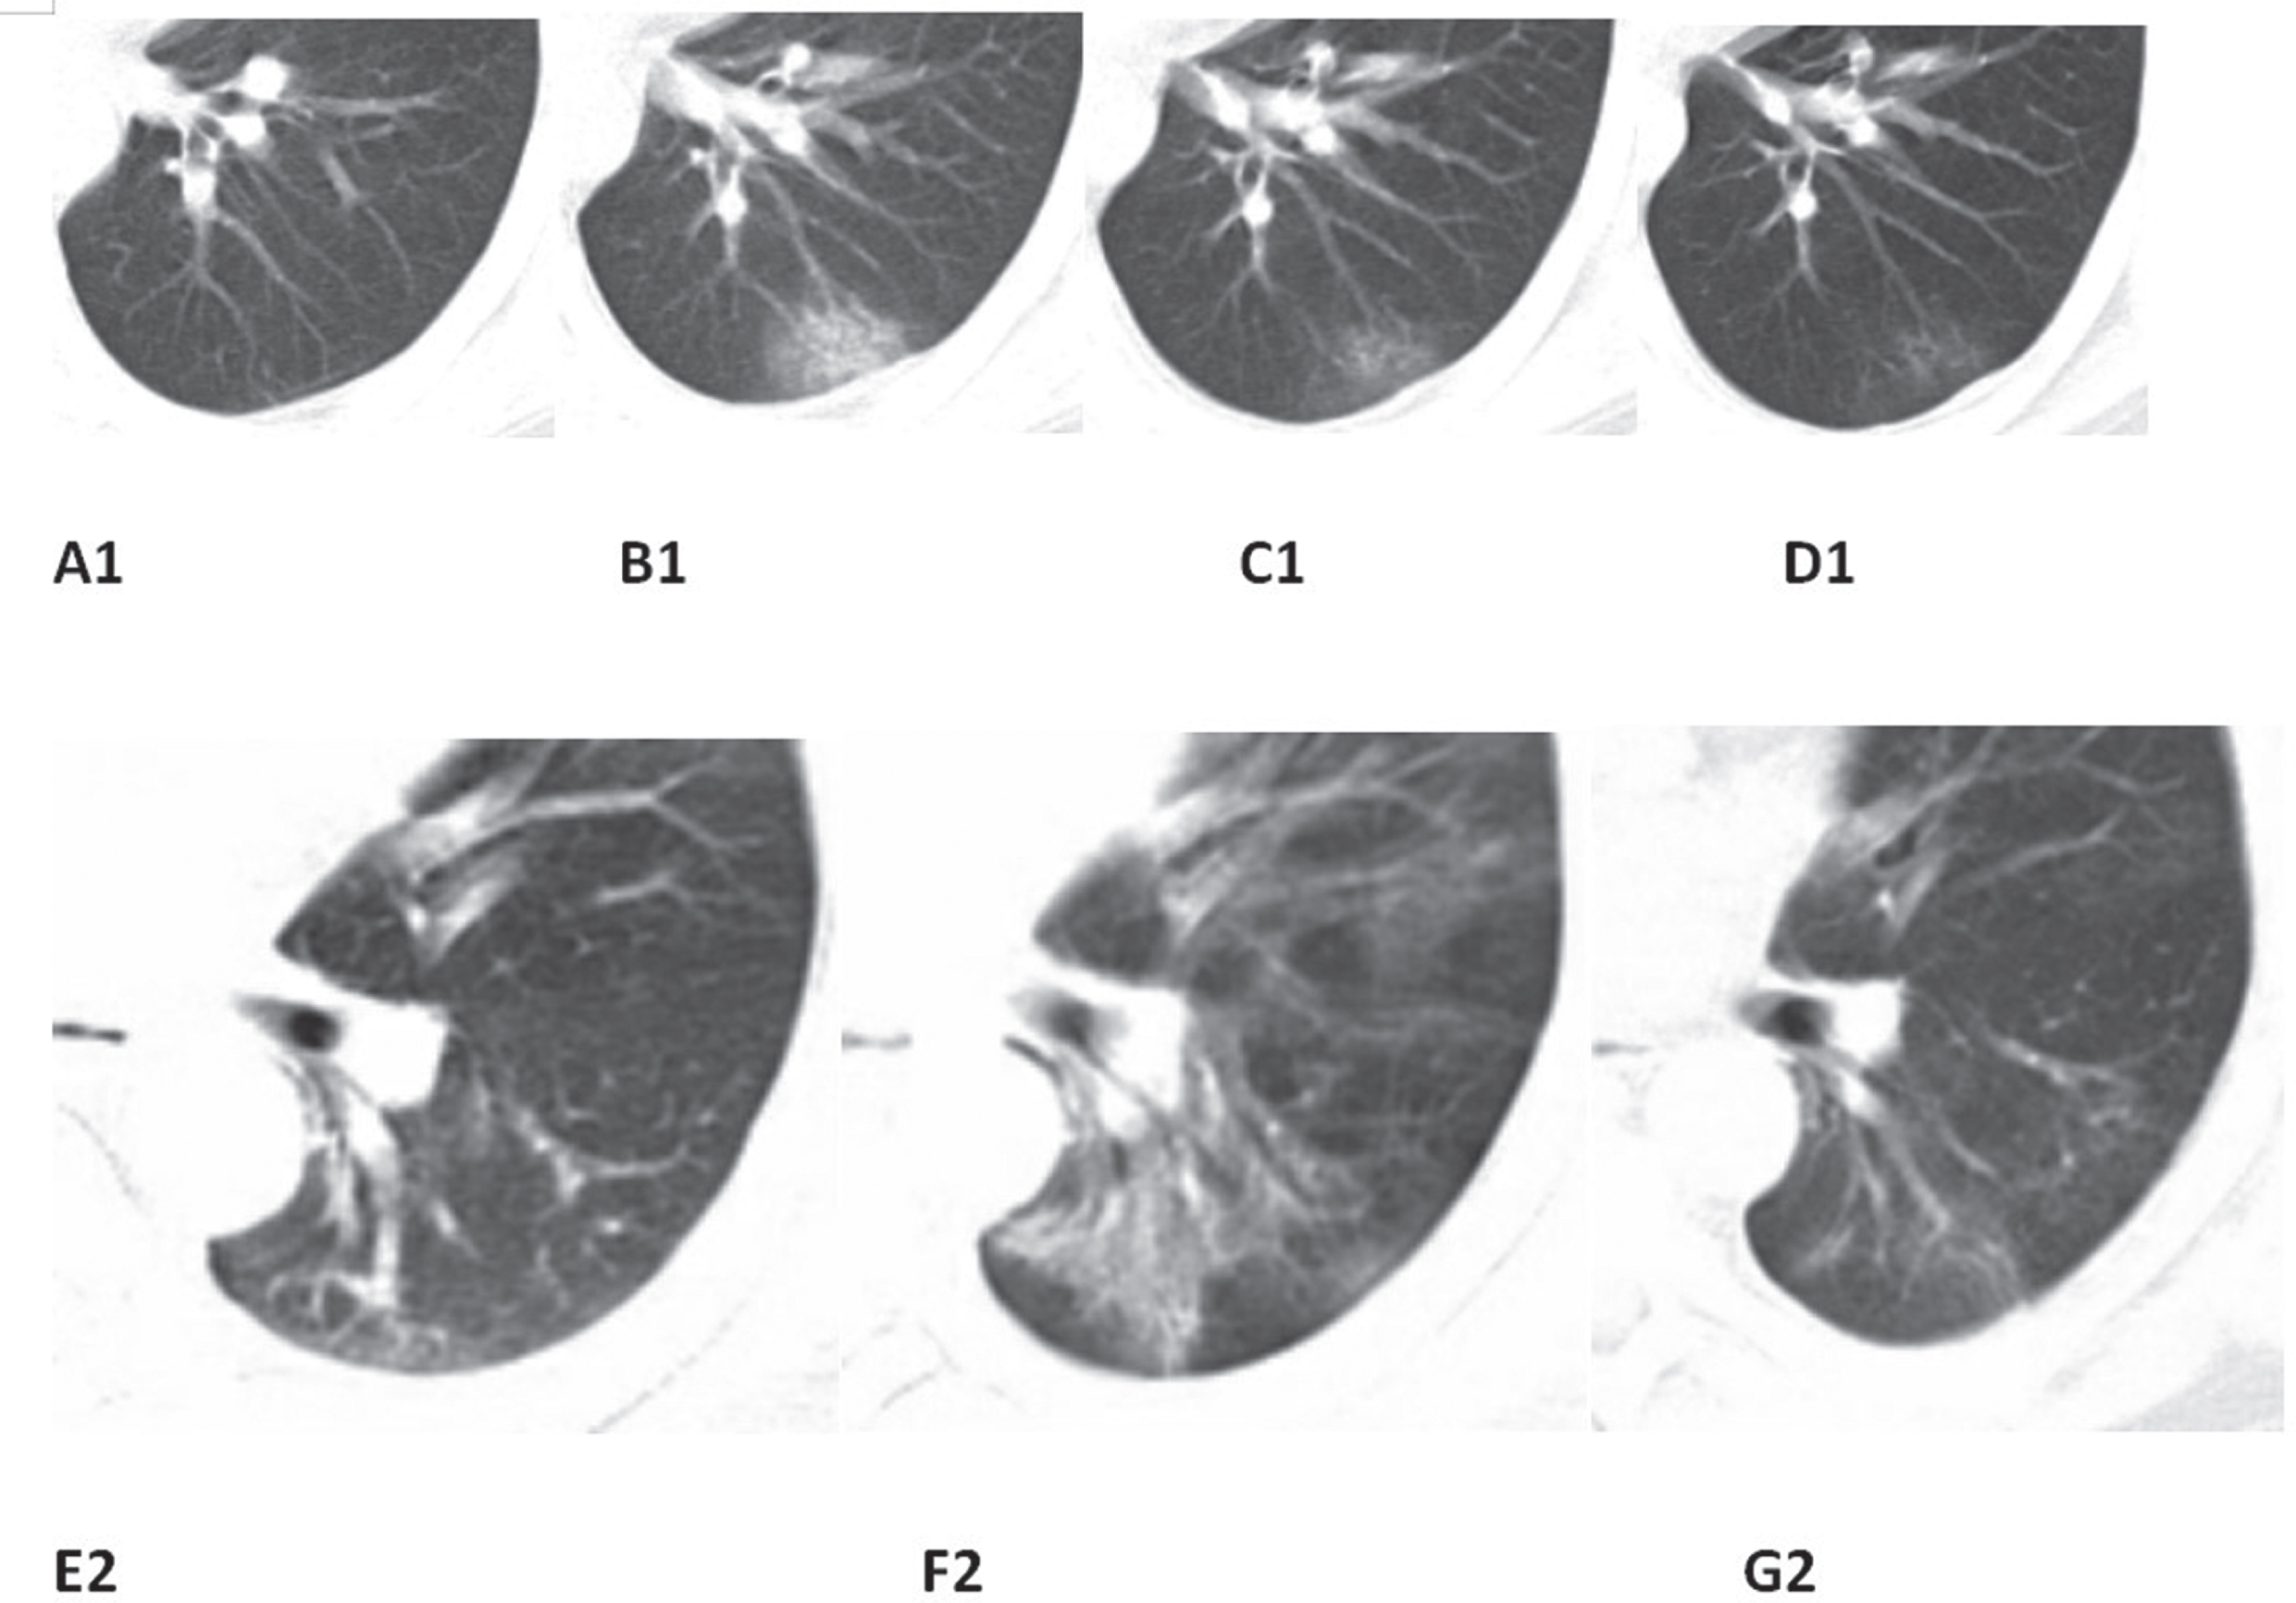
Table 2
Chest CT scan characteristics
| Period between the onset of symptoms and the first scan(h) | 61.6±35.9 |
| Numbers of scans | ≥4(3 – 7) |
| Interval between adjacent scans (d) | 5(1–6) |
| Major CT findings | |
| GGO | (32/33)97.0% |
| Consolidation | (25/33)75.8% |
| Vascular thickening | (23/33)69.7% |
| Bronchial wall thickening | (21/33)63.6% |
| Crazy-paving pattern | (10/33)30.3% |
Quantitative data are presented as mean±standard deviation, while the count data are presented as numbers (percentage of the total).
Table 3
CT score in the four stages of COVID-19 disease progression
| CT findings and | Stage-1 | Stage-2 | Stage-3 | Stage-4 |
| CT score | (n = 33) | (n = 33) | (n = 33) | (n = 33) |
| GGO | (28/33)84.9% | (30/33) 90.9% | (30/33) 90.9% | (29/33) 87.9% |
| Consolidation | (10/33) 30.3% | (18/33) 54.6% | (15/33) 45.5% | (8/33) 24.2% |
| Vascular thickening | (13/33)39.4% | (18/33)54.6% | (20/33) 60.6% | (6/33) 18.2% |
| Bronchial wall thickening | (11/33)63.6% | (18/33) 54.6% | (21/33) 63.6% | (8/33) 24.2% |
| Crazy-paving pattern | (4/33) 30.3% | (8/33) 24.2% | (10/33) 30.3% | (5/33) 15.2% |
| Average total CT score | 3.4±2.3 | 6.0±4.4 | 5.6±3.8 | 4.9±3.2 |
| Average highest total CT score in every case | 6.9±4.3 | |||
| Corresponding time of the highest total CT score in every case (h) | 209.4±82.5 | |||
| Period between the onset of symptoms and negativity of RT-PCR after treatment (d) | 4.7±3.5 | |||
Quantitative data are presented as mean±standard deviation, while the abnormal counting data were presented as numbers (percentage of the total).
In stage-1, GGO (28/33, 84.9% of patients), vascular thickening (13/33, 39.4% of patients), bronchial wall thickening (11/33, 33.3% of patients), and consolidation (10/33, 30.3% of patients) were observed. In stage-2, GGO (30/33, 90.9% of patients) extending to more pulmonary lobes with more vascular thickening (18/33, 54.6% of patients), bronchial wall thickening (18/33, 54.6% of patients), and consolidation (18/33, 54.6% of patients) were observed. In stage 3, GGO (30/33, 90.9% of patients) and consolidation (15/33, 45.5% of patients) were predominantly present, with a substantial increase in the incidence of bronchial wall thickening (21/33, 63.6% of patients) and vascular thickening (20/33, 60.6% of patients). In stage-4, GGO (29/33, 87.9% of patients) and consolidation (8/33, 24.2% of patients) were partially absorbed, and bronchial wall thickening (8/33, 24.2% of patients) and vascular thickening (6/33, 18.2% of patients) decreased (Fig. 2; Table 3). The average CT scores were significantly different between stage-1 and stage-2 (p < 0.05), between stage-1 and stage-3 (p < 0.05), between stage-1 and stage-4 (p < 0.05), between stage-2 and stage-3 (p < 0.05), between stage-2 and stage-4 (p < 0.05), and between stage-3 and stage-4 (p < 0.05).
In summary, average CT scores of COVID-19 pneumonia stages 1–4 were 3.4±2.3, 6.0±4.4, 5.6±3.8, and 4.9±3.2, respectively (Table 3; Fig. 3A). The consistency between the two radiologists was excellent (kappa = 0.855, P = 0.001). The highest average total CT score out of all cases was 6.9±4.3 (Fig. 3B). In most patients (24/33), the average total CT score increased until approximately 8 days after the onset of initial symptoms, and subsequently decreased gradually (Fig. 4). On average, the CT score peaked at 6.0 after the onset of initial symptoms (Fig. 3A; calculated total CT score, from 6 to 10 days). In addition, three patients showed involvement of the central interstitium, and these patients also had the highest CT scores (Fig. 2 E, F, G); however, none of the other patients showed this characteristic.
Fig.3
Average total CT score of every stage and the distribution of the highest total CT score. (A) Average total CT score in each stage; peak total CT score was recorded at stage-2. (B) Distribution of the highest total CT score in every case and the 95% confidence interval (time of the corresponding chest CT scans). On average, peak total CT score was recorded at approximately day 8.
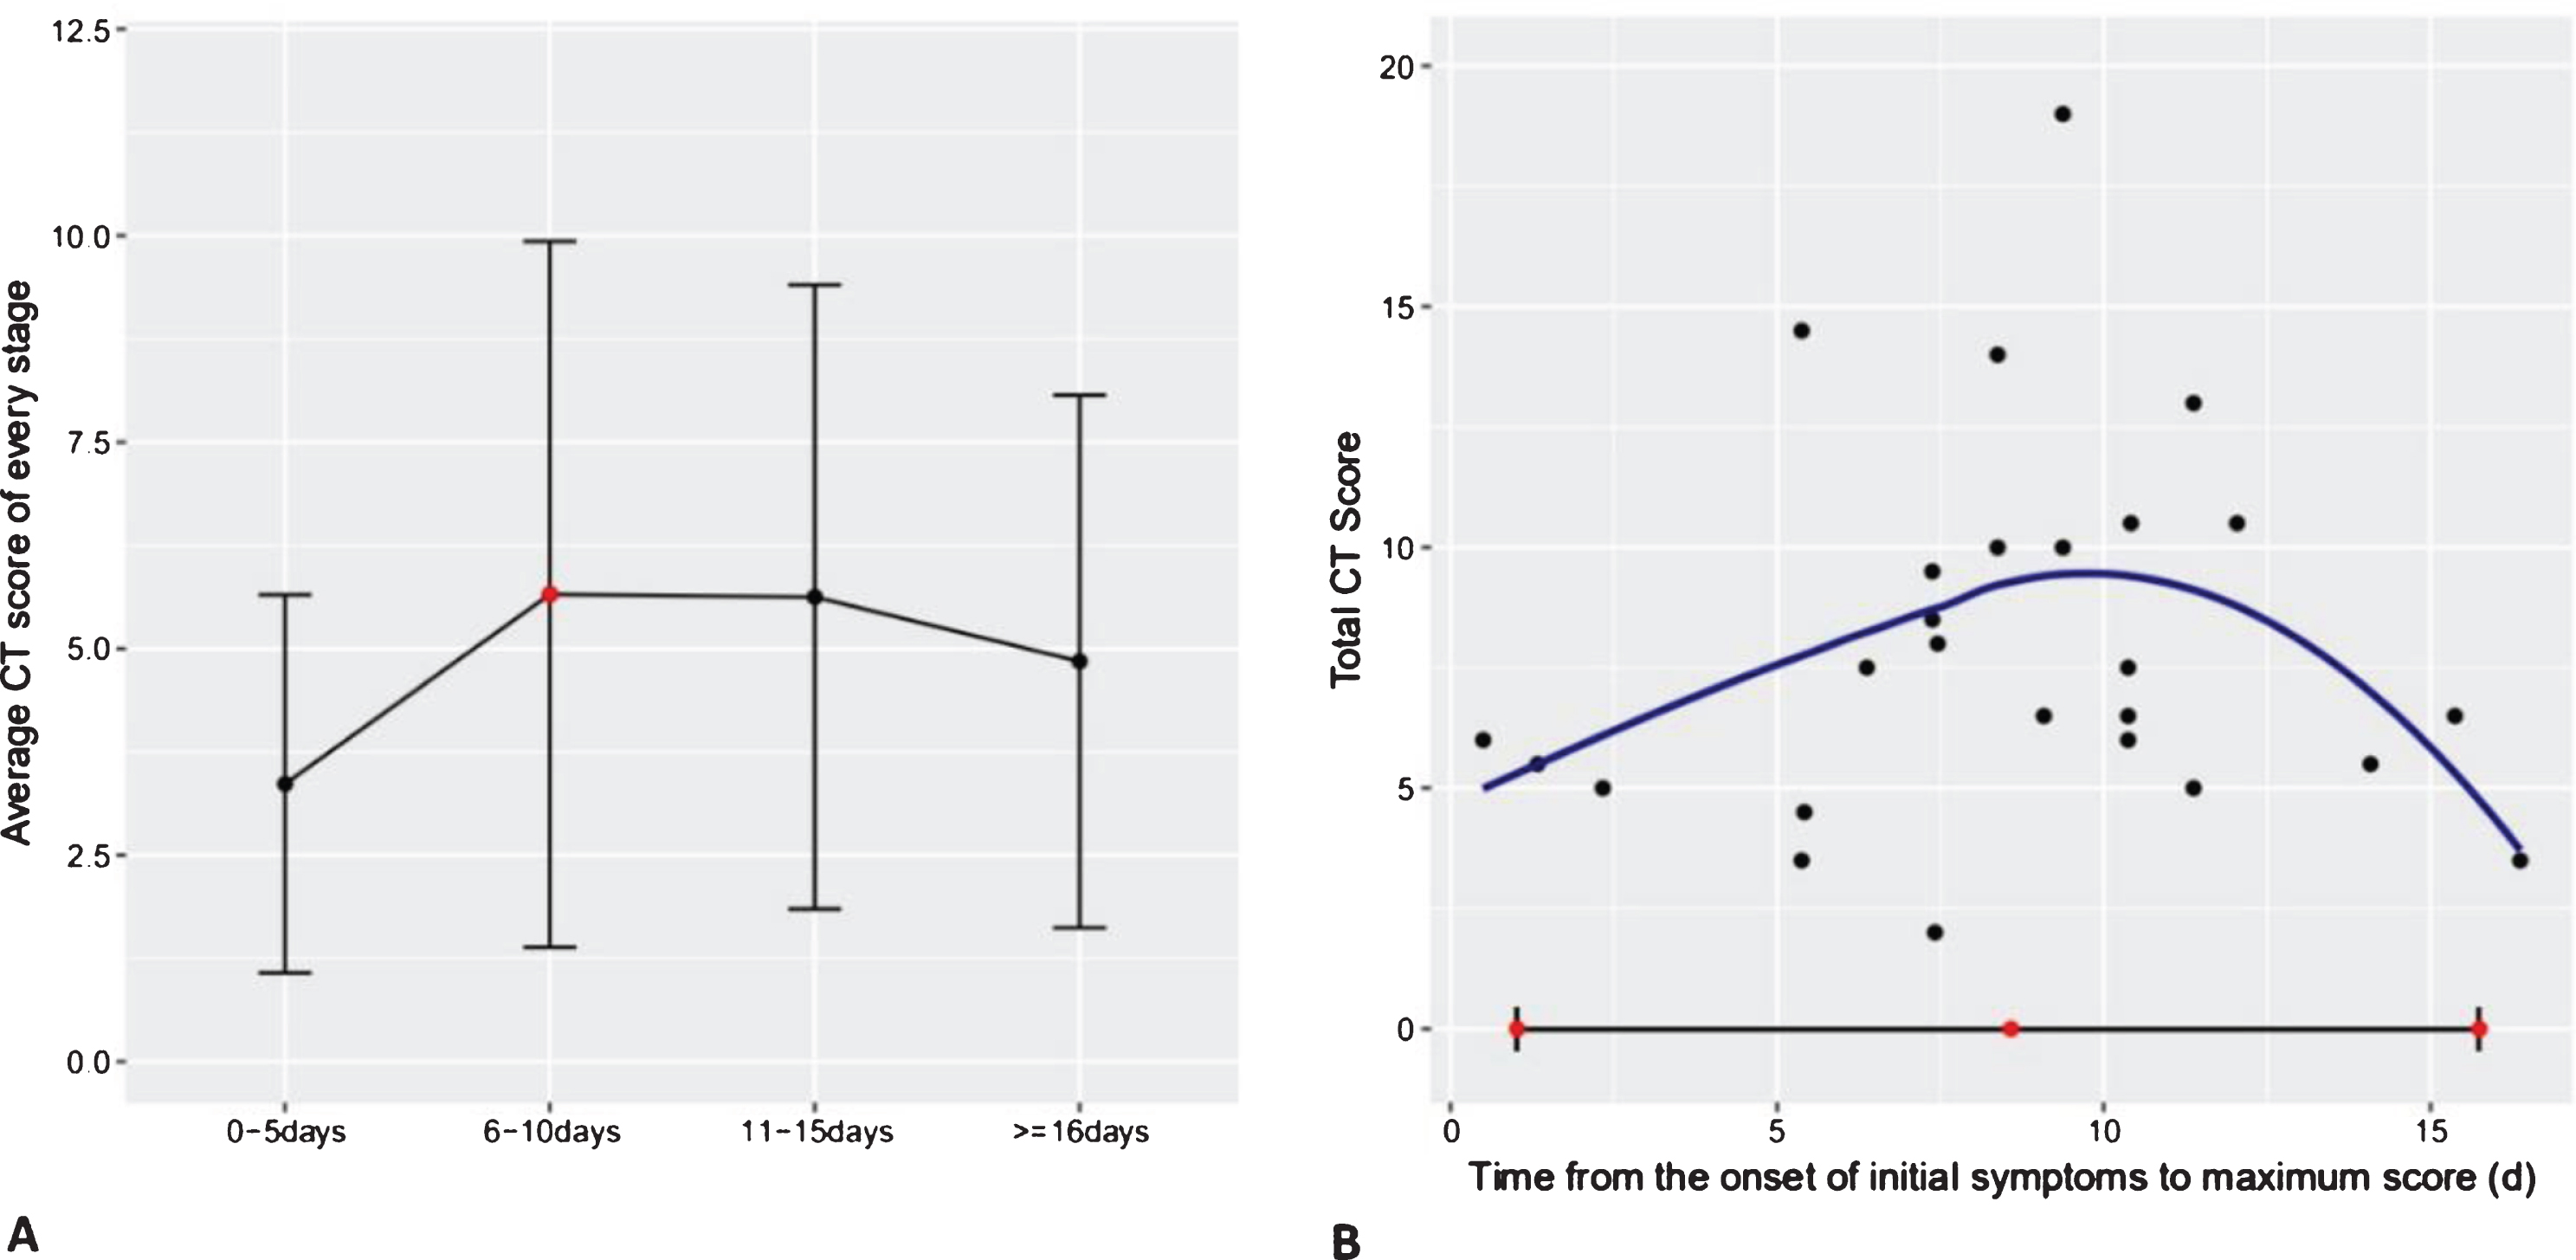
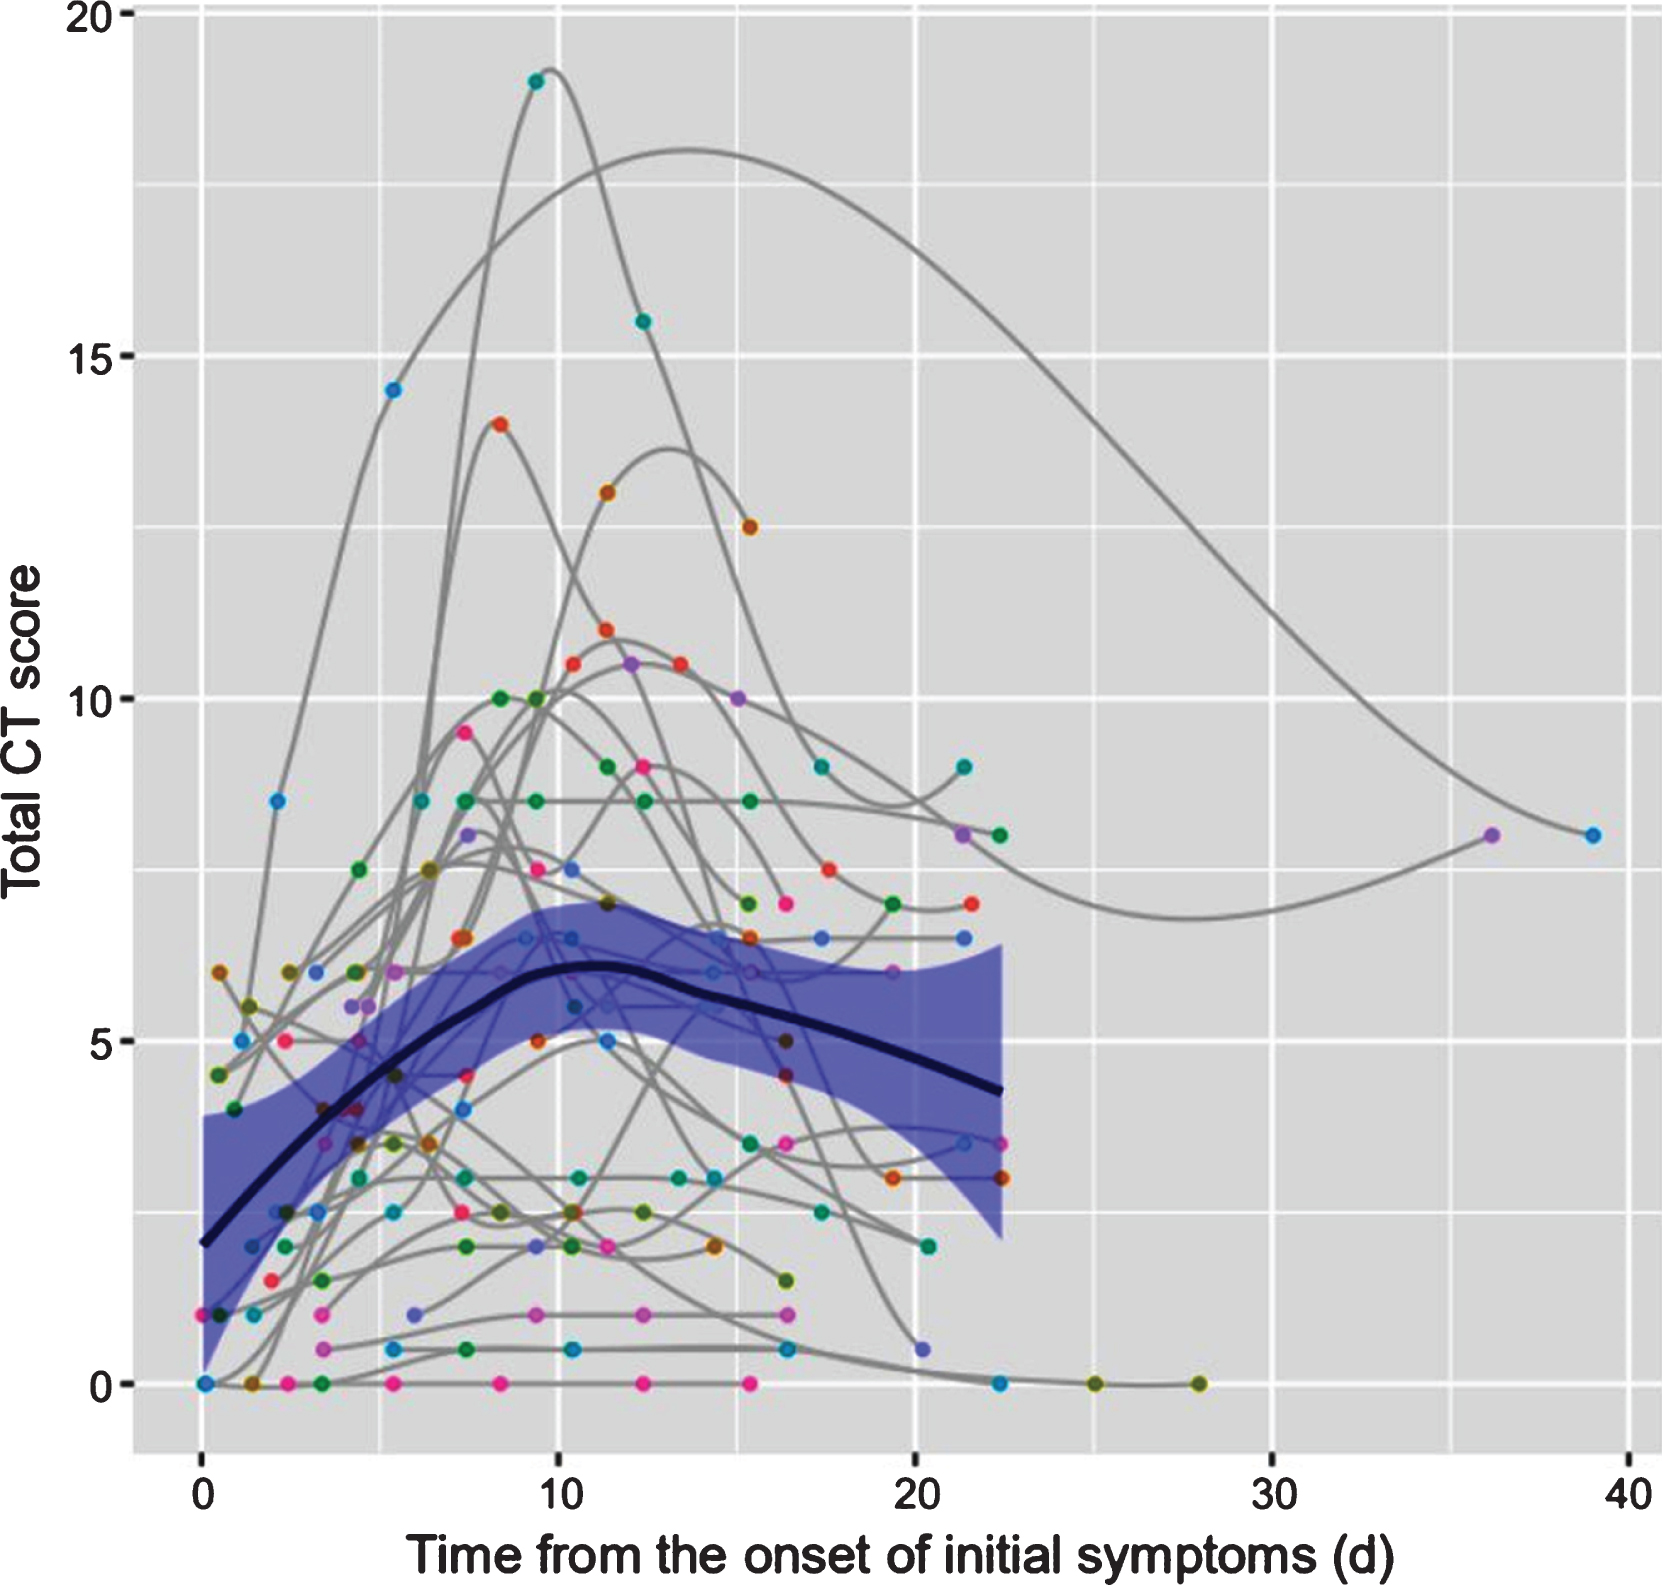
Fig.4
Dynamic changes in total CT score for each patient, on chest CT, from the onset of symptoms (day). Each patient had a different magnitude of CT scores; however, they share a consistent quadratic pattern in that the total CT score increased initially and then decreased during the course.
4Discussion
Patient’s history, clinical symptoms, laboratory tests, and GGO, consolidation, vascular thickening, and bronchial wall thickening are all important factors for the diagnosis of COVID pneumonia. Data show that COVID-19 has ability to be transmitted from person-to person [1, 12–14], with majority of patients having a history of exposure to infected patients. Nonetheless, one patient in our study (3.0%) did not present with symptoms or imaging abnormalities during the early stage of the disease due to a prolonged incubation period following initial infection [10]. It is worth noting that two patients were confirmed to have moderate SARS-CoV-2 infection by consensus despite three negative test results for COVID-19 nucleic acids in our study. It is because many clinical experts believed that bilateral GGOs and consolidation were found in every chest CT scan, and two patients had typical clinical manifestations and exposure history that support the confirmation of SARS-CoV-2 infection. In addition, clinical experts further argue that false-negative results occur because the throat swabs sample from the upper respiratory tract, while SARS-CoV-2 has been reported to accumulate in the lower respiratory tract. Therefore, in people with a certain history of exposure to COVID-19, medical observation, home isolation, and further chest CT examination should be considered regardless of clinical symptoms. Similarly, chest CT and laboratory examinations should be performed for patients with symptoms without history of exposure. It has previously been reported that chest CT has a high sensitivity (≥95.0%) for COVID-19 pneumonia detection [11]. This strongly suggests that chest CT can be used to identify patients who need further testing, as well as to facilitate the early diagnosis of COVID 19 pneumonia and subsequent early treatment.
A previous study identified that GGOs on CT images correspond with pathological diffuse alveolar damage and small airway inflammation [15]. Physiologically, GGO may be caused by alveoli filled with sticky secretions including blood, pus, water, or cells. The CT imaging findings of viral pneumonia are consistent with the pathogenesis of viral infection. Most types of viral pneumonia corresponding to the same Viridae family share similar image findings due to similarities in their pathogenesis [9]. Consequently, the imaging features of SARS-CoV-2 infection (COVID-19) are similar to those of SARS-CoV and MERS-CoV infection since these viruses all belong to the family, Coronaviridae [16–18]. Nevertheless, exudate is more remarkable [19, 20], and pulmonary fibrosis and consolidation are less common features in COVID-19 than in SARS and MERS; the majority of patients with the COVID-19 (SARS-CoV-2) show multifocal involvement in the first chest CT scan. Furthermore, our findings are consistent with a recent autopsy report [21]. However, whether these findings are unique features of SARS-CoV-2 infection remains to be confirmed.
In this study, all patients underwent multiple pulmonary CT scans (at least 4), which provided reliable data on the dynamic radiological pattern of moderate COVID-19 pneumonia progression. Clinicians made the decision on whether to perform CT scans based on the severity of patients’ symptoms or evaluation of the efficacy of treatment. Generally, a patient was examined by chest CT every 5 days based on their experience. As the patient’s condition can change at any time, the scan interval will also fluctuate. Based on the results of our study, there is no significant correlation between CT score and the clinical or demographic data of patients with moderate COVID-19 pneumonia. In this study, the CT score of one of the patients was only 8 at the early stage of the disease. Clinical symptoms were not obvious, and the patient refused to cooperate with treatment, which caused more rapid and widespread disease progression. Finally, their CT score reached 19, while the other patients’ scores did not exceed 15 (score range 0–36). This indicates that the earlier the treatment, the better the effect, and the lower the CT score. It has been shown that the CT score indicates the area of lung involvement in COVID-19 pneumonia as well as the severity of pathology. The wider the area of lung involvement and the greater the proportion of consolidation, and the higher the CT score and the more serious the disease. Furthermore, we found that three particular patients showed involvement of the central interstitium and the highest CT scores, which indicated that patients with involvement of the central interstitium (Fig. 2 E, F, G) were affected more severely than those without. It can be seen from the chart that although each patient has a different magnitude of CT score, they share a consistent pattern in which the CT score first increases quickly and then decrease slowly (Fig. 4). By applying a statistical smoothing model, we found that the pattern across all 33 cases were very similar in that the chest CT abnormalities increased quickly in number and severity of pulmonary lesions at the first stage of the disease, and reached a peak in the second stage (approximately day 8). Thereafter, there was a brief plateau phase and a gradual decline phase (Fig. 5). Most patients who recovered from moderate COVID-19 pneumonia showed the most severe lung lesions on CT at approximately 8 days, and the signs of improvement on chest CT began approximately 11 days after the onset of symptoms, which contrasts with other studies. Following this, the lesions were gradually absorbed, with residual GGO and subpleural parenchymal bands (Fig. 2 A, B, C, D).
This study provides new data to help us better understand disease progression of moderate COVID-19 pneumonia using a CT scoring system. The decline in CT score indicates the transition from progressive stage to convalescent stage. From the time-disease change curve, it is speculated that it requires a long period of time for complete absorption of pulmonary lesions in discharged patients. Secondly, the average CT score of patients at discharge was higher than that of the first stage, indicating that patients meeting the discharge criteria are not completely without lesions identified by CT imaging. However, we believe that in patients for whom it is difficult to judge discharge time, the downward trend of the CT score can be used as a reference index. To the best of our knowledge, this is the first time that this CT scoring system has been to assess disease progression and prognosis in patients with moderate COVID-19 pneumonia.
Our study has some limitations. Firstly, the assessment of disease progression was not perfect, and more follow-up CT data should be collected a month after discharge to study the evolution and prognosis of the disease, and to provide more imaging data related to clinical manifestations. Secondly, a severe COVID- 19 comparison group was not included as most of the patients with severe pneumonia and acute respiratory distress syndrome remain in hospital [11, 22]. Further research will be conducted in this regard.
5Conclusions
The most frequent clinical symptoms of moderate COVID-19 pneumonia were fever and cough, which were often accompanied by abnormal lymphocyte count and increased C-reactive protein levels. Additionally, bilateral multifocal peripheral GGO, consolidation, vascular thickening, and bronchial wall thickening were the most common features on chest CT scan, and most lesions tended to be distributed in the apical and posterior superior segments, and the posterior and lateral basal segments. Furthermore, patients showing involvement of the central interstitium could be more severely affected. Importantly, we show that the CT score increases rapidly in a short period of time and then slowly declines, and that the peak of the disease course occurs in the second stage. Finally, complete recovery of patients with moderate COVID-19 pneumonia, with a high mean CT score at the time of discharge, will require some time. Chest CT can detect lung abnormalities with high sensitivity and assess the severity and dynamic changes in the course of moderate COVID-19 pneumonia. These findings may facilitate early diagnosis and treatment of the disease, thereby aiding containment of this pandemic.
Acknowledgments
The study was approved by Jiangxi Provincial People’s Hospital Affiliated to Nanchang University IRB. The study also followed Jiangxi Provincial People’s Hospital Affiliated to Nanchang University guidelines. Last, the authors would like to express their appreciation for all nurses and doctors, and other hospital staff for their efforts to fight the COVID-19.
References
[1] | Chan J.F. , Yuan S. , Kok K.H. , et al., A familial cluster of pneumonia associated with the novel coronavirus indicating person-to-person transmission: A study of a family cluster, Lancet 395: ((2020) ), 514–523. |
[2] | Wang Y. , Dong C. , Hu Y. , et al., Temporal changes of CT findings in 90 patients with covid-19 pneumonia: A longitudinal study, Mar, Radiology ((2020) ), 19, doi: 10.1148/radiol.2020200843. |
[3] | Han X. , Cao Y. , Jiang N. , et al., Novel coronavirus pneumonia (covid-19) progression course in 17 discharged patients: Comparison of clinical and thin-section CT features during recovery, Mar, Clin Infect Dis 2020 mar 30, doi: 10.1093/cid/ciaa271. |
[4] | Zheng Q. , Lu Y. , Lure F. , et al., Clinical and radiological features of novel coronavirus pneumonia, J Xray Sci Technol 28: ((2020) ), 391–404. |
[5] | Hansell D.M. , Bankier A.A. , MacMahon H. , et al., Fleischner society: Glossary of terms for thoracic imaging, Radiology 246: ((2008) ), 697–722. |
[6] | Chung M. , Bernheim A. , Mei X. , et al., CT imaging features of novel coronavirus -ncov), Radiology 295: ((2020) ), 202–207. |
[7] | National Health Commission of the People’s Republic of China. Diagnosis and treatment protocols of pneumonia caused by a novel coronavirus (trialversion7). Available from: http://www.nhc.gov.cn/yzygj/s7652m/202003/a31191442e29474b98bfed5579d5af95 Published on March 04, 2020. |
[8] | Franquet T. , Imaging of pulmonary viral pneumonia, Radiology 260: ((2011) ), 18–39. |
[9] | Koo H.J. , Lim S. , Choe J. , et al., Radiographic and CT features of viral pneumonia, Radiographics 38: ((2018) ), 719–739. |
[10] | Chang Y.C. , Yu C.J. , Chang S.C. , et al., Pulmonary sequelae in convalescent patients after severe acute respiratory syndrome: Evaluation with thin-section CT, Radiology 236: ((2005) ), 1067–1075. |
[11] | Pan F. , Ye T. , Sun P. , et al., Time course of lung changes on 431 chest CT during recovery from novel coronavirus (covid-19) pneumonia, Feb, Radiology ((2020) ), 13, doi: 10.1148/radiol.2020200370. |
[12] | Chen N. , Zhou M. , Dong X. , et al., Epidemiological and clinical characteristics of 99 cases of novel coronavirus pneumonia in Wuhan, China: A descriptive study, Lancet 395: ((2020) ), 507–513. |
[13] | Xu X. , Chen P. , Wang J. , et al., Evolution of the novel coronavirus from the ongoing Wuhan outbreak and modeling of its spike protein for risk of human transmission, Sci China Life Sci 63: ((2020) ), 457–460. |
[14] | Rothan H.A. , Byrareddy S.N. , The epidemiology and pathogenesis of coronavirus disease (covid-19) outbreak, J Autoimmun 2020 Feb 6, doi: 10.1016/j.jaut.2020.102433. |
[15] | Song F. , Shi N. , Shan F. , et al., Emerging novel coronavirus 2019-ncov) pneumonia, Radiology 295: ((2020) ), 210–217. |
[16] | Huang C. , Wang Y. , Li X. , et al., Clinical features of patients infected with 2019 novel coronavirus in wuhan, china, Lancet 395: ((2020) ), 497–506. |
[17] | Graham R.L. , Donaldson E.F. , Baric R.S. , A decade after SARS: Strategies for 411 controlling emerging coronaviruses, Nat Rev Microbiol 11: ((2013) ), 836–848. |
[18] | Zhu N. , Zhang D. , Wang W. , et al., A novel coronavirus from patients with pneumonia in China, N Engl J Med 382: ((2020) ), 727–733. |
[19] | Ooi G.C. , Daqing M. , SARS: Radiological features, Respirology 8: Suppl (Suppl 1) ((2003) ), S15–S19. |
[20] | Das K.M. , Lee E.Y. , Langer R.D. , Larsson S.G. , Middle east respiratory syndrome coronavirus: What does a radiologist need to know?, AJR Am J Roentgenol 206: ((2016) ), 1193–1201. |
[21] | Liu Q. , Wang R.S. , Qu G.Q. , et al., Anatomy of a New Coronavirus Pneumonia Death Corpse System, Journal of Forensic Medicine 36: ((2020) ), 21–23. |
[22] | Wang D. , Hu B. , Hu C. , et al., Clinical characteristics of 138 hospitalized patients with novel coronavirus-infected pneumonia in Wuhan, China, JAMA 323: ((2020) ), 1061–1069. |


