
A closer look at the prevalence of time rule violations and the inter-point time in men’s Grand Slam tennis
Abstract
Paragraph 29a of the official ITF Rules of Tennis sets a limit of 20 seconds for the time players can take between points. This study investigates the prevalence of violations of this rule, the corresponding umpire’s behavior and factors that influence the inter-point time in general. Regression analysis of 3475 serves of the 2016 Australian Open Men’s Singles tournament showed an autonomous influence on the variance of the inter-point for the serving player, the duration of the previous rally, the service game, the current scoring streak and the importance of the point. The average time between points was 21.5 seconds and time rule violations were found for 58.5% of the serves. Only two (0.1%) of these rule violations were penalized by the umpire, with the punished incidents occurring after 23.5 and 25.6 seconds, representing the 65.9th and the 78.1th percentile respectively of the detected inter-point times. Thus, we concluded that the current rule is not just applied too lax but also capriciously. Based on the detected influences on the time between points we suggest various adaptions of the rule, e.g. a dynamic time limit based on the duration of the previous rally, as well as ways to improve the enforcement of the rule, e.g. technological officiating aids.
1Introduction
Rule 29 of the International Tennis Federation’s (ITF) Rules of Tennis defines several constraints in order to assure that “play [is] continuous, from the time the match starts (when the first service of the match is put in play) until the match finishes” (ITF, 2016b, p. 14). In recent years, a condition of section 29a, which determines the maximum amount of time between points, has especially attracted attention. In 2012, the Association of Tennis Professionals (ATP) adapted the penalization for violations of this rule, to support the umpires in enforcing it. In addition, the Grand Slam Board decided in November 2017 to introduce a shot clock at the 2018 Australian Open (ITF, 2017). This shows that stakeholders at least perceive – as there are no scientific studies yet – a lack of application of this part of rule 29 (hereinafter referred to as “time rule”) and even try to implement interventions.
Previous works, which were conducted without reference to the time rule, indicate the presence of rule violations. O’Donoghue and Ingram (2001) obtained the time between serves as well as points at all Grand Slam tournaments held between May 1997 and January 1999 and found an average time of 18.3 to 19.5 seconds between points, depending on the tournament. These averages are just short of the maximum of 20 seconds, which is allowed between points at Grand Slam tournaments, and the standard deviations are minimum 1.6 seconds for all four tournaments. Thus, even without knowing if the respective data were normally distributed, we can assume that the observed inter-point times included time rule violations. Studying professional tennis players at the Australian summer and autumn tennis circuits, Hornery, Farrow, Mujika, and Young (2007) even found an average time of 25.1 seconds for matches played on hard court, but they do not provide any information about the applied rules for these matches.
Both these studies also discuss physiological influences on the time taken between points. O’Donoghue and Ingram (2001) assume that the significantly longer inter-point times at the French Open are related to the longer rally durations on clay courts. Thus, the players take some extra time for recovery. Hornery et al. (2007) support this theory despite converse relations between hard and clay courts and conclude that further physiological variables need to be considered, for example temperature. This assumption is in accordance with the findings of Périard et al. (2014), who investigate the influence of heat on inter alia match play characteristics. The twelve participants of their study, male players of different performance levels, took on average a 9.6 second longer break between two points in hot conditions.
Besides these physiological factors, the duration of interruptions can also be influenced by tactical intentions. There is already a decent scientific knowledge base about the tactical use of timeouts in several game sports. Zetou, Kourtesis, Giazitzi, and Michalopoulou (2008) found that timeouts in volleyball are predominantly used by coaches if their team is trailing and conclude that, besides adapting the tactical approach of their team, these timeouts should disrupt the rhythm of the opponent. Gomes, Volossovitch, and Ferreira (2014) found the same patterns for handball and that timeouts are predominantly taken in the later stages of the match or halves respectively. The total score of a match is not able to serve as an indication of any concept of momentum, which is suggested to be influenced by timeouts (In basketball: Smisson, Burke, Joyner, Munkasy, and Blom, 2007). This is rather true for the short-term development of the score line or the offensive and defensive efficiency prior to timeouts, which was also screened by Gomes et al. (2014). They were able to confirm a higher likelihood for timeouts taken if a team experienced an unfavorable trend of the short-term development of the score.
In tennis, there are no regular timeouts, except for medical reasons, that can be demanded by players during service games. However, players can vary the time between serves up to the maximum time allowed between points. They can even try to further extend the duration of this interruption, testing the umpire’s willingness to enforce the time rule and potentially risking a warning or penalization. If the players would try to achieve the effects that are suggested for other sports, such behavior would be rather found for important points or phases in which they are outperformed by their opponents.
Therefore, this study tries to contribute to the knowledge base of two phenomena. On the one hand, we investigate the prevalence of rule violations and the related umpire’s behavior. On the other hand, we attempt to define the influence of a variety of factors on the time between points ant their respective relationships to rule violations. Based on the outlined concepts, the investigated factors are the duration of the previous rally (physiological), the number of played sets as well as service games (physiological and tactical), the current scoring streak (tactical) and the importance of the point (tactical). Further, the involved players were also included as factors, as we assumed that the time taken between points varies from player to player.
2Methods
2.1Data recording
The overall sample consisted of 6231 rallies that were collected from 21 matches of the 2016 Australian Open Men’s Singles tournament. 24 players (nPlayers) with an average ATP-ranking of 33.7 (SD: 45.1) were involved in these matches, including all but one of the Top 10 players of the ATP rankings prior to the start of the tournament. The videos were recorded from the common broadcast using the software oCam (OH!SOFT). The following data were collected for each rally using a self-designed observational system: Serving player, receiving player, current score, whether it was a first or second serve, the number of strokes in the rally, the winner of the rally and the time between points. The starting point of these periods of times was defined as the moment when the ball was out of play, meaning that either the ball bounced twice or the trajectory of the ball ended in the net or out of bounce. Ending point of the period was the moment the player actually struck the ball in order to conduct a serve. Both these points are in accordance with the respective section of the official Rules of Tennis of the ITF (2016b). Further we collected if one of the following exceptional events happened in the period between points: Line calls via Hawk-Eye, player changes equipment, umpire overrules line judge, umpire demands the audience to be quiet, other player appeals and warnings.
2.2Reliability
The inter-operator agreement of the observational system was investigated by comparing the logging of data for 132 rallies of the observer with those of two independent observers. Cohen’s kappa was calculated for all but two variables, the number of strokes and the time between points. The inter-rater agreement of those two metric variables, the Pearson product-moment correlation coefficients and descriptive statistics to describe the differences in detail were calculated.
Cohen’s kappa was calculated for the serving player, the current set, the current service game, the serve (first or second) and the winner of the rally. A perfect inter-rater agreement was reached for all of these variables (Cohen’s kappa equals one for each). For the number of strokes the correlation coefficient was 1.00, with the percentage of agreement being 99.2%, meaning that only for one of the 132 rallies a different number of strokes was collected. For the time between points the correlation coefficient also reached 1.00, with a maximum difference of 0.9 seconds and 95% limits of agreement of –0.41 and 0.44 seconds. The mean absolute difference was 0.16 seconds and the mean relative difference 1.15%.
2.3Data processing
The variables Set (current set), Game and Tiebreak (current service game), PrevRL (number of strokes of the previous rally) and the serving player could be taken from the collected data without further procedures. Streak, the current scoring streak in a service game before a serve was taken, was extracted from the changes in the score line. Due to the unique scoring system in service games, there can’t be another serve in a game if a player wins five points in a row (which can only happen if a player faces a 0–40 deficit). Thus, this variable ranges from –4, the serving player lost the last four points, to +4. Further, points were labelled as Important Points if the receiving player had won more than two points in a service game. This represents, in other words, all scores in which the receiver was less than one point away of gaining a break ball or breaking the serve and all scenarios in which the serving player had exactly one game point.
Previous studies showed that the time between first and second serves is significantly shorter than the time between points and on average at least nine seconds below the time limit with standard deviations between 0.9 and 1.5 seconds. Based on these findings and the fact that the time between first and second serves is not explicitly stated in the official rules of the ITF, we decided to limit our analysis to first serves. Further, we decided to exclude any points that included one or more of the defined exceptional events, as the respective cases are not defined by the official rules of the ITF. 727 of the remaining 4202 serves were taken under circumstances for which the time rule does not apply, including the first serve of a service game, serves at odd scores in a tie-break or serves after the players changed sides. Thus, a sample of 3475 serves was used to conduct the statistical analysis.
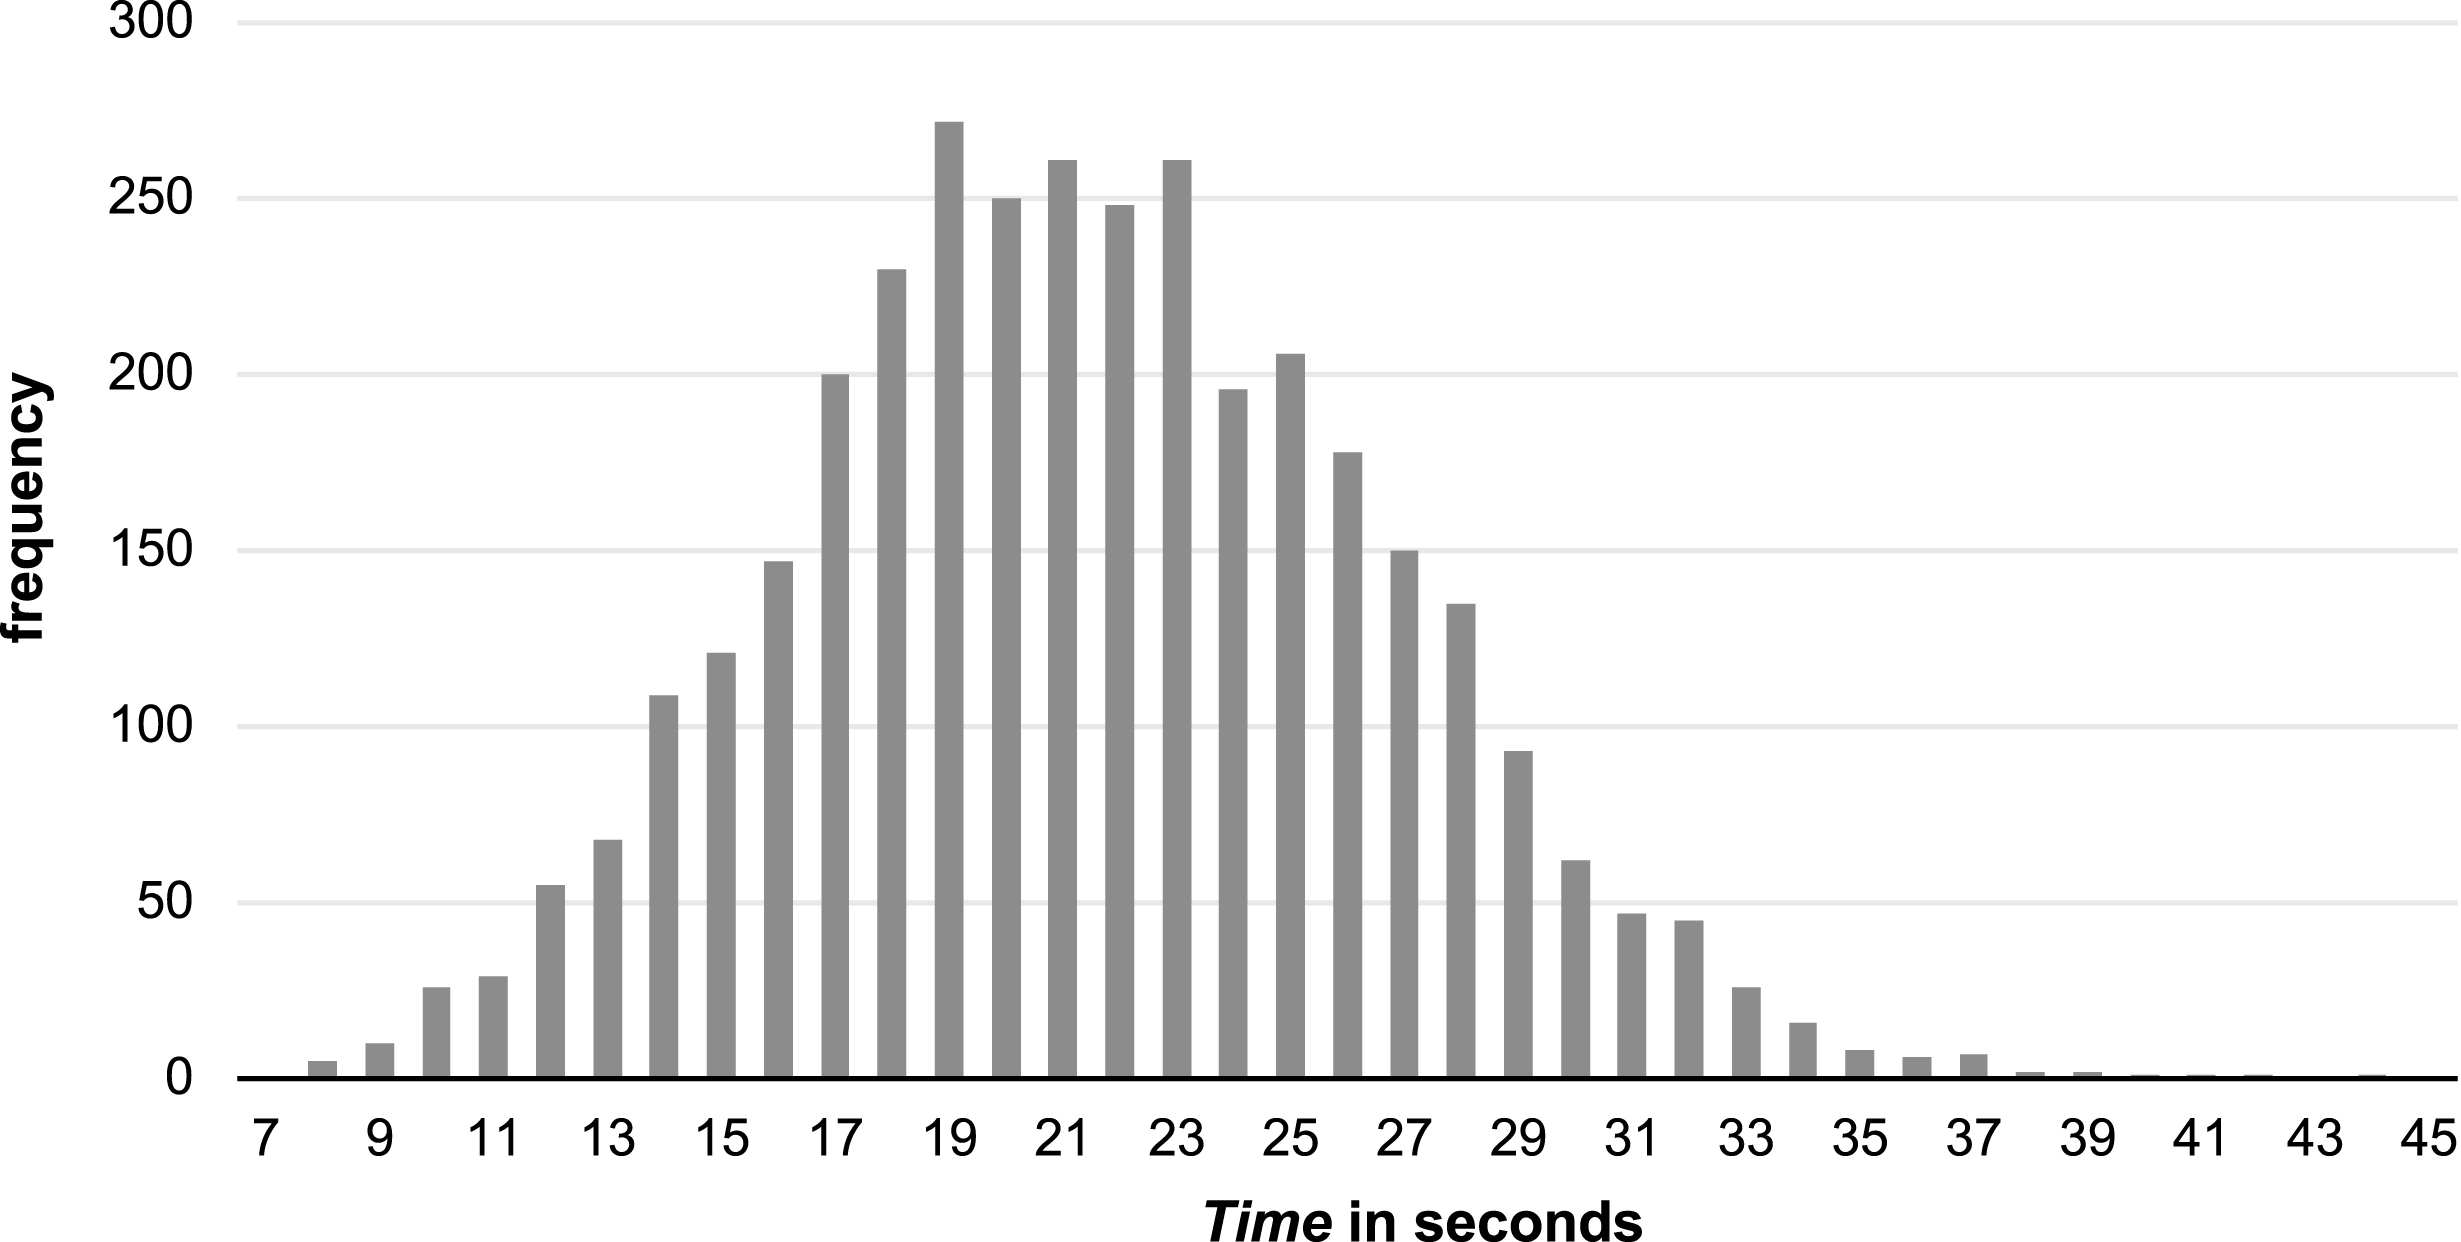
Fig.1
Histogram of the inter-point time grouped in seconds.
2.4Statistical analysis
After the prevalence of rule violations is examined using descriptive statistics, two regression models will be run to define the factors influencing the duration of interruptions between points (Time). Seven to 29 variables are included in the model, representing physiological, tactical and individual influences. The dependent variable Time, the number of strokes of the previous rally (PrevRL) and the current scoring streak (Streak) were z-transformed for the regression analysis. The service game (Game) and the set (Set) are included without further transformations. This decision was made regarding the interpretation of the correlation coefficients, as it is more valuable to show the increase or decrease of Time per service game or set instead of per standard deviation of Game or Set. Both Tiebreak and Important Points in a service game are dummy variables that equal one if the respective interval fulfills the demanded conditions and zero if not.
We expected inter-individual differences in the time between serves and therefore needed to adapt the model. However, it is not the goal of the study to generate knowledge about an increase or decrease of the time between points that is affected by player x or player y. We rather wanted to show how much of the respective variance is explained by inter-individual differences. Thus, we decided to include the z-transformation of an individual variable Player_Mean, which equals the average time a player took between serves. Nevertheless, we compared the overall model to a model in which we included nPlayers-1 dummy variables as individual variables, to check for differences in goodness of fit as well as in the partial derivatives. The data processing and the transformation of the variables were performed in Microsoft Excel 2016. All the statistical analyses were conducted in R (R Development Core Team, 2015).
3Results
3.1Prevalence of rule violations
The average time between points is 21.5 seconds (SD: 5.20), so on average 1.5 seconds higher than the limit of 20 seconds. As illustrated in Fig. 1, the time rule was violated in 58.5% of all the respective interruptions. For 24.8% of the inter-point times the time limit is exceeded for more than 5 seconds and for 5.2% more than 10 seconds. Two of the 2034 time rule violations, representing 0.10%, were penalized by the umpire.
3.2Influences on the inter-point time
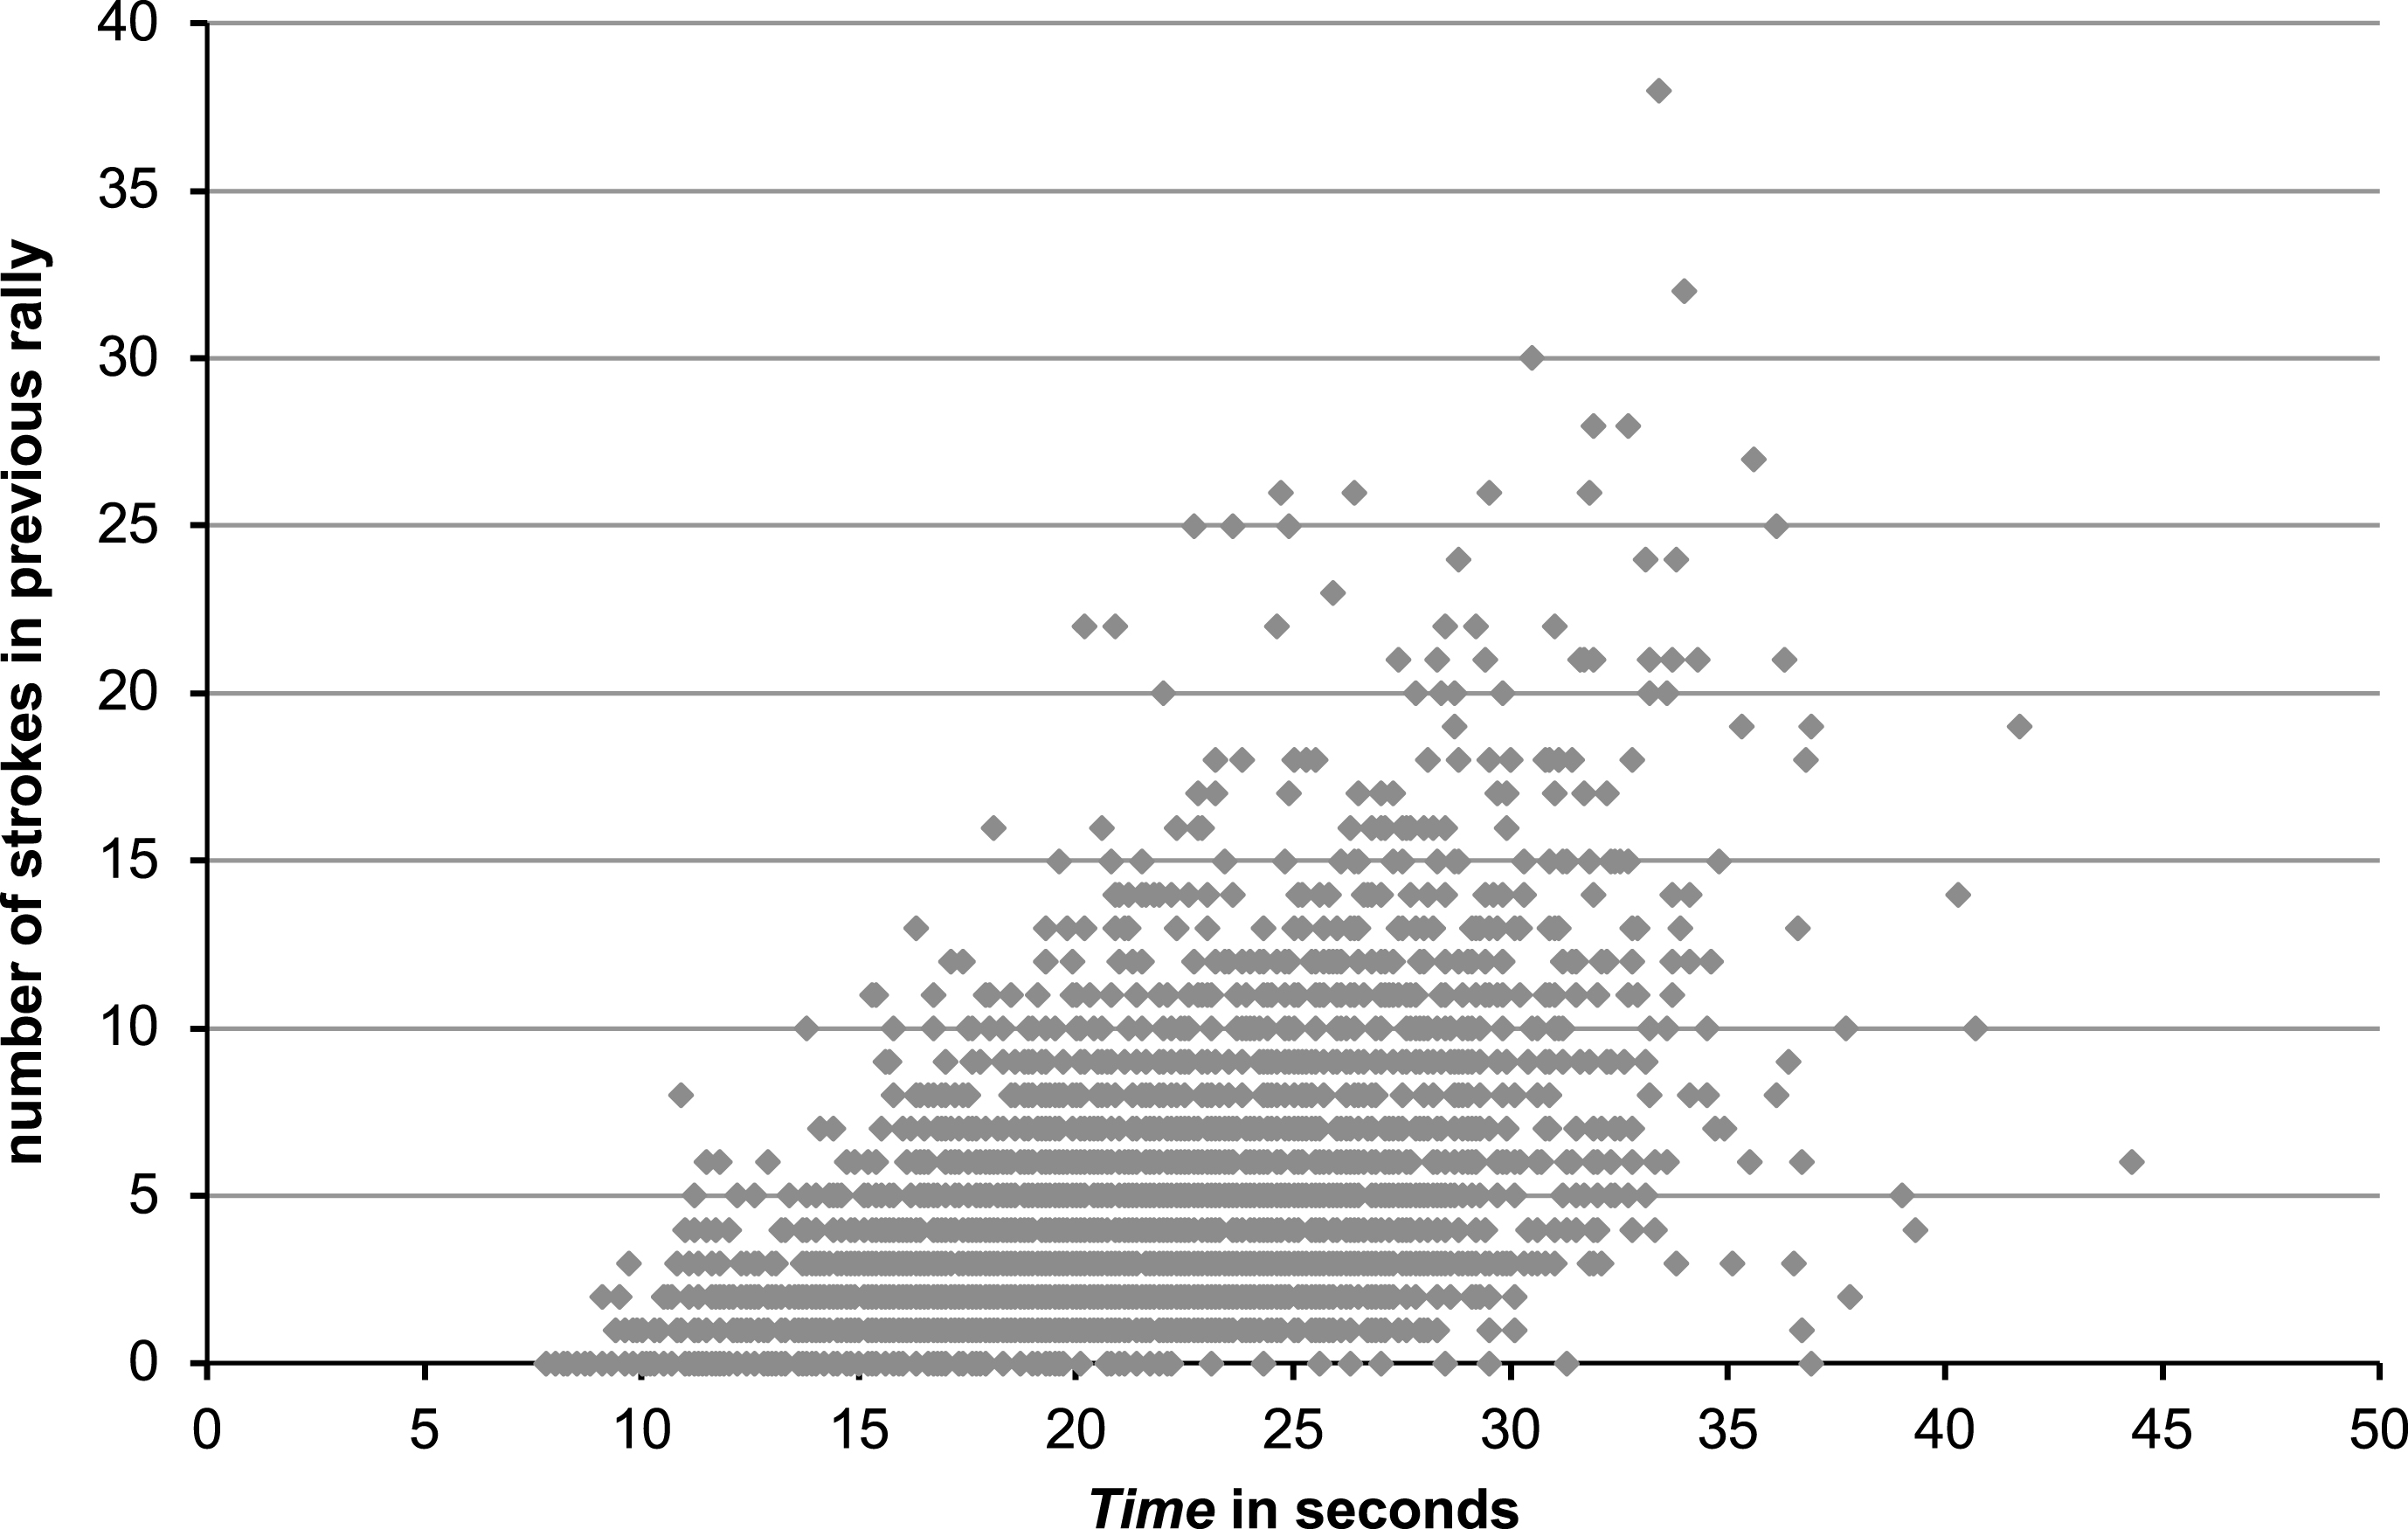
Column one of Table 1 shows the mean values and standard deviations of the included predictors. As Important Point and Tiebreak are dummy variables, the respective means state the frequency of time intervals that fulfil the respective definition. Thus, 42.4% of the intervals are marked as important points and 0.83% of all the included serves took place in a tiebreak. The correlations of all variables, excluding the dummy variables for the players, are listed in the second column of Table 1. All predictor variables significantly correlate with the dependent variable, with Player_Mean (r = 0.50, t = 34.4, p < 0.001) and PrevRL (r = 0.50, t = 34.1, p < 0.001), which is illustrated as scatterplot in Fig. 2, showing the highest correlation coefficients.
Table 1
Descriptive statistics and the correlation coefficient with the inter-point time for all variables included in the summarized Models “Fix” and “Dummies”
| Descriptive | Correlation with Time | Model “Fix” | Model “Dummies” | |
| Mean±SD | r (t-value) | Coefficients (t-value) VIF | ||
| Player_Mean | 21.5±2.62 | 0.504*** (34.4) | 0.483*** (43.1) 1.03 | |
| PrevRL | 4.69±4.13 | 0.500*** (34.1) | 0.418*** (37.2) 1.03 | 0.450*** (39.5) 1.11 |
| Game | 4.47±2.93 | 0.117*** (6.97) | 0.024*** (6.19) 1.06 | 0.024*** (6.40) 1.07 |
| Set | 2.44±1.12 | 0.036* (2.12) | 0.002 (0.19) 1.02 | 0.008 (–0.78) 1.11 |
| Important Point | 0.42±0.49 | 0.314*** (19.5) | 0.516*** (21.5) 1.15 | 0.545*** (22.9) 1.19 |
| Tiebreak | 0.01±0.09 | 0.086*** (5.10) | 0.635*** (5.05) 1.07 | 0.646*** (5.21) 1.08 |
| Streak | 0.44±1.60 | –0.255*** (–15.6) | –0.119*** (–10.0) 1.15 | –0.119*** (–10.2) 1.16 |
| Individual Dummies | excluded | included | ||
| Intercept | –0.336*** (–10.0) | –1.379*** (–17.9) | ||
| Goodness of fit | ||||
| F (df, n) | 673.8*** (7,3467) | 175.4*** (29,3445) | ||
| R2 | 0.576 | 0.596 | ||
| Adjusted R2 | 0.575 | 0.593 | ||
(* = significant on 0.05 level, ** = significant on 0.01 level, *** significant on 0.001 level).
Fig.2
Scatterplot of the inter-point time in relation to the number of strokes in the previous rally.
The bar plots in Fig. 3a, 3b, 3c and 3d show the mean values for the dependent variable Time of the different classes of the variables Game (3a), Set (3b), Streak (3c), as well as Tiebreak and Important Point (3d). Further, the grey line illustrates the number of serves for each class.
Fig.3
Bar plots of the mean inter-point times (primary axis) for the variables Game (3a), Set (3b), Streak (3c), Tiebreak and Important Point (3d). The grey line illustrates the sample size, i.e. the number of serves, of the respective category (secondary axis). Groups that differ significantly are marked above the respective bars in 3a, 3b and 3c. In 3d those are marked with an asterisk.
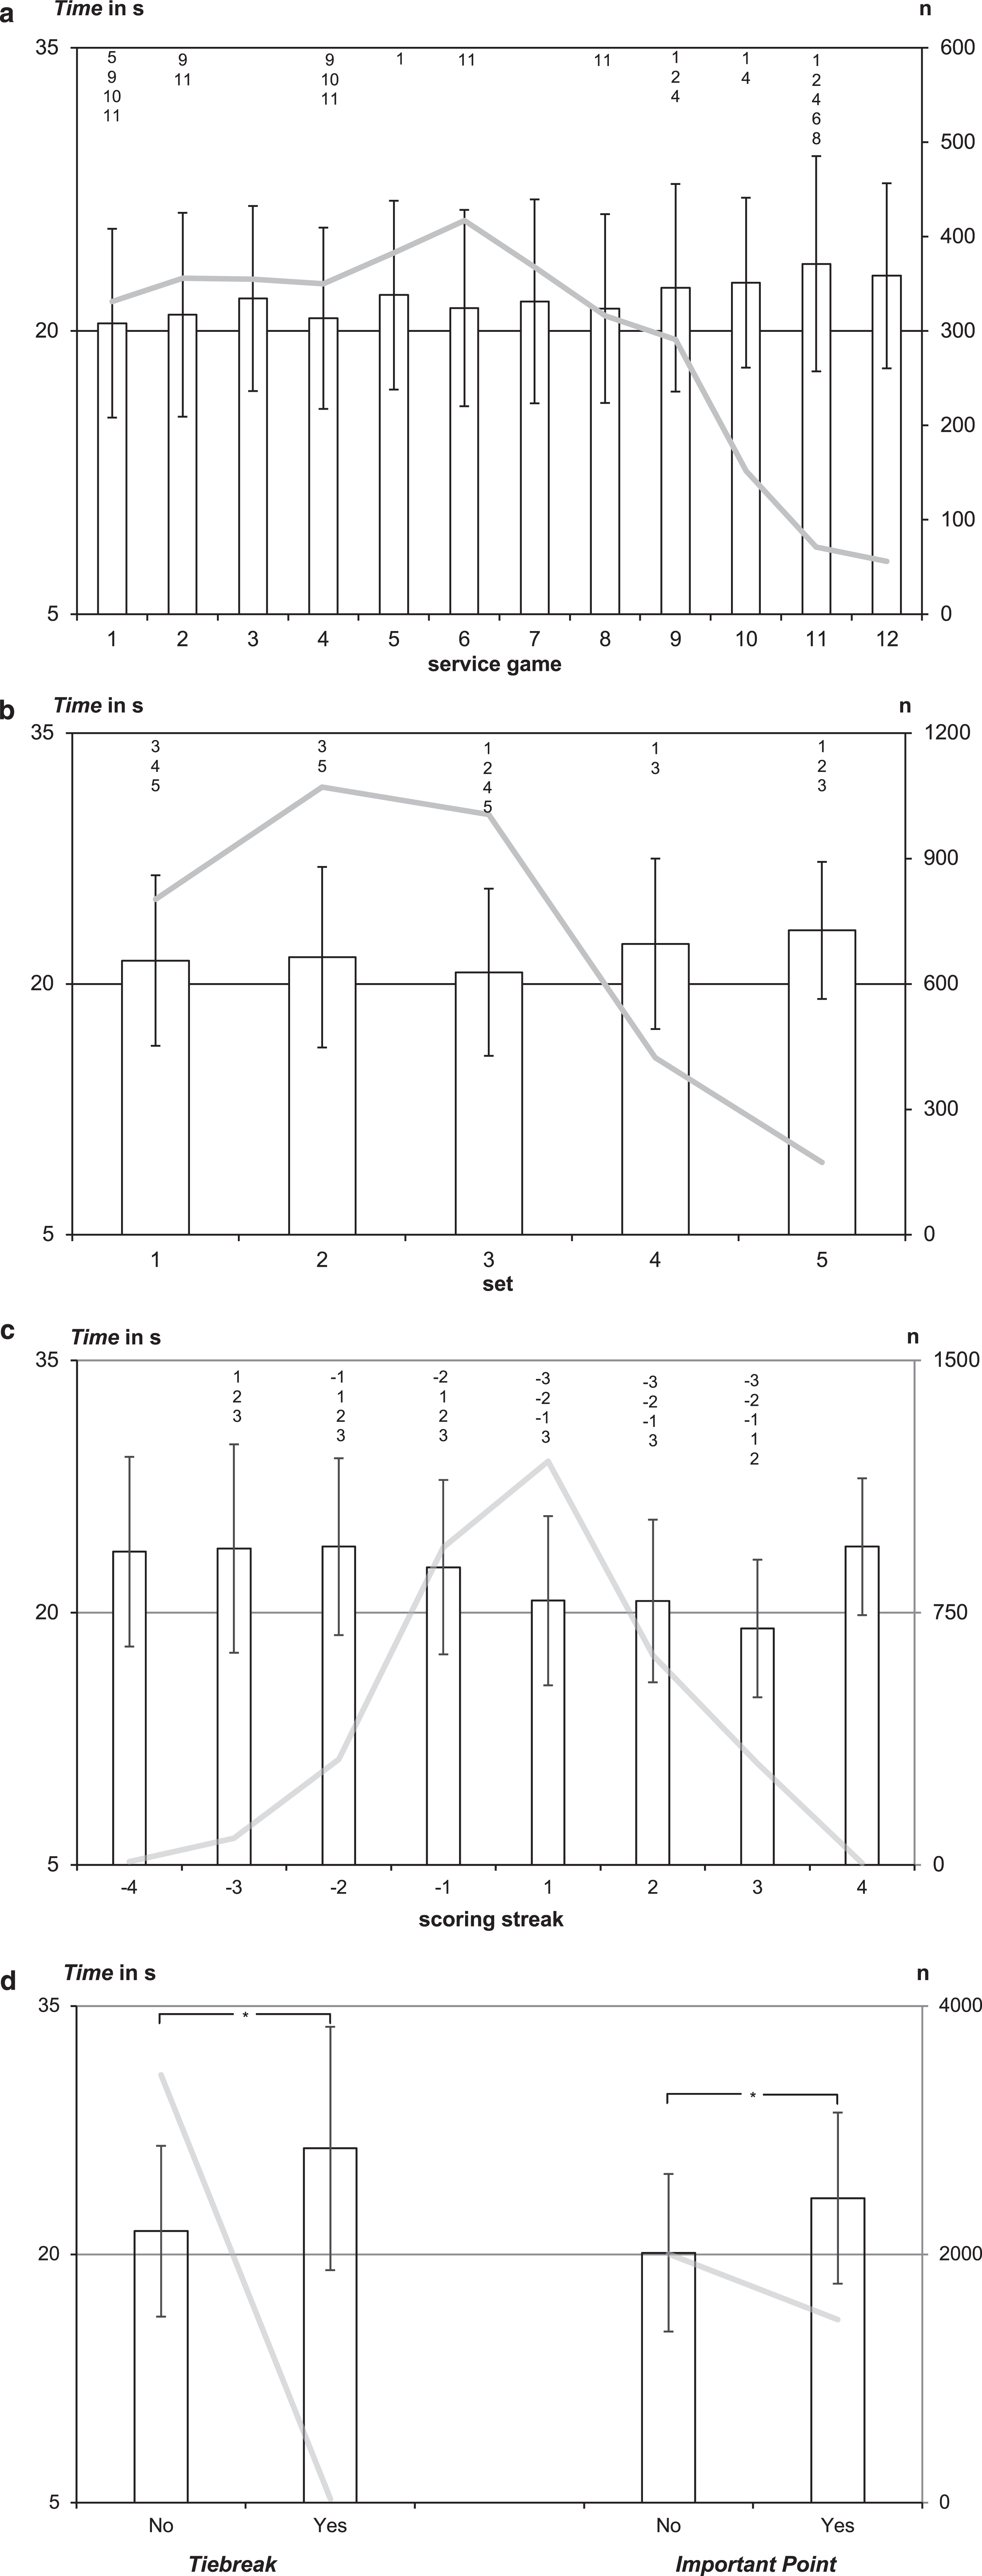
Mean values for the inter-point time in service games vary from 20.4 seconds (first game) to 26.4 seconds (twelfth game). The Bonferroni adjusted comparisons of the duration between points in service games showed eleven significant differences, predominantly between early and late games of a set (Fig. 3a), as after game seven none of the service games shows a mean duration under 22 seconds.
The average duration of interruption grouped by Set varies from 20.7 seconds (third set) to 23.2 seconds (fifth set). The third set is significantly differing from all the other sets, whereas set one and set five show the same pattern as the service games, differing significantly from all the late and early sets respectively (Fig. 3b).
The results for the scoring streaks show significant differences for every pair when comparing positive streaks with negative streaks, except for streaks of -4 and 4 points, which only occurred 16 times in total. If the last point was won by the opponent, the average inter-point time is over 22.7 seconds, while it is below 20.7 if the serving player won the last point (Fig. 3c).
There are also highly significant differences in inter-point times for points played in a tiebreak and those played in regular service games (t = 3.60, p = 0.001), showing on average 5.0 second longer interruptions in tiebreaks. For the difference between regular points in a service game and Important Points, the difference on average is 3.3 seconds, which differ highly significant as well (t = 19.2, p < 0.001) (Fig. 3d).
In the third column of Table 1 Model “Fix” is summarized (F (7,3467) = 673.8, R2adj = 0.575, p < 0.001), which includes all variables except the player dummies. As the dependent variables as well as the variables Player_Mean, PrevRL and Streak were z-transformed, the respective regression coefficients can be read as standardized coefficients. The independent variable Set shows no significant influence on the dependent variable Time, after controlling for the other predictors, which all reach highly significant values (each p < 0.001). Regarding the metric predictors, Player_Mean shows the highest coefficient, as an increase of one standard deviation increases Time by 0.48 standard deviations (0.42 for PrevRL and 0.12 for Streak). If a serve is conducted in a tiebreak, the value for Time goes up by 0.64 standard deviations, and by 0.52 if a point is defined as an Important Point. The coefficient for Game, which was not standardized, can be interpreted as an increase in Time of 0.02 standard deviations for each game played in a set.
Model 2 includes dummy variables for the serving player instead of Player_Mean, to check if the individual influence on the dependent variable is properly controlled in Model 1. The inclusion of these 23 variables, while excluding Player_Mean, lifts the adjusted R2 by 0.018 to 0.593 (F (29,3445) = 175.4, p < 0.001). There is no influence on the significance levels of the other predictors and the maximum change in a coefficient is 0.032.
4Discussion
The main objectives of this study were to build a knowledge base about time rule violations in tennis and to identify and describe factors that influence the time between points in general. The serving player, the duration of the previous rally, the service game, the current scoring streak and the importance of the point showed an autonomous influence on the variance of this duration, whereas the set does not. While it was not the main objective of the study to examine the influence of the players, it should be noted that this individual variable showed the highest impact on the dependent variable. Player_Mean shows the highest correlation with Time and excluding it of the applied model would produce a drop of for the adjusted R2 from 0.575 to 0.349. As it may have already been a well-accepted public perception that some players take more time between points, the results of this study provide empirical evidence.
The duration of the previous rally also showed an enormous impact on the duration of interruptions between points. This supports the assumptions of O’Donoghue and Ingram (2001) and Hornery et al. (2007). Both these studies did not screen for the rally length in relation to the inter-point time, but rather came to a conclusion based on the average duration on different surfaces. The explicit inclusion of this variable in this study showed further, that the inter-point time is under the demanded threshold of 20 seconds for only 8.5% of the time, if the previous rally was ten strokes or longer. After the 102 rallies of the sample that consisted of rallies with at least 15 strokes, only 2 times (1.8%) the following serve was taken within 20 seconds.
As the length of the previous rally can be seen as a – at least predominantly – physiological factor, this is not true for the variables Set and Game. On the one hand, the number of service games or sets played serve as indicator for the length of the match until this point. On the other hand, they also illustrate different phases in a match, which can be of various importance. Losing a service game early in a set leaves a tennis player with more chances to re-break his opponent than losing a service game in the late stages of a set. Also, the stakes in the first two set are lower by nature, as losing one of these sets cannot result in losing the entire match directly, which is true for at least one player in set four and both players in set five. Thus, the increase of the inter-point time for later service games and the tiebreak should not exclusively be seen as a physiological response. This is supported by the results found for Important Points that showed an increase of this time period of 16.4% for those points that were defined as important points.
The findings of the influence of scoring streaks also provide indications that tactical components affect the inter-point time. Those are significantly longer after the receiving player has won the previous point. As there are no time outs in tennis that can be called by players, except for medical reasons, this could be a way to try to disrupt the rhythm of the opponent. This would be in line with findings form other sports in which time outs are used by teams for these exact reasons (Volleyball: Zetou et al., 2008; Handball: Gomes et al., 2014).
To summarize, there are indications that players use some extra time between points to recover, to disrupt the rhythm of the opponent and to increase the focus ahead of decisive points. However, the length of this window is controlled by rule 29 of the official Rules of Tennis of the ITF and should not exceed 20 seconds (2016b). One goal of this study was to examine the prevalence of violations of this rule and the related umpire’s behavior. We found rule violations for 58.5% of all screened intervals, with extensions of the duration to up to 44.3 seconds. This maximum time taken by a player between points was not penalized by the umpire, as 99.9% of all time rule violations. The warnings of the umpires occurred after 23.5 and 25.6 seconds, which both are values that are not even one standard deviation higher than the mean. 23.5 seconds represent the 65.9th percentile, 25.6 seconds the 78.1th percentile. This indicates that the current rule is not just applied inappropriately but also capriciously.
As we expect that the referees are aware of the rule and as it is a comparatively easy setting for an umpire to detect rule violations, since the umpires are equipped with a stopwatch (ITF, 2016a), this could be an issue of unwritten rules. Unwritten rules can be defined as some kind of conventions, which are not official and often implicit, that determine how rules are applied under certain circumstances (D’Agostino, 1995). This would be the case if there is some kind of implicit agreement that violating the time rule is just a harmless trivial offence, which should not be punished by the umpire. Or rather spoken, which should not be punished with the loss of a serve or even a point, as required by the official rules for subsequent violations (ITF, 2016a).
An explanation for the lack of application of the time rule in Grand Slam tennis could be the difference to the rules applied by the ATP, which permits a break of 25 seconds between serves (ATP, 2016). The 2018 Australian Open will also be the first major tournament that allows 25 seconds as well (ITF, 2017). However, for 24.8% of the serves even this 25 seconds window is exceeded. A further explanation could be that the different influences on the inter-point time described above could affect the application of this rule as well. While it seems rather unlikely that an umpire awards more time to the serving player to interrupt the rhythm of his opponent, this could at least be conceivable for recovery reasons or ahead of important points.
This does not mean that the granted extra time for these reasons would be free of ethical and jurisprudential issues. So-called temporal variance is a well discussed topic in legal philosophy. Temporal variance occurs if rules are applied differently under certain circumstances, especially in later stages of a game, the so-called crunch time. This phenomenon is harshly criticized by Standen (2013), as in his opinion the wrong enforcement of rules always has negative impacts. The offending athletes gain an underserved benefit by not being penalized, which vice versa means the opponents are robbed of an advantage. Standen (2013) cannot imagine a single instance, neither depending on the time point nor on the type of rule, in which rules should be applied less strictly.
Berman (2011) provides a different view on these issues, using a more fine-grained approach regarding rules as well as its consequences. Based on the fundamental principle that sport competitions should be decided by the athletic skills of the competitors, he concludes that temporal variance could be applied in the later stages of close competitions under certain circumstances. First, if the penalization would be overcompensatory in the sense of causing too big of a disadvantage for the offender, compared to the disadvantage or harm experienced by the opponent. Second, if (slightly) violating the rule does not interfere with the main objective of the rule regarding the related athletic skills (for example hitting a target).
Besides examples of other sports, such as calling balls and strikes in baseball, Berman (2011) as well as Standen (2013) build their respective articles around another topic related to serving in tennis: foot faults. The rule for foot faults is related with the athletic skill to serve correctly by defining the (minimum) distance and angle of which the serve hast to be taken. Berman (2011) sees this influence as of less importance than for example hitting the defined target zone, which would be one of his reasons to apply temporal variance for foot faults in crunch time. Violations of the time rule interfere even less with the athletic skill. Thus, awarding the respective penalties for time rule violations less strictly under certain circumstances can be seen to be more in accordance with the intent of the way tennis should be played, than enforcing the penalty – at least, if one agrees with Berman’s (2011) reasoning. However, as time rule violations not just occur during the late stages of a game (crunch time), this would only explain a small fraction of the conundrum.
5Conclusion
This study provides empirical evidence for a common and unpunished disregard of an official rule in sports, the first paragraph of rule 29a of the ITF Rules of Tennis (2016b), referred to as time rule. Such a gap between the laws of a game and its implementation on the field raises the question whether the rule and the respective penalty for violating it serve to reach an accepted intent. Besides recovery reasons, the respective rule has no influence on the athletic challenge to perform a skill. The intent of the ITF is rather to support their desire for “continuous play”, which is also the heading for rule 29 (ITF, 2016b, p. 14). (Too) long matches are a well discussed issue in the scientific community, causing negative effects for fans, players, umpires and off-field officials (Barnett, Brown, and Pollard, 2006). As the elimination of the rule could cause even longer matches, this option seems to be inappropriate. This is supported by the indications found in this study that players already use the inter-point time for tactical reasons.
Staying with the time rule, the ITF could either change the matter of the rule or the way of enforcing it (or both). Changing the matter of the rule would mean to adapt the time limit between points. The results of this study showed an average time between points of 21.5 seconds, which extends the ITF limit but lies within the limit demanded by the ATP. Thus, the ITF could consider to bring their time limit in line with the ATP’s one, which will actually be tried at the 2018 Australian Open (ITF, 2017). As a more radical approach, tennis associations could also introduce a dynamic time limit. The inter-point time increases with the number of strokes played in the previous rally, which indicates that there is a need for an extended recovery between longer rallies. Thus, the ITF could extend the time limit based on the numbers of strokes of the previous rally. The same procedure could be used for later stages of the match, which is, however, not fully supported by the findings of this study.
To change the way of enforcing the rule, the respective penalization could be adapted. This does not necessarily mean that the cost for the offending player should be raised, for example if the on-field stakeholders perceive the current penalty as overcompensatory. In addition, the ITF could introduce some kind of technological officiating aid to enforce the rule (Kolbinger and Lames, 2017), for example a shot clock that automatically defines dynamic time limits based on tracking data. Both these interventions do not rule out changes of the time limit and vice versa.
Thus, there are several ways to fix the current application of the time rule. We argue that some kind of intervention needs to happen, considering the capriciously enforcement of penalties, the individual differences in inter-point time as well as the tactical use of this break. Lately, the ITF started to take actions in order to change the current status. On November 21st 2017, the Grand Slam Board announced that the Australian Open 2018 will be the first major tournament using an on-court shot clock (ITF, 2017). This study provides findings to support this process and a study design to conduct more extensive analysis (different surfaces, women’s tournaments) or to evaluate the success of interventions.
References
1 | ATP., (2016) , The 2017 ATP Offical Rulebook. Available at: http://www.atpworldtour.com/-/media/files/rulebook/2017/2017-atp-rulebook_30dec16.pdf. |
2 | Barnett T. , Brown A. and Pollard G. , (2006) , Reducing the likelihood of long tennis matches, Journal of sports Science & Medicine, 5: (4), 567–574. |
3 | Berman M.N. , (2011) , “Let ‘em Play” A study in the jurisprudence of sport, Georgetown Law Journal, 99: , 1325–1369. |
4 | D’Agostino F. , (1995) , The Ethos of the Game. In Moran W. J. & Meier K. V. (Eds.), Philosophic Inquiry in Sport (pp. 48–49). Champaign, IL: Human Kinetics. |
5 | Gomes F. , Volossovitch A. and Ferreira A.P. , (2014) , Team timeout calling in handball, International Journal of Performance Analysis in Sport, 14: (1), 98–110. |
6 | Hornery D.J. , Farrow D. , Mujika I. and Young W. , (2007) , An integrated physiological and performance profile of professional tennis, British Journal of Sports Medicine, 41: (8), 531–536. |
7 | ITF., (2016) a, ITF Duties and Procedures for Officials. Available at: http://www.itftennis.com/media/221928/221928.pdf. |
8 | ITF., (2016) b, ITF Rules of Tennis. Available at: http://www.itftennis.com/media/220771/220771.pdf. |
9 | ITF., (2017) , ITF Board of Directors Meeting Summary - Minsk, 13-14 November 2017. Available at: http://www.itftennis.com/media/276609/276609.pdf. |
10 | Kolbinger O. and Lames M. , (2017) , Scientific approaches totechnological officiating aids in game sports, Current Issuesin Sport Science, 2: (1), doi: 10.15203/CISS_2017.001. |
11 | O’Donoghue P. and Ingram B. , (2001) , A notational analysis of elite tennis strategy, Journal of Sports Sciences, 19: (2), 107–115. 10.1080/026404101300036299. |
12 | Périard J.D. , Racinais S. , Knez W.L. , Herrera C.P. , Christian R.J. and Girard O. , (2014) , Thermal, physiological and perceptual strain mediate alterations in match-play tennis under heat stress, British Journal of Sports Medicine, 48: (Suppl 1), i32–i38. |
13 | R Development Core Team., (2015) , R: A language and environment for statistical computing. Vienna, Austria: R Foundation for Statistical Computing. Available at: https://www.R-project.org/. |
14 | Smisson C.P. , Burke K.L. , Joyner B. , Munkasy B.A. and Blom L.C. , (2007) , Spectators’ perceptions of momentum and personal control: Testing the antecedents-consequences model, Athletic Insight, 9: (1), 79–90. |
15 | Standen J. , (2013) , Foot faults in crunch time: Temporal variance in sports law and antitrust regulation, Pepperdine Law Review, 41: (2), 349–396. |
16 | Zetou E. , Kourtesis T. , Giazitzi K. and Michalopoulou M. , (2008) , Management and content analysis of timeout during volleyball games, International Journal of Performance Analysis in Sport, 8: (1), 44–55. |


