
A pressure index for the team batting second in T20I cricket
Abstract
In sports, players usually undergo pressure situations in order to meet certain performance standards set by themselves or others. During the course of any competitive sporting event, players are often motivated to take calculated risks in attempts to secure a victory or to showcase their performance capabilities. However, quantifying the pressure experienced by players at any given stage of a game is quite a challenging and imposing task. This study discusses a method to compute the pressure experienced by batters when pursuing a target in a T20I cricket match. Diligent and extensive exploration of psychological pressures motivates us to formulate a differential equation, based on a set of reasonable assumptions, whose solution gives rise to a useful pressure index formula for quantifying the level of pressure experienced by the batters of the team batting second, i.e., the team chasing the target. This index takes into account two key assumptions: first, the rate of change of pressure on the batters at a given stage of the game depends on the pressure at that stage; and, second, the required run rate commensurate with available resources remaining at that stage of the game. The available data are used to fine-tune the parameter of the model. The applicability of the proposed pressure index is illustrated using data for T20I matches played by the major test playing countries during the years 2017, 2018, 2019, and 2021. Additionally, this pressure index can be used not only to predict the probability of winning at any given stage of the second innings, but also to quantify the contribution of each batter, taking into account the pressure situation in which they score runs.
1Introduction
Cricket is a bat-and-ball game played between two teams of eleven players each. Currently, there are three formats for the game played at the international level: Test, One Day International (ODI) and Twenty20 International (T20I). A Test match is typically scheduled to play for at most five days, whereas an ODI match is played for roughly eight hours, while a T20I match lasts for about three hours. In cricket, an over consists of six consecutive legal deliveries. In a T20I cricket match, each team is allotted 20 overs (120 balls). Before a game commences, the captains of the two teams toss a coin to decide which team shall bat (or bowl) first. The captain who wins the toss decides whether to bat first or bowl first, depending upon (i) tactical considerations, (ii) ground conditions, (iii) the strengths and weaknesses of the two teams, and, most importantly, (iv) the weather forecast for the day. The goal of the first-batting team is to score as many runs as possible during its allotted twenty overs, whereas the goal of the second-batting team is to surpass the total runs scored by the first-batting team, utilizing its maximum of twenty overs and eleven batters. In addition, the team batting second has all of its twenty overs, even if the team batting first did not utilize its full quota of twenty overs: a situation that arises whenever all batters of the team batting first get out before exhausting its twenty overs.
During batting, a batter has two main objectives: scoring runs at an appropriate rate and avoiding getting out, which is also called losing their wicket. On one hand, when batters try to increase the scoring rate by choosing to play some risky shots, they become more vulnerable to losing their wickets. On the other hand, when batters adopt a tentative approach in choosing their shots in a situation where protecting the wicket is more important than scoring at a higher rate, there is a risk of consuming all the overs before reaching the desired target. The pressure increases when batters are uncertain about the right type of shots to play under the given conditions. In Test matches there are some situations where protecting the wicket is more important than scoring runs, so that playing for a draw is the sole intention. However, scoring runs and protecting the wicket are both equally important in T20I and ODI cricket. When comparing T20I and ODI matches, one can viably argue that since T20I cricket has a shorter format, scoring runs is more important than protecting the wicket. In any of these formats, batters experience differing degrees of pressure as they try to optimize their contribution to the total runs scored. The nature of the pressure experienced by the team batting first might well differ strategically and noticeably from that of the team batting second. For example, the team batting first does not have a set target score, and therefore batters may try to achieve an imaginary target which is usually decided by the team captain and management on the basis of tactical considerations, such as field conditions and the strengths and weaknesses of the competing teams. For a team batting second, where the situation is always chasing a target score, the nature and degree of the psychological pressure on the batters can be viewed as closely related to the target as well as the supply of remaining resources (balls and wickets). Additional information concerning basic terms and definitions for cricket is provided by Manage and Scariano (2013).
In sports, players may feel pressure to meet certain performance standards established by themselves or others. Several studies in the literature discuss pressure in sports. The term “pressure” in a sports context is viewed, used, and defined in diverse ways by various authors. In the context of sports, pressure can be defined as the presence of situational incentives for optimal, maximal, or superior performance (Baumeister and Showers (1986, p. 361-383)). Swann et al. (2017) qualitatively examine the subjective experience underlying crucial, or clutch, performance across a range of sports, for Olympic as well as recreational athletes. William et al. (2022) explore how to create pressure for training purposes and how such training might improve performance in actual competition. Consequently, practicing coping skills can be incorporated into athletic training regimens, so that pressure can be ameliorated and player performances do not degrade in tense game situations. Ötting et al. (2020) investigate performance under pressure in professional dart-throwing and find no evidence that professional dart players are impacted by high pressure situations. Jones et al. (2007) conduct an investigation of mental fortitude in a sample of athletes who have achieved superior sporting success, and identify thirty attributes that are essential to being mentally resilient in sports. Hepler et al. (2015) suggest that stress impacts the speed of decision-making, but not the quality of the eventual decision reached. Hill and Shaw (2013) provide a unique insight into adverse decision-making (“choking”) in team sports settings, and they discover that anxiety, perceived control and distraction are major contributors to “choking”.
In a T20I cricket match, as well as in an ODI, the pressure on the batters for the team batting second emerges when they must choose the kind of shots they need to play. Whenever a batter tries to score a boundary (i.e., a four or a six), the risk of getting out increases. A risky shot may increase the scoring rate and, hence, the chance of winning the match, but simultaneously may also increase the chance of getting out. Such might eventually lead to match loss. Therefore, during the course of the innings, batters must decide the amount of risk they should take when playing each delivery so that their victory can be achieved. This decision-making responsibility mainly causes psychological pressure on the batters.
Like Test matches, T20I matches may also have brief game situations in which it is worthwhile to protect the wicket (i.e., not getting out) until the innings approaches a certain stable stage, rather than taking risks to increase the run rate. On the other hand, reluctance to take risks could make the playing strategy ineffective, which might cause below par performance, resulting ultimately in match loss.
Given the details just reviewed, one can clearly appreciate the role that pressure plays on the decision-making strategies of batters during the progress of an innings. However, quantifying the level of pressure at a given stage of a cricket match is a challenging and elusive task. This could very well be the reason why few articles are found in the literature regarding this topic. Developing a pressure index that would quantify the amount of pressure a batter experiences during any given stage of a match would be greatly beneficial for cricket players as well as coaches. Knowing the type and degree of pressure acting on a batter at a particular stage of the game would help prioritize successful strategies. A pressure index (a numerical value that quantifies the prevailing pressure) might also be useful as an effective indicator for predicting the outcome of a game at a given stage of the innings. On the other hand, a pressure index may be advantageous for defining weights for each run scored by a batter. Such weights could possibly be used to calculate the actual contribution an individual batter adds to the innings. For example, scoring four runs to a delivery at a stage where pressure is high should receive higher weight than scoring four runs to a delivery at a stage where pressure is low. If two batsmen score the same number of runs in an innings, then the one who scores under higher pressure conditions should be favored in consideration for awards such as “best batter” or “man-of-the-match”.
Batters usually take calculated risks based on their experiences, taking stock of the remaining game resources. The remaining resources are generally assumed to be a function of the number of batters yet to bat as well as the number of balls remaining to be delivered. The Duckworth-Lewis method, used by the International Cricket Council (ICC) to revise a target, accounting for weather-interrupted matches, provides a table showing the remaining amount of resources, given as a function of number of wickets lost and the remaining number of balls to play. Complete details for this method can be found in Duckworth and Lewis (1998), which provides a two-way table to ease calculations of the remaining percentage of resources, based on the available number of balls and the number of wickets lost.
Apart from the reliance on the remaining resources given by the Duckworth-Lewis table, the amount of risk that should be taken in scoring at a higher rate at a certain stage of a match heavily depends on the required run rate at that stage. Batters would typically take into account the required run rate at any stage of the game before deciding how much risk should be taken in scoring runs.
One key assumption made here in model formulation is that the intensity of the pressure follows a logistic pattern. This means that when the intensity of the pressure is extreme, either low or high, then pressure increases at a slower rate. For example, if a team batting second has a target score of 150, and at a certain stage they are cruising towards victory with a score of 140 with the loss of a single wicket in 14 overs, then the fall of two wickets in two consecutive maiden overs should not increase the pressure drastically. Likewise, if a team batting second is heading towards defeat, such as scoring 70 runs with the loss of 7 wickets in 18 overs while pursuing a target of 150, then a few dot balls in the nineteenth over should not cause a dramatic increase in pressure.
This article develops a pressure index that can be used to quantify the magnitude of pressure on batters in the second innings of a T20I cricket match, at each delivery, based on the remaining resources and the required run rate at that moment. This pressure index can be used to compare pressures within a match as well as between matches. Additionally, it provides a value (index) before the delivery of each ball of the second innings. An initial pressure index will depend solely on the target score. By bench-marking on a target score, this pressure value can be used to compare pressure situations among different matches as well. This is accomplished by scaling the index from zero (0) to ten (10), where an index value of ten is assumed to correspond to a situation with a very high, though practically achievable, targetscore.
Bhattacharjee and Lemmer (2016) suggested a pressure index, namely PI3, to quantify the pressure in limited over matches based on the average of two indices called PI1 and PI2, where PI1 is sensitive to falling wickets and PI2 is sensitive to the quantity of resources already consumed. Complete details of the terms and the method are given in Bhattacharjee and Lemmer (2016). In the end, their final pressure index, PI3 is seen to provide an indication of the magnitude of pressure at a given stage of the second innings of T20I matches. While the authors of Bhattacharjee and Lemmer (2016) have accomplished noteworthy results in formulating and applying this measure, some of its shortcomings, as well as remedies, will be discussed in what follows.
The proposed pressure index we advocate here has several advantages, and it performs significantly better as the results ultimately show. Those advantages are:
• The pressure index is derived as a solution to a differential equation, which is based on a set of reasonable assumptions and has a mathematical justification.
• It better approximates the actual pressure of the game than the pressure index, PI3 proposed by Bhattacharjee and Lemmer (2016).
• It is not a relative measure; therefore, it can be used to compare pressure values of two different matches.
2Model formulation
In this section we construct a pressure index, on a scale from zero (0) to ten (10), that closely embodies the actual pressure applied to batters of the team batting second in a T20I cricket match. Our approach in formulating this pressure index is based on the following empirical observations:
1. The pressure increases slowly when it is very low (i.e., close to 0) or when it is very high (i.e., close to 10). In particular, we observe a logistic pattern in the change of pressure.
2. Pressure and required run rate both change at directly proportional rates.
3. Pressure and the amount of depleted resources (i.e., the number of balls bowled and wickets fallen) change at directly proportional rates.
Here, R (t) is a nondecreasing function of t because, as the innings progresses, the batting team continues to utilize its remaining resources (balls and wickets). A tangible choice for R (t) can be obtained using the Duckworth-Lewis method (D/L Method) Duckworth and Lewis (1998), which is the method used by ICC (International Cricket Council) for revised target score calculations for weather-interrupted matches. The D/L Method is aided by a table that contains the proportion of resources remaining for each stage of an innings, based on the number of wickets fallen and the number of balls delivered. It also produces a value between 0 and 1. In our notation, R (t) denotes the proportion of resources depleted, which is one minus the proportion of remaining resources, before the delivery of the tth ball. Consequently, it follows that R (1) =0 and 0 ≤ R (t) ≤1.
Recognize that the notations used in this article differ from those in Bhattacharjee and Lemmer (2016). For example, C (t) is used here to denote the current required run rate, while Bhattacharjee and Lemmer (2016) used CRRR for that quantity.
The current required run rate C (t) is defined by
Mathematically, our model assumptions are:
[A1] The rate of change of pressure is directly proportional to the product of the existing pressure and the difference between the maximum pressure and the existing pressure. Symbolically,
(1)
[A2] The rate of change of pressure is directly proportional to the rate of change of the current required run rate. That is,
(2)
[A3] The rate of change of pressure is directly proportional to the rate of change of amount of resources consumed. So,
(3)
The derivation of the proposed pressure index assumes that t is a continuous variable defined on the interval [1, 120].
Combining propositions (1), (2) and (3) produces the equation
where k is a constant of proportionality. This differential equation can be solved using the separation of variables technique and the numerical approximations as follows:
(4)
The integral on the left-hand side of this equation can be converted to its equivalent discrete form, together with the approximations
and
(5)
(6)
(7)
We now explore how to define P (1) based on the initial required run rate. In the history of T20I matches, as of November 14, 2021 (the date up to which the data was used to build the pressure index), the maximum total runs scored in a T20I innings is 278 (Match no. 746: Afghanistan against Ireland). With a reasonable tolerance, we assume here that the maximum possible total runs a team can score in the first innings is 299, which sets a target of 300 runs for the second batting team. Therefore, the maximum initial required run rate is defined by
(8)
Next, an appropriate value for k must be found. Of course, we naturally expect the pressure indices ultimately obtained to make sense in a real-world context, and we anticipate that the amount of pressure on batters at a given stage of the match to be a reasonable measure for predicting the outcome of the match. So, as illustrated in the Results section, k is selected so that the average accuracy of the prediction of the outcome of a match using the pressure index is optimal. The optimal value of k is found to be k = 3.37. Substituting this value into (8), the model equation ultimately achieved is
(9)
One of the key advantages of the proposed pressure index is that pressure can be compared across different matches at any given stage of the game. For this model, the initial pressure, the pressure right before the start of the innings, on the team batting second depends entirely upon the initial required run rate. We also assume that the maximum possible value for the pressure index is 10, and that arises when the initial required run rate equals the Imax, which is the maximum possible value for the initial required run rate. To map the pressure values onto a scale from zero (0) to ten (10), based on completed T20I matches to date, we have chosen the value of Imax to be 15. In the event that a team batting first scores more than 299 runs, then Imax can be set to that initial required run rate and the pressure indices can again be found using the equation given above.
3Results
The utility of the proposed pressure index is illustrated using data for the T20I matches played by Afghanistan, Australia, Bangladesh, England, India, New Zealand, Pakistan, Sri Lanka, South Africa, West Indies, and Zimbabwe for the years 2017, 2018, 2019, 2021. The data were obtained from https://www.espncricinfo.com. Matches that were shortened or that used the D/L method for revising the target due to weather interruptions were excluded. Additionally, matches played during the pandemic year of 2020 were purposely omitted because most of those matches were played in a ’pseudo’ environment, having no crowd effect. In an effort to understand the behavior patterns of the pressure indices, we separately explore matches won by teams batting second and matches lost by teams batting second. These are depicted in the side-by-side panels of Fig. 1.
Fig. 1
Pressure indices of matches in which the team batting second (A) won (B) lost.
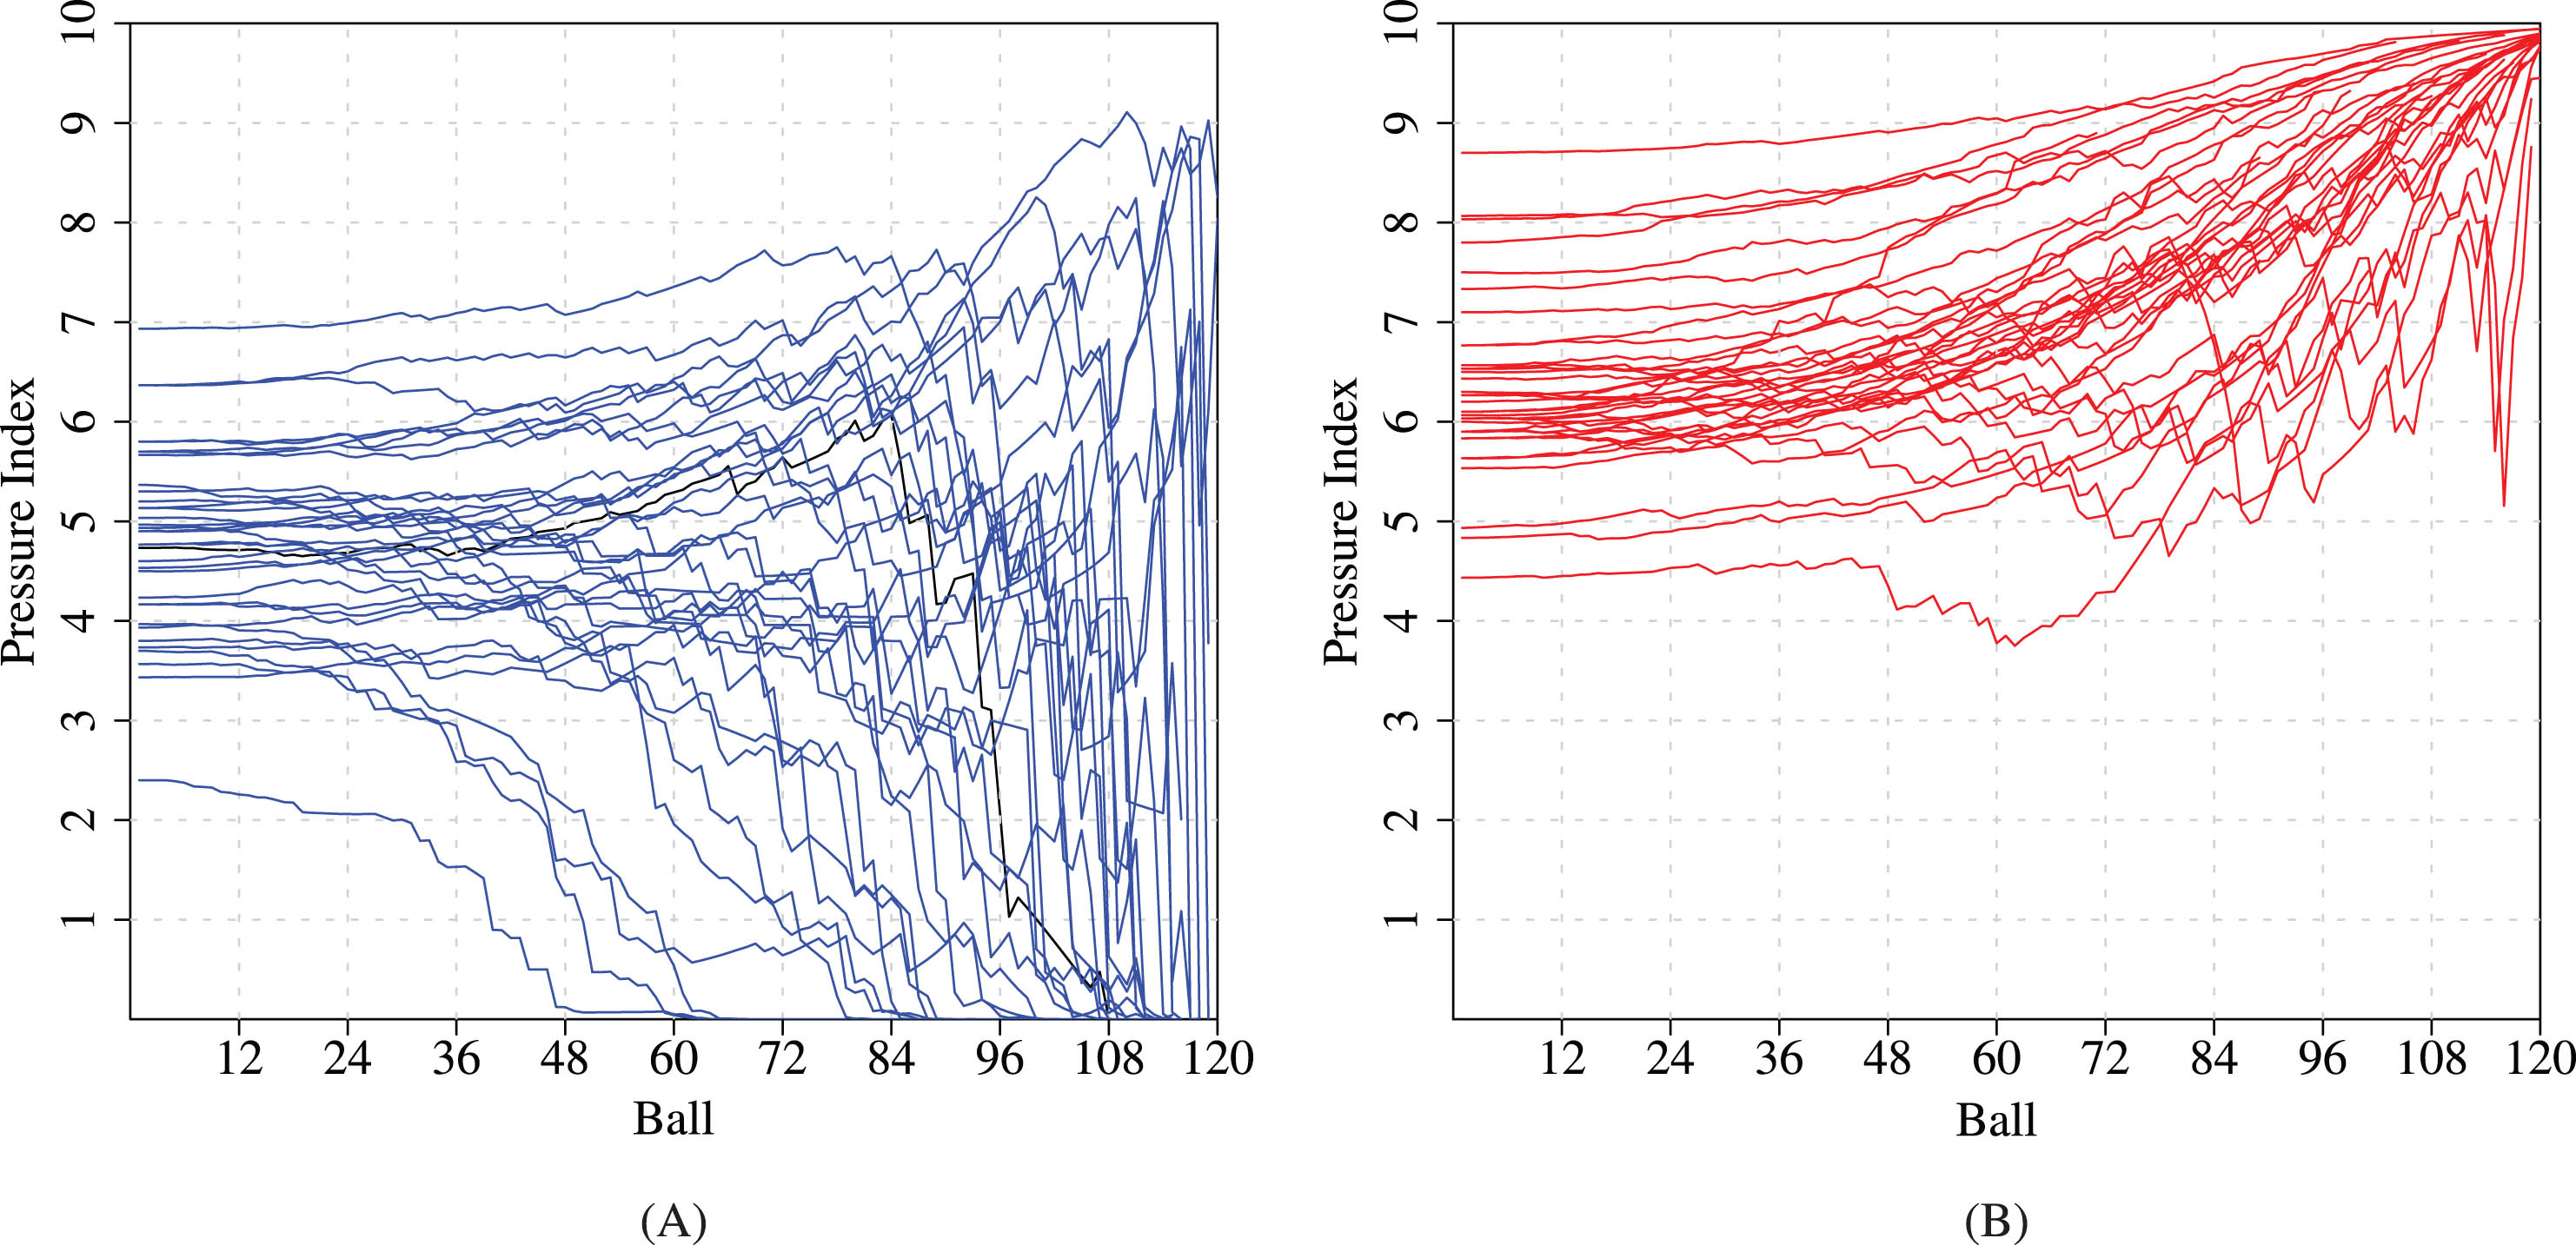
Figure 1(A) shows the graphs of the pressure indices of the matches won by the team batting second, and Fig. 1(B) shows the graphs of the pressure indices of the matches lost by the team batting second. The relationship between winning the match and the pressure index at the first delivery of the second innings, which is also the initial required run rate, is conspicuous. It is interesting to note that when a team batting second is following a losing trend, the pressure levels off, as seen in the upper portions of the “lost” curves in Fig. 1(B). However, the pressure values always remain below 10. The observed effect of the pressure leveling off in the upper portions of the “lost” curves can be attributed to the logistic behavior assumed when formulating the pressure index. In a real world scenario when a team is losing because it has lost too many wickets or the required run rate is becoming overwhelmingly unachievable, pressure on batters does not increase at the same linear rate. For example, if a team batting second has to score 80 runs in the last three overs, then the pressure on batters in that situation is not quite different from a situation where a team batting second has to score 100 runs in three overs. In such a situation, one can surmise that the pressure increases in small increments during the progress of the innings, which justifies our choice of the logistic model assumption.
Given the shorter format for T20I matches, it is important to maintain the momentum of the match throughout the innings. However, it is common that excitement intensifies in the last few overs of the game. So, it is more important to scrutinize the validity of the proposed pressure index at the last stage of the innings, especially for closely played matches. As an illustration, Fig. 2 provides pressure values for a match between India and Bangladesh (T20I no. 1000) in which Bangladesh was batting second. The batters, who were chasing a target of 149, experienced increasing pressure even in the seventeenth over, where they lost the third wicket. The pressure kept increasing in the eighteenth over even though two boundaries were hit. Then, after a flurry of four consecutive boundaries in the nineteenth over, the pressure dropped significantly and Bangladesh won the match by hitting a six on the third ball of the last over. The pressure indices, PI, at the beginning of each over together with some additional descriptive information for this match are given in Table 1.
Fig. 2
Pressure index for India vs Bangladesh (T20I no. 1000).
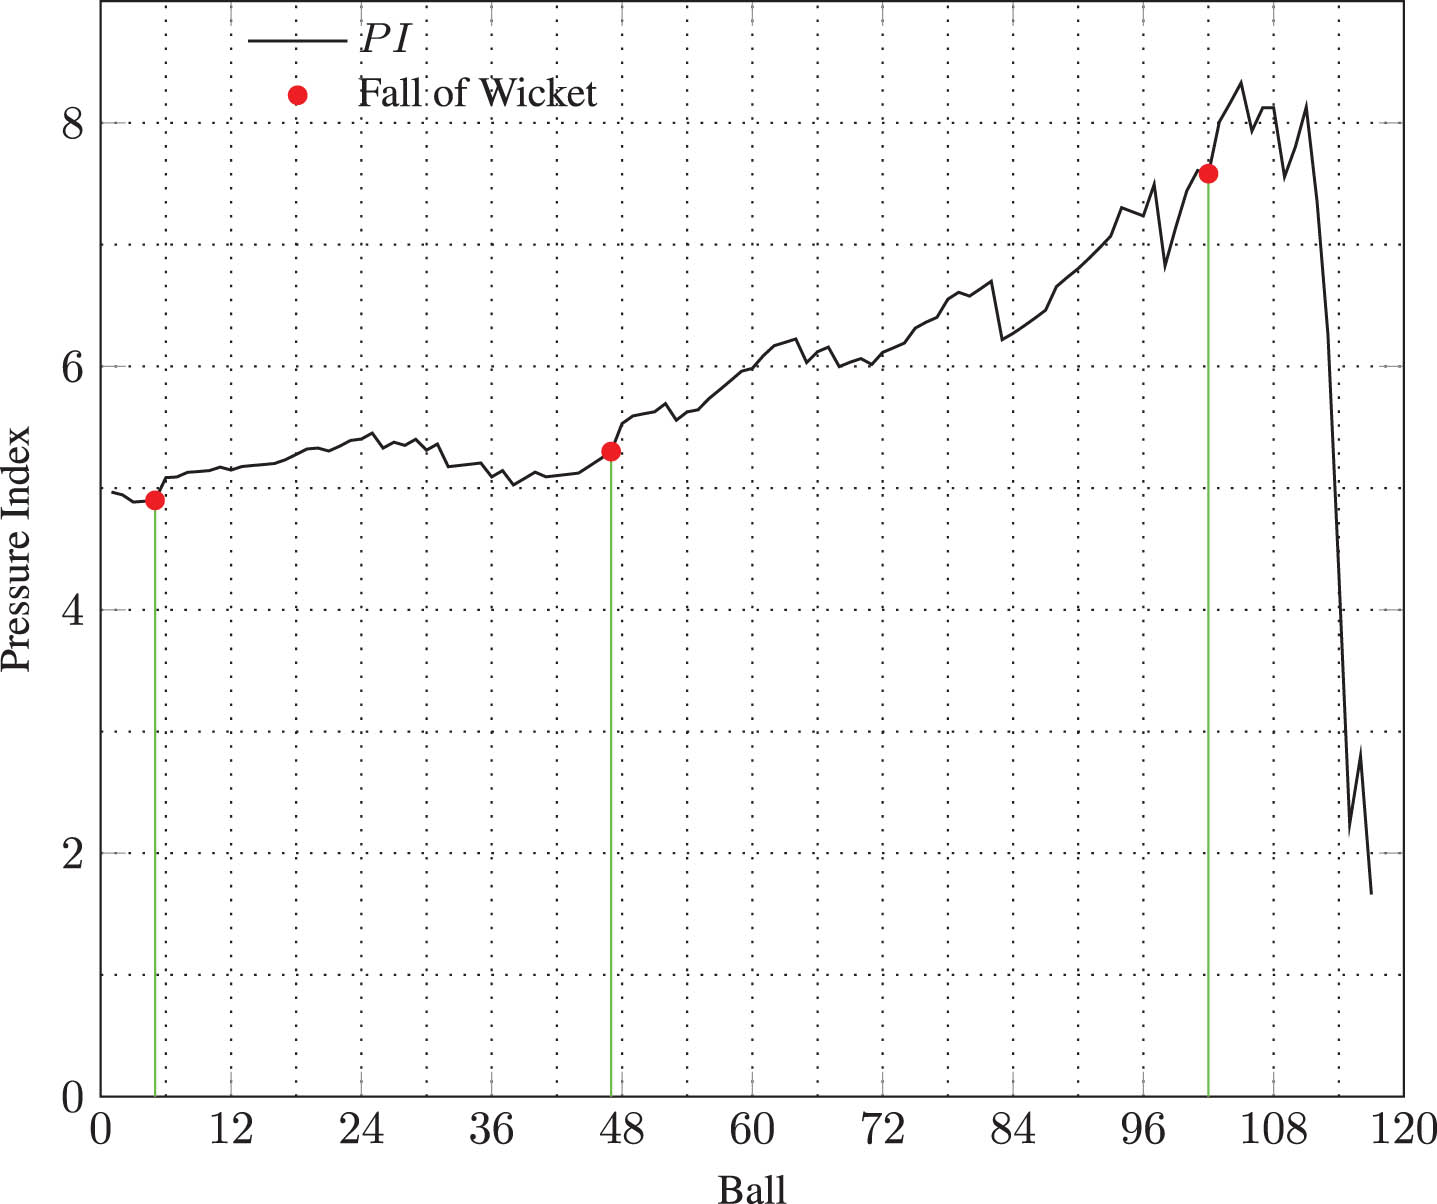
Table 1
India vs Bangladesh (T20I no. 1000): Comparison of current run rate (CRR), required run rate (RRR) and pressure index (PI) at the beginning of each over
| Over | Wickets | CRR | RRR | PI |
| 1 | 0 | N/A | 7.45 | 4.97 |
| 2 | 1 | 9 | 7.37 | 5.09 |
| 3 | 1 | 6.5 | 7.56 | 5.18 |
| 4 | 1 | 5.33 | 7.75 | 5.32 |
| 5 | 1 | 5 | 8.06 | 5.45 |
| 6 | 1 | 6.40 | 7.80 | 5.36 |
| 7 | 1 | 7.5 | 7.43 | 5.14 |
| 8 | 1 | 7.57 | 7.38 | 5.11 |
| 9 | 2 | 6.75 | 7.92 | 5.59 |
| 10 | 2 | 6.78 | 8.00 | 5.64 |
| 11 | 2 | 6.20 | 8.70 | 6.09 |
| 12 | 2 | 6.27 | 8.89 | 6.16 |
| 13 | 2 | 6.50 | 8.88 | 6.15 |
| 14 | 2 | 6.31 | 9.57 | 6.61 |
| 15 | 2 | 6.71 | 9.17 | 6.33 |
| 16 | 2 | 6.60 | 10.00 | 6.89 |
| 17 | 2 | 6.56 | 11.00 | 7.49 |
| 18 | 3 | 6.71 | 11.67 | 8.01 |
| 19 | 3 | 7.06 | 11.00 | 7.56 |
| 20 | 3 | 7.63 | 4.00 | 2.24 |
To further illustrate the behavior of the pressure index, PI, the pressure index graphs for two closely played matches are shown in Fig. 3.
Fig. 3
Pressure index for (A) Pakistan vs West Indies (T20I no: 603) and (B) South Africa vs Sri Lanka (T20I no: 590)
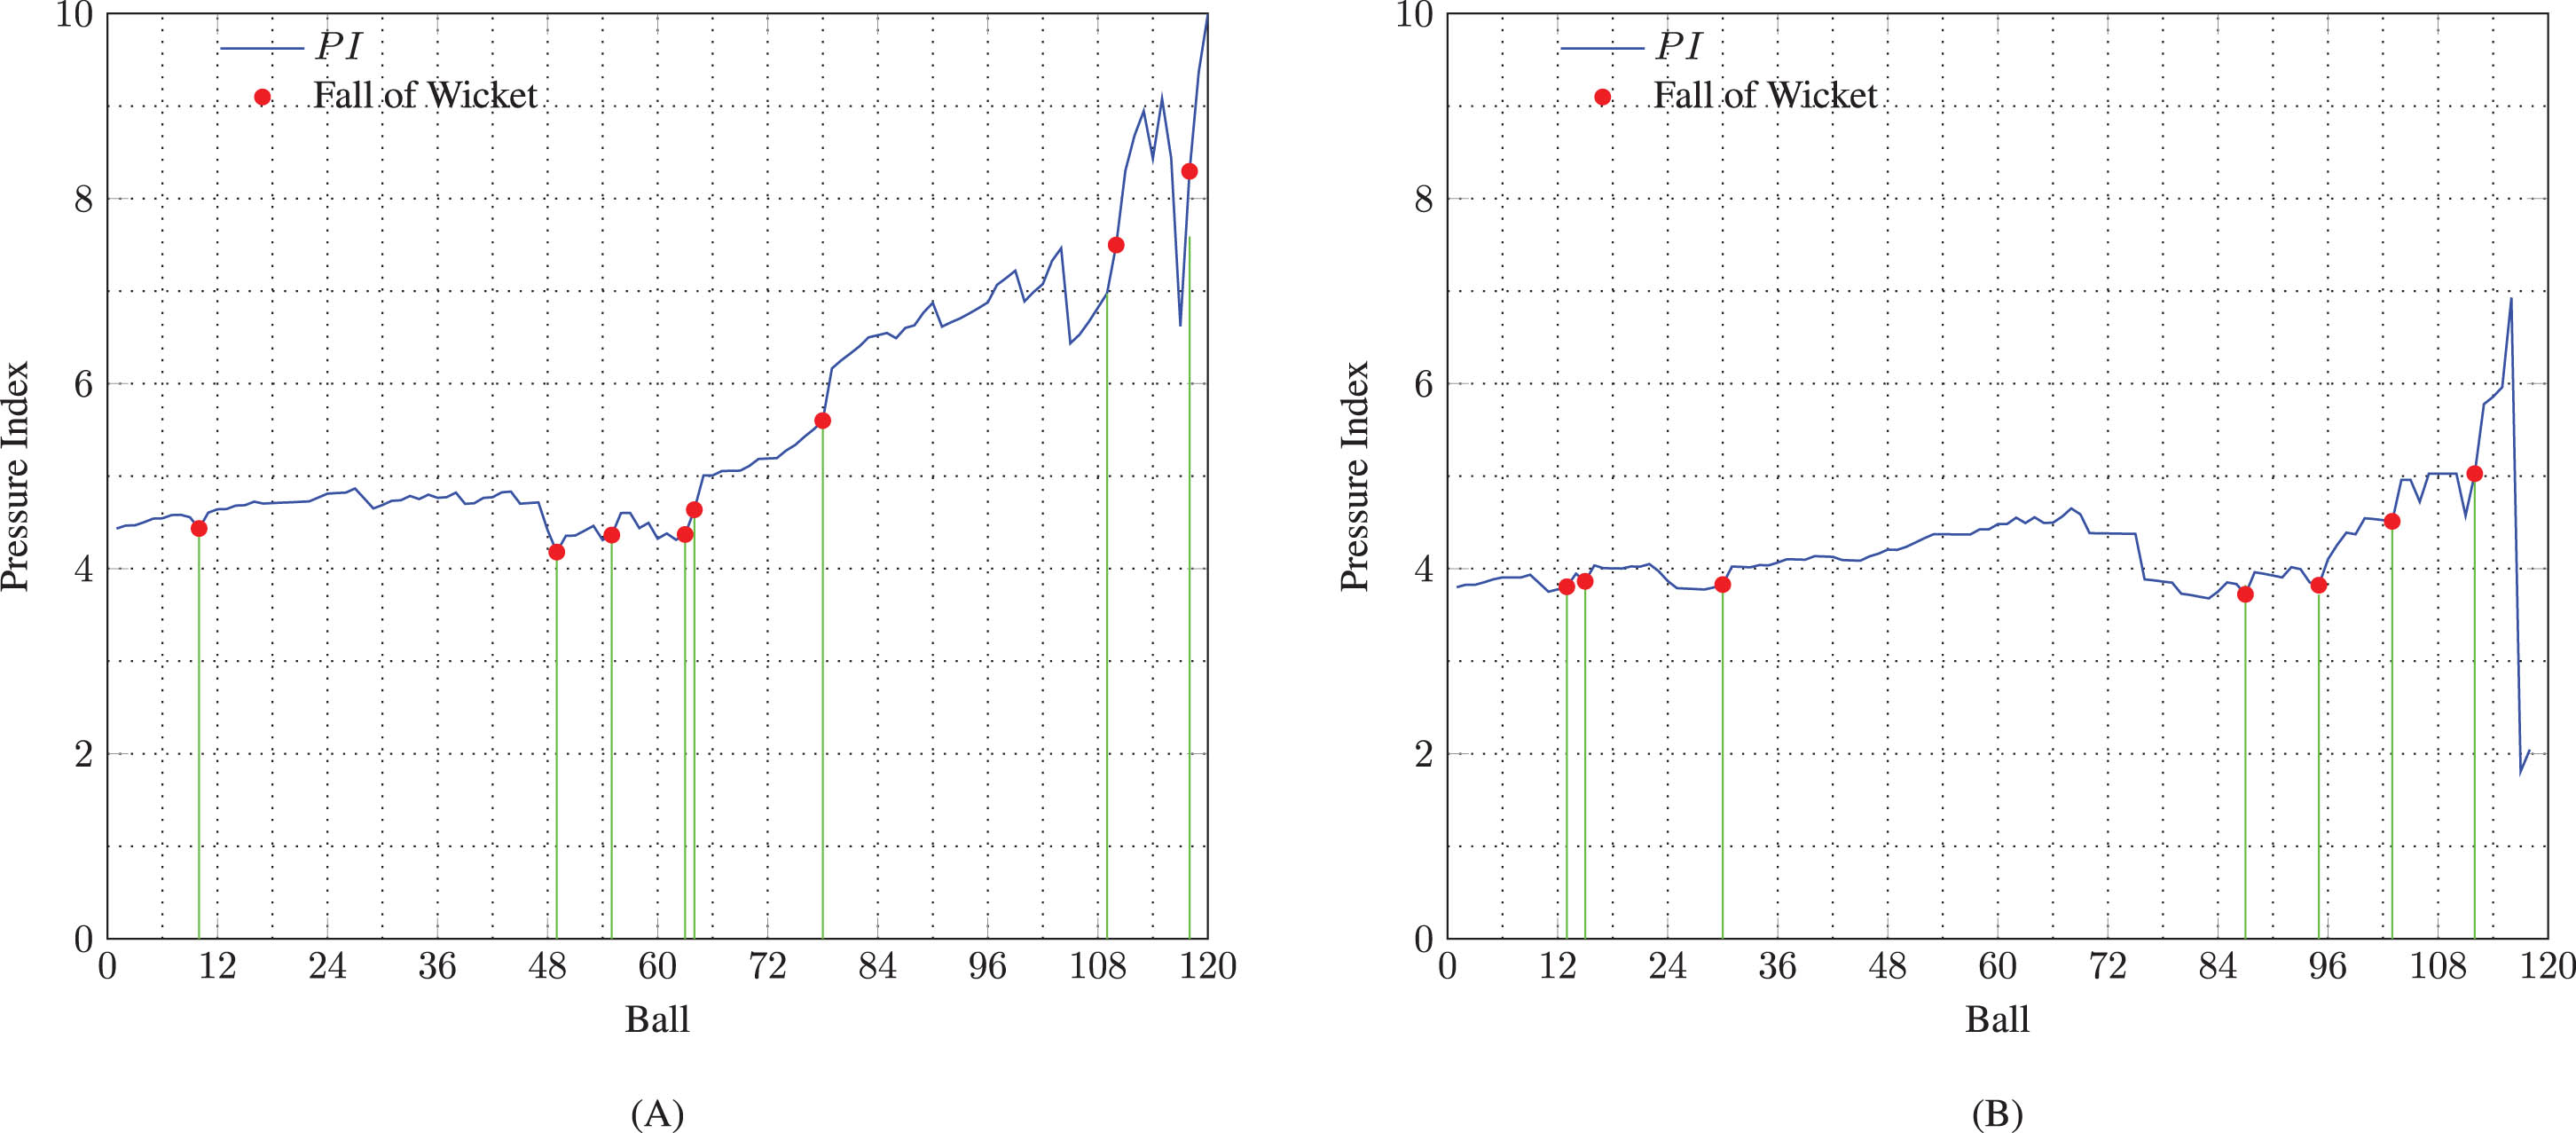
Figure 3(A) shows the graph of pressure indices for T20I, no. 603, played between Pakistan and West Indies. In that match, West Indies was batting second pursuing a target of 133 runs, but finally lost the match by 3 runs. West Indies needed 14 runs in the last over to win with three wickets in hand, but only managed to score 10 runs for the loss of one more wicket in that over. In the first two deliveries of that over, West Indies scored two consecutive fours, accumulating 8 runs. This allowed West Indies to reduce the pressure index below 7 and left it with only 6 runs to score in the last 4 balls of the innings in order to win. This pressure decrease is clearly depicted in Fig. 3(A). Nonetheless, they were only able to score two runs for the loss of one wicket in the last four balls of the innings, including an extra run owing to a wide delivery in the fourth ball of the over. They needed 5 runs for victory on the last delivery, but they were only able to score one run. The pressure indices for the last six deliveries of the innings, rounded off to two decimal places, were 9.08, 8.43, 6.62, 8.30, 9.37, 10.00, respectively. These graphs correctly interpret the pressure situation given that they had only three wickets left at the beginning of the last over, and that they lost the eighth wicket at the fourth delivery of the over. Even though the two consecutive boundaries caused the pressure index to drop below 7, the dot balls, combined with losing the wicket, caused the pressure index to rise to almost 10. Hitting a six in the last delivery is feasible, but it can still present a significant challenge, and thus a pressure index of almost 10 makes good sense at this point of the match.
The scenario in Fig. 3(B). corresponds to a low-scoring match between South Africa and Sri Lanka (T20I no. 590). Batting second, and pursuing a target of 114 runs, Sri Lanka needed only 12 runs in the last two overs with four wickets in hand. They were able to score only 5 runs in the penultimate over (over number 19) for the loss of one wicket, prompting them with a target of 7 runs in the last over. At the beginning of the last over, the pressure index was 5.96. The first delivery was a dot ball, and it caused the pressure index to increase to 6.93. Then, a six was hit for the second ball, leaving only one run to pursue in last four balls for the victory. This event caused the pressure index to decrease to a value of 1.81, which is a very realistic value, because they also had three wickets in hand. The third ball was a dot ball, but the pressure index increased only up to 2.04, which, again, is a sensible value because scoring one run in three balls with three wickets in hand is a highly likely event. Eventually, Sri Lanka won that match by hitting a six in the fourth delivery of the last over.
3.1Predicting match outcome using pressure indices
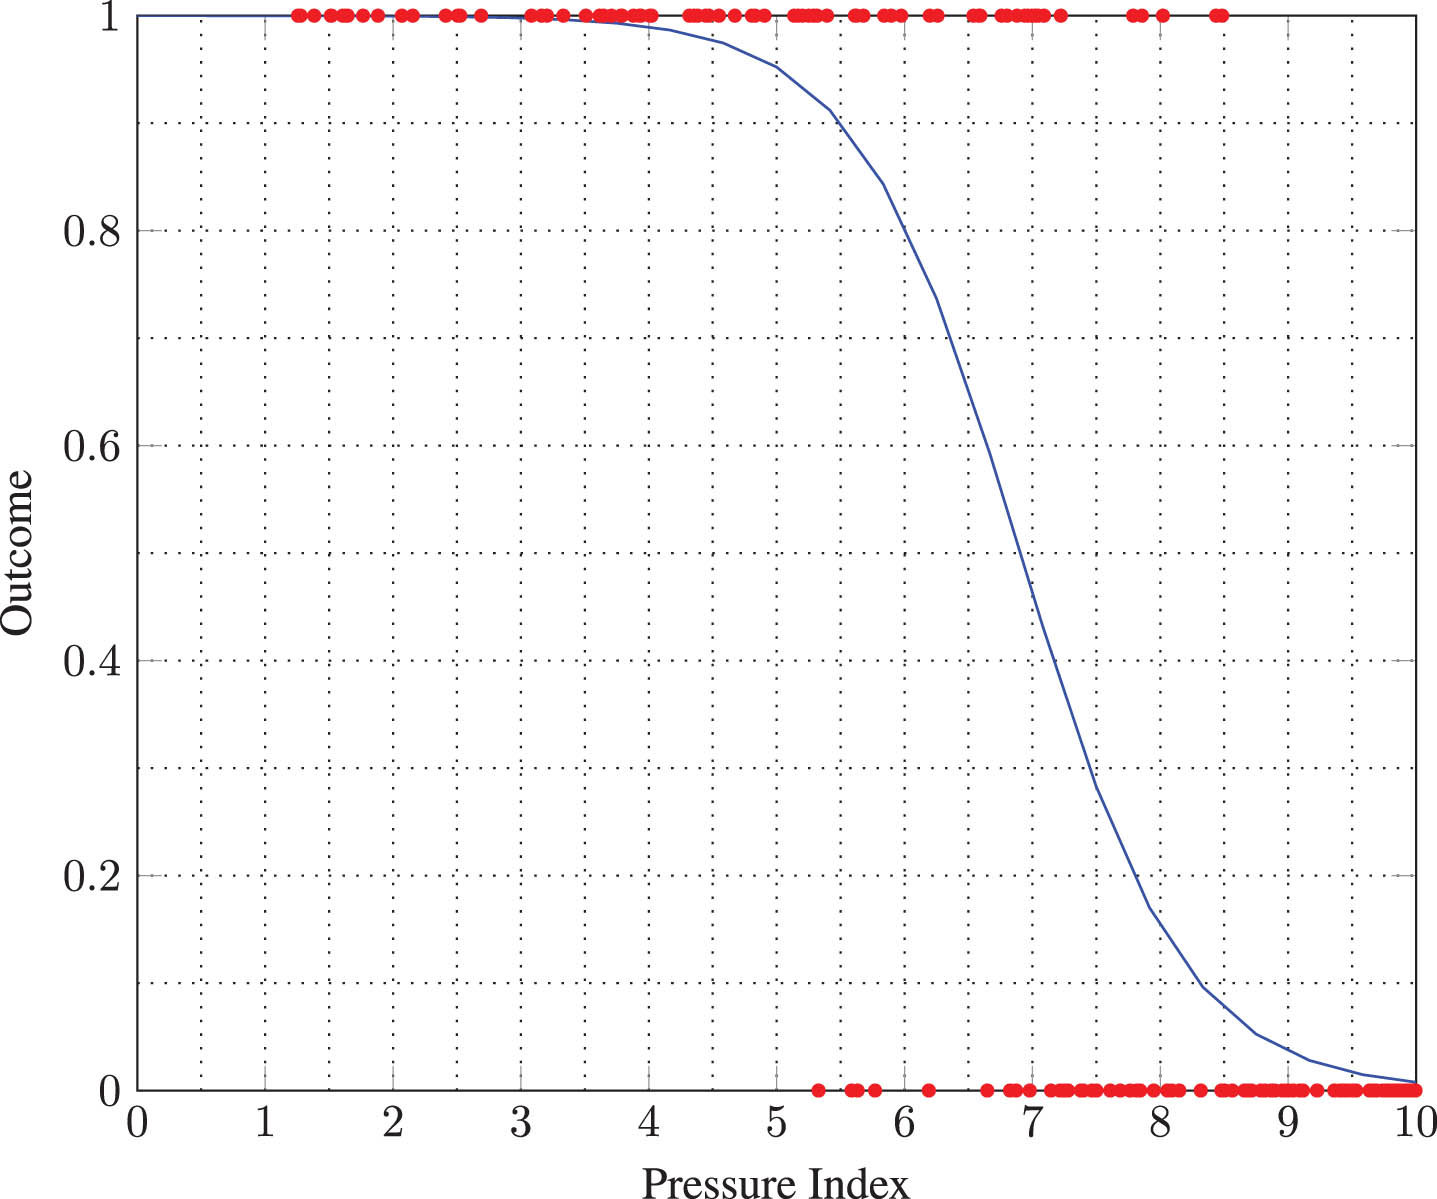
When batters play under pressure, they are enticed to play risky shots and so become vulnerable to losing their wickets. If a team continues to play under high pressure throughout the innings, without being able to reduce the pressure, losing the match becomes a real possibility. While the pressure can fluctuate throughout the innings, one can effectively use the pressure index at a given instant as an indicator for predicting match outcome. Following that line of reasoning, here we use a logistic regression model to predict match outcome at each ball delivered in an innings. For this logistic regression model, match outcome (win = 1, lose = 0) is assumed to be dependent on the pressure index, PI (predictor variable) at a given point (ball delivery) of a match. For example, Fig. 4 provides a logistic regression curve for predicting match outcomes at the beginning of the 16th over using pressure values.
Fig. 4
Logistic regression curve for the prediction of match outcome at the beginning of 16th over, based on all T20I matches played in 2017, 2018, 2019 and 2021. Red dots indicate the points (PI, match outcome).
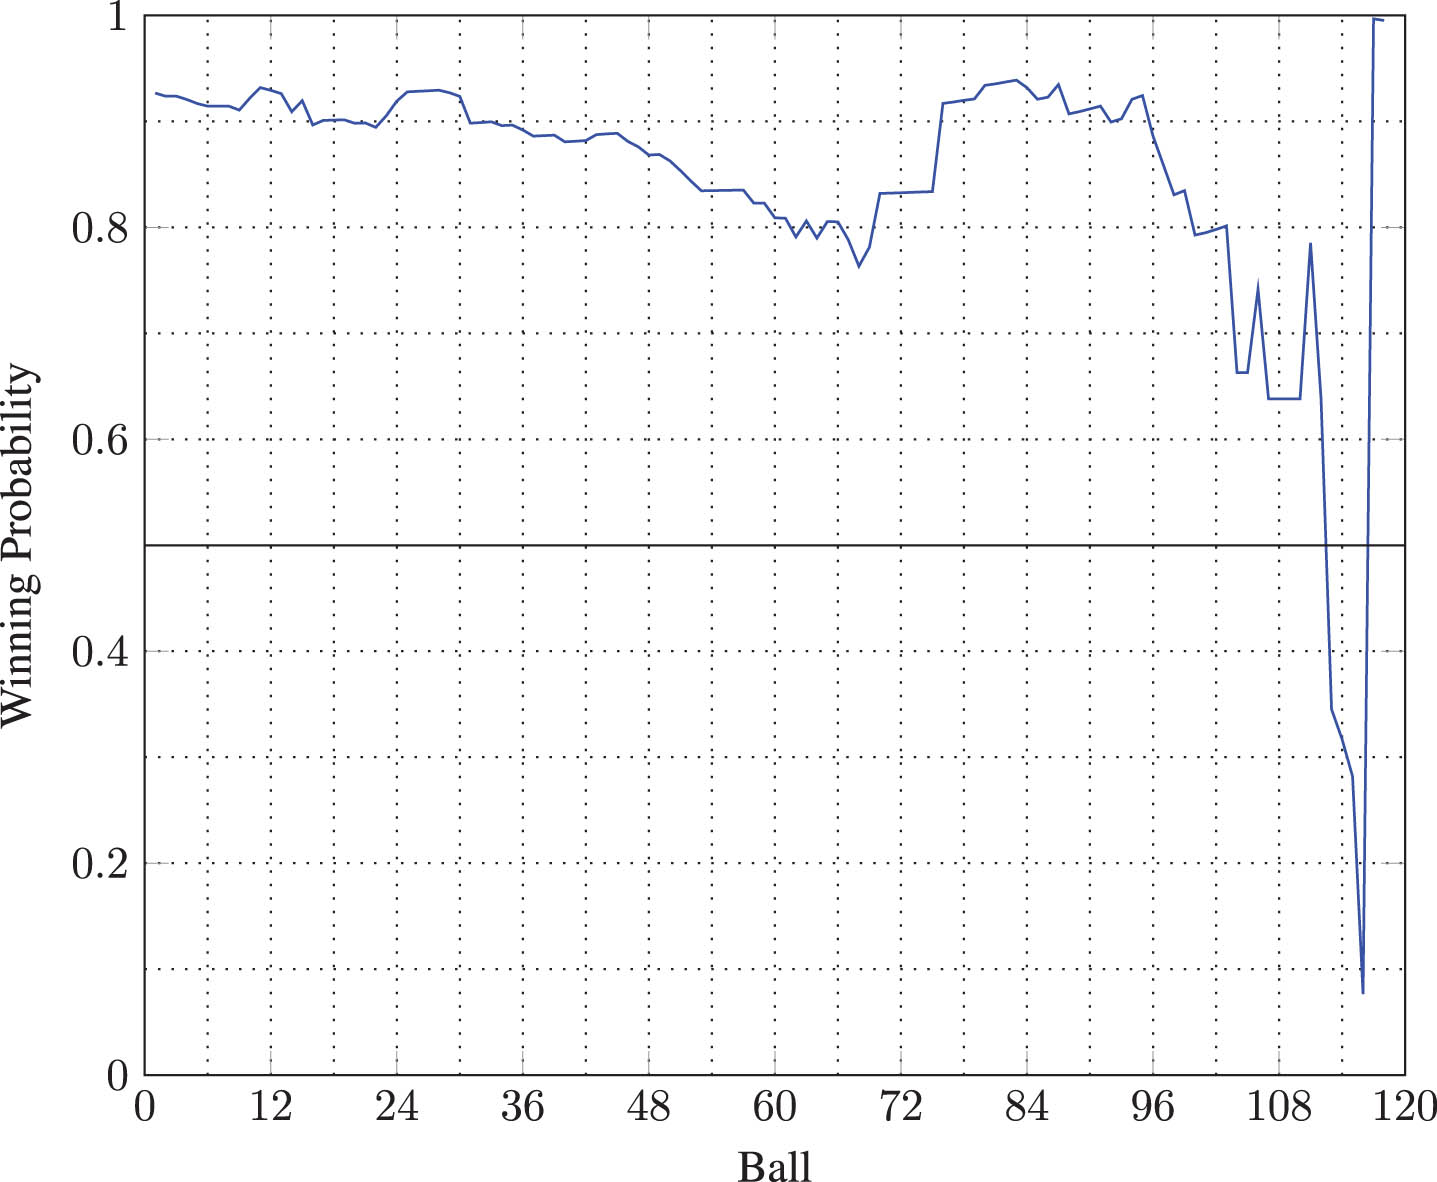
The proposed pressure index can also be effectively used to predict the winning probability of a T20I match as the innings progresses. To achieve this, one can utilize the logistic regression models developed for each delivery. More specifically, by incorporating the corresponding pressure index into a stage-specific logistic regression model, one can predict the winning probability at any given stage of the innings. Figure 5 shows the winning probabilities during the entire second innings for a match played between Sri Lanka and South Africa (T20I no. 590) in January 2017.
Fig. 5
South Africa vs Sri Lanka (T20I no. 590): Winning probability of Sri Lanka at each ball.
By applying the aforementioned logistic regression models to previously played matches, one can also calculate the prediction accuracy of said logistic regression models based on the pressure indices for each ball of the innings. The graph, depicted in Fig. 6, showcases how accurately the outcome of a match can be predicted using the pressure index.
Fig. 6
Average accuracy of prediction at each ball.
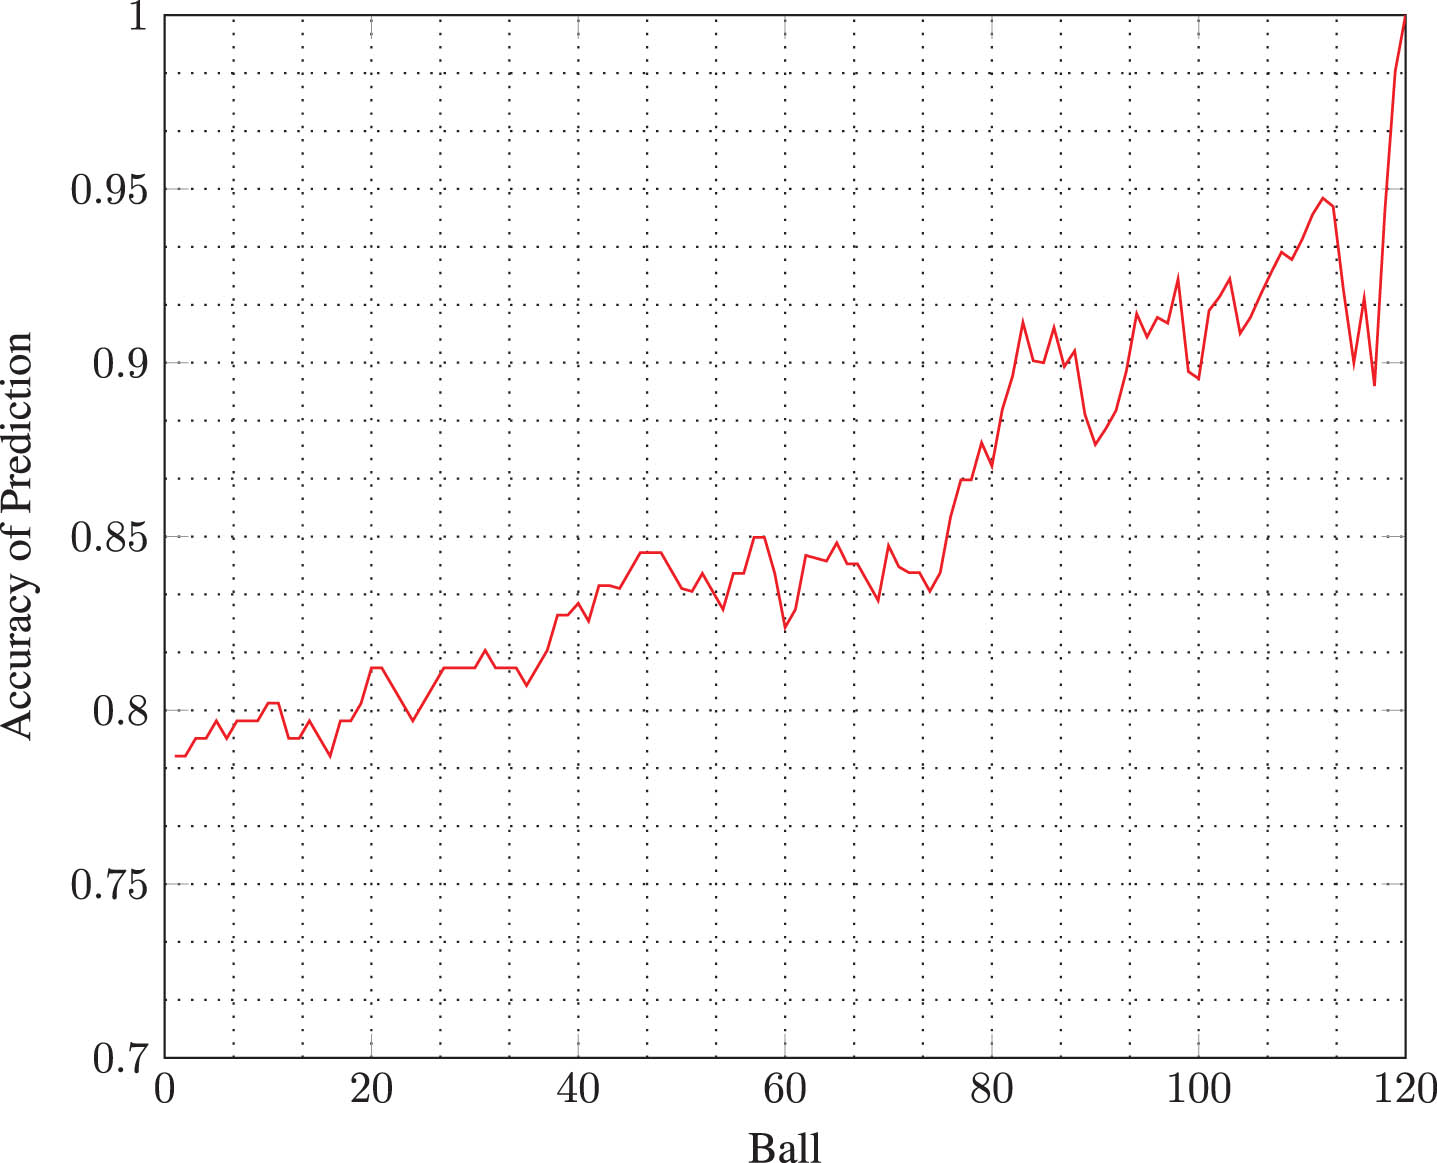
This accuracy of prediction graph demonstrates that the pressure values can be utilized with high accuracy in predicting match outcome. It is noteworthy that the outcome of a match can be consistently predicted with remarkable accuracy, exceeding 80%, at any given stage of the match beyond the sixth over of the second innings. Prior to the sixth over, the accuracy was only slightly less than 80%. Additionally, it appears that the accuracy steadily increases as the match progresses with some minor fluctuations during certain intervals. This overall graph behavior is explained as follows: When pursuing a target in an ideal second innings of a T20I match, the top-order batters usually try to protect their wickets while maintaining at least a reasonable run rate in the initial stage of the innings. By about the twelfth over, batters tend to exhibit clearer intent by attempting to ramp up the scoring, often through taking greater risks. If executed successfully, this strategy can reduce the pressure by boosting the run rate and significantly enhancing their chances of victory. On the other hand, if the team loses more wickets in their pursuit of a higher run rate, the pressure exerted on batters goes up and their prospects of winning diminish. Near the twelfth over often marks a turning point in the direction of the match, and it can be considered a crucial stage of the game. As a result, the utility of using the pressure index for predicting match outcome becomes increasingly pronounced beyond the twelfth or thirteenth over. This phenomenon is clearly evident from the graph of the prediction accuracy shown in the Fig. 6. Nonetheless, losing back-to-back wickets or scoring several boundaries or sixes during the last few overs can significantly change the pressure on batters, and this behavior would naturally lead to fluctuations in the prediction accuracy of match outcome. This phenomenon is also clearly exhibited in the plot at the nineteenth and twentieth overs, which demonstrates the strength of the proposed method for quantifying the pressure exerted on second-innings batters in T20I cricket.
3.2Tuning process to estimate constant k
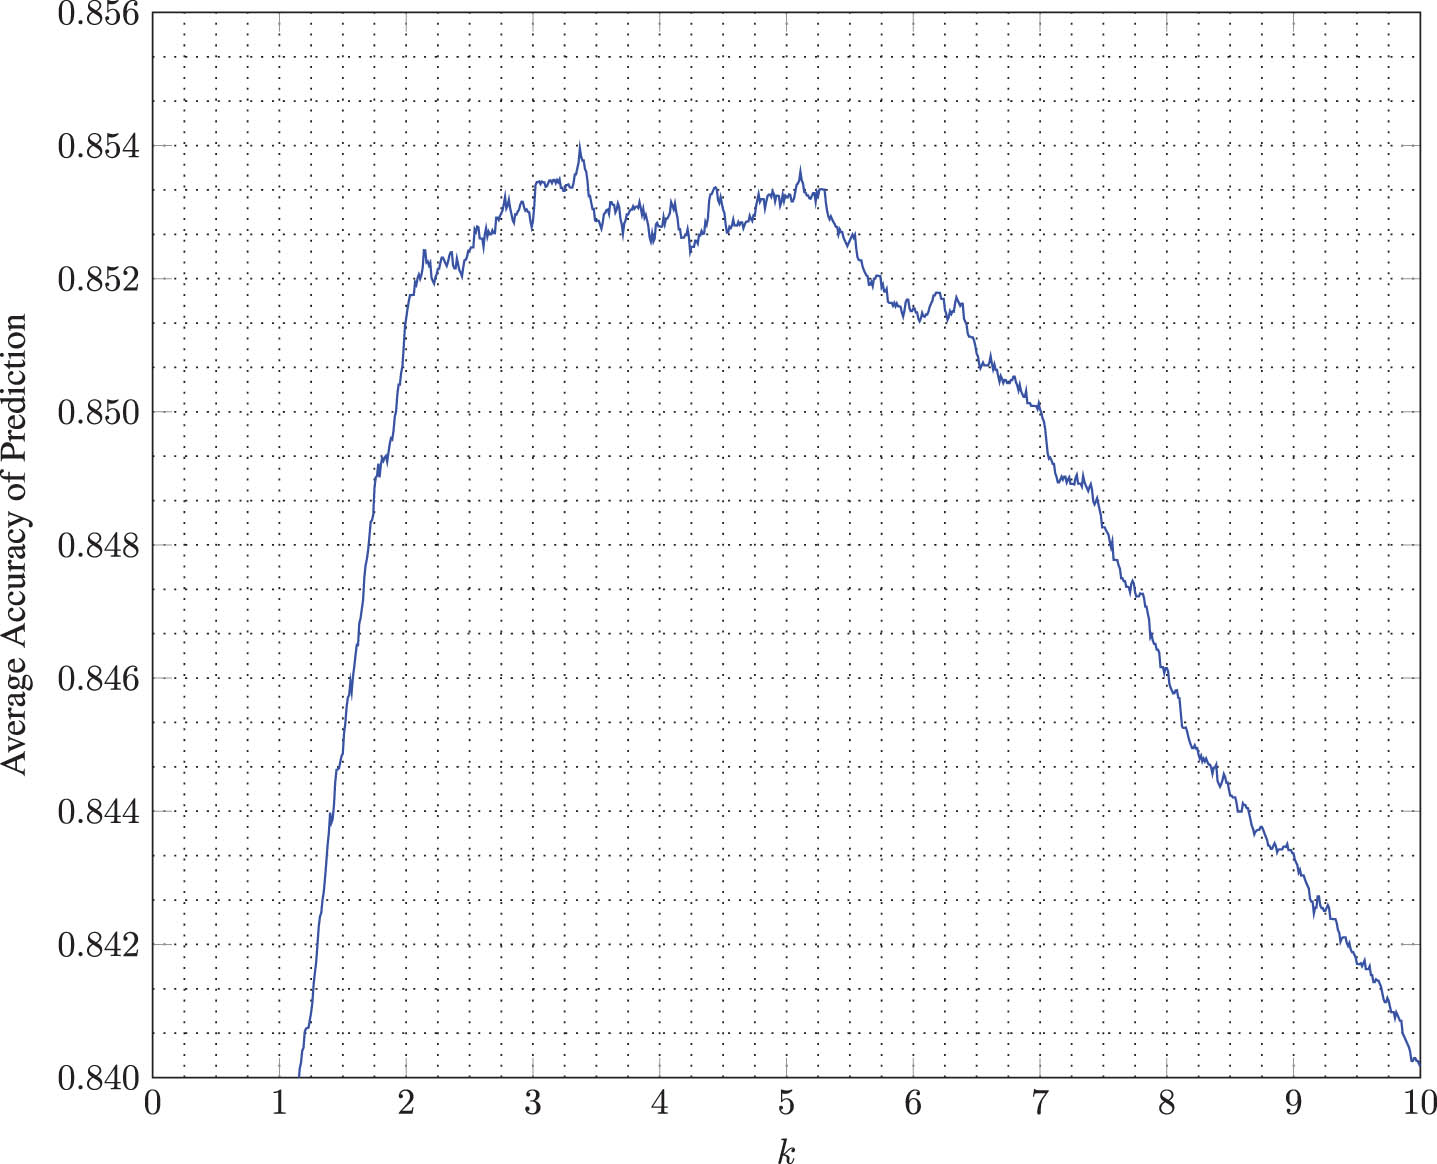
As mentioned in the model formulation section of this article, now we demonstrate how the value of constant k in Equation (8) is estimated for purposes of fine-tuning the model. Recall the the formula we derived for pressure indices in Model Formulation section:
Our approach involves generating a range of values for k and then calculating the accuracy of prediction for each k at each ball delivery using the affiliated logistic regression models. Then, the value of k that results in the maximum average accuracy is chosen as the best value for k that optimizes the model. A tentative range for k is the sequence of values in the interval [1, 10] with increments of 0.1. The graph shown in Fig. 7 indicates that the optimal accuracy is attained when k is approximately 3.37. Nevertheless, any k value between 3 and 5 would make little difference in results obtained because the maximum (and minimum) prediction accuracy 0.854 (and 0.852) for the values of k between 3 and 5 differs only by 0.002, which indicates the robustness of k in the model. Hence, the value of 3.37 was utilized as the constant k in Equation (8) for calculating the pressure index, PI.
Fig. 7
Average (overall) accuracy of prediction vs k.
3.3Comparisons
This section illustrates comparisons between the proposed pressure index, PI and the pressure index PI3 offered by Bhattacharjee and Lemmer (2016). The pressure index, PI3, of Bhattacharjee and Lemmer (2016), ranges between one and positive infinity, while the proposed pressure index, PI, is scaled between zero and ten. This scaling of PI to a finite interval permits pressure comparisons across different matches. When plotted both PI and PI3 show
some similarities in overall patterns. However, there are significant differences between the two methods, as demonstrated through their applications in multiple matches played in the T20 World Cup series held in 2021.
Figure 8(A) shows the pressure indices PI and PI3 for a match played between the West Indies and Bangladesh (T20I no. 1375). In that match, West Indies batted first, scoring 142 runs, while Bangladesh batted second and lost by 3 runs in the final over. The two graphs show some clear differences in the last over, right after the loss of the 5th wicket at the end of the 19th over of the Bangladesh innings. For the loss of that wicket, Bangladesh needed 13 runs in the over for victory, but was only able to score 9 runs, causing match loss by 3 runs. Table 2 shows the number of runs required for the Bangladesh team to win the match at the onset of each delivery in the last over, together with the pressure index for each method.
Fig. 8
Pressure index comparison for (A) West Indies vs Bangladesh (T20I no. 1375) and (B) Sri Lanka vs Australia (T20I no. 1374)
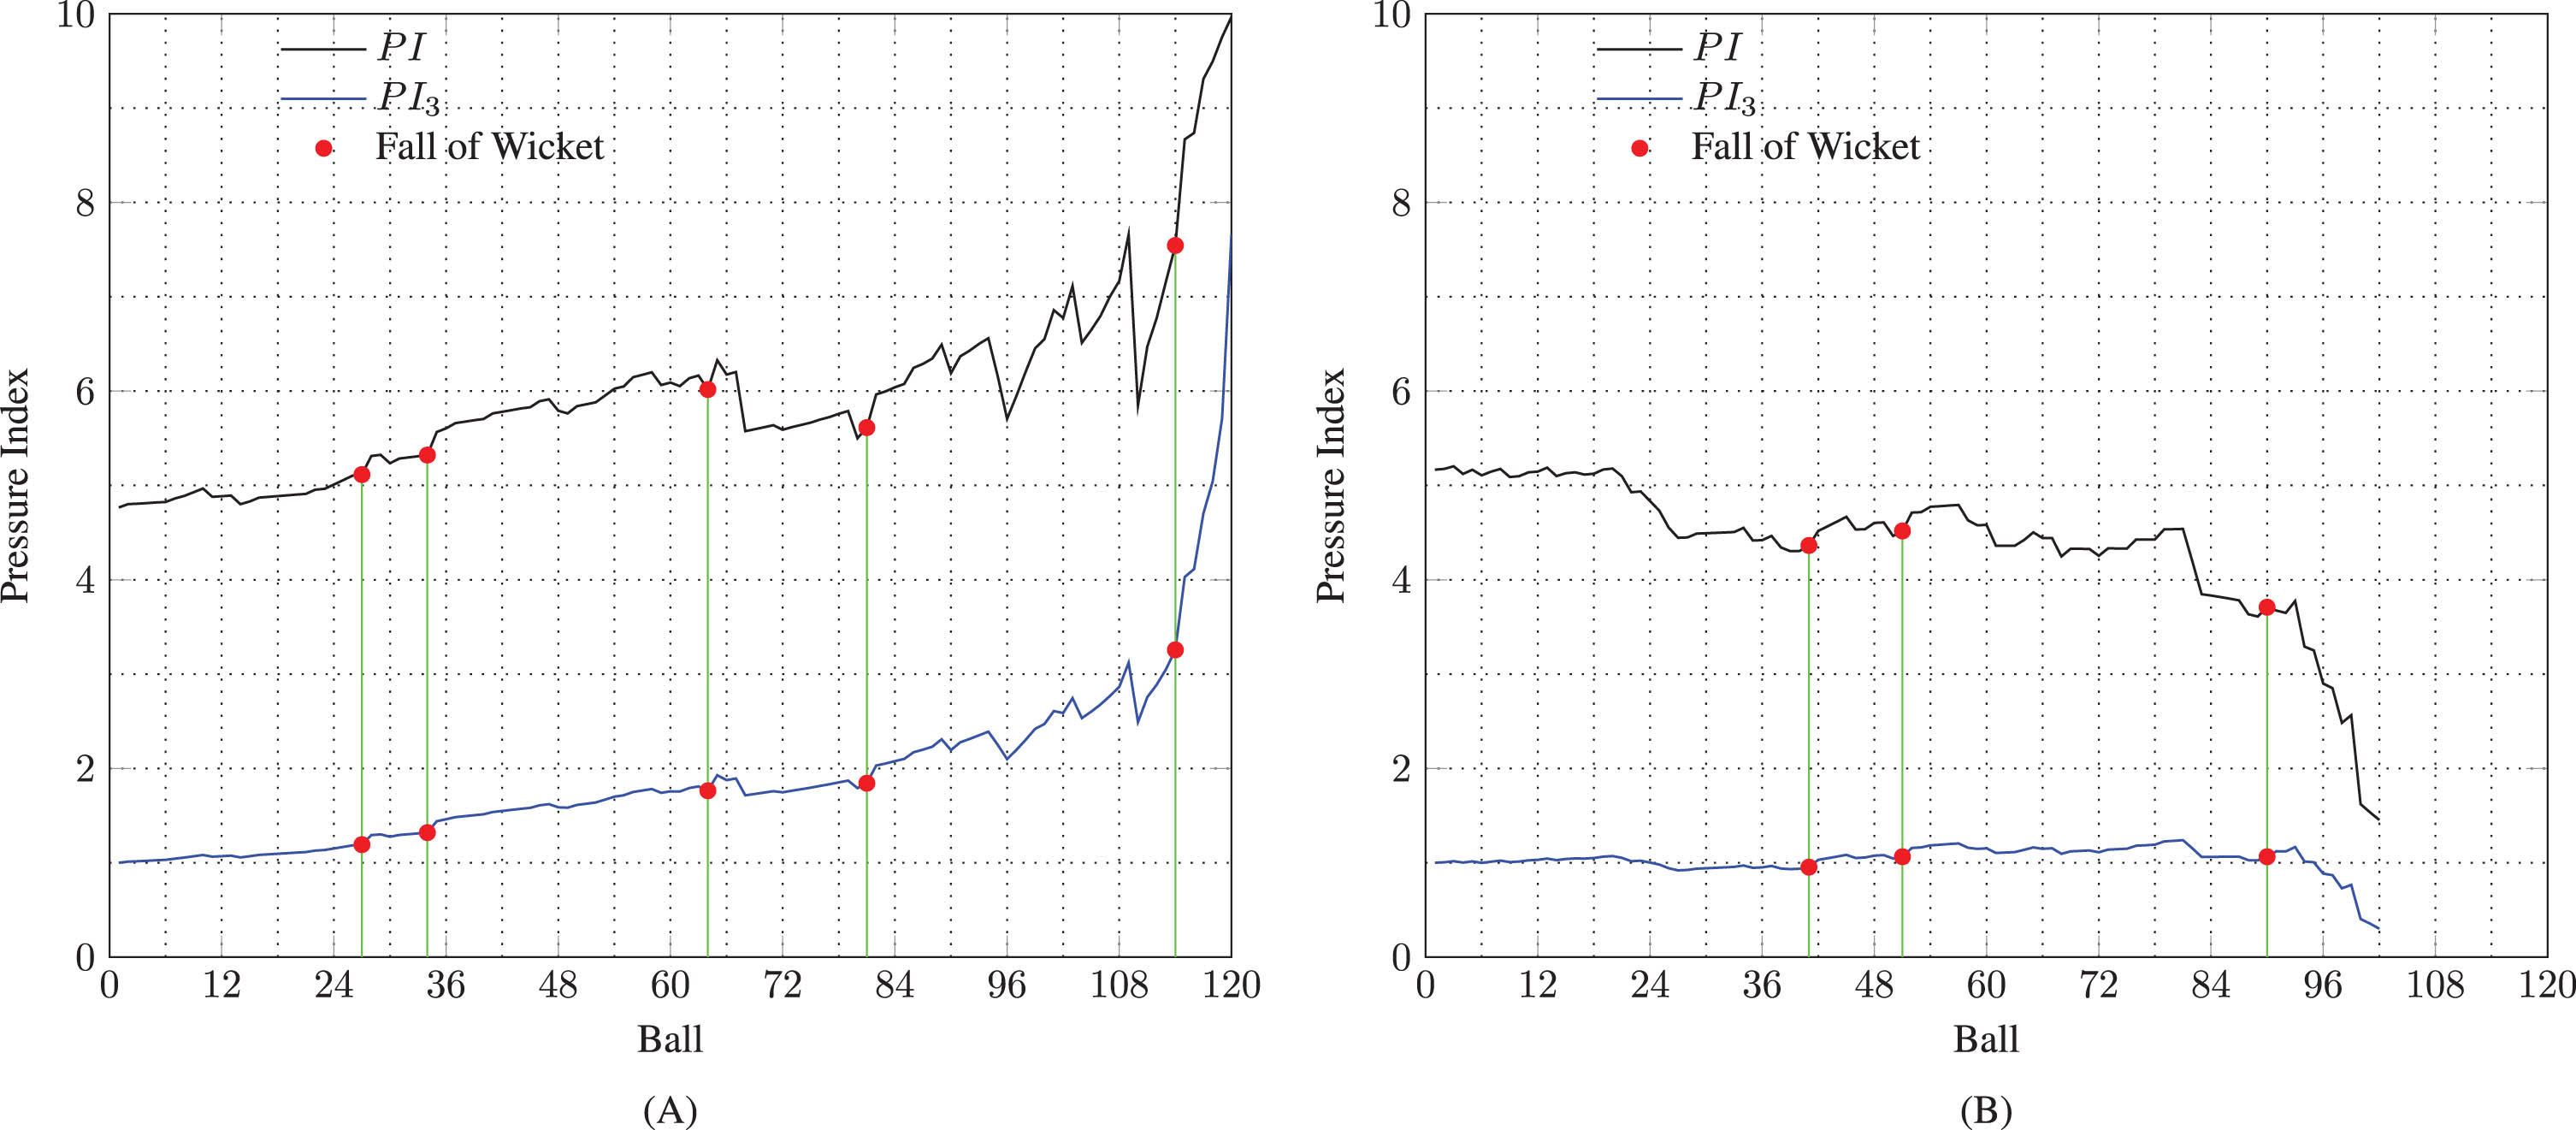
Table 2
West Indies vs Bangladesh (T20I no. 1375): Pressure indices in the last over
| Delivery | Runs to win | PI3 | PI |
| 115 | 13 | 4.03 | 8.67 |
| 116 | 11 | 4.11 | 8.74 |
| 117 | 10 | 4.70 | 9.31 |
| 118 | 8 | 5.05 | 9.50 |
| 119 | 6 | 5.71 | 9.75 |
| 120 | 4 | 7.66 | 9.97 |
At the beginning of the final over, the PI3 and PI values were 4.03 and 8.67, respectively. Scoring 13 runs in the last over is a formidable challenge. On its 0 to 10 scale, a value of 8.67 for PI clearly reflects the high pressure experienced by the batters at that point of the match. However, one cannot clearly see the level of the pressure experienced by the batters by just looking at the value of 4.03 for PI3. But, during the progress of that over, PI increases only by 15%, from 8.67 to 9.97, whereas PI3 increases by 90% from 4.03 to 7.66. As previously mentioned, at the beginning of the last over, Bangladesh needed to score 13 runs in six balls to win the match, and they needed 4 runs to win the match at the last delivery. From a batter’s viewpoint, even though scoring 4 runs in the last delivery may give rise to greater pressure than scoring 13 runs in six balls, the proportion of the pressure increase should not be too high.
Pressure indices for the match between Sri Lanka and Australia (T20I no. 1374), where Australia batted second are plotted in Fig. 8(B). In this match, there are some significant differences between the two graphs of the pressure values PI and PI3. Despite brief fluctuations, the pressure index PI remained in a state of consistent decline throughout the match until its conclusion in the seventeenth over. In particular, as a result of a streak of high-scoring shots after the 92nd ball, pressure index PI started decreasing at a faster rate. In contrast, pressure index PI3, proposed by Bhattacharjee and Lemmer (2016), shows several longer periods in which pressure is increasing. That is, PI3 is increasing in the first three overs, and an overall increase in pressure is visible between the seventh and fourteenth overs. By the 92nd ball, Australia needed only 24 runs to win in 28 balls, holding 7 wickets. They scored the winning run with 18 balls to spare. During this time, the reduction in pressure on batters is quite perceptible, but the PI3 graph does not adequately display that reduction.
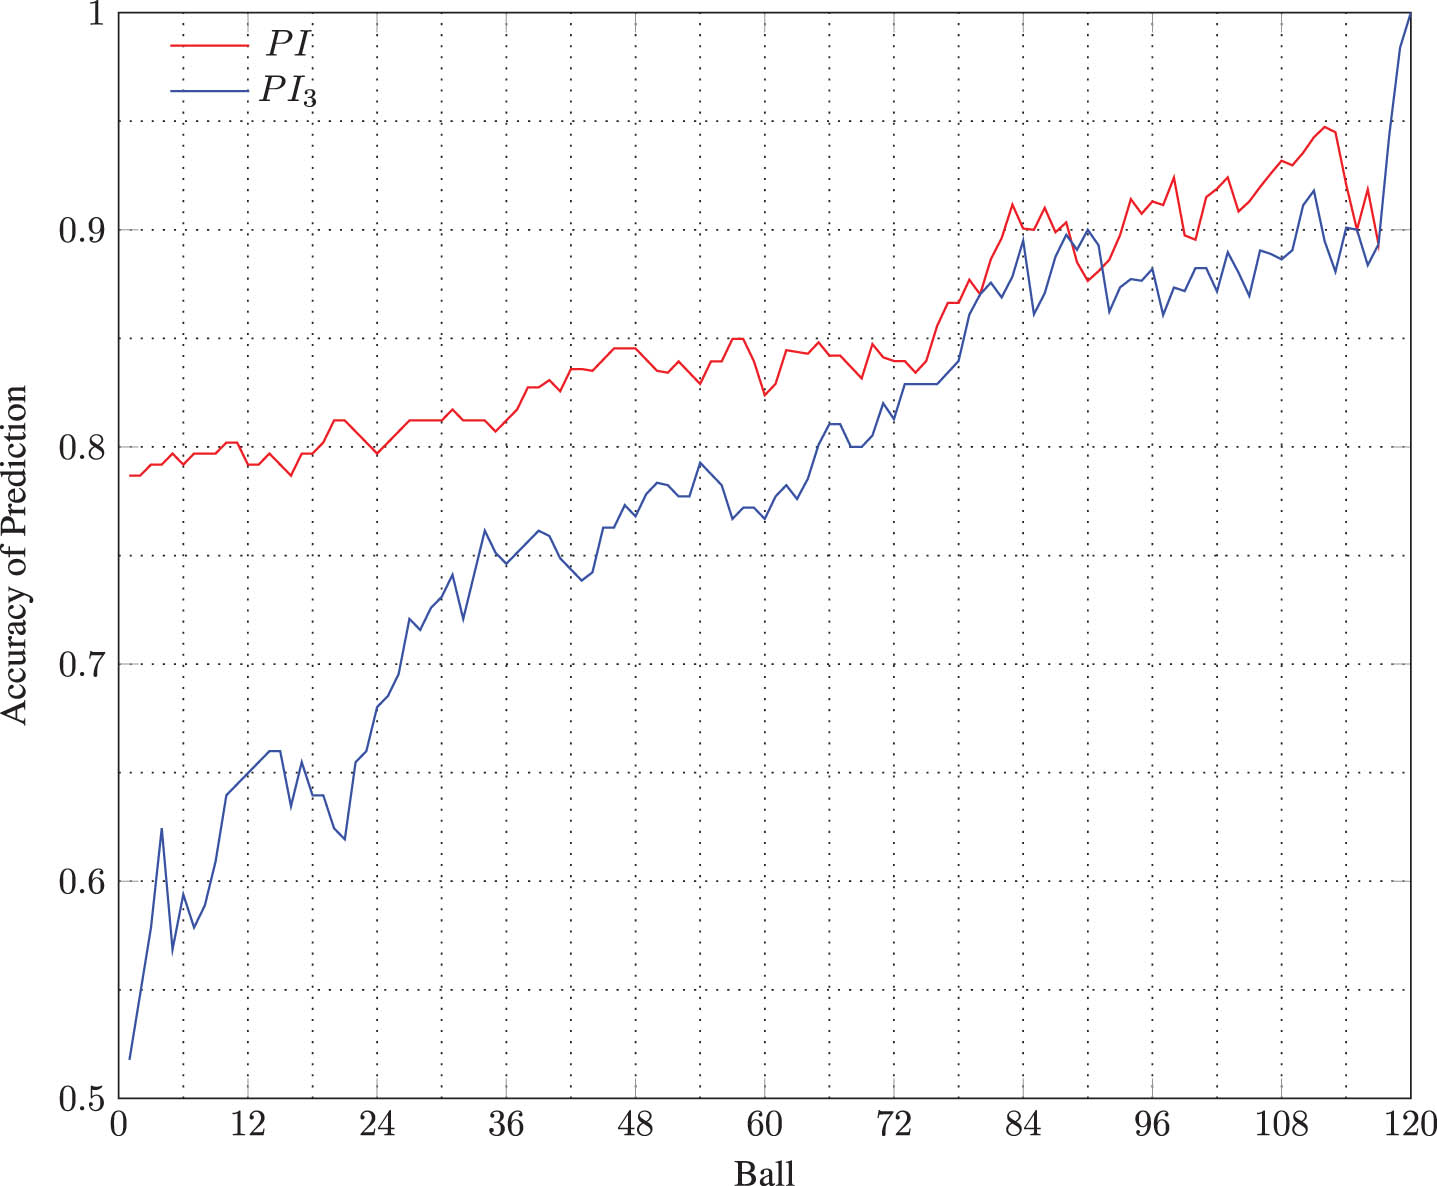
Another noteworthy difference in the two methods is the accuracy of prediction. For comparison, the PI accuracy plot in Fig. 6 is reproduced here in Fig. 9 along with the PI3 accuracy plot, proposed by Bhattacharjee and Lemmer (2016). It is evident from the graphs that the prediction accuracy of PI is consistently higher than that of PI3 throughout the progress of the entire match. This indicates that PI is better at capturing the actual pressure on batters compared to PI3.
Fig. 9
Comparison of accuracy of prediction based on PI and PI3.
3.4Evaluating batting contributions
Pressure indices can also be used to quantify and gauge the contribution of batters by accounting for both runs scored as well as the pressure levels when each run is scored. Intuitively, scoring runs under greater pressure should be favorably considered when recognizing the man-of-the-match award in scenario where that recognition is given to a second-innings player with outstanding batting performance. When there are two or more contenders with significant batting performances, their individual contributions can be quantified based on the pressure being exerted on them during their scoring deliveries. This will enable the man-of-the-match selectors to choose an awardee based on scientific reasoning, rather than subjective judgment alone.
We define the relative batting contribution of batter i, denoted by RBCi, to be
Table 3
Sri Lanka vs Pakistan (T20I no. 449): Relative batting contribution for each batter who contributed in the second innings
| Batsman | RBCi |
| Mukhtar Ahmed | 2.68 |
| Ahmed Shehzad | 4.65 |
| Mohammad Hafeez | 8.74 |
| Shoaib Malik | 6.16 |
| Umar Akmal | 3.21 |
| Mohammad Rizwan | 15.45 |
| Shahid Afridi | 45.05 |
| Imad Wasim | 23.15 |
| Anwar Ali | 46.05 |
| Sohail Tanvir | 0.83 |
| Mohammad Irfan | 0.83 |
4Conclusions
The central theme of this article is the development of a pressure index capable of quantifying the pressure exerted on batters in the second innings of a T20I cricket match. The proposed pressure index is mathematically derived by formulating a differential equation based on several empirical observations. The assumptions are intuitive and reasonable in relation to the evolution of the game of cricket in the limited-overs format. Reliance on mathematical derivations based on realistic assumptions is a key strength of this pressure index, which also facilitates comparison of pressure indices across different matches.
The efficacy of the proposed pressure index as a predictor variable for predictive models makes it a superb tool for accurately forecasting the outcome of cricket matches. This was justified by employing the pressure index as a predictor variable in a logistic regression model to forecast cricket match outcomes. The resulting prediction accuracy of these models was consistently high, surpassing 80% for most stages of the matches studied here.
Prediction accuracy comparisons between the proposed pressure index, PI, and the pressure index, PI3, of Bhattacharjee and Lemmer (2016) have also been performed, substantiating the superiority of PI for its designed purpose of quantifying game pressure.
A consequence of the developed model is that this sensible pressure index can be used to find the winning probability at any stage of the second innings of a match. In addition, this index provides a scientific avenue to adjudicate batters for awards such as man-of-the-match, when such an award is to be conferred on a batter from the team batting second. For this method, the relative batting contributions made by each batter who bats in the second innings is calculated, and then those values can be enlisted to rank players. For this purpose, the relative batting contribution is calculated based on the premise that batting under higher pressure is given higher appraisal.
Fine-tuning of the model is achieved by optimizing the only model parameter, k, that arises in solving the foundational differential equation, using data collected from matches previously played.
Although the proposed method has been developed for T20I cricket, it can easily be adapted for ODI matches. One key difference between T20I and ODI formats is that there are longer stretches of play in which batters concentrate on stabilizing the innings, rather than attempting to increase the run rate. But, such longer stretches may have a minimal impact on the pressure exerted on batters. Among other ideas, future research directions on this topic could involve incorporating an Allee effect into the model.
References
1 | Baumeister, R. F. & Showers, C. J. ((1986) ). A review of paradoxical performance effects: Choking under pressure in sports and mental tests. European Journal of Social Psychology. |
2 | Bhattacharjee, D. & Lemmer, H. H. ((2016) ). Quantifying the pressure on the teams batting or bowling in the second innings of limited overs cricket matches. International Journal of Sports Science & Coaching, 11: (5), 683–692. |
3 | Duckworth, F. C. & Lewis, A. J. ((1998) ). A fair method for resetting the target in interrupted one-day cricket matches. Journal of the Operational Research Society, 49: (3), 220–227. |
4 | Hepler, T. J. ((2015) ). Decision-making in sport under mental and physical stress. International Journal of Kinesiology & Sports Science, 3: (4), 79–83. |
5 | Hill, D. M. & Shaw, G. ((2013) ). A qualitative examination of choking under pressure in team sport. Psychology of Sport and Exercise, 14: (1), 103–110. |
6 | Jones, G , Hanton, S. & Connaughton, D. ((2007) ). A framework of mental toughness in the world’s best performers. The Sport Psychologist, 21: (2), 243–264. |
7 | Manage, A. B. & Scariano, S. M. ((2013) ). An introductory application of principal components to cricket data. Journal of Statistics Education, 21: (3). |
8 | Otting, M , Deutscher, C , Schneemann, S , Langrock, R , Gehrmann, S. & Scholten, H. ((2020) ). Performance under pressure in skill tasks: An analysis of professional darts. PLoS ONE, 15: (2), e0228870. |
9 | Swann, C , Crust, L , Jackman, P , Vella, S. A , Allen, M. S. & Keegan, R. ((2017) ). Performing under pressure: Exploring the psychological state underlying clutch performance in sport. Journal of Sports Sciences, 35: (23), 2272–2280. |
10 | William, R. L , Freeman, P , Butt, J , Stoker, M. & Maynard, I. ((2022) ). The role and creation of pressure in training: Perspectives of athletes and sport psychologists. Journal of Applied Sport Psychology. |


