
Sabermetrics by the sea: Evaluating college players with the Cape Cod Baseball League
Abstract
From the dawn of the “Moneyball” system of searching for players with undervalued skills, an increasing proportion of players chosen in the Major League draft has come from the collegiate ranks, and while every professional team has an analytics department, the draft remains the last frontier for identifying and acquiring the best prospective players. Thus, it has become more important in recent years to evaluate college players properly, and while players’ statistics during the college season can vary wildly due to differing levels of competition, it is necessary to find a more objective metric for measuring college players’ skills.
We propose that the most effective metric for doing so comes from observing players’ performances during the summer, when the variable of strength of schedule can be directly controlled, as players of the same skill level compete against each other. Our study focuses on the Cape Cod Baseball League (CCBL), a prestigious summer league that attracts the most talented college players, from which many players are drafted into the Majors every year. Our reasons for choosing the CCBL are the aforementioned homogeneity of talent; the lack of effects of travel fatigue, as the teams all play in a concentrated geographical area; and the league’s built-in replacement level, as temporary players often fill roster spots for players who had been selected the previous autumn, but whose college teams have advanced to the College World Series or who play on a national team during part of the CCBL season. This replacement level is used to calculate a metric of Wins Above Replacement, which we call cWAR.1
1Description of the project
1.1Previous work on the metric
Our project began in the 2019 Cape Cod season, and several players who played on the Cape that summer and were drafted the following year have recently made their debuts in the Major Leagues. We developed the first version of the cWAR metric, largely following the algorithm of FanGraphs, but not including fielding (as accurate hit location data have been unavailable) and using a replacement-level baseline based on the average runs created per plate appearance among temporary players (Kilanowski, 2020). The most notable find from our study, as it turned out, was noticing that Brandon Pfaadt of Bellarmine University, a Division II school at the time, ranked fifth in the league among all pitchers in WAR, even though he was overlooked for the All-Star team and post-season awards; this fall, he became the first player in the study to play in the World Series, as a rookie with the Arizona Diamondbacks. Later, we made refinements to the model, such as replacing fielding-independent pitching (FIP) with weighted on-base average (wOBA) allowed as the basis for calculating pitchers’ WAR and expanded our data to every Cape League season since the offense-dominated summer of 2012, in which Aaron Judge, Kyle Schwarber, and Sean Manaea played (Kilanowski, 2021). At this point, we focused our efforts on investigating the relationship between a player’s cWAR one summer and his rank in the Major League draft the following year.
This version of WAR differs from those formulated from Major League data in three significant ways. First, the Cape League has a markedly different run expectancy matrix and set of weights for wOBA, as seen in Table 9 of the Appendix (Drummey, 2023). The league tends to be lower-scoring than the Majors, mainly because many of the batters are using wooden bats for the first time. This results in lower values in the run expectancy matrix, particularly for the states with no runners on base, as well as higher weights for wOBA (for example, 0.95 instead of 0.90 for a single in a typical year). The weights are also higher due to the greater occurrence of wild pitches, passed balls, and errors on the Cape as compared to the Majors, meaning that reaching base is at a premium in this top-end summer collegiate league.
Second, many Major League algorithms, such as that of FanGraphs, calculate WAR differently for starting pitchers and relief pitchers, but since the same pitchers often play both roles on the Cape, we make no such distinction for cWAR. While the various algorithms use different base statistics for calculating WAR for pitchers (for example, FanGraphs uses FIP while Baseball Reference uses runs allowed per nine innings), we use wOBA allowed, converting this to runs the same way that we do for batters, since this correlates better with team wins and draft position.
Third, the baseline for replacement level for cWAR is taken to be the average of all temporary players (who fill out the rosters early in the season while the full-time players are still playing in the College World Series or with Team USA), rather than an arbitrarily defined baseline as most Major League WAR algorithms do. The result is that the replacement level varies from season to season, but the metric more accurately reflects the player’s performance relative to the talent pool that year.
1.2Purpose of this study
The goal of this article is to refine and extend the cWAR metric further, which we aim to do in three ways. First, we will investigate the use of skill-interactive earned-run average (SIERA) to calculate pitchers’ WAR, as this statistic takes into account results over which the pitcher has more control, namely, strikeouts, walks, ground balls, and fly balls. Second, we will modify the baseline for replacement level and the calculation of park factors, while also accounting for positional effects, in order to compare batters more accurately to other players at the same position. Third, we will test whether these modifications to the model improve its fit to the actual data. Our main considerations for this paper are to compare players’ cWAR in the 2021 season with their positions in the 2022 Major League draft, and the WAR figures for the 2022 season with teams’ actual winning percentage the same year. Our study shows that wOBA, for pitchers as well as hitters, remains the most effective measure for evaluating players as it provides the best correlation with both draft position and team results, although in some years, expected fielding-independent pitching statistics (xFIP) and SIERA can provide a better fit for the pitchers. Section 2 of the article will detail these modifications to cWAR, while Section 3 will test the new model both qualitatively and quantitatively, while Section 4 will observe conclusions about the model and the directions in which this study can go in the future.
2Modifying the model
2.1Introducing SIERA
Previously (Kilanowski, 2021), we found that replacing FIP with wOBA allowed by each pitcher provided a stronger fit between WAR and draft position and team wins than in the original model (Kilanowski, 2020). Wishing to improve the fit even further, we recently considered xFIP and skill-interactive ERA (SIERA) as alternatives to FIP, as they consider each pitcher’s rate of fly balls (and in the latter case, ground balls) allowed. This consideration is especially important in the Cape League, because the field dimensions vary greatly from one park to another, and SIERA is useful for evaluating amateur talent because it measures the marketable skill of inducing ground balls on contact. The calculations for xFIP used the league average proportion of fly balls and line drives that went for home runs from the ten seasons 2012–2022,2 and for SIERA, we ran a multiple regression over the data from the same ten seasons to find the coefficients, based on how each pitcher’s runs allowed per nine innings correlates with his number of strikeouts, walks, and net ground balls (ground balls minus fly balls, including line drives and pop-ups) per batter faced. Following the example of Baseball Prospectus, we include some, but not all, of the second-order terms (Swartz, 2011). One small adjustment that we made this year was to reduce the criterion for replacement level for pitchers from 40 batters faced to 20, so as to avoid counting some stronger pitchers as replacement level. We can use a lower threshold for pitchers, since pitchers tend to have less playing time than hitters during the summer, as college coaches are wary about preserving their pitchers’ arms for the next spring season. The regression coefficients used for SIERA, along with comparable ones used for the Majors, appear in Table 1.
Table 1
Multiple regression coefficients for SIERA for both the Cape Cod Baseball League (2012–22) and Major League Baseball
| Term | CCBL SIERA | MLB SIERA (Baseball Prospectus) |
| Intercept | 6.742 | 6.145 |
| Strikeout rate, x | –32.744 | –16.986 |
| Walk rate, y | 34.637 | 11.434 |
| Net ground ball rate, z | –6.011 | –1.858 |
| X2 | 32.002 | 7.653 |
| z*|z| | 0.061 | –6.664 |
| x*z | 13.352 | 10.130 |
| y*z | –9.197 | –5.195 |
2.2Park factors
A word must be said also on our refinement of the calculation of park factors. Previously, we used the ratio of each team’s runs scored at home to runs scored on the road; however, this assumes that every game is of the same length. This is not often the case on the Cape, as three parks (Cotuit, Yarmouth-Dennis, and Brewster) do not have lights, and games are more frequently called short on account of darkness there; several other games are called for weather, and doubleheaders (whether scheduled or containing games that had to be made up) have games of only seven innings each. League rules regarding extra innings have also changed throughout the years. Therefore, our park factor calculations now normalize each team’s number of runs per inning and use the data from the past ten seasons, 2012 through 2022. The park factors for the ten teams from these years appear in Table 2.
Table 2
Park factors for the ten parks in the Cape Cod Baseball League, 2012–22
| Team | Park | Park Factor |
| Bourne Braves | Doran Park | 108.92 |
| Brewster Whitecaps | Stony Brook Field | 133.04 |
| Chatham Anglers | Veterans Field | 100.12 |
| Cotuit Kettleers | Lowell Park | 115.42 |
| Falmouth Commodores | Arnie Allen Diamond | 93.64 |
| Harwich Mariners | Whitehouse Field | 89.50 |
| Hyannis Harbor Hawks | McKeon Park | 105.14 |
| Orleans Firebirds | Eldredge Park | 96.97 |
| Wareham Gatemen | Spillane Field | 88.60 |
| Yarmouth-Dennis Red Sox | Red Wilson Field | 125.34 |
2.3Positional adjustments
One more addition to the model to standardize it and compare each batter more fairly to other players at his position is that of the positional adjustment. Most algorithms for WAR include such an adjustment, often in units of runs, for each position based not only on the average offensive output from batters at that position, but also on the defensive difficulty of the position. While our model does not yet include fielding data, we have decided to consider how to compare each batter to the average hitter at his position (or positions if he played many during the season) rather than the average of all batters, so that the mode will better reflect who is the best available player at a given position, as Major League teams often aim to draft such a player.
To do this, we calculated the average wOBA for all plate appearances, grouped by position, over the ten seasons which we analyzed, and compared it to the league average wOBA (.332) over the same period. The differences appear in Table 3.
Table 3
Positional adjustments (with numbers of plate appearances for each position) based on wOBA for the Cape Cod Baseball League, 2012–22
| Position | Count | Average wOBA | Difference from league average |
| C | 16650 | .318 | –.014 |
| 1B | 17648 | .347 | +.015 |
| 2B | 17578 | .337 | +.005 |
| 3B | 17608 | .332 | 0 |
| SS | 17334 | .326 | –.006 |
| LF | 17254 | .337 | +.005 |
| CF | 18003 | .333 | +.001 |
| RF | 17638 | .345 | +.013 |
| DH | 17244 | .320 | –.012 |
| PH | 3157 | .291 | –.041 |
As expected with such a large data set (160,499 plate appearances), we observed several anomalies. Pitchers do not ordinarily bat in the Cape League, but when they did (89 times), they showed a difference of –.039, or 39 points of wOBA lower than league average. Eighteen plate appearances were mistakenly attributed to pinch runners with an average difference of +.115; four were labeled “DP”3 with an average of -.139; and four others were left blank and had a large positive average difference of +.628. Anomalies aside, the data show that the differences from the norm based on positions are small but noticeable: catchers tend to have the lowest wOBA while first basemen and right fielders have the highest; and there is a marked “DH penalty,” and an even larger pinch-hitting penalty (Tango, Lichtman, Dolphin, 2006), giving evidence to the theory that players who do not play the field are less prepared to bat.
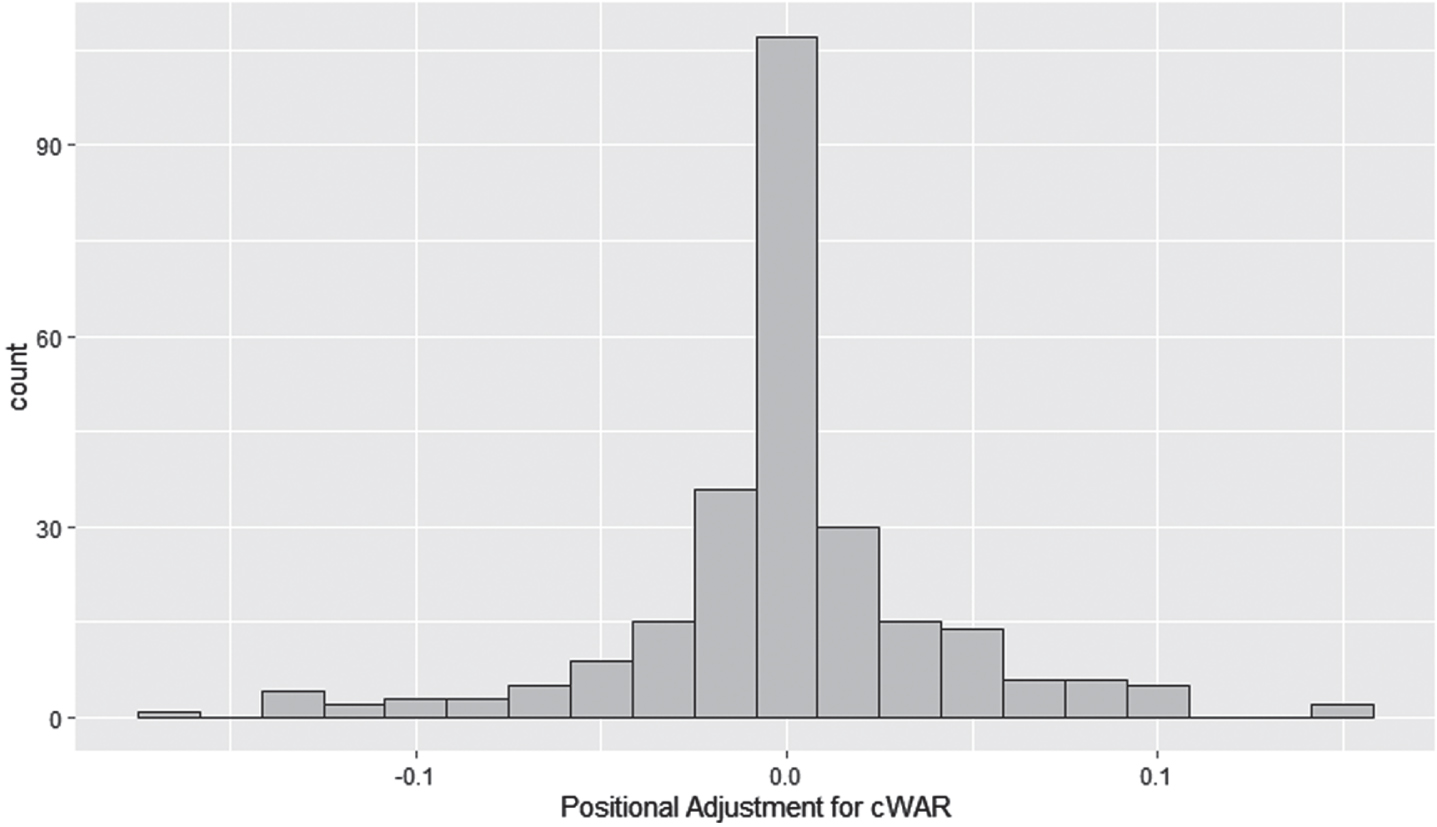
When this adjustment is added to the WAR model for the 2022 season, which we did by calculating the average positional adjustment for each batter and subtracting it from his wOBA, some small differences emerge. For most players, especially those who were not primarily catchers, first basemen, right fielders, or designated hitters, their WAR values only changed slightly, as the standard deviation of differences in WAR between the adjusted and non-adjusted models was only 0.0417. Among top players, league MVP Matt Shaw shows a decrease of less than 0.001, while Chris Brito’s WAR decreased by 0.122, and Cooper Ingle’s increased by 0.153, showing the range of adjustments based on one’s primary position. All differences were between -0.2 and +0.2, and were concentrated around 0 in a distribution with lower kurtosis than the normal distribution, as indicated on the histogram in Fig. 1.
Fig. 1
Histogram of the difference between each batter’s WAR with and without offensive positional baseline modifications (the positional adjustment) in the Cape Cod Baseball League, 2022.
3Testing our results
We can test the efficacy of our WAR model both qualitatively and quantitatively. The qualitative method, while not conclusive, indicates whether it identifies the same players as the tops in the league as the league officials and voters do, by comparing them to the list of players who receive awards at the end of the season. The top ten hitters and pitchers by cWAR in the 2022 Cape League season appear in Tables 4 and 5.
Table 4
Top ten batters in the Cape Cod Baseball League by cWAR (also including wOBA), 2022
| Player | wOBA | cWAR | Award |
| Matt Shaw, Bourne | .469 | 2.65 | MVP, All-League 2B |
| Mitch Jebb, Cotuit/ Hyannis | .436 | 2.38 | All-League 3B |
| Christopher Brito, Bourne | .432 | 2.26 | All-League 1B |
| Colby Halter, Falmouth | .433 | 2.18 | All-League IF |
| Max Anderson, Wareham | .375 | 1.84 | All-League Util. |
| Nick Goodwin, Harwich | .383 | 1.70 | All-League Util. |
| Michael Sirota, Hyannis | .444 | 1.59 | All-League OF |
| Tommy Troy, Cotuit | .425 | 1.53 | Outstanding Pro Prospect (SS) |
| Luke Keaschall, Orleans | .363 | 1.49 | All-League Util. |
| Owen Diodati, Wareham | .498 | 1.43 | [Only played 21 games] |
Table 5
Top ten pitchers in the Cape Cod Baseball League by cWAR (ranked by WAR based on wOBA allowed), 2022. The table also includes WAR based on xFIP (“cWAR22”) and SIERA (“cWAR23”) for comparison
| Pitcher | cWAR | cWAR22 | cWAR23 | Award |
| Bryce Warrecker, Orleans | 1.85 | 0.81 | 2.00 | Pitcher of the Year |
| Ben Hampton, Chatham | 1.54 | 1.33 | 3.29 | All-League SP |
| Ryan Ure, Brewster | 1.35 | 0.34 | 1.08 | |
| Brian Fitzpatrick, Brewster | 1.21 | 0.50 | 1.21 | All-League RP |
| Jordy Allard, Hyannis | 1.19 | 0.55 | 1.42 | New England Player of the Year, All-League RP |
| Grant Taylor, Y-D | 1.18 | 1.33 | 2.48 | |
| Juaron Watts-Brown, Falmouth | 1.05 | 0.80 | 1.72 | |
| Zachary Voelker, Hyannis | 1.00 | 0.25 | 0.59 | |
| Jared Lyons, Y-D | 0.99 | 0.44 | 0.88 | All-League SP |
| Connor Markl, Y-D | 0.94 | 0.12 | 0.20 |
Notice that for pitchers, “cWAR” by itself refers to the model with wOBA allowed as the foundational statistic; “cWAR22” is based on xFIP; and “cWAR23” is based on SIERA. The existing WAR model correctly determined the league MVP and Pitcher of the Year, and was effective in identifying the best hitters, but as before, it was not as effective for pitchers, as some of the leading pitchers in WAR did not win any end-of-season awards. Other pitchers who did make the All-League Team were Ty Cummings (0.46/ 0.36/ 0.88), Chase Jeter (0.82/ 0.36/ 1.12), Jackson Kelley (0.73/ 0.67/ 1.36), Brennen Oxford (0.85/ 0.31/ 0.71), Joe Savino (0.87/ 0.70/ 1.41), Cam Schuelke (0.64/ 0.23/ 0.57), Drew Sommers (0.80/ 0.57/ 1.26), Josh Stewart (0.82/ 0.43/ 1.07), and Cameron Weston (0.72/ 0.54/ 1.36).
To test the model quantitatively, we performed two linear regression tests using the data that became available this year. The first test measures the Pearson product-moment correlation between a team’s actual wins (rendered as a winning percentage, with each tie counted as half of a win and half of a loss) and the total cWAR amassed by all players on a team. The improved correlation between cWAR and actual wins for several seasons was the reason that we switched from FIP to wOBA allowed as the foundational statistic for pitchers’ WAR, and if we can improve upon it even further with xFIP or SIERA, we will use that statistic instead.
Unfortunately, for the 2022 season, both xFIP and SIERA provide a worse fit than wOBA when converted to WAR, with SIERA even showing a negative correlation with wins. This is likely because the replacement-level baseline for SIERA is too low, resulting in a higher total number of pitching WAR across the league (108.22 as opposed to 56.91). However, the results are markedly different for 2021. While xFIP provides a slightly worse fit than wOBA allowed, SIERA give the best fit of all; the effect size of the difference between the fits due to SIERA and wOBA is small, with a Cohen’s q value of 0.1449 (Cohen, 1988).4 Table 6 shows the Pearson correlation coefficients for each measure of WAR, when fitted against team wins, for both the 2021 and 2022 seasons.
Table 6
Pearson correlation coefficients between team winning percentage and team WAR for three pitching WAR metrics, Cape Cod Baseball League, 2021–22
| WAR metric | Correlation, 2022 | Correlation, 2021 |
| cWAR (wOBA) | 0.8518 | 0.7243 |
| cWAR22 (xFIP) | 0.1967 | 0.6533 |
| cWAR23 (SIERA) | –0.1319 | 0.7923 |
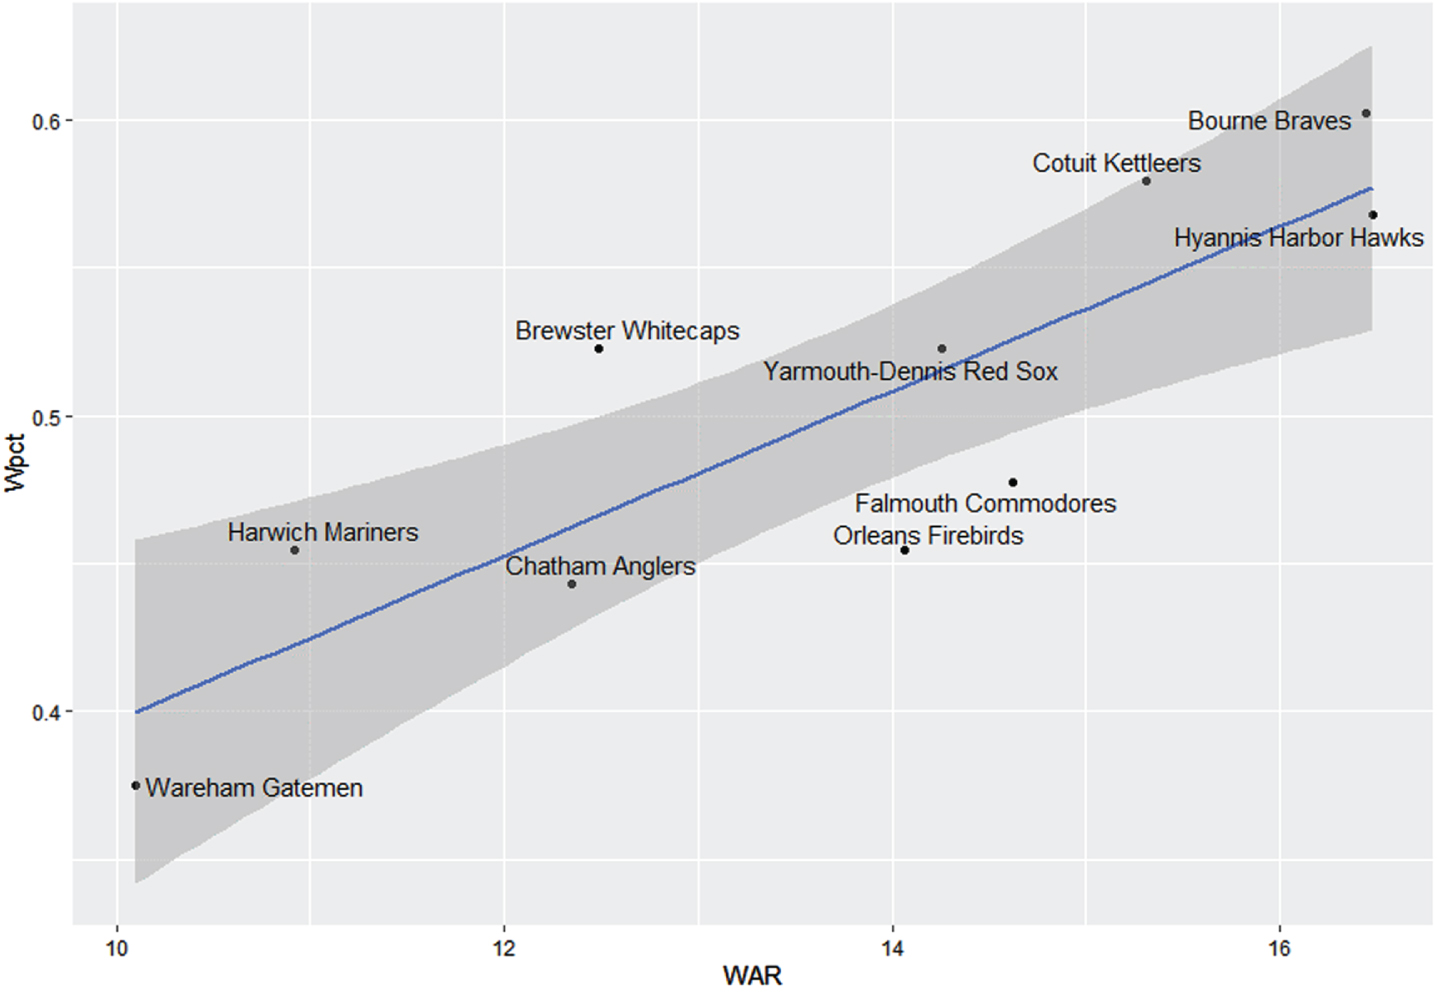
For the 2022 season, only the existing cWAR (with wOBA as the basis for pitching) has a statistically significant relationship with team wins at the 0.05 level; the regression line is y = 0.1188 + 0.0278 x. The expected slope is 1/44, or 0.0227, since one more win above replacement should result in one more win for the team, and this value fits well within an 80% confidence interval for the slope, namely (0.0194, 0.0363). For 2021, however, all metrics show a statistically significant relationship at the 0.05 level, with SIERA as the best of the three, being significant at the 0.01 level as well.5 The graph in Fig. 2 shows the linear relationship between cWAR and team wins for the 2022 season, the strongest relationship seen in the past two years. Notice that the Brewster Whitecaps (who won the Eastern Division) overperformed their team WAR, while the Orleans Firebirds and Falmouth Commodores underperformed based on it.
Fig. 2
Team winning percentage versus team WAR, with least-squares regression line and 95% confidence bands, Cape Cod Baseball League, 2022. Points are labeled by team names.
The other test involves finding the strength of the relationship between a player’s WAR (and other statistics) for one season, and his position in the Major League draft the following season. A previous article of ours (Kilanowski, 2021) examined the link between cWAR in 2019 and the 2020 draft, using the Pearson correlation coefficient, which assumes that both variables fit a normal distribution. For our study, a more appropriate measure of correlation for the purpose of making inferences is the non-parametric Spearman rank-correlation coefficient ρ. Tables 7 and 8 show the values of Spearman’s ρ for both batters and pitchers, between their WAR (and other commonly used statistics) in 2021 and their position in the 2022 Major League draft.6 In addition, the plots in Figs. 3 and 4 show the shape of the relationship between cWAR and draft position, with a stronger linear fit for batters than for pitchers.
Fig. 3
Scatterplot of draft position (2022) versus WAR (2021) for batters drafted from the Cape Cod Baseball League, with least-squares regression line and 95% confidence bands.
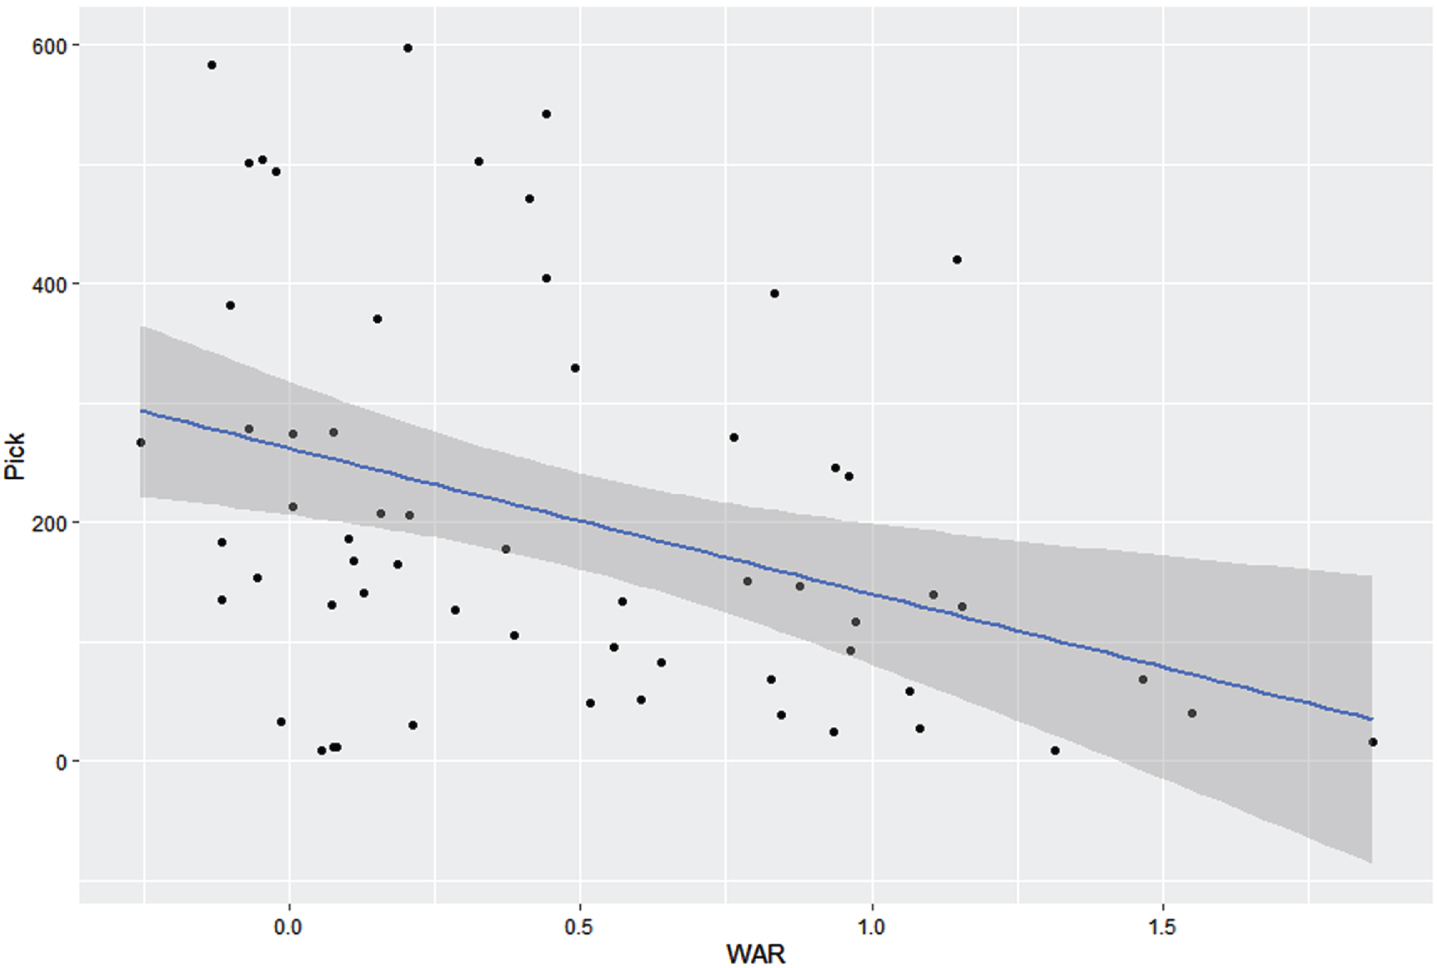
Fig. 4
Scatterplot of draft position (2022) versus WAR (2021) for pitchers drafted from the Cape Cod Baseball League, with least-squares regression line and 95% confidence bands. Compared to the plot for batters, more pitchers have a WAR near 0, resulting in a weaker correlation.
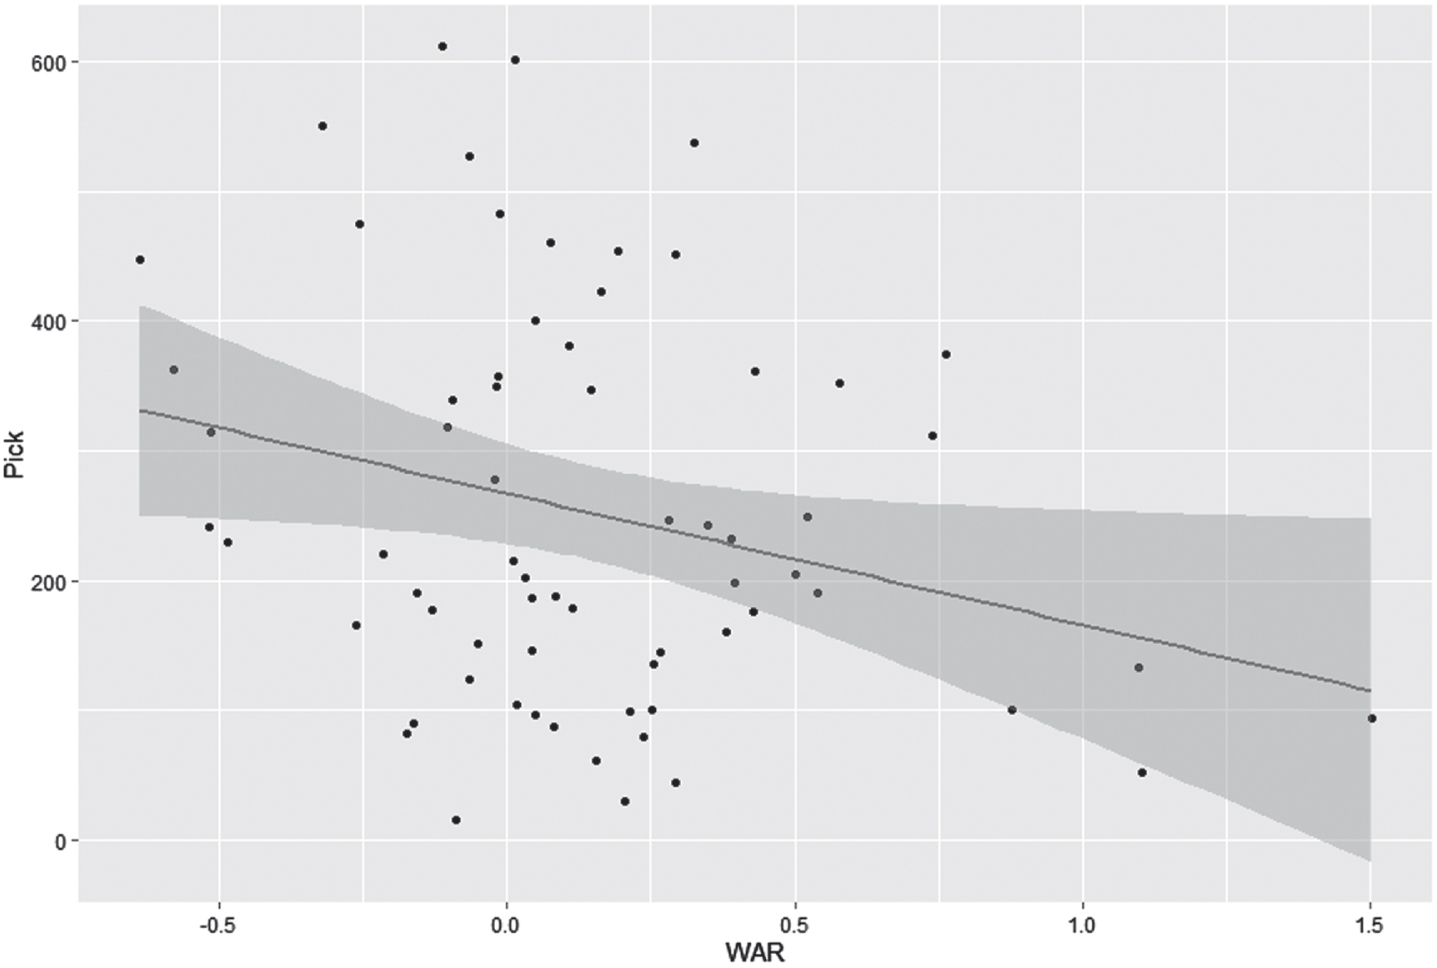
Table 7
Spearman rank-correlation coefficient and associated p-value for various batting metrics of Cape Cod Baseball League players (2021) and their Major League Draft position (2022)
| Batting statistic | Spearman’s ρ | p-value (two-tailed) |
| cWAR | –0.3861 | 0.0023 |
| wRC | –0.3464 | 0.0067 |
| wRC+ | –0.3225 | 0.0119 |
| OPS | –0.3068 | 0.0171 |
| wOBA | –0.3204 | 0.0126 |
| RE24 | –0.2273 | 0.0807 |
Table 8
Spearman rank-correlation coefficient and associated p-value for various pitching metrics of Cape Cod Baseball League players (2021) and their Major League Draft position (2022)
| Pitching statistic | Spearman’s ρ | p-value (two-tailed) |
| cWAR (wOBA) | –0.2034 | 0.0988 |
| cWAR22 (xFIP) | –0.1221 | 0.3250 |
| cWAR23 (SIERA) | –0.0968 | 0.4358 |
| ERA | 0.2052 | 0.0958 |
| WHIP | 0.2429 | 0.0476 |
| FIP | 0.1300 | 0.2944 |
| xFIP | 0.0433 | 0.7279 |
| FIP- | 0.1854 | 0.1331 |
| SIERA | 0.0611 | 0.6233 |
| wOBA allowed | 0.2226 | 0.0702 |
When a team’s aggregate WAR (with positional adjustments) was totaled under the adjusted model and compared to its actual winning percentage, the relationship proved to be slightly weaker than before. The Pearson correlation coefficient decreased from 0.8518 to 0.8499, with a value of Cohen’s q statistic of 0.0069, indicating a very small difference. While this decrease in correlation is certainly not significant, it does suggest that the offensive positional adjustment does not improve the model. We may, however, see an improvement on the individual level, as the adjusted WAR may turn out to be a better indicator of draft position, but we can only find out on this set of data when we analyze the latest MLB Draft of 2023.
4Conclusions
4.1Final observations
The cWAR metric, using wOBA as the basis for evaluating both batters and pitchers, continues to be an effective tool in measuring players’ performance and ability, as it places many of the nation’s top college players on an even playing field so that they can be compared fairly for the Major League draft. For the most recent season, it shows a strong correlation between team WAR and winning percentage, and as before, it agrees with the end-of-season awards more for batters than for pitchers. This is often because several pitchers can impress the scouts more with just a few appearances, while WAR, as a counting statistic, rewards pitchers who throw more innings across the whole season. For example, Jackson Kelley of the Cotuit Kettleers only pitched in five games, but his fastball impressed the scouts and fans and helped him make the All-League team, and his high strikeout rates boosted his xFIP and SIERA numbers. Speaking of which, based on the baselines for these statistics this year, the cWAR numbers based on xFIP appear to be too low, and those based on SIERA to be too high, on the whole. Most striking is the 3.29 value for Ben Hampton, which exceeds the highest WAR value for any player in the study so far, namely, second baseman Nick Gonzales in 2019,7 but this, combined with the weak (and even negative) correlation with team wins leads us to believe that wOBA allowed is still the best way to evaluate pitchers.
The 2021 season did show a marked increase in the correlation coefficient with SIERA-based WAR (just as xFIP did in 2019), but the advantage for that year disappears when the 2022 draft is considered. For batters, cWAR led the way with a weak yet significant negative correlation with draft position, as players with higher WAR ought to be drafted earlier, while for pitchers, the wOBA-based cWAR formula had the only significant fit of the three, but wOBA itself and even WHIP exhibited a stronger fit. The Spearman correlations were weaker for pitchers across the board, likely because there were more pitchers drafted who pitched fewer innings on the Cape, and thus the distribution was more highly concentrated around 0. For both batters and pitchers, several players were drafted early who had limited action or subpar performance in the CCBL, demonstrating that a player’s collegiate statistics are still more of a factor for scouts, but the Cape League statistics still show a significant correlation with draft position, thus showing that our metric is a useful tool for evaluating college players.
4.2Future considerations
To improve further on the model, we hope to refine our positional adjustments to include fielding. To do this, we would use the best defensive data available, with a linear weighting system for putouts and assists, as well as wild pitches for pitchers and passed balls for catchers, possibly even including a pitch-framing metric based on the proportions of balls and strikes called when each catcher is behind the plate. Additionally, we can examine the draft further into the past, and even search for a relationship between players’ WAR on the Cape in the Majors for those who make it that far.
The most promising innovation to the model, however, would be for us to include data from TrackMan that have recently been made available with the 2023 season. While on-field performance during a short summer season and with a small sample size may not be the best indicator of a player’s skill, the information from TrackMan will enable us to measure each player’s intrinsic ability, such as with exit velocity for batters and spin rate for pitchers. Adding these values to our cWAR model ought to provide a fuller picture of each prospect, which we can call Total Prospect Rating, and we can use the methods of machine learning to build the best predictive model for when each player should be drafted. A particular application of our study would be to identify which players from smaller colleges or lesser-known conferences, such as Nick Gonzales and Brandon Pfaadt, ought to be given consideration from scouts who may otherwise overlook them. With these refinements, we propose that our model be considered when Major League scouts evaluate collegiate players for the annual draft, which remains one of the last arenas for finding a competitive advantage in acquiring players’ skills in an analytically driven age.
Acknowledgments
We would like to thank, from the Cape Cod Baseball League, official scorer Chris Thoms, league official Bill Bussiere, and intern Savannah Nowak; and the other students in our research course at Providence College: Gianpaolo Colannino, Elizabeth Ferreira, John Incantalupo, Jacob Lebeuf, Austin Nolan, Riley Stone, and Kayla Sullivan, for their assistance with this project.
References
1 | Cohen, Jacob. Statistical Power Analysis for the Behavioral Sciences, 2nd ed. Mahwah, NJ: Lawrence Erlbaum Associates, 1988. |
2 | Drummey, Dylan. “Adjusting for the Current Run Expectancy Matrix.” PitcherList, available at https://www.pitcherlist.com/adjusting-for-the-current-run-expectancy-matrix/, accessed July 2023. |
3 | Kilanowski, Humbert. “cWAR: Modifying Wins Above Replacement with the Cape Cod Baseball League,” Baseball Research Journal Vol. 49, No. 1 (Spring 2020), 99-105. |
4 | —. Revisiting cWAR: Analyzing the Cape Cod Baseball League as a Path to the Majors,” By the Numbers 30.2 (Nov. 2021), 3-7. |
5 | Marchi, Max, with Jim Albert and Benjamin S. Baumer. Analyzing Baseball Data with R, 2nd ed. New York: CRC, 2018. |
6 | Slowinski, Piper. “WAR for Pitchers,” FanGraphs, https://library.fangraphs.com/war/calculating-war-pitchers/, accessed January 2023. |
7 | Swartz, Matt. “New SIERA, Part Two (of Five): Unlocking Underrated Pitching Skills,” FanGraphs, https://blogs.fangraphs.com/new-siera-part-two-of-five-unlocking-underrated-pitching-skills/, accessed January 2023. |
8 | Tango, Tom M., with Mitchel G. Lichtman and Andrew E. Dolphin. The Book: Playing the Percentages in Baseball. TMA, 2006. |
Appendix: Construction of the cWAR Measure from Kilanowski (2020)
Our calculation of WAR is based on the algorithm described on FanGraphs, the most transparent of the major WAR models used for the Major Leagues. For batters, the main ingredient in the formula is weighted on-base average (wOBA), based on the linear weights for each type of outcome (walk, single, and so forth). These weights, in turn, depend on the run expectancy matrix for the league, which can change dramatically from year to year; for example, the mean number of runs per game decreased from 9.657 in 2021 to 8.009 in 2022 in the Cape League.8 Therefore, we first mined the play-by-play data from the 2022 CCBL season using a program we wrote in RStudio, using an algorithm of Albert, Baumer, and Marchi (2018, pp. 111-134) as a guide, and calculated the mean number of runs that the team at bat scored until the end of the inning, given the state of outs (0, 1, or 2) and base runners (whether there is a runner on each base).
With these values, summarized in Table 9, we then calculated the mean run value of each type of outcome relative to an out and multiplied these linear weights by a scaling factor to assure that the league-average wOBA is the same as the league-average OBP. In 2022, this factor was 1.301, the third highest for any year in our study9 behind only 2013 and 2015, and much higher than the 1.155 from 2021, as higher scaling factors indicate lower run-scoring environments. A value for runs due to baserunning, namely linear weights for stolen bases and caught stealing based on their average run value, was also added to the wRC values. Next, we compared each player’s wOBA to the league average to find his weighted runs created per plate appearance, found the average of this last statistic among temporary players to define the baseline for replacement level, and compared each player’s wRC against this baseline to compute wins above replacement.
Table 9
Run expectancy matrix for the Cape Cod Baseball League, 2022 season, with the corresponding Major League values from 2022 in parentheses. The CCBL values include some smoothing of the raw data to account for some run values for the rarer states being out of order. Notice that the Major League values are higher in 16 of 24 cases, including all but one (runner on first, no outs) of the more common states
| Base runners | 0 outs | 1 out | 2 outs |
| Empty | 0.4679 (0.476) | 0.2346 (0.254) | 0.0821 (0.097) |
| 1st only | 0.8652 (0.865) | 0.4891 (0.508) | 0.1937 (0.205) |
| 2nd only | 1.1662 (1.073) | 0.5931 (0.667) | 0.3021 (0.308) |
| 3rd only | 1.4180 (1.272) | 0.9146 (0.974) | 0.3392 (0.377) |
| 1st and 2nd | 1.5322 (1.435) | 0.9948 (0.902) | 0.4104 (0.440) |
| 1st and 3rd | 1.7417 (1.753) | 1.1025 (1.147) | 0.5476 (0.500) |
| 2nd and 3rd | 1.7761 (2.005) | 1.2803 (1.390) | 0.5740 (0.548) |
| Bases Loaded | 2.2540 (2.367) | 1.5472 (1.508) | 0.6848 (0.767) |
For pitchers, we originally used fielding-independent pitching (FIP) as the main rate statistic that was converted into runs, and in turn, wins (Slowinski, 2012). While FIP is effective at focusing on the outcomes over which a pitcher has control, it does not account for whether the pitcher allows many hard-hit balls in play. Thus, we sought to determine whether other metrics would yield a more accurate version of WAR for pitchers. Previously, we used each pitcher’s wOBA allowed, calculated the same way as we did for batters, as the basis for WAR, and found that it did provide a better fit for players’ draft positions and their teams’ overall wins. This is what spurred us on to search for other ways to improve our model even further.
Notes
1 The ‘c’ stands for the Cape, and the statistic is pronounced “sea war.”
2 Namely, 7.82% of fly balls and 2.13% of line drives.
3 This may stand for “designated player,” a term used in softball. It is likely that this means “DH,” and that the batters labeled “PR” had entered the game as a pinch-runner for the DH and never took the field. These, plus the blank entries, account for only 0.016% of plate appearances.
4 This measure, which places the difference between correlation coefficients on a logarithmic scale, is considered “small” if it is near 0.1, “medium” at 0.3, and “large” at 0.5.
5 The critical values for Pearson’s r at n = 10 are 0.632 at p = 0.05, and 0.765 at p = 0.01.
6 Critical values for Spearman’s ρ: for batters (n = 60), 0.255 for p = 0.05, 0.214 for p = 0.10; for pitchers (n = 67), 0.241 for p = 0.05, 0.203 for p = 0.10.
7 Nick Gonzales of New Mexico State posted a 3.02 cWAR in 2019, and his is perhaps the greatest recent success story of the Cape League, as he proved that his gaudy batting totals in college were not simply due to high altitude or mid-major competition, but he won the league MVP and led his Cotuit Kettleers to a championship. He was drafted seventh overall in 2020 and has made his Major League debut with the Pittsburgh Pirates in June 2023.
8 A similar decrease occurred during this time in the Majors as well, from 10.661 to 9.443 runs per win.
9 Our study covers ten seasons, from 2012 to 2022. The Cape League did not play in 2020; only smaller pop-up leagues such as the Newport Collegiate Baseball League did.


