
Predicting athletic performance from physiological parameters using machine learning: Example of bocce ball
Abstract
Machine learning (ML) is an emerging topic in Sports Science. Some pioneering studies have applied machine learning to prevent injuries, to predict star players, and to analyze athletic performance. The limited number of studies in the literature focused on predicting athletic performance have adopted the cluster-then-predict classification approach. However, these studies have used the independent variable to represent athletic performance at both the clustering and classification stages. In this study we used only physiological parameters in the classification of bocce athletes. Their performance classes were predicted with high accuracy, thus contributing new findings to the literature. The support vector machines-radial basis function (SVM-RBF) kernel correctly predicted all athletes from the high-performance bocce player (HPBP) cluster and 75% of the athletes in the low-performance bocce player (LPBP) cluster. Using machine learning to predict athletic performance from balance data was found to be a time-saving approach for selecting high-potential bocce athletes.
Highlights
• Performance classes of athletes were predicted using only physiological parameters.
• Identifying high-potential athletes in advance can prevent loss of trainer time.
• Machine learning was used in the prediction of high and low performance classes.
• Performance class prediction for bocce athletes is unique in the literature.
1Introduction
Bocce is a game in which a ball is thrown or rolled toward a pallino (target ball). One point is received for each ball thrown closer to the pallino than the opponent’s balls. If the opponent’s ball is closer to the pallino, instead of rolling the ball, the player can throw it to hit the pallino or the opponent’s ball. The bocce/petanque technique includes motor skills such as simple ball selection, basic position, gripping the ball, and releasing the ball. When shooting in the petanque style, the athlete stands with legs open in the sagittal plane, with the lower extremities slightly flexed and the weight equally distributed on both legs. The distance between the legs can be equal to the thoracic anteroposterior diameter, or may be more open. The body is tilted slightly forward and the back is rounded to a comfortable position. With the shoulders parallel to the foul line, the arm holding the ball is slightly bent and the ball is brought to the front, whereas the other arm is stretched on the side of the body. The arm holding the ball swings to the back and at the same time, the player takes a step forward with the back foot (Bălan et al., 2018). One of the fundamental skills needed for this whole process to proceed smoothly is that of balance. There are two types of balance: static and dynamic. Static balance provides stability on the support base with minimal movement (Hrysomallis, 2011). Dynamic balance can be defined as achieving a sporting performance while maintaining or regaining a stable position (Winter et al., 1990) or the ability to maintain or regain balance on a moving ground with minimal external movement (Kioumourtzoglou et al., 1997; Paillard and Noé, 2006). In view of the bocce or petanque bowling technique, the balance of both lower extremities and upper extremities is extremely important in performing the movement and ending it successfully.
Machine learning is a method relatively new to Sports Science. However, significant advances have been made in many sports fields, ranging from personal training to professional competitions (Ashley, 2020). In recent years, because of the success of machine learning methods for prediction and classification problems, these techniques have also been applied in Sports Science. Machine learning is expected to significantly increase the impartiality of the performance decision-making process in Sports Science (Richter et al., 2019; Rommers et al., 2020). Moreover, studies have shown that machine learning has been successfully used to characterize abnormal movement profiles in injured athletes (Richter et al., 2021; Rommers et al., 2020). Based on the skills required by this category of sport, in addition to the personal observation of the coach, the support of the machine learning approach gives objective results in the decision-making process and is vital for determining promising athletes in the sport of bocce. Because of the importance of the subject, the purpose of this study was to label bocce players according to their personal records (PRs) as a low-performance bocce players (LPBPs) or high-performance bocce players (HPBPs) using machine learning clustering methods (i.e., dividing them into clusters) and then, to predict the clusters of bocce players using only the balance parameters (NRL, NLL, NAR, and NAL) via the machine learning classification method of support vector machines (SVM). As a result, all athletes from the HPBP cluster and 75% of the athletes in the LPBP cluster were correctly classified. It should be emphasized here that the PR feature used to label the bocce players as LPBP or HPBP was not used to predict the classes. The prediction of LPBP and HPBP classes using only balance scores is unique in the literature. To the best of the authors’ knowledge, no other study has investigated the dynamic and static balances of bocce/petanque athletes.
2Method
2.1Basic methodology and measurement
2.1.1Procedure
This study is a cross-sectional study. The data were collected from a predetermined population over three days. All measurements were made in the open area where the bocce athletes were trained. The average wind speed in the area was 6.7 km/s, and the average air temperature was 80.60°F. In order to conduct the study, an Ethical Approval Certificate (2020/33/3-E27320) was obtained from the Scientific Research and Publication Ethics Committee of the University. Parents of all participants and the trainer were informed about the procedures to be carried out and all signed the Informed Consent Form prepared according to the Helsinki criteria.
2.1.2Participants
Nineteen national bocce athletes (12 females and 7 males) participated in the study. Licensed national athletes who had been training 2 h per day, four days a week for at least two years and who had no physical disabilities or chronic diseases were included in the study. Non-national athletes, despite having participated in regular training for two years, were excluded from the study. The average height of the athletes was 165.32±7.66 cm and their average body mass was 62.74±12.04 kg. Their mean training time was 4.32±2.29 years.
2.1.3Lower extremity balance measurement
The Y Balance Test was used for the lower extremity balance measurement. On the platform, the barefoot athletes must stand on one leg with the foot behind the starting line. They are asked to reach as far as they can to determine the maximum distance with the other foot in anterior, posterolateral, and posteromedial directions. In the Y Balance Test device, there is an angle of 135° between the anterior and posterior directions, and an angle of 90° between the posterior directions. In order to eliminate the fatigue effect, first, three attempts are made in the anterior direction for both legs, and then three trials are made in the posteromedial and posterolateral directions. Athletes must maintain contact on the ground using the free foot as a way to balance. Inability to return to their starting position or ability to balance only by separating their hands from their waist were accepted as mistakes, and the trial was deemed invalid. The best scores in three different directions for both legs were evaluated. The scores were normalized to the athlete’s leg length. The distances reached in the anterior, posteromedial, and posterolateral directions were summed, divided by three times the lower extremity length, and multiplied by 100 to normalize the measurements.
2.1.4Upper extremity balance measurement
The Y Balance Test was used for the upper extremity balance measurement. The test material consisted of rods extending in the medial, inferolateral, and superolateral directions and connected to a central platform. The rods were positioned at an angle of 45° between them and at 135° from the pipe in the medial direction. On the platform, there were distance meters at 1-mm intervals on the medial, inferolateral, and superolateral pipes to determine the distance that could be reached by the athletes. The test was applied to both arms of the participants. The athletes stood on the Y Balance Test platform in the push-up position with their hands at the center point, whereas their feet were shoulder-width apart and the center of the legs and buttocks was stable. While maintaining a stable posture with one hand, the athletes were asked to reach to the farthest point possible using only the upper extremity without support from the center of the lower extremities and buttocks. They then pushed the blocks on the rods with their fingertips, using the hand in the medial, inferolateral, and superolateral directions The athletes performed the application by returning to the stable posture position each time without touching the ground. If they did not return to the starting position or failed to perform the test according to the rules described above, the measurement was deemed unsuccessful and repeated. The distances reached in the medial, inferolateral, and superolateral directions were summed, divided by three times the arm length, and multiplied by 100 to normalize the measurements (Cramer et al., 2017; Türkeri et al., 2020).
2.1.5Static balance measurement
The flamingo balance test was conducted to measure static balance. In the flamingo balance test, while balancing with the right and left feet, respectively, on a wooden balance beam of 50-cm length, 4-cm height, and 3-cm width, the athlete flexed the other foot at the knee and held it close to the buttocks. While balancing on one foot, the athlete tried to maintain this stance for 1 min after the chronometer was started. The chronometer was stopped when the balance was lost, i.e., if the participant let go of the foot, fell off the beam, touched the ground with any part of the body, etc. When the participant regained the balance by getting back on the beam, the chronometer was started again. The test continued for 1 min. During this period, each attempt of the participant to regain balance was counted and recorded as the balance score at the end of the test.
2.2Experimental approach to the problem
2.2.1Pre-investigation of data
Because the number of athletes participating in the study was fewer than 50, the normality of the distribution was evaluated using the Shapiro-Wilks test. Skewness and kurtosis values were calculated. The distribution was normal because the skewness value was between -1 and+1 and the kurtosis values were between -2 and+2 (Weir and Vincent, 2021). The significance level for all analyses was determined as p < 0.05.
2.2.2Clustering: Hierarchical Agglomerative Cluster Analysis (HACA)
If the data have not been previously arranged into clusters or the clusters are unknown, they can be divided into clusters via cluster analysis. In this study, the athletes were divided into two clusters as HPBP and LPBP, according to their personal record (PR) values using hierarchical agglomerative cluster analysis (HACA). Hierarchical clustering places similar samples into the same cluster without the need for any other information about the data (Alpaydin, 2020). For the clustering, several different distance measures (e.g., Euclidean distance and Manhattan distance) may be used to calculate the similarity of the data. This study used Euclidean distance.
The HACA initially puts each sample in a separate cluster, and then combines similar groups until they become a single cluster (Alpaydin, 2020). A graphic tree called a dendrogram is usually created to represent the result of the clustering process. If a certain number of groups, are required, the tree is cut off at the desired level. Python programming language, Scikit-Learn (Pedregosa et al., 2011), and Pandas and Matplotlib modules were used for all clustering and classification analyses.
2.2.3Classification: Support Vector Machines (SVM)
Support vector machines is a supervised machine learning method for data classification and regression analysis (Alpaydin, 2020). Classification means predicting the cluster in which the data will fall. The SVM classifier (SVC) is often used for binary classification problems, but can also be used for multiclass classification (Crammer, 2002). This study used the SVC to predict the HPBP and LPBP classes of the bocce players.
If we imagine the data samples as points in hyperspace, then SVC aims to find a hyperplane that best separates the data samples into two classes. The SVC chooses the data elements on the margins of both classes as support vectors. The point, as a product of the vector and the sample data, returns a value. The class of the data is decided according to these values. The point product can also be represented using a generalized kernel function. In this case, the general equation for SVM is as follows (Alpaydin, 2020):
(1)
Here, α is a constant, y ∈ {1, - 1} are data classes, (xi, xk) are input vectors, and K is the kernel function.
There are several kernel functions for SVC. Kernel functions allow data classes to be separated by different types of hyperplanes (linear, polynomial, radial, etc.). This provides different options for data that cannot be classified using one kind of hyperplane. The standard kernel functions are:
• Linear: K (xi, xk) = (xi · xk)
• Polynomial: Kik = (1 + 〈xi, xk〉) d. Here, d is the polynom degree.
• Radial Basis Function (RBF): K (xi, xk) = exp(- γ ∥ xi - xk ∥ 2). Here, γ is a constant.
There is no magic equation to determine which kernel function to use for any specific case. In practice, some parameters affect the SVC performance.
Common to all SVC cores, the C parameter balances the simplicity of the hyperplane versus the misclassification of data. The C parameter can be considered as a penalty point for misclassification. This parameter should be determined separately for each class according to the size of the classes. When the dataset is imbalanced, the classifier learns the major class better. In order to prevent this, in the case of data misclassification in the minor class, the penalty to be imposed should be greater. If the classes are equal in size (i.e., if the dataset is balanced), the same C value can be used for both classes.
The gamma parameter is used with RBF and polynomial kernel functions. The gamma determines how far the influence of a single training datum reaches other data. Low gamma values cause distant data to be evaluated as similar (in the same class). High gamma values drive very comparable data together to be assessed as similar (in the same class) (Pedregosa et al., 2011). The Gamma parameter must be optimized according to the problem.
2.2.3.1 Model Training and Testing Because the SVC performance is strictly dependent on normalizing the features, the data between 0 and 1 were normalized first. The k-fold stratified cross-validation was applied in order to prevent the evaluation of the SVC performance using training and test data chosen by chance. The k-fold stratified cross-validation splits the data into random k subsets and then uses one set for testing and the other sets for training. This process continues until all sets are used for both training and testing. Finally, the average of the results for each fold is used. Thus, overfitting of the model is avoided. This study experimented with many different k values. For the sake of brevity, only the results for the best value of k = 3 are given here.
2.2.3.2 Model Evaluation The SVC classification performance was evaluated using balanced accuracy (BA), area under the precision-recall curve (AUCPR), and Matthew’s correlation coefficient (MCC). The confusion matrices used in the calculation of these metrics are also given.
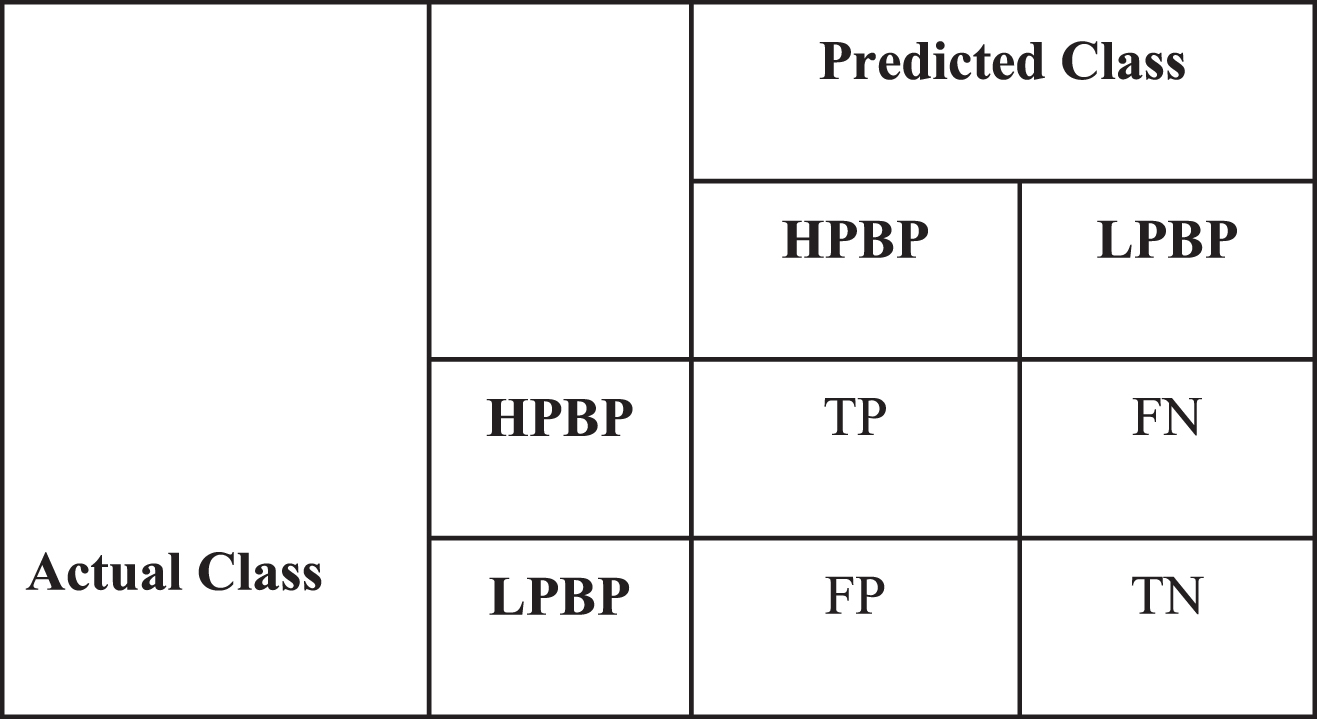
The confusion matrix shows the size of the predicted class versus the size of the actual class. A sample confusion matrix is shown in Fig. 1. Binary classifiers were built to separate the HPBP from the LPBP classes. Therefore, true positive (TP) indicates the number of instances correctly classified as HPBP, false positive (FP) indicates the number of instances misclassified as HPBP, true negative (TN) indicates the number of instances correctly classified as LPBP, and false negative (FN) indicates the number of instances misclassified as LPBP.
The critical point is that the dataset obtained by clustering was imbalanced (i.e., the number of elements of the larger set was several times the number of elements of the smaller set). There were four samples in the LPBP cluster and 15 samples in the HPBP cluster. Criteria such as accuracy fall short in evaluating classifier performance on imbalanced datasets (Juba and Le, 2019). Consequently, BA, MCC, and AUCPR, as the metrics suggested for imbalanced datasets, were used to evaluate the performance of the model.
Fig. 1
Sample confusion matrix.
Balanced accuracy (BA) is the arithmetic mean of two widely used metrics: sensitivity and specificity (Chicco et al., 2021b). The BA is more reliable than standard accuracy in evaluating the performance of classifiers on imbalanced data (Brodersen et al., 2010).
Matthew’s correlation coefficient (MCC) is a more balanced metric that takes into account all values (TP, FP, TN, and FN) in the confusion matrix and produces a high value only if good results are obtained for all values (Matthews, 1975; Chicco and Jurman, 2020). The MCC is a reliable measure for evaluating classification performance on imbalanced data (Chicco et al., 2021a,b).
Precision shows the number of samples classified (predicted) as positive that are actually positive. Recall shows the number of samples that should be classified as positive that were actually classified as positive. The AUPRC is recommended for highly imbalanced datasets, where receiver operating characteristic (ROC) curves may be an overly optimistic metric for the classification performance (Branco et al., 2016; Liu and Bondell, 2019). Precision and recall equations are given below to illustrate the calculation of the AUCPR. However, the details of the AUCPR can be examined elsewhere (Liu and Bondell, 2019). The equations for BA and MCC are given below. Although the equations for recall and sensitivity are the same, they are shown separately to avoid confusion.
(2)
(3)
(4)
(5)
(6)
(7)
3Results
3.1Clustering
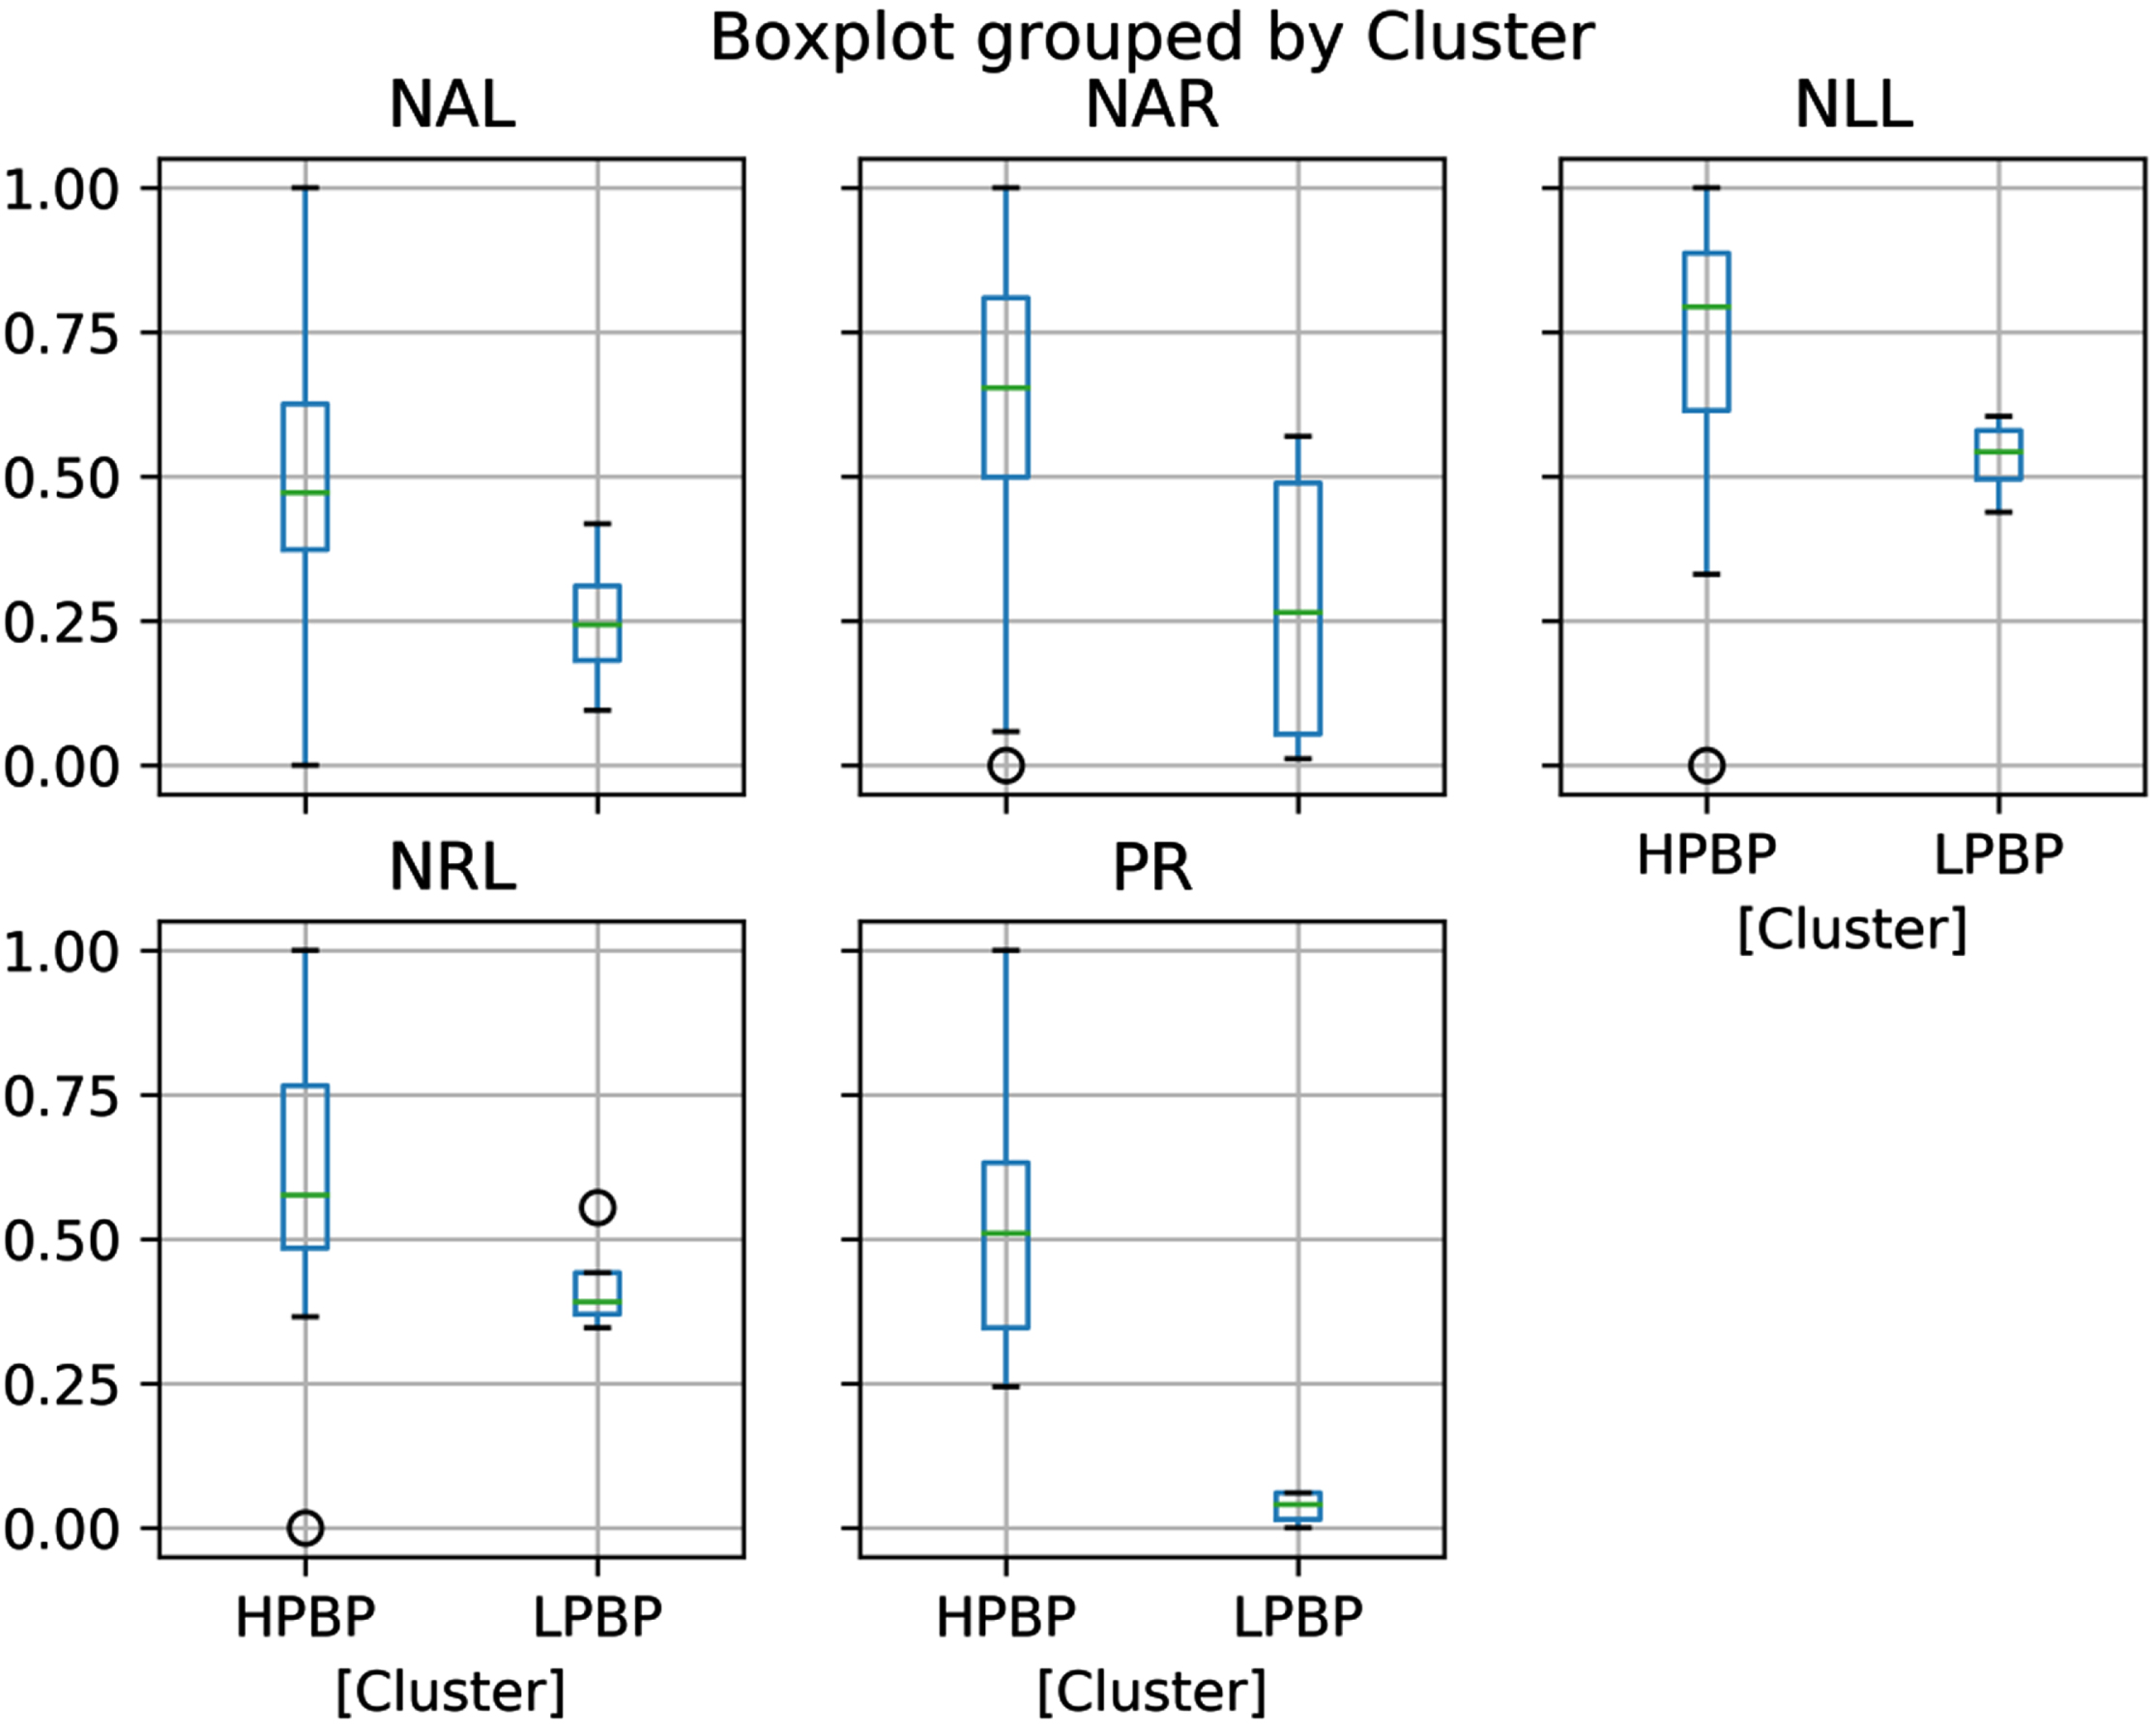
The LPBP and HPBP clusters were created according to player PRs using HACA. The dendrogram is shown in Fig. 2. In addition, boxplots for all features are given in Fig. 3. The HPBP was greater than the LPBP in all features. It is worth noting that clustering was used only to label the data as HPBP or LPBP. The PR feature was not used in classification. Prediction of the HPBP and LPBP classes was carried out using only the NAL, NAR, NLL, and NRL features (These features represents the upper and lower extremity normalized balance values). The PR represents the highest personal score achieved by an athlete in the bocce branch of sports. Therefore, the PR is obtained as a result of the harmony of all the motor skills of the athlete and is the result of the physiological and psychological gains. Consequently, the PR can represent the performance of a bocce athlete.
Fig. 2
HACA dendrogram.
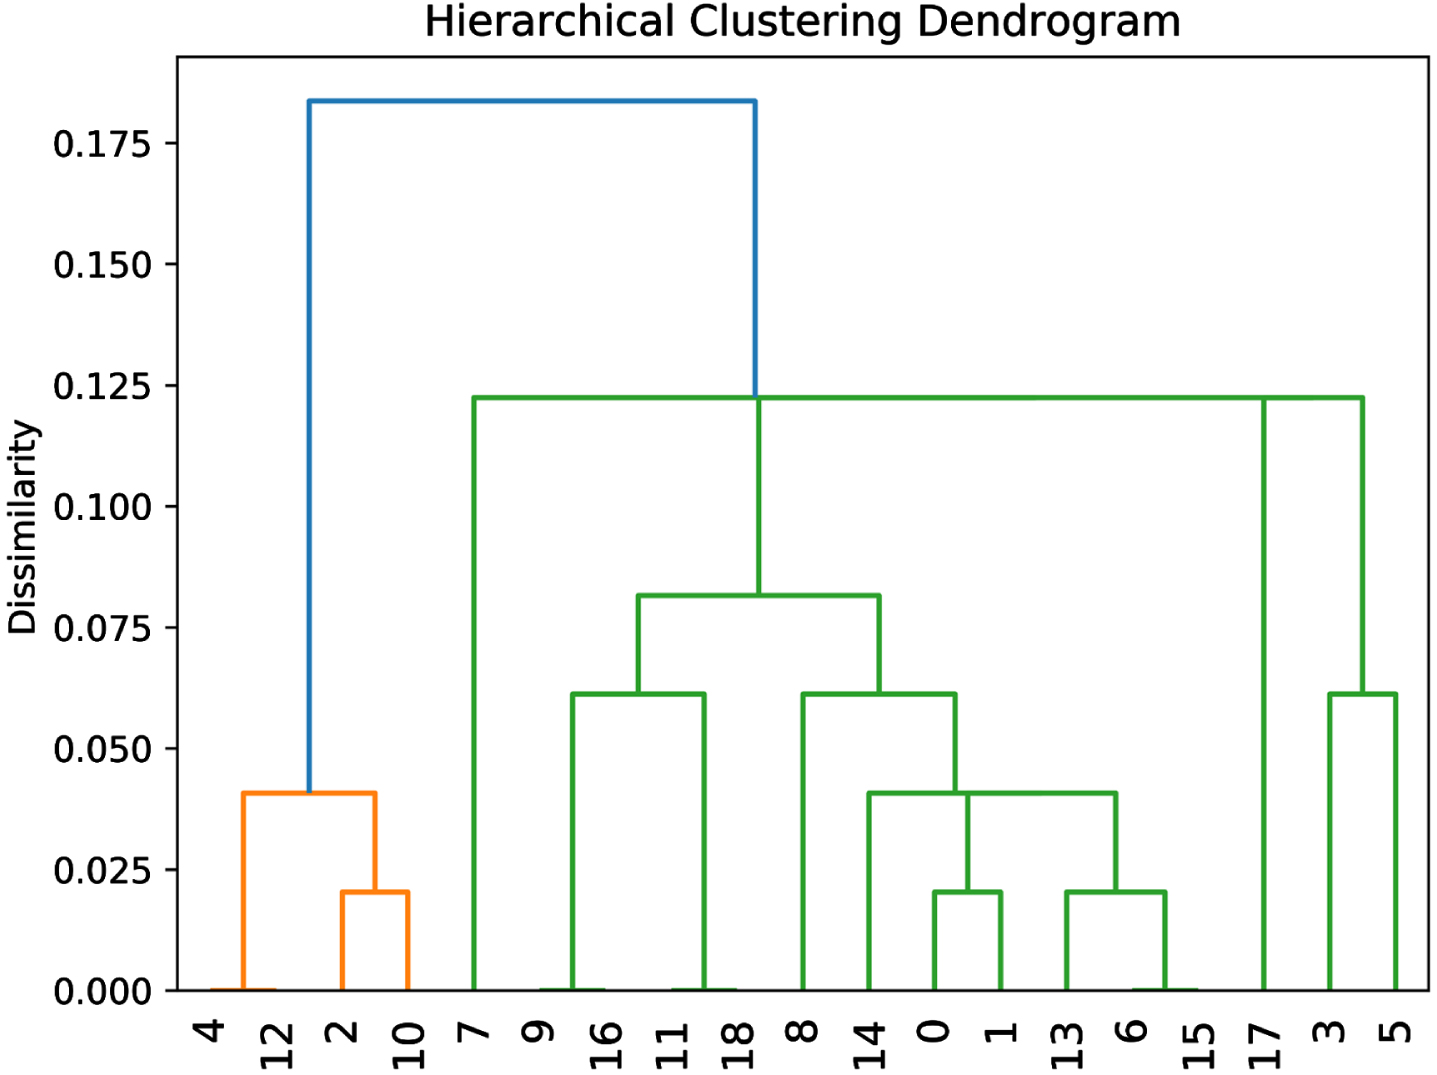
Fig. 3
Boxplots for all features (NAL = Normalised arm balance left, NAR = Normalised arm balance right, NRL = Normalised right leg, NLL = Normalised left leg, PR = Personal Record).
3.2Classification
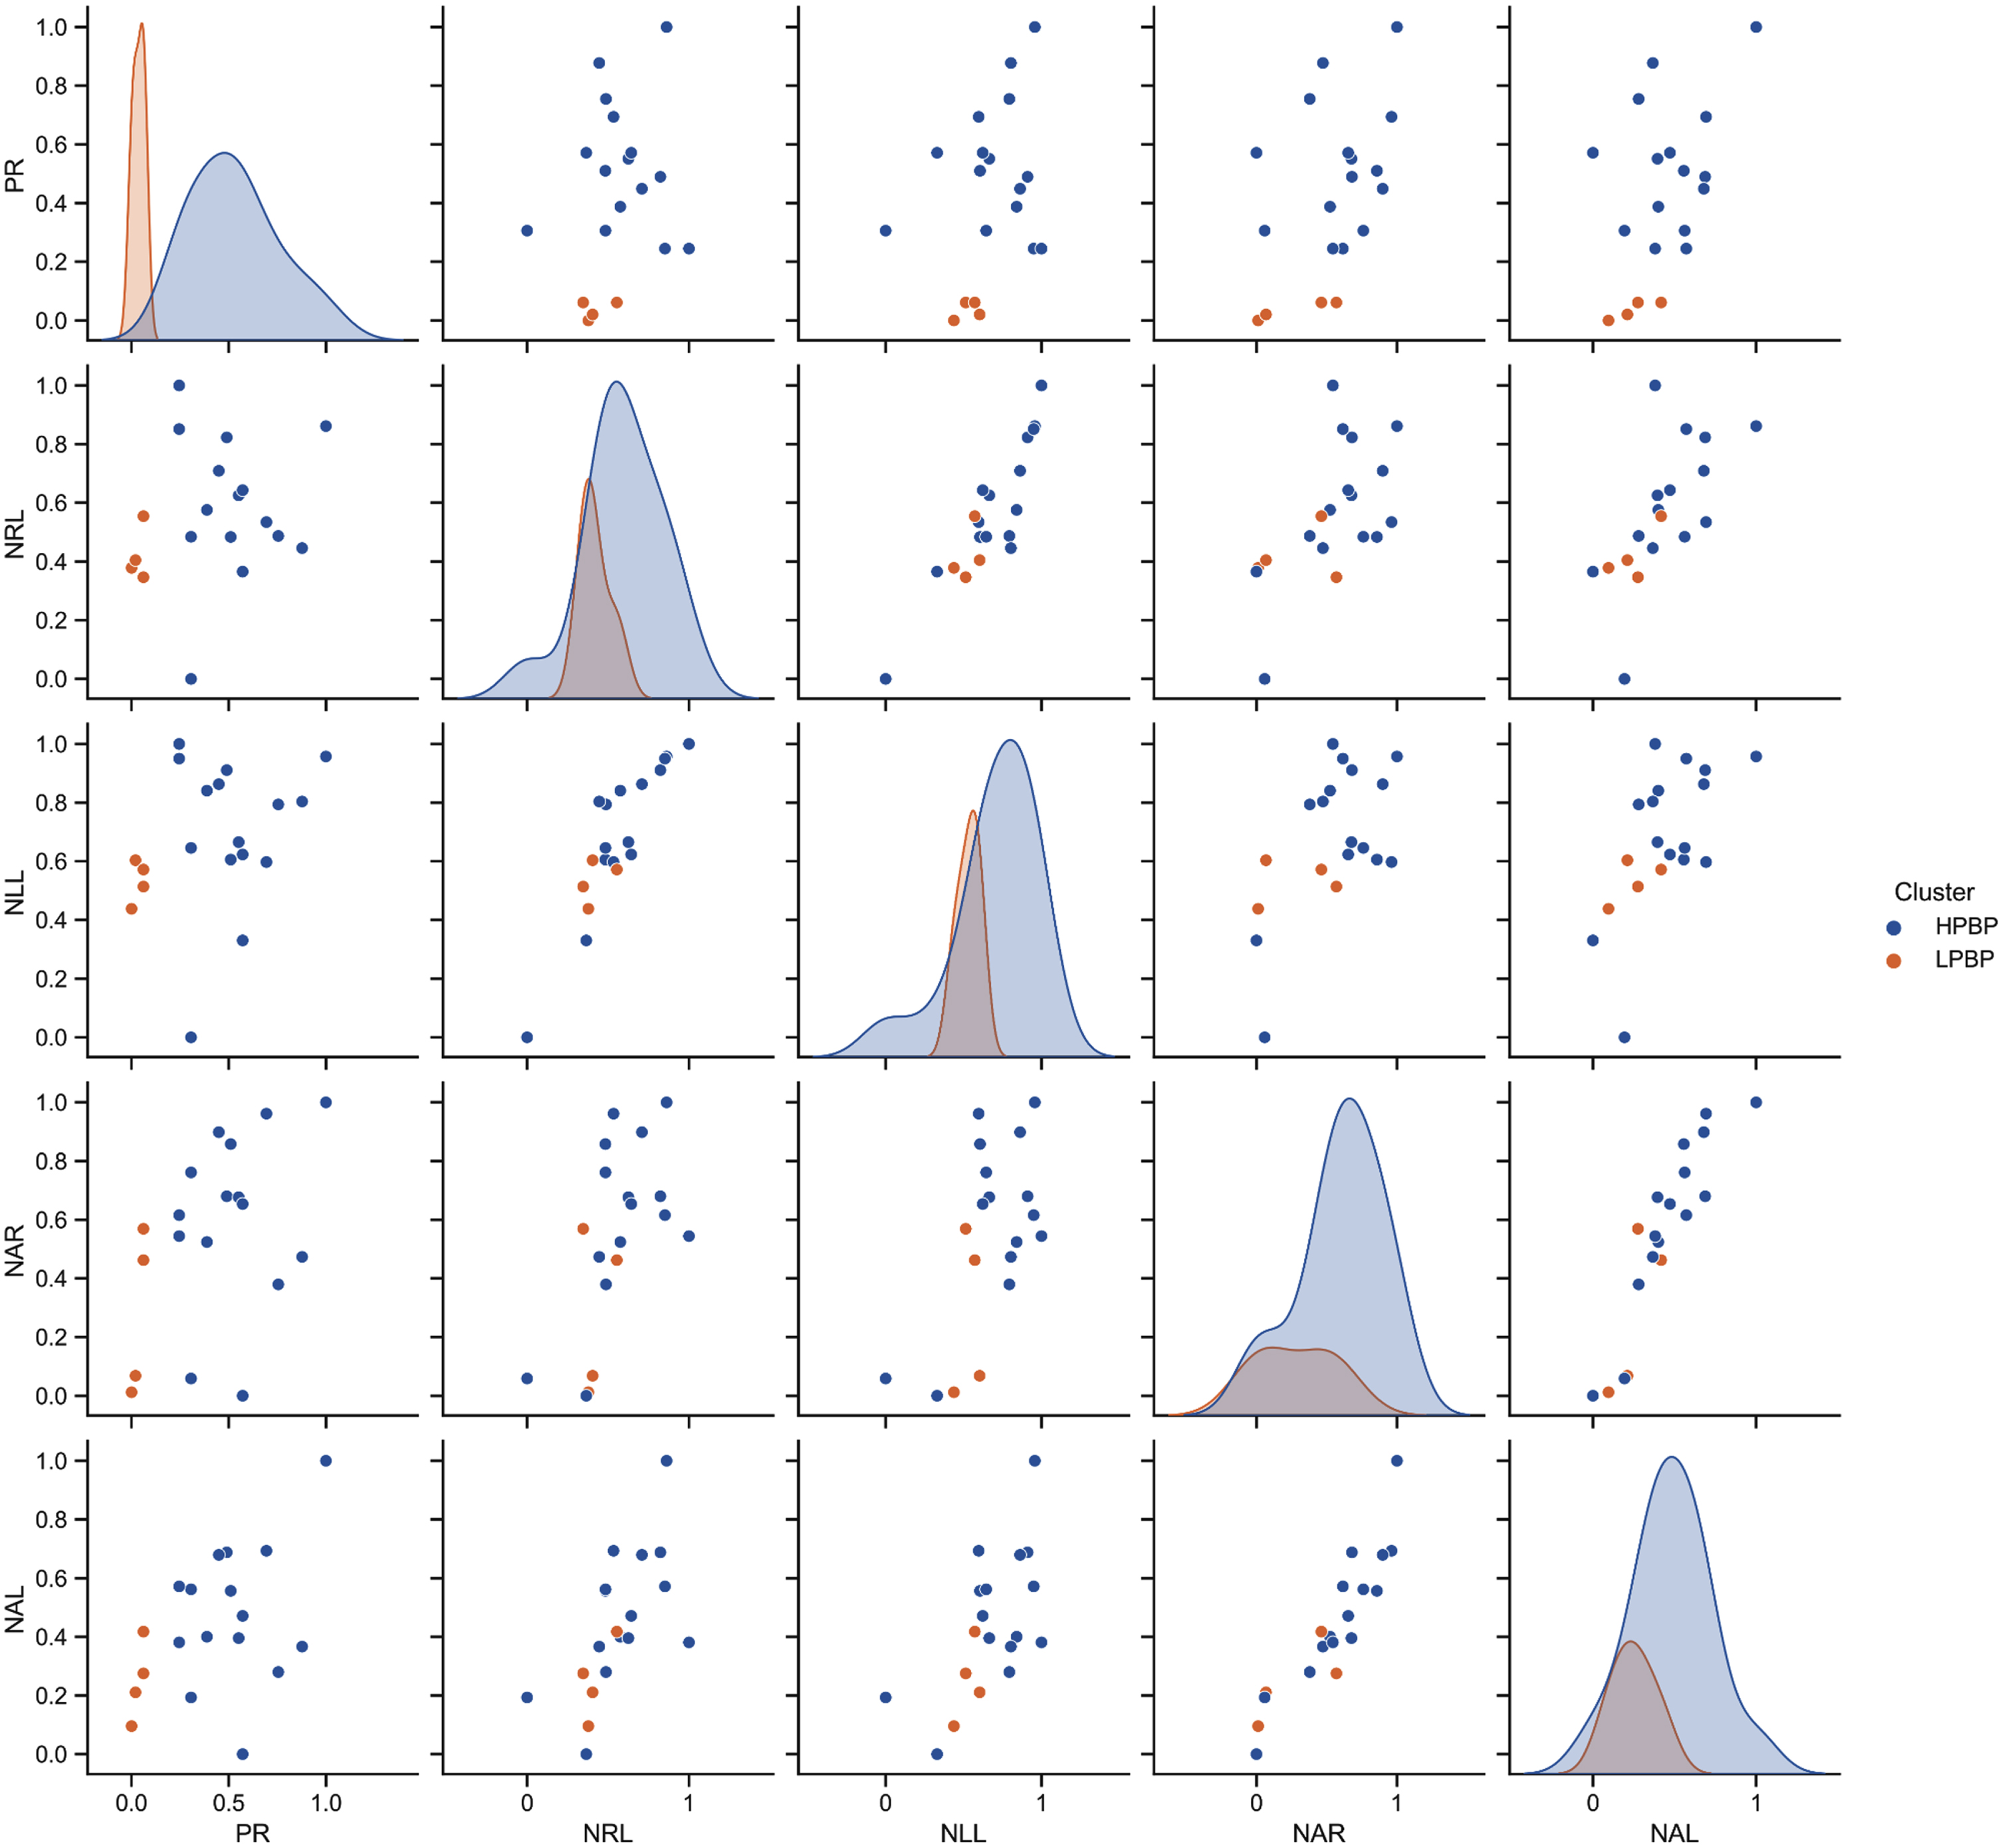
Figure 4 shows the relation of the data features and their kernel density functions. None of these features alone can accurately predict the HPBP and LPBP classes, i.e., they must be evaluated together (Fig. 4). Therefore, the NRL, NLL, NAR, and NAL features were used for classification.
Fig. 4
Scatterplots and kernel densities of features.
This study used the SVC linear kernel, the polynomial kernels for degree = 2 and degree = 3, and the RBF kernel.
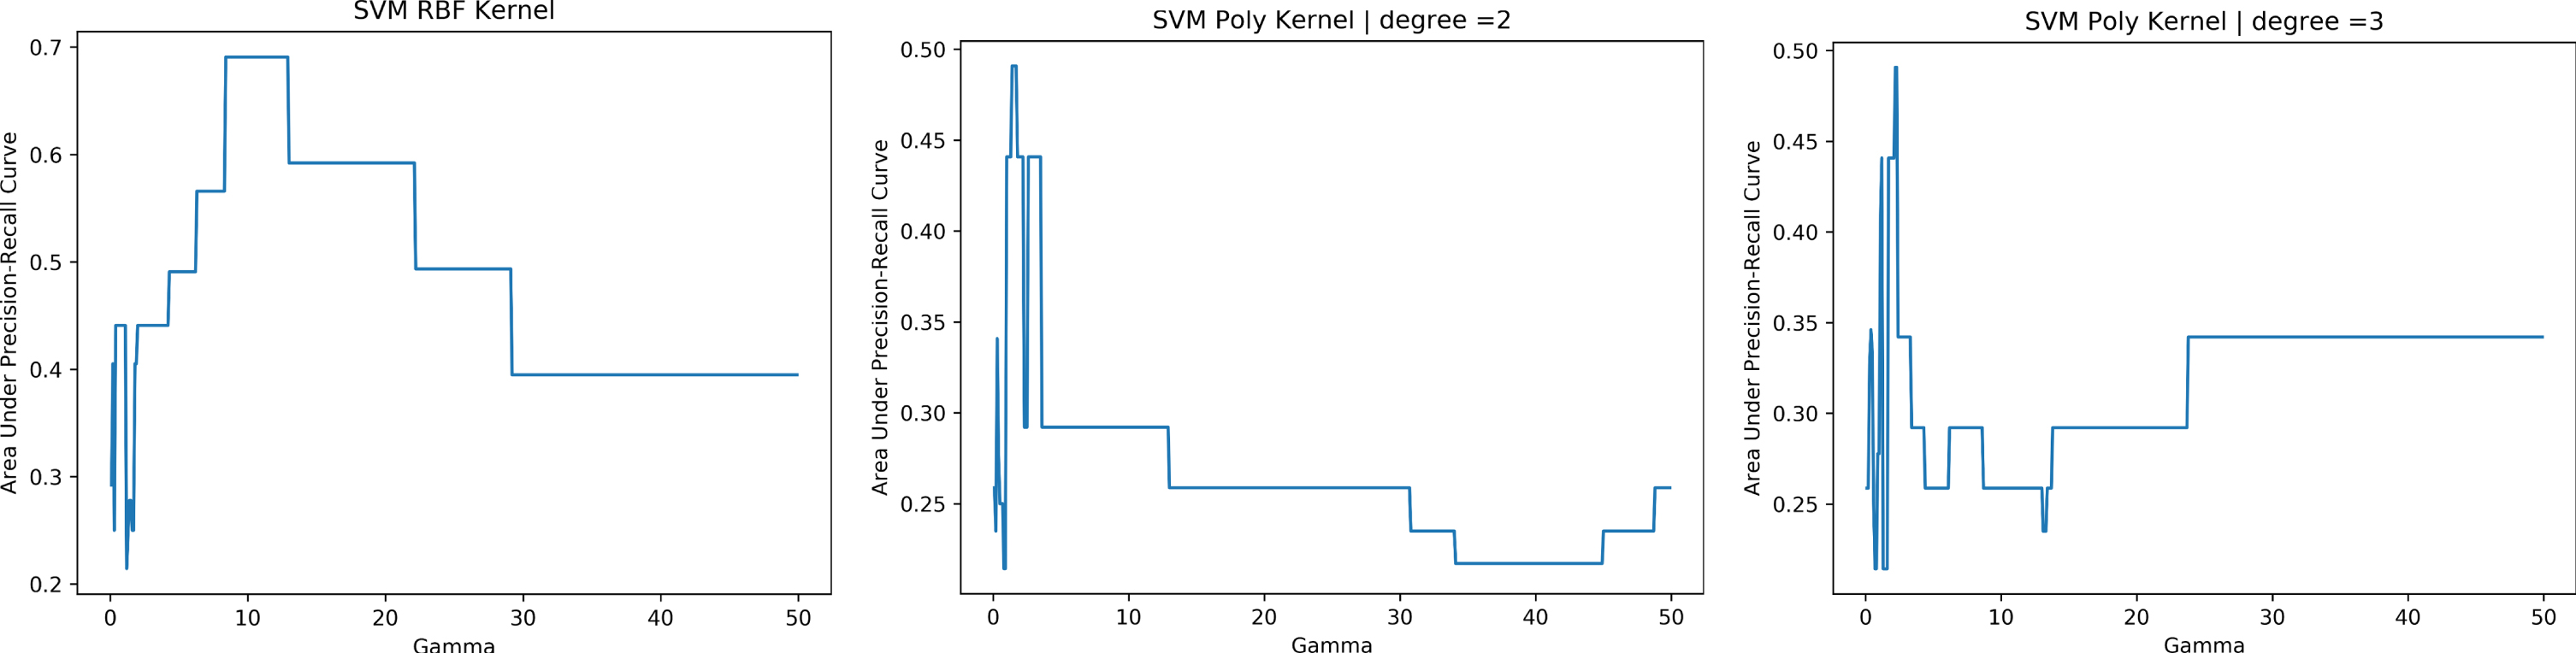
In the description of the SVC, it was mentioned that the gamma parameter should be optimized according to the problem. The AUCPR can be used for this and can be considered as a practical assessment for building a classifier for imbalanced data (Fu et al., 2019). Therefore, in order to determine the gamma parameter to be used in the RBF and polynomial kernels, graphics were prepared showing gamma vs. AUCPR (Fig. 5). The gamma value that maximized AUPRC for each kernel was calculated and these values were used as classifiers. The gamma values for the RBF kernel, polynomial kernel degree = 2, and polynomial kernel degree = 3 were 10, 1.4, and 2.2.
Fig. 5
Determination of the gamma parameter.
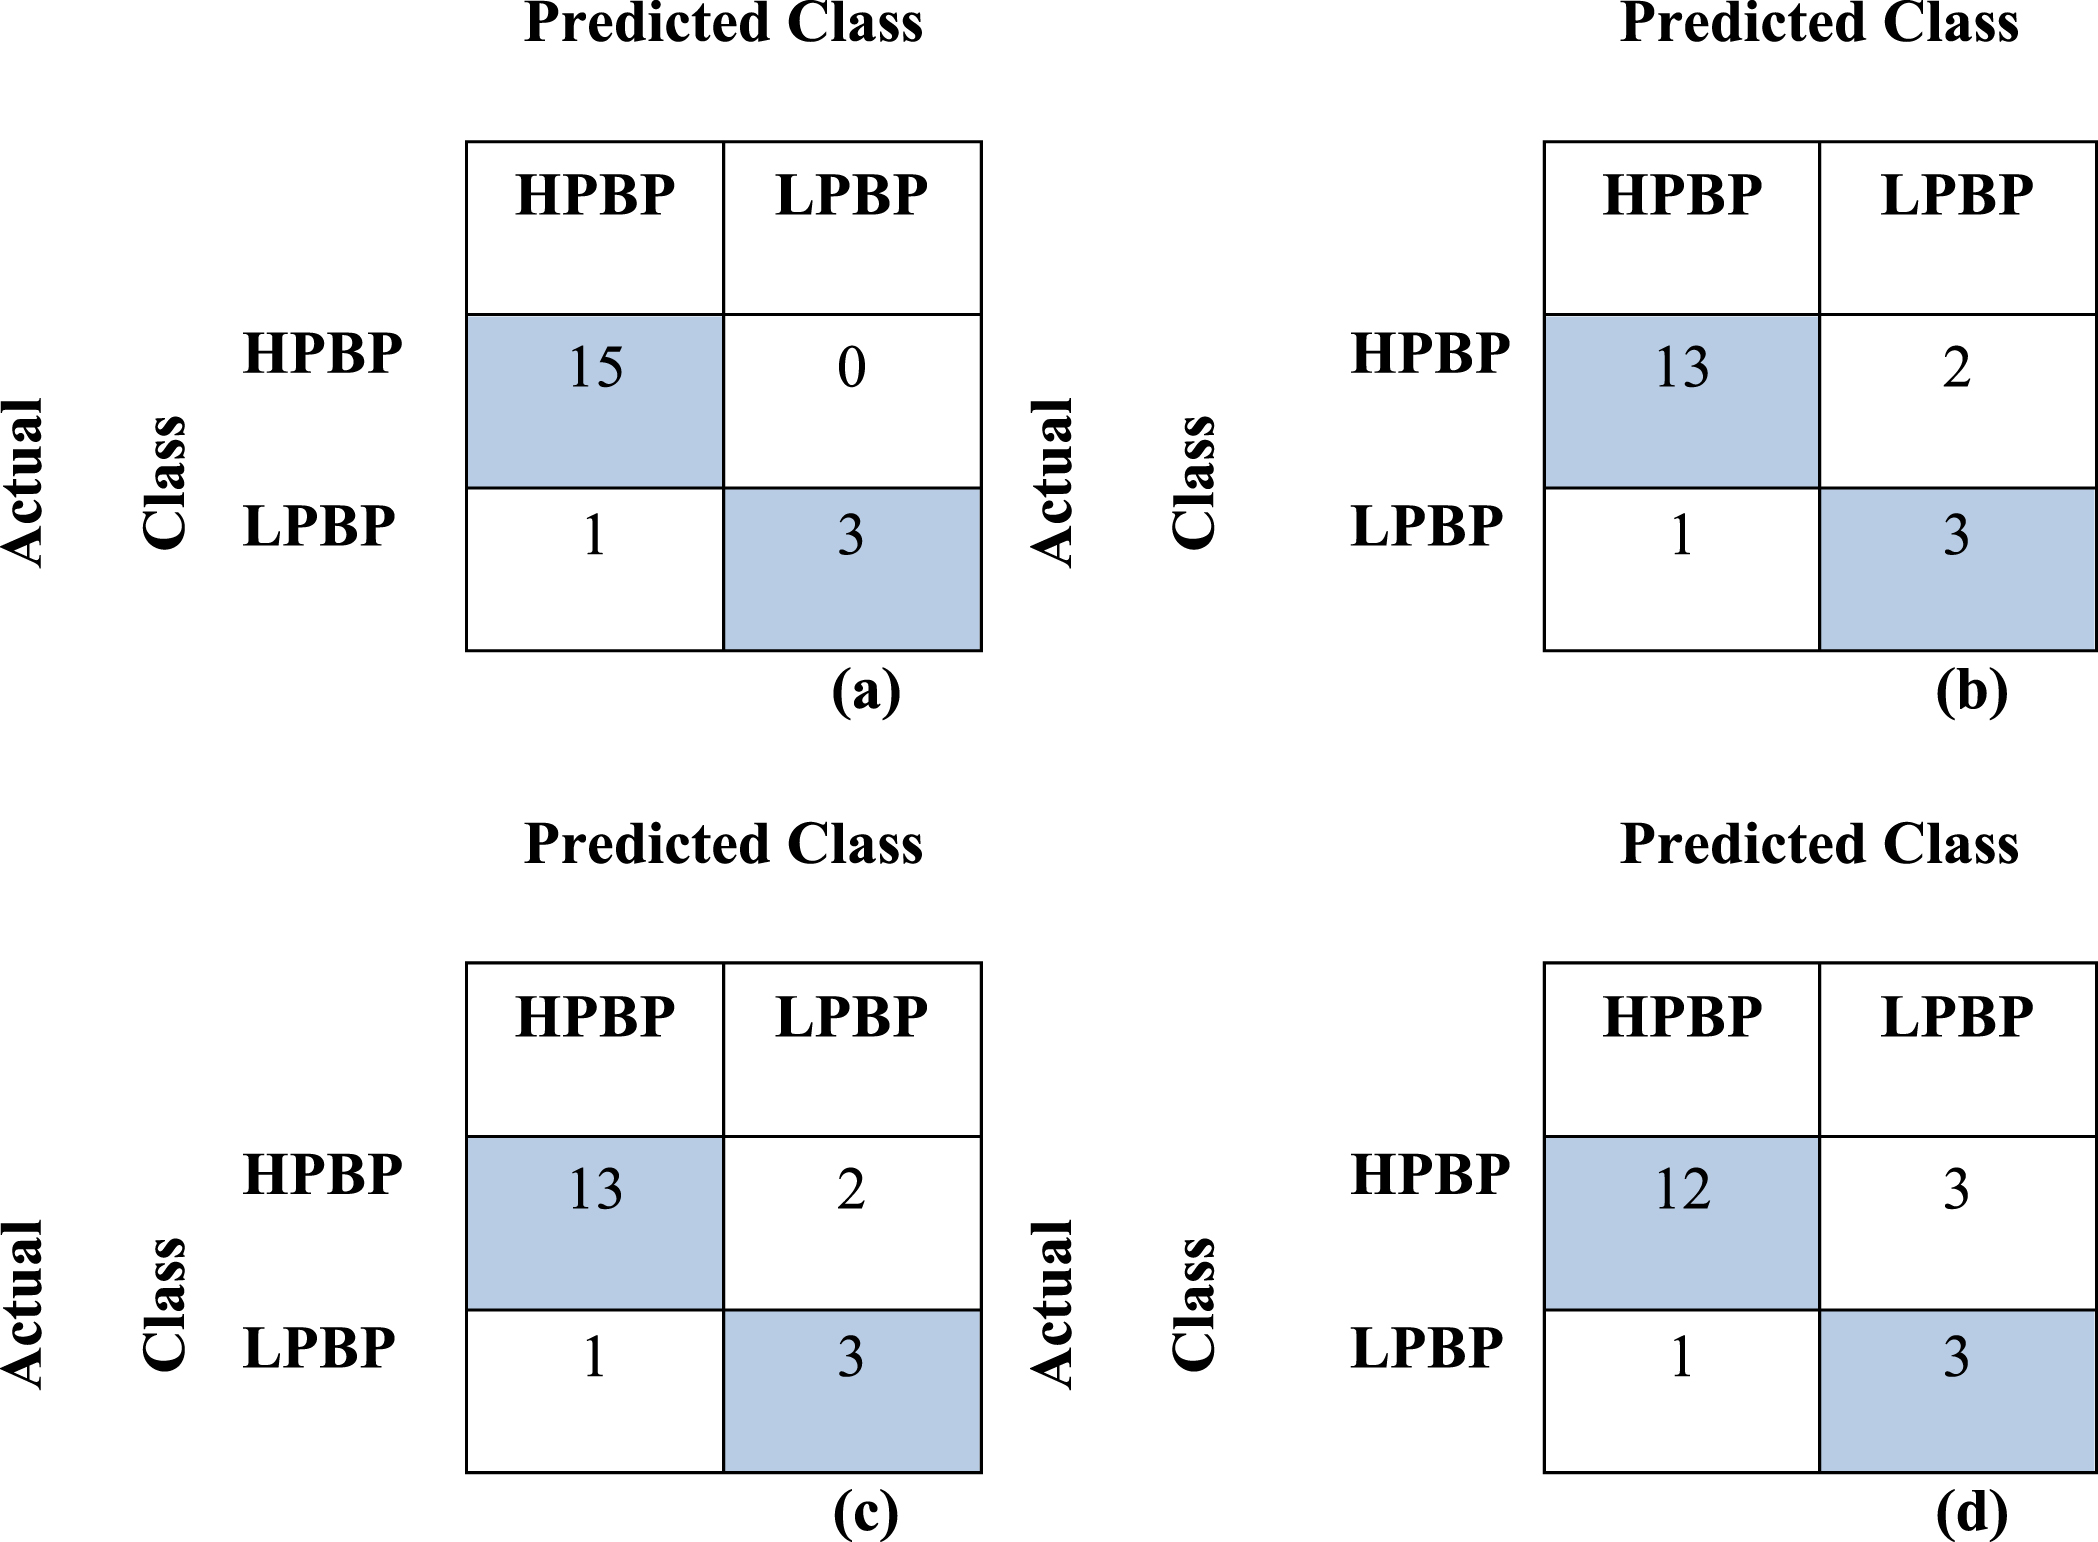
The classification results given in Table 1 show that the SVM-RBF outperformed the others. The SVM-RBF correctly predicted all athletes from the HPBP cluster and 75% of the athletes in the LPBP cluster. In addition, confusion matrices are given for all methods in Fig. 6.
Table 1
Classification results
| TP Rate | TN Rate | BA | MCC | AUCPR | |
| SVM-RBF | 1 | 0.75 | 0.8750 | 0.8385 | 0.6907 |
| SVM-Poly|d = 3 | 0.8666 | 0.75 | 0.8083 | 0.5709 | 0.4907 |
| SVM-Poly|d = 2 | 0.8666 | 0.75 | 0.8083 | 0.5709 | 0.4907 |
| SVM-Linear | 0.8000 | 0.75 | 0.7750 | 0.4823 | 0.4407 |
Fig. 6
Confusion matrices: (a) SVM RBF kernel, (b) SVM poly kernel |d = 3, (c) SVM poly kernel |d = 2, (d) SVM linear.
4Discussion and conclusions
In this study, the effect of balance parameters on performance class in bocce athletes who had been training regularly for at least two years was investigated using machine learning clustering (HACA) and classification (SVM) methods. It was concluded that performance prediction could be successfully carried out using dynamic balance features. Maintaining a balanced posture while performing is the basis for complex motor skills in terms of sporting performance (Altavilla et al., 2014). Dynamic and static balance processes critically depend on the nature of the physical task (Matsuda et al., 2008). Balance ability is known to play a fundamental role in sport-specific postural control, and its relationship with athletic performance can contribute to the success of the athlete (Davlin, 2004; Hrysomallis, 2011). Therefore, a better understanding of balance performance under static and dynamic conditions is a must for balance training.
During the ball-throw, maintaining balance is crucial in controlling the body position in anterior-posterior sway (Bronikowska et al., 2011). In addition, in the sport of bocce/petanque, the “balance with an object” (balance provided by additional equipment) mechanism is also activated. Although balance is vital in bocce, the number of studies on balance evaluation are limited in the literature. Tükenmez (2018) concluded that balance training was effective in the ratio of point approach angle accuracy. A review of the literature revealed this to be the only study evaluating balance in the bocce/petanque sport category. In this respect, the present study is a pioneering work in its field.
In this study, it was determined that the performance classes of bocce athletes could be accurately predicted by evaluating only the dynamic balance parameters. To the best of the authors’ knowledge, this study is the first effort to predict the performance classes of bocce athletes from dynamic balance parameters. The personal record is the final output of a set of exercises and efforts. Therefore, an athlete can improve the record with regular training. This study has shown that the precise relationship observed between the dynamic balance and personal record makes it possible to be informed in advance about the personal record level that an athlete can achieve. Consequently, the potential of athletes can be identified in advance, thus preventing the loss of time and effort for trainers and athletes.
As previously stated, the participants of this study were athletes who had participated in bocce training for at least two years. Prediction using a more diverse sampling of participants (e.g., those having no experience, having little training, playing professionally, etc.) could be beneficial for trainers in the process of decision-making procedures such as athlete selection and determining training plans.
Acknowledgments
The authors would like to thank the athletes who participated in the research. No financial assistance was received for this research. The authors have no conflicts of interest relevant to this article.
Conflict of interest
The authors declare no conflict of interest.
References
1 | Alpaydin, E. (2020) . Introduction to Machine Learning (fourth edi). MIT Press. |
2 | Altavilla, G. , Tafuri, D. , & Raiola, G. (2014) . Influence of sports on the control of static balance in physical education at school, Journal of Physical Education and Sport, 14: (3), 351–354. https://doi.org/10.7752/jpes.2014.03053 |
3 | Ashley, K. 2020. Applied Machine Learning for Health and Fitness. In Applied Machine Learning for Health and Fitness. Apress. https://doi.org/10.1007/978-1-4842-5772-2 |
4 | Balan, V. , Gherghel, C. L. , Mares, G. A. , Corbeanu, M. , & Mujea, A. M. 2018. Technical aspects of the bocce game. In Discobolul-Physical Education, Sport and Kinetotherapy Journal: Vol. XIV (Issue 2). |
5 | Branco, P. , Torgo, L. , & Ribeiro, R. P. (2016) . A Survey of Predictive Modeling on Imbalanced Domains, ACMComputing Surveys, 49: (2), 1–50. https://doi.org/10.1145/2907070 |
6 | Brodersen, K. H. , Ong, C. S. , Stephan, K. E. , & Buhmann, J. M. 2010. The Balanced Accuracy and Its Posterior Distribution. 2010 20th International Conference on Pattern Recognition, 3121-3124. https://doi.org/10.1109/ICPR.2010.764 |
7 | Bronikowska, M. , Bronikowski, M. , & Schott, N. (2011) . You think you are too old to play?” Playing games and aging, Human Movement, 12: (1), 24–30. https://doi.org/10.2478/v10038-010-0030-2 |
8 | Chicco, D. , & Jurman, G. (2020) . The advantages of the Matthews correlation coefficient (MCC) over F score and accuracy in binary classification evaluation, BMC Genomics, 21: (1), 6. https://doi.org/10.1186/s12864-019-6413-7 |
9 | Chicco, D. , Starovoitov, V. , & Jurman, G. (2021) a). The Benefits of the Matthews Correlation Coefficient (MCC) Over the Diagnostic Odds Ratio (DOR) in Binary Classification Assessment, IEEE Access, 9: , 47112–47124. https://doi.org/10.1109/ACCESS.2021.3068614 |
10 | Chicco, D. , Tötsch, N. , & Jurman, G. (2021) b). The Matthews correlation coefficient (MCC) is more reliable than balanced accuracy, bookmaker informedness, and markedness in two-class confusion matrix evaluation, BioData Mining, 14: (1), 13. https://doi.org/10.1186/s13040-021-00244-z |
11 | Cramer, J. , Quintero, M. , Rhinehart, A. , Rutherford, C. , Nasypany, A. , May, J. , & Baker, R. T. (2017) . Exploration of score agreement on a modified upper quarter y-balance test kit as compared to the upper quarter y-balance test, International Journal of Sports Physical Therapy, 12: (1), 117–124. |
12 | Crammer, K. (2002) . On the algorithmic implementation of multiclass kernel-based vector machines, Journal of Machine Learning Research - JMLR, 2: (2), 265–292. |
13 | Davlin, C. D. 2004. Dynamic balance in high level athletes. Perceptual and Motor Skills, 98-1171-1176. https://doi.org/10.2466/pms.98.3c.1171-1176 |
14 | Fu, G. , Yi, L. , & Pan, J. (2019) . Tuning model parameters inclass-imbalanced learning with precision-recall curve, Biometrical Journal, 61: (3), 652–664. https://doi.org/10.1002/bimj.201800148 |
15 | Hrysomallis, C. (2011) ), Balance Ability and Athletic Performance, Sports Medicine, 41: (3):221–232. doi: 10.2165/11538560-000000000-00000 |
16 | Juba, B. , & Le, H. S. (2019) . Precision-Recall versus Accuracy and the Role of Large Data Sets, Proceedings of the AAAI Conference on Artificial Intelligence, 33: , 4039–4048. https://doi.org/10.1609/aaai.v33i01.33014039 |
17 | Kioumourtzoglou, E. , Derri, V. , Mertzanidou, O. , & Tzetzis, G. (1997) . Experience with perceptual and motor skills in rhythmic gymnastics, Perceptual and Motor Skills, 84: (3), 1363–1372. https://doi.org/10.2466/pms.1997.84.3c.1363 |
18 | Liu, Z. , & Bondell, H. D. (2019) . Binormal Precision–Recall Curves for Optimal Classification of Imbalanced Data, Statistics in Biosciences, 11: (1), 141–161. https://doi.org/10.1007/s12561-019-09231-9 |
19 | Matsuda, S. , Demura, S. , & Uchiyama, M. (2008) . Centre of pressure sway characteristics during static one-legged stance of athletes from different sports, Journal of Sports Sciences, 26: (7), 775–779. https://doi.org/10.1080/02640410701824099 |
20 | Matthews, B. W. (1975) . Comparison of the predicted and observed secondary structure of T phage lysozyme, Biochimica et Biophysica Acta (BBA) - Protein Structure, 405: (2), 442–451. https://doi.org/10.1016/0005-2795(75)90109-9 |
21 | Paillard, T. , & Noé, F. (2006) . Effect of expertise and visual contribution on postural control in soccer, Scandinavian Journal of Medicine and Science in Sports, 16: (5), 345–348. https://doi.org/10.1111/j.1600-0838.2005.00502.x |
22 | Pedregosa, F. , Varoquaux, G. , Gramfort, A. , Michel, V. , Thirion, B. , Grisel, O. , Blondel, M. , Prettenhofer, P. , Weiss, R. , Dubourg, V. , Vanderplas, J. , Passos, A. , Cournapeau, D. , Brucher, M. , Perrot, M. , & Duchesnay, É. (2011) . Scikit-Learn: Machine Learning in Python, J. Mach. Learn. Res., 12: (null), 2825–2830. |
23 | Richter, C. , King, E. , Strike, S. , & Franklyn-Miller, A. (2019) . Objective classification and scoring of movement deficiencies in patients with anterior cruciate ligament reconstruction, PLoS ONE, 14: (7). https://doi.org/10.1371/journal.pone.0206024 |
24 | Richter, C. , O’Reilly, M. , & Delahunt, E. 2021. Machine learning in sports science: challenges and opportunities. In Sports Biomechanics. Routledge. https://doi.org/10.1080/14763141.2021.1910334 |
25 | Rommers, N. , Rössler, R. , Verhagen, E. , Vandecasteele, F. , Verstockt, S. , Vaeyens, R. , Lenoir, M. , D’Hondt, E. , & Witvrouw, E. (2020) . A Machine Learning Approach to Assess Injury Risk in Elite Youth Football Players, Medicine and Science in Sports and Exercise, 52: (8), 1745–1751. https://doi.org/10.1249/MSS.0000000000002305 |
26 | Tükenmez, M. 2018. The effect of balance training on bocca raffa players “punto scores and the balance coordination (a case study of İstanbul Esenyurt district). Master of Science Thesis, İstanbul Gelişim University. |
27 | Türkeri, C. , Büyüktas, B. , & Öztürk, B. 2020. Reliability study of the upper quarter y dynamic balance test applied by holding the lower extremity and hip center fixed. Hacettepe Journal of Sport Sciences, 45-52. https://doi.org/10.17644/sbd.679479 |
28 | Weir, J. P. , & Vincent, W. J. 2021. Statistics in Kinesiology (5th Editio). Human Kinetics, Inc. |
29 | Winter, D. A. , Patla, A. E. , & Frank, J. S. (1990) . Assessment of balance control in humans, Med. Prog. Technol, 16: (1-2), 31–51. |


