
A causal approach for detecting team-level momentum in NBA games
Abstract
This paper provides new evidence that team-level momentum exists in the National Basketball Association (NBA). The existence of momentum is one of the most prominent and longstanding questions in sports analytics. But for all its importance to announcers, coaches, and players, existing literature has found little evidence of momentum in professional basketball. This paper exploits a natural experiment in the flow of basketball games: television (TV) timeouts. Since TV timeouts occur at points exogenous to momentum, they enable the measurement of the effect of pauses in the game separate from the effect of strategy changes. We find TV timeouts cause an 11.2% decline in the number of points that the team with momentum subsequently scores. This effect is robust to the size of a run, substitutions, and game context. This result has far reaching implications in basketball strategy and the understanding of momentum in sports more broadly.
1Introduction
The belief in momentum is well established among players and fans of basketball and other sports, and its existence has been debated since before the advent of sports analytics. Play or watch enough basketball and one will inevitably find an example of a team that has seemingly tapped into an intangible well that enables them to sustain high levels of performance. Announcers frequently speak of the importance of teams seizing momentum, and basketball coaches emphasize the importance of using timeouts to halt opponents’ momentum. Although momentum is difficult to detect analytically, coaches and fans operate on the twin assumptions that a) momentum exists, and b) it can be stopped by timeouts. This paper tests the latter hypothesis to substantiate the former.
Despite general belief in momentum on the part of the general sports community, the sports analytics community has been broadly skeptical of its existence. Perhaps the most popular way to conceptualize momentum is the “hot hand” theory, which posits that a basketball player has “momentum” by scoring some number of consecutive points (Gilovich, Vallone, and Tversky, 1985; Vergin, 2000). Past literature on this topic has been inconclusive, and it remains a controversial question. In contrast to individual momentum in the form of the hot hand, this paper analyzes momentum at the team level.
Momentum in this paper refers to a team-level effect wherein the team scores unanswered points within a single game. By contrast, to doubt the existence of momentum means to believe that consecutive scoring plays are uncorrelated—that the outcome of a team’s current possession is independent of recent ones, no different than a sequence of flips of a weighted coin. The common thread among all statistical critiques of the existence of momentum, going back to the original critique by Gilovich, Vallone, and Tversky (1985), is a contention that the widespread belief in momentum is the result of cognitive biases to see such correlations where none exist.
The belief in momentum causes coaches to deploy timeouts strategically, after the “momentumed team” (the team on a scoring run) has scored several sequential baskets while the stalled opposing team scores few to zero (Gibbs, Elmore, and Fosdick, 2022; Permutt, 2011; Roane et al., 2004; Weinbach, 2008). Comparing points before and after a timeout is fallacious, however, since a coach often calls a timeout explicitly to stop momentum. Since timeouts are used strategically, any resulting decrease in scoring by the momentumed team could be due to interruption of play or changes made during that interruption.
This paper’s innovation is to take advantage of exogenous stoppages of play in the form of television (TV) timeouts. TV timeouts, also referred to as mandatory timeouts or official timeouts, are timeouts that occur at predetermined times, independent of the score or flow of the game. By contrast, all other timeouts, referred to here as “coaches’ timeouts,” are called by the team with possession. The fact that coaches’ timeouts sometimes lead to commercial breaks does not mean that they are TV timeouts. TV timeouts happen based on procedures laid out in the NBA rulebook (National Basketball Association, 2016). For example, during the seasons used for this analysis, a TV timeout would be called at the first stoppage in play following the nine-minute mark in the second quarter, unless either team had already voluntarily called a timeout in that quarter. During those seasons, each TV timeout lasted 100 seconds; coaches’ timeouts could be either 60 or 100 seconds.
By analyzing only those TV timeouts that coincidentally interrupt momentum, this paper’s analysis separates the effect of play stoppage from that of measurable strategic behavior. To exploit this natural experiment, we use causal inference with matching (Imbens and Rubin, 2015). This methodology creates a set of matched observations between the treatment and control groups: in this case, by matching scoring runs which are interrupted by a TV timeout (treatment group) and runs that are not interrupted by any timeout (control group), and which are similar along other dimensions which may affect the number of points subsequently scored. The combined dataset of treatments and control runs thus provides an unbiased estimate of the causal effect of the TV timeouts on momentum. Any resulting change in points scored for the momentumed team is therefore due to the timeout and, more importantly, is evidence of momentum’s existence.
Exploiting the uncorrelated nature of TV timeouts, we find that momentumed teams score 0.56 fewer points on average during the 3 minutes after a TV timeout as compared to matched teams that do not experience a timeout. This result is robust to the length of the run, the duration of time after a TV timeout that is analyzed, and strategic context. A Monte Carlo simulation further shows that sampling strategy does not create the results. This finding is the strongest empirical evidence to date that team-level momentum in basketball exists.
2Background
Momentum “is, at the same time, one of the most commonly referred to and least understood phenomena in the realm of sports” (Taylor and Demick, 1994). In basketball and other sports, players, coaches, commentators, and fans attribute outsized success of players or teams to a momentum effect (Barnwell, 2013; Camerer, 1989; Gilovich, Vallone, and Tversky, 1985; Vergin, 2000). Momentum in these contexts can variously refer to a team winning or losing consecutive games (Arkes and Martinez, 2011) or to a player’s performance within a game (Arthur and Matthews, 2017). The essential concept is that the team’s or player’s success displays positive serial correlation: an NBA player who just made a string of shots would be more likely to make his next shot than his long-term shooting average would suggest.
The topic of momentum in basketball was first prominently explored statistically in the seminal paper by Gilovich, Vallone, and Tversky (1985). They made the then-groundbreaking claim that the hot hand is an illusion resulting from the human tendency to see patterns where none exist. After examining serial correlations of made and missed shots, they concluded that the sequences were no more correlated than would be expected from random chance, if each shot were independent.
For years after, the prevailing consensus among researchers considered the hot hand, and the concept of momentum more broadly, to be an elusive superstition (Kahneman, 2011; Miller and Sanjuro, 2018b; Vergin, 2000). Koehler and Conley (2003) found no evidence of the hot hand, even in the more controlled environment of the NBA’s Three-Point Contest. Vergin (2000) found no statistically significant correlation in wins and losses among NBA or Major League Baseball teams. In baseball, Cramer (1977) claimed to disprove the belief in “clutch” hitters who supposedly can consistently exceed their average performance in crucial game situations. In football, Fry and Shukairy (2012) failed to find statistical evidence of in-game momentum at the team level. Bar-Eli, Avugos, and Raab (2006) surveyed 24 studies of hot-hand-type effects across several sports and concluded that the evidence supporting the existence of an effect was weak and limited. Similarly, a later meta analysis by Avugos et al. (2013) concluded that the inconsistent and small effect sizes in studies from various sports are evidence that the hot hand does not exist to any meaningful degree. Attempts have also been made to identify a momentum effect in experimental settings, usually resulting in finding no effect (Cornelius et al., 1997; Gilovich, Vallone, and Tverseky, 1985; Silva, Cornelius, and Finch, 1992; Shaw, Dzewaltowski, and McElroy, 1992). Nobel Prize-winning psychologist Daniel Kahneman summarized the evidence by declaring that “the hot hand is a massive and widespread cognitive illusion” (2011, p.115).
More recent research identified flaws in previous literature and suggested that the hot hand exists. Two significant but perhaps mutually inconsistent lines of critique disputed the conclusion of previous studies which found no effect. First, Bocskocsky, Ezekowitz and Stein (2014) and Csapo et al. (2015) attributed the lack of apparent serial correlations to shot selection effects, claiming that players who are “hot” begin to take riskier shots which masks the improvement to their skill levels. Second, Miller and Sanjuro (2018a) identified a statistical flaw in the original paper by Gilovich, Vallone, and Tversky (1985): in a finite sequence of binary data, such as shots made or missed, the subsequent proportion of successes (made shots) after a streak of successes will be less than the expected proportion (the shooter’s true field goal percentage). After correcting for this finite sequence bias, the Gilovich, Vallone, and Tversky (1985) data show a statistically significant momentum effect for shooters. Separately, looking at season-level momentum rather than the “hot hand” among individual shooters, Arkes and Martinez (2011) and Munoz, Chen, and Thomas (2019) found evidence of serial correlations in basketball teams’ win-loss records, supporting the existence of game-to-game momentum.
As a result, academic consensus has shifted, and “the existence of the hot hand remains highly disputed” (Mews and Ötting, 2021, p.2). While it is now often conceded that momentum can be found at least to an extent in some contexts, the extent and size of effect remains controversial. Ritzwoller and Romano (2021) argued that the hot hand effect in the original Gilovich, Vallone, and Tversky (1985) data, after accounting for the statistical corrections from Miller and Sanjuro (2018a), is limited to a single shooter, and that these and other previous studies simply used sample sizes too small to prove any effect. James (2004) concurred that various manifestations of the momentum effect in baseball, such as “clutch” hitting or pitching, are small relative to other game factors and random variability, and therefore cannot be detected by the statistical approaches that most past papers have used. Barnwell (2013) conceded that it is difficult to prove the negative assertion that momentum does not exist, while contending that this difficulty in proving or measuring momentum shows that it is at best far smaller than most fans and commentators believe and is meaningless in practice.
In basketball, Morgulev et al. (2020) demonstrated that fans, players, and coaches have quantifiable beliefs in the size of the momentum effect—specifically in the probability that a team that has momentum in the form of a recent comeback to tie the game will go on to win—that are not supported by existing empirical literature. Wetzels et al. (2016) used a Bayesian approach and concluded that evidence for streakiness in basketball and other sports is weak at best. Lantis and Nesson (2021a, 2021b) found that a small hot hand effect exists in the NBA in the controlled situations of free throw shooting and the Three-Point Contest, but argued it does not exist in other in-game situations. Specifically for team-level, in-game momentum effects in basketball, the subject of this paper, recent research fails to find an effect. Morgulev, Azar, and Bar-Eli (2019) and Schilling (2019) analyzed data from NBA games and both conclude that scoring runs implied by “momentum” are illusory.
Since timeouts interrupt the flow of the game, previous studies have used them as a mechanism to attempt to observe the existence of momentum. Roane et al. (2004) conducted descriptive analysis on games from the NCAA women’s basketball tournament, finding that momentum exists at the team level and timeouts are effective at reducing an opponent’s momentum. Similarly, Permutt (2011) used data from NBA games to conclude that team-level momentum exists and is inhibited when the opposing team calls a timeout. However, both of these studies fell short of conclusive proof since they failed to sufficiently account for confounding factors. Roane et al. used a purely observational and correlational approach and did not attempt to demonstrate whether the observed efficacy of timeouts results from impeding momentum as opposed to strategy changes or substitutions; this approach also suffers from regression to the mean as coaches are more likely to call timeouts after a period of above-average performance by the opponent (Permutt, 2011). Gibbs, Elmore, and Fosdick (2022, p.2) pointed out that Permutt fails to account for the non-random nature of timeouts (the “bias attributed to the coach’s right to choose when to call, or not call, a timeout”); the same critique could be applied to Roane et al. as well.
Two recent papers attempted to overcome this selection bias by using causal inference methods to measure the momentum-stopping effect of timeouts, by controlling for confounding factors which impact coaches’ decisions to call them. Assis, Assunção, and Vaz-de-Melo (2020) and Gibbs, Elmore, and Fosdick (2022) both measured the impact of timeouts on team-level performance in the NBA. Both studies failed to find a momentum effect: the former found that timeouts have no causal effect on performance, and the latter found a slight negative effect (indicating that calling a timeout during an opponent’s run causes the momentum team to score more points). While both studies represent an important contribution to the literature, the results are less than fully conclusive because they rely on coaches’ timeouts and are therefore limited to controlling for observable variables, which may not sufficiently account for the many complex factors that influence a coach’s in-game decision to call a timeout. Assis, Assunção, and Vaz-de-Melo (2020) controlled for time within the game and scoring margin, and Gibbs, Elmore, and Fosdick (2022) additionally controlled for several factors known at the start of the game (e.g. teams and betting lines) and at the point of the run (e.g. time within the game, run duration, and estimated win probability).
The decision of when to call timeouts, however, is a significant part of a basketball coach’s job and depends on countless unobservable factors which are difficult or impossible to quantify: play calling, substituting specific players or platoons to respond to fatigue or gain favorable matchups, injuries, strategy changes, correcting recent poor play or mistakes, advancing the floor position near the end of the game, offering motivational words, emotional or psychological considerations, or simply a coach’s gut feeling (Duke and Corlett, 1992; Permutt, 2011; Saavedra, Mukherjee, and Bagrow, 2012; Yousuf, 2018). The treatment, in the causal inference sense of the term (a coach calling a timeout), is strongly related to the outcome (via the coach’s expectation of whether the timeout will affect future scoring), because coaches often call timeouts when they believe it will stop a run (Gibbs, Elmore, and Fosdick, 2022; Permutt, 2011; Roane et al., 2004; Weinbach, 2008). Therefore, the existence of so many covariates which cannot practically be controlled for is an unavoidable limitation of a causal model based on coaches’ timeouts.
This paper differs from previous studies by using a causal inference research design combined with using TV timeouts as an exogenous source of breaks in momentum. The validity of using exogenous timeouts to test for momentum is supported by Hartigh and Gernigon (2018); they exposed competitive table tennis players to simulated game scenarios with timeouts inserted at critical times after the player experiences a streak of lost points. They find that pauses in play benefit players by providing a chance to psychologically recover from negative momentum, and the benefit holds even when no coaching instructions were given during the timeout. The use of causal inference methods in sports analytics has been rare, but holds promise for uncovering new insights. In addition to the analyses of timeouts in the NBA by Assis, Assunção, and Vaz-de-Melo (2020) and Gibbs, Elmore, and Fosdick (2022), recent papers have used causal inference to model problems with complex confounding factors, including fourth-down strategy in the National Football League (Yam and Lopez, 2019) and home-field advantage in soccer (Price et al., 2022).
3Approximating an Experiment Using Matching
To build intuition for the paper’s approach, imagine the ideal experiment to confirm or disprove the existence of momentum and the ability of timeouts to stop it. First, note that this question is fundamentally causal: did the timeout cause a team with momentum to lose it? As with all causal questions, separate treatment and control groups allow for the cleanest disentangling of effects.
In the ideal case, researchers would randomly select a given instance in a game in which one team had momentum and randomly assign it to the control or treatment group. The control group would continue playing the game as normal. The treatment group, though, would pause the game for a brief time, with no communication to change strategies or to otherwise alter the game. Any subsequent aggregate changes in scoring would therefore be due only to the stoppage of play. Table 1 details this ideal experimental design, along with how the paper replicates the relevant features.
Table 1
Experimental Design Versus Matching
| Ideal Experimental Design | Matching (This Paper) |
| The researcher randomly issues a timeout during momentum. | TV timeout during a run acts as a random assignment into the treatment group |
| ———————————- | Match the treatment to a control team on observable variables |
| Measure changes in scoring | Measure changes in scoring |
Note: Comparing experimental to matching research design.
While finding two games exactly alike in all details apart from the presence of a TV timeout is infeasible, the remaining details of this ideal experiment are not as difficult to replicate. If exogenously caused pauses in gameplay cause active scoring runs to be statistically less likely to continue, it would simultaneously prove the existence of a momentum effect and the ability of timeouts to reduce momentum. By contrast, if timeouts were ineffective at slowing a momentumed team on a scoring run, then exogenous pauses unrelated to the game situation should have no measurable effect on subsequent scoring. This assumption of exogeneity is key to our paper, and we will expand on it shortly.
The occurrence of a TV timeout during a run, however, is not sufficient to test momentum because coaches can change strategy during the timeout in ways that may affect subsequent scoring. To address this concern, we compare sequences where changes, proxied by player substitutions, are the same for the treatment and control groups. For example, if a team substitutes one player during a TV timeout, the run should be compared to one in which one player is substituted during the run, which can occur at a dead ball such as after a made basket.
Matching is a statistical technique for observational data that enables the comparison of two groups that are the same on all measurable features except the treatment of interest (Imbens and Rubin, 2015). In the context of this paper, matching is used to pair in-progress runs that are the same except for the presence of a TV timeout. Table 2 shows how matching works in this paper.
Table 2
An Illustrative Example of Matching Research Design
| GAME A (Treatment) | GAME B (Control) |
| 6-0 run by team | 6-0 run by team |
| TV timeout called | Stoppage of play other than a timeout |
| 1 substitution by momentumed team | 1 substitution by momentumed team |
| 2 substitutions by opposing team | 2 substitutions by opposing team |
| Play resumes | Play resumes |
| Eight points scored in subsequent 3 minutes | Ten points scored in subsequent 3 minutes |
Conclusion: The TV timeout was responsible for fewer points being scored in Game A. Note: The point and substitution amounts are hypothetical, for illustration.
Three details merit attention. First, comparing the results of one pair of matched runs cannot meaningfully adjudicate the momentum question. Therefore, the paper uses data from every game from 13 NBA seasons, from 2004-2005 to 2016-2017.
Second, note that the matching occurs on whether or not the run in progress is interrupted by a TV timeout. The paper uses TV timeouts because they occur at pre-specified moments in the game. Since TV timeouts occur regardless of teams’ momentum, their occurrence randomly assigns teams into treatment and control groups.
This second point is foundational to this paper and deserves elaboration. Consider Table 1’s invocation of the ideal experiment to determine the existence of momentum. A key characteristic is that teams had no ability to select the group, treatment or control, into which they are placed. This randomness is fundamental to the experiment’s design because teams that actively sought the treatment group (i.e., used a coach’s timeout) may differ from those that did not select into that group. TV timeouts are mandatory and therefore do not permit teams to self-select into treatment (TV timeout) or control (no timeout) groups; the assignment is random. This random assignment into groups also permits estimation of the causal impact of gameplay pauses on momentum (Imbens and Rubin, 2015). By comparison, timeouts called by coaches are very much a function of momentum, and therefore cannot randomly separate control from treatment groups–indeed, with coaches timeouts as the causal instrument, the unit of analysis can effectively self-select into treatment or control group. Additionally, matching on all timeouts (TV and coaches’) likely violates the hidden variation assumption in the matching framework, which states that there cannot be different levels of treatment. In this case, coaches’ timeouts are likely fundamentally different from TV timeouts.
Finally, since coaches can make strategic changes during TV timeouts, there may exist unobserved changes creating a difference between the two scenarios in Table 2. To control for unobserved factors, we include the number of substitutions made as a proxy for changes in strategy. Key to matching in this context is that substitutions can occur during dead balls, not just in timeouts. Either team may substitute players after a break in play such as after a made basket or an out-of-bounds, even when no timeout is called. Since coaches change the players on the court to change team strategy, matching on the number of substitutions for teams with and without momentum isolates the effect of strategy changes on momentum In addition, a battery of robustness tests, explained in Section 5.2, attempt to control for non-substitution ways in which strategy may affect momentum; using simulations, alternative estimators, selecting gameplay more or less likely to feature strategy, and using different operationalizations all buttress the findings of this initial research design.
4Operationalization
This paper uses play-by-play data from 13 NBA seasons, including playoffs, from 2004-05 to 2016-17. This data was obtained from bigdataball.com, a data aggregator (2020). Each row of the dataset is a scoring play in an NBA game. Each scoring play has information on a number of variables: which lineups each team has on the floor, the number of points scored by a given team, the amount of time left in the game, and the presence of a timeout immediately after that play. Importantly, the dataset identifies which timeouts were TV timeouts.
Testing whether TV timeouts affect momentum, and therefore whether momentum exists, requires a quantitative identification of momentum before the TV timeout and a measure for determining if momentum stops.
To determine when momentum exists, we set a threshold for the number of unanswered points a team needs to have scored. Initially, this threshold is set at six unanswered points or more: if a TV timeout occurs and one team has scored at least six unanswered points immediately prior to the timeout, the TV timeout interrupts momentum. Equation 1 formalizes this definition; mi is an indicator for momentum, and pu represents the number of uninterrupted points.
(1)
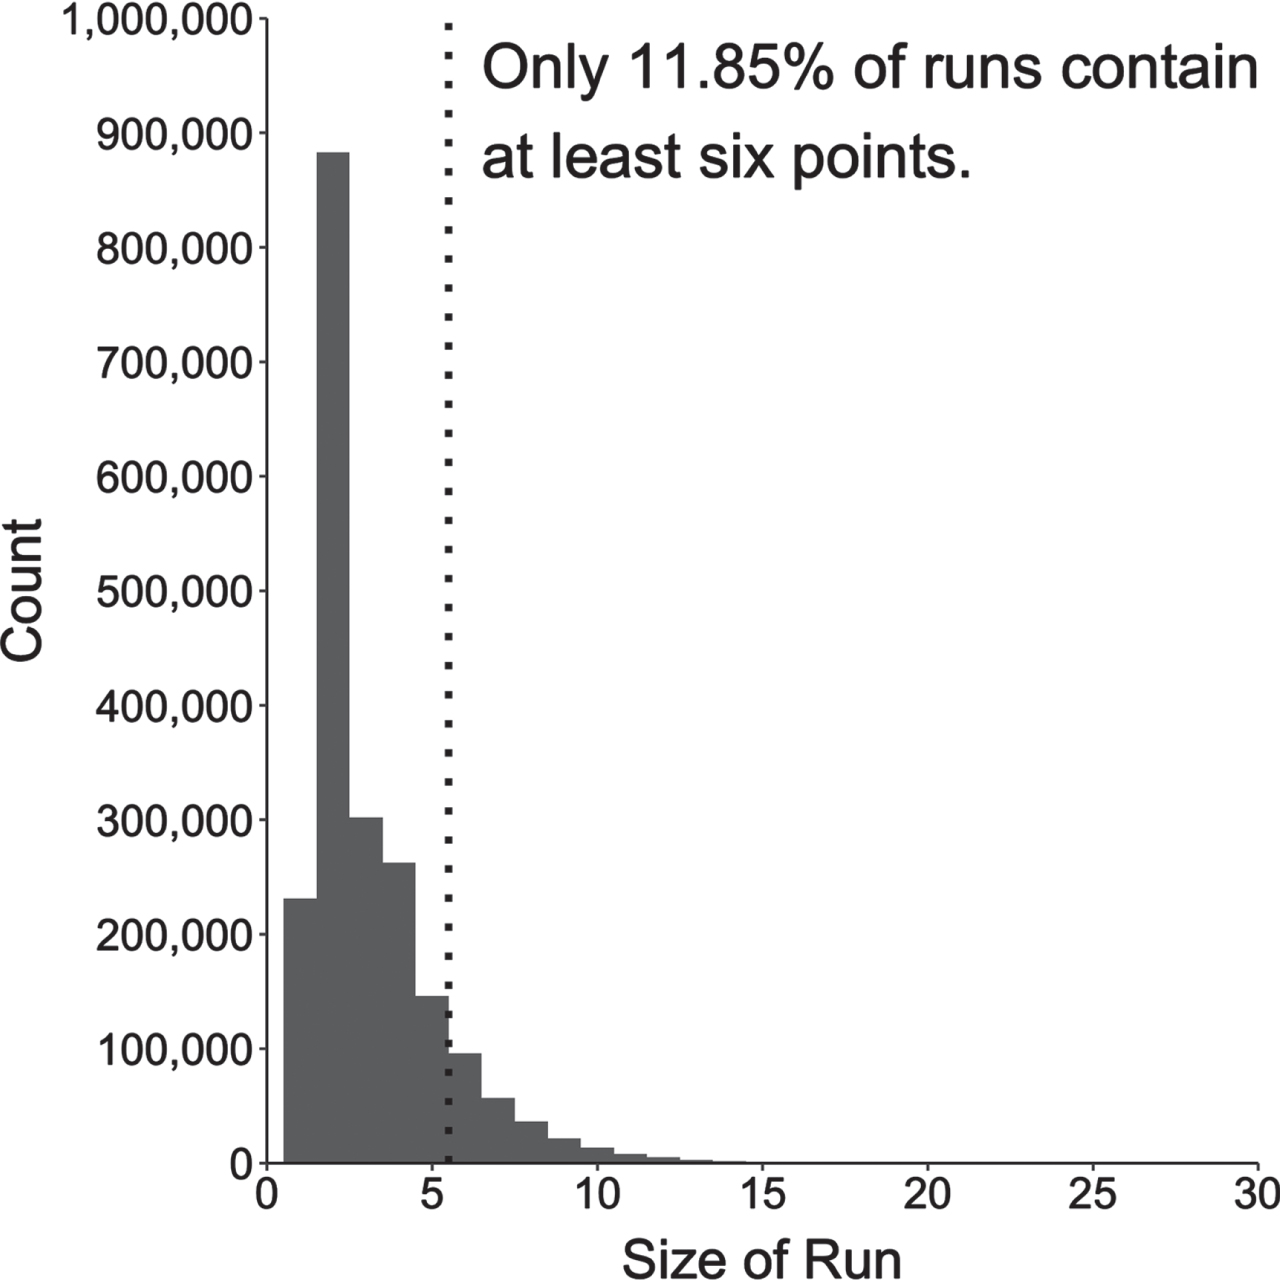
Six is chosen because it represents two or three made baskets (ignoring very rare four-point plays). Three unanswered two-point field goals means a 4-0 run may not have been a fluke, and two consecutive three-point field goals or three-point plays has a demoralizing effect. More concretely, Fig. 1 shows that the vast majority of unanswered scoring sequences are of fewer than six points: only 11.85% of runs are of six or more unanswered points. To ensure that the selection of six as the threshold does not drive results, later robustness check expands the analysis to larger runs.
Fig. 1
Distribution of Run Length. This histogram shows the distribution of run length across the 13 seasons of data, with the dashed line demarcating the threshold used to define a run in this paper.
The second operational detail lies in what constitutes breaking a run. There are myriad ways one could imagine operationalizing a run’s stop. One is to simply examine whether a team on an unanswered scoring streak had that streak snapped. We avoid this definition, though, because it is not consistent with intuitive understandings of possessing momentum. A team’s momentum might not be interrupted by surrendering a single basket; for example, a team scoring 18 of the past 20 points is certainly regarded as having momentum. Rather, we measure the number of points the momentumed team scores in gameplay subsequent to the TV timeout. Comparing this total across the treatment and control groups allows us to make direct measurements of the impact of TV timeouts on points scored in a game without limiting the usable data to unanswered runs only.
We match treated observations with their closest nontreated neighbor, where distance is measured using propensity scores based on logistic regression.1 This approach uses all matching variables as independent variables in a logistic regression with the treatment dummy as the dependent variable. Then, the propensity scores –probability of inclusion in the treated group –are matched such that each observation in the treatment group (having a TV timeout) is matched with a maximally similar observation in the control group (no timeout). We then discard all unmatched observations so that the data consists of pairs of matched runs, half of which are interrupted by a TV timeout and half of which are not interrupted by any type of timeout. The result is two groups of observations, momentumed teams interrupted by a TV timeout and uninterrupted momentumed teams, that are identical on all observables except for the occurrence of the TV timeout. Table A1 in Appendix A shows a covariate balance test between the treated and control groups; no statistically significant difference between the two groups exists. The matched runs can occur across two separate games and teams.
The result is a single dataset with the following independent variables:
1. Subsequent TV timeout: a dummy variable representing the presence of a TV timeout immediately after the scoring event in question.
2. Run size by momentumed team: the number of unanswered points a team has scored.
3. Substitutions by momentumed team: The number of substitutions made by the team on a run immediately after the play in question. This can range from zero to five players substituted. If the scoring event was followed by a TV timeout (treatment group), then this includes only those substitutions made during the timeout. If it was not followed by any type of timeout (control group), then this includes substitutions made immediately following the basket, before play resumes.
4. Substitutions by opposing team: The number of substitutions made by the team opposing a run after the play in question; it is defined similarly to substitutions by the momentumed team.
The dependent variable is the number of points scored by the momentumed team during the three minutes of game time subsequent to the TV timeout. Three minutes is the cutoff because it is the maximum amount of time that could elapse between the end of a TV timeout and the start of another break in play (either another TV timeout, a coach’s timeout, or the end of a quarter); for example, if a TV timeout happened with six minutes left in the second quarter, and neither coach calls a timeout within the next three minutes, then another TV timeout is called at the three-minute mark (National Basketball Association, 2016). We also tested various other cutoffs to ensure that the results are robust to this parameterization, which are shown in Appendix D and discussed in Section 5.2.
We model the outcome using Poisson regression, consistent with standard approaches for count data. The treatment is a TV timeout during a run, and the model controls for current run size as well as substitutions by each team. A negative and statistically significant relationship between a TV timeout and points scored in the subsequent three minutes of gameplay would imply a strong relationship between a TV timeout occurring in the midst of a run and the momentumed team scoring fewer points in the aftermath of the timeout. This result would suggest momentum exists: if it did not, the TV timeout would have no correlation with subsequent scoring. Controlling for substitutions approximates for changes in strategy after a timeout, so any result found for a TV timeout is due to the timeout and not changes in strategy.
5Results
This section presents the main result of the paper: the negative effect of TV timeouts on subsequent scoring of the momentumed team. This result survives several robustness checks concerning the operationalization of momentum and points scored after a TV timeout, and strategy changes do not appear to explain the results.
5.1Main Results
Table 3 shows the Poisson regression results on the matched data described in prior sections. All models use the same dependent variable, the number of points scored in the subsequent three minutes. Each model differs by the size of the run that is classified as momentum. The first model selects 6 points as that threshold; the second, 10; and the third, 15. In each model, a statistically significant and negative correlation exists between a TV timeout and subsequent scoring for the team of a run. Opposing team substitutions cause fewer subsequent points, but the effect is less than half as strong as the momentumed team substituting players; the TV timeout’s effect is between the two substitutions’ effects.
Table 3
Effect of TV Timeouts on Momentum
| Dependent variable: | |||
| Points Scored in Next 3 Minutes by Momentumed Team | |||
| Run≥6 Points | Run≥10 Points | Run≥15 Points | |
| Subsequent TV Timeout | –0.119*** | –0.123*** | –0.368*** |
| (0.012) | (0.036) | (0.129) | |
| Run Size by Momentumed Team | –0.002 | –0.003 | –0.018 |
| (0.003) | (0.009) | (0.031) | |
| Substitutions by Momentumed Team | –0.176*** | –0.087 | |
| (0.028) | (0.073) | ||
| Substitutions by Opposing Team | –0.077*** | –0.045 | –0.042 |
| (0.017) | (0.053) | (0.121) | |
| Constant | 1.798*** | 1.784*** | 2.123*** |
| (0.024) | (0.103) | (0.517) | |
| Observations | 5,148 | 576 | 48 |
| Log Likelihood | –12,511.460 | –1,380.973 | –120.809 |
| Akaike Inf. Crit. | 25,032.930 | 2,771.946 | 249.619 |
Note: The first row shows that TV timeouts decrease subsequent scoring at multiple levels of run length. *p < 0.1; **p < 0.05; ***p < 0.01.
The first column of Table 3 shows the main result. It shows that a TV timeout causes the momentumed team to score slightly more than 11% fewer points (e-.119 - 1 = - .112) in the subsequent three minutes. This effect is about 50% larger than the opposing team substituting a player (e-.077 - 1 = - .0741). Both results are unlikely to have occurred by chance (p < 0.001). When looking at longer runs (columns two and three), the discrepancy is even more apparent: opposing team substitutions have no statistically significant effect on the momentumed team’s scoring, but the TV timeout effect grows.
The disappearance of momentum is the result of a pause in play and alteration of the five players, not mean reversion or the opponent’s changes. First, the regressions find no evidence of mean reversion during runs. The coefficient on the size of the current run is.001, and it is not statistically significant in any regression. Second, the momentumed team substituting a player negatively affects a run and does so more than the TV timeout. It reduces subsequent points by about 16% (e-.176 - 1 = -0.161). Upon reflection, this result makes sense: if team momentum exists, then breaking the team that experiences the momentum by substituting out a player changes the composition of the momentumed team. In effect, the momentumed team is no longer playing after the timeout. An implication of this result is that coaches of momentumed teams should not substitute players during a TV timeout.
These dynamics are more apparent when analyzing runs of more than 10 and 15 points, columns 2 and 3 respectively. In those models, the only variable that causes subsequent points scored to decrease is a TV timeout, a 11.57% and 30.79% decrease. 30.79% is the largest effect for any variable across all the models, though it should be interpreted cautiously given the small sample size (n = 48).
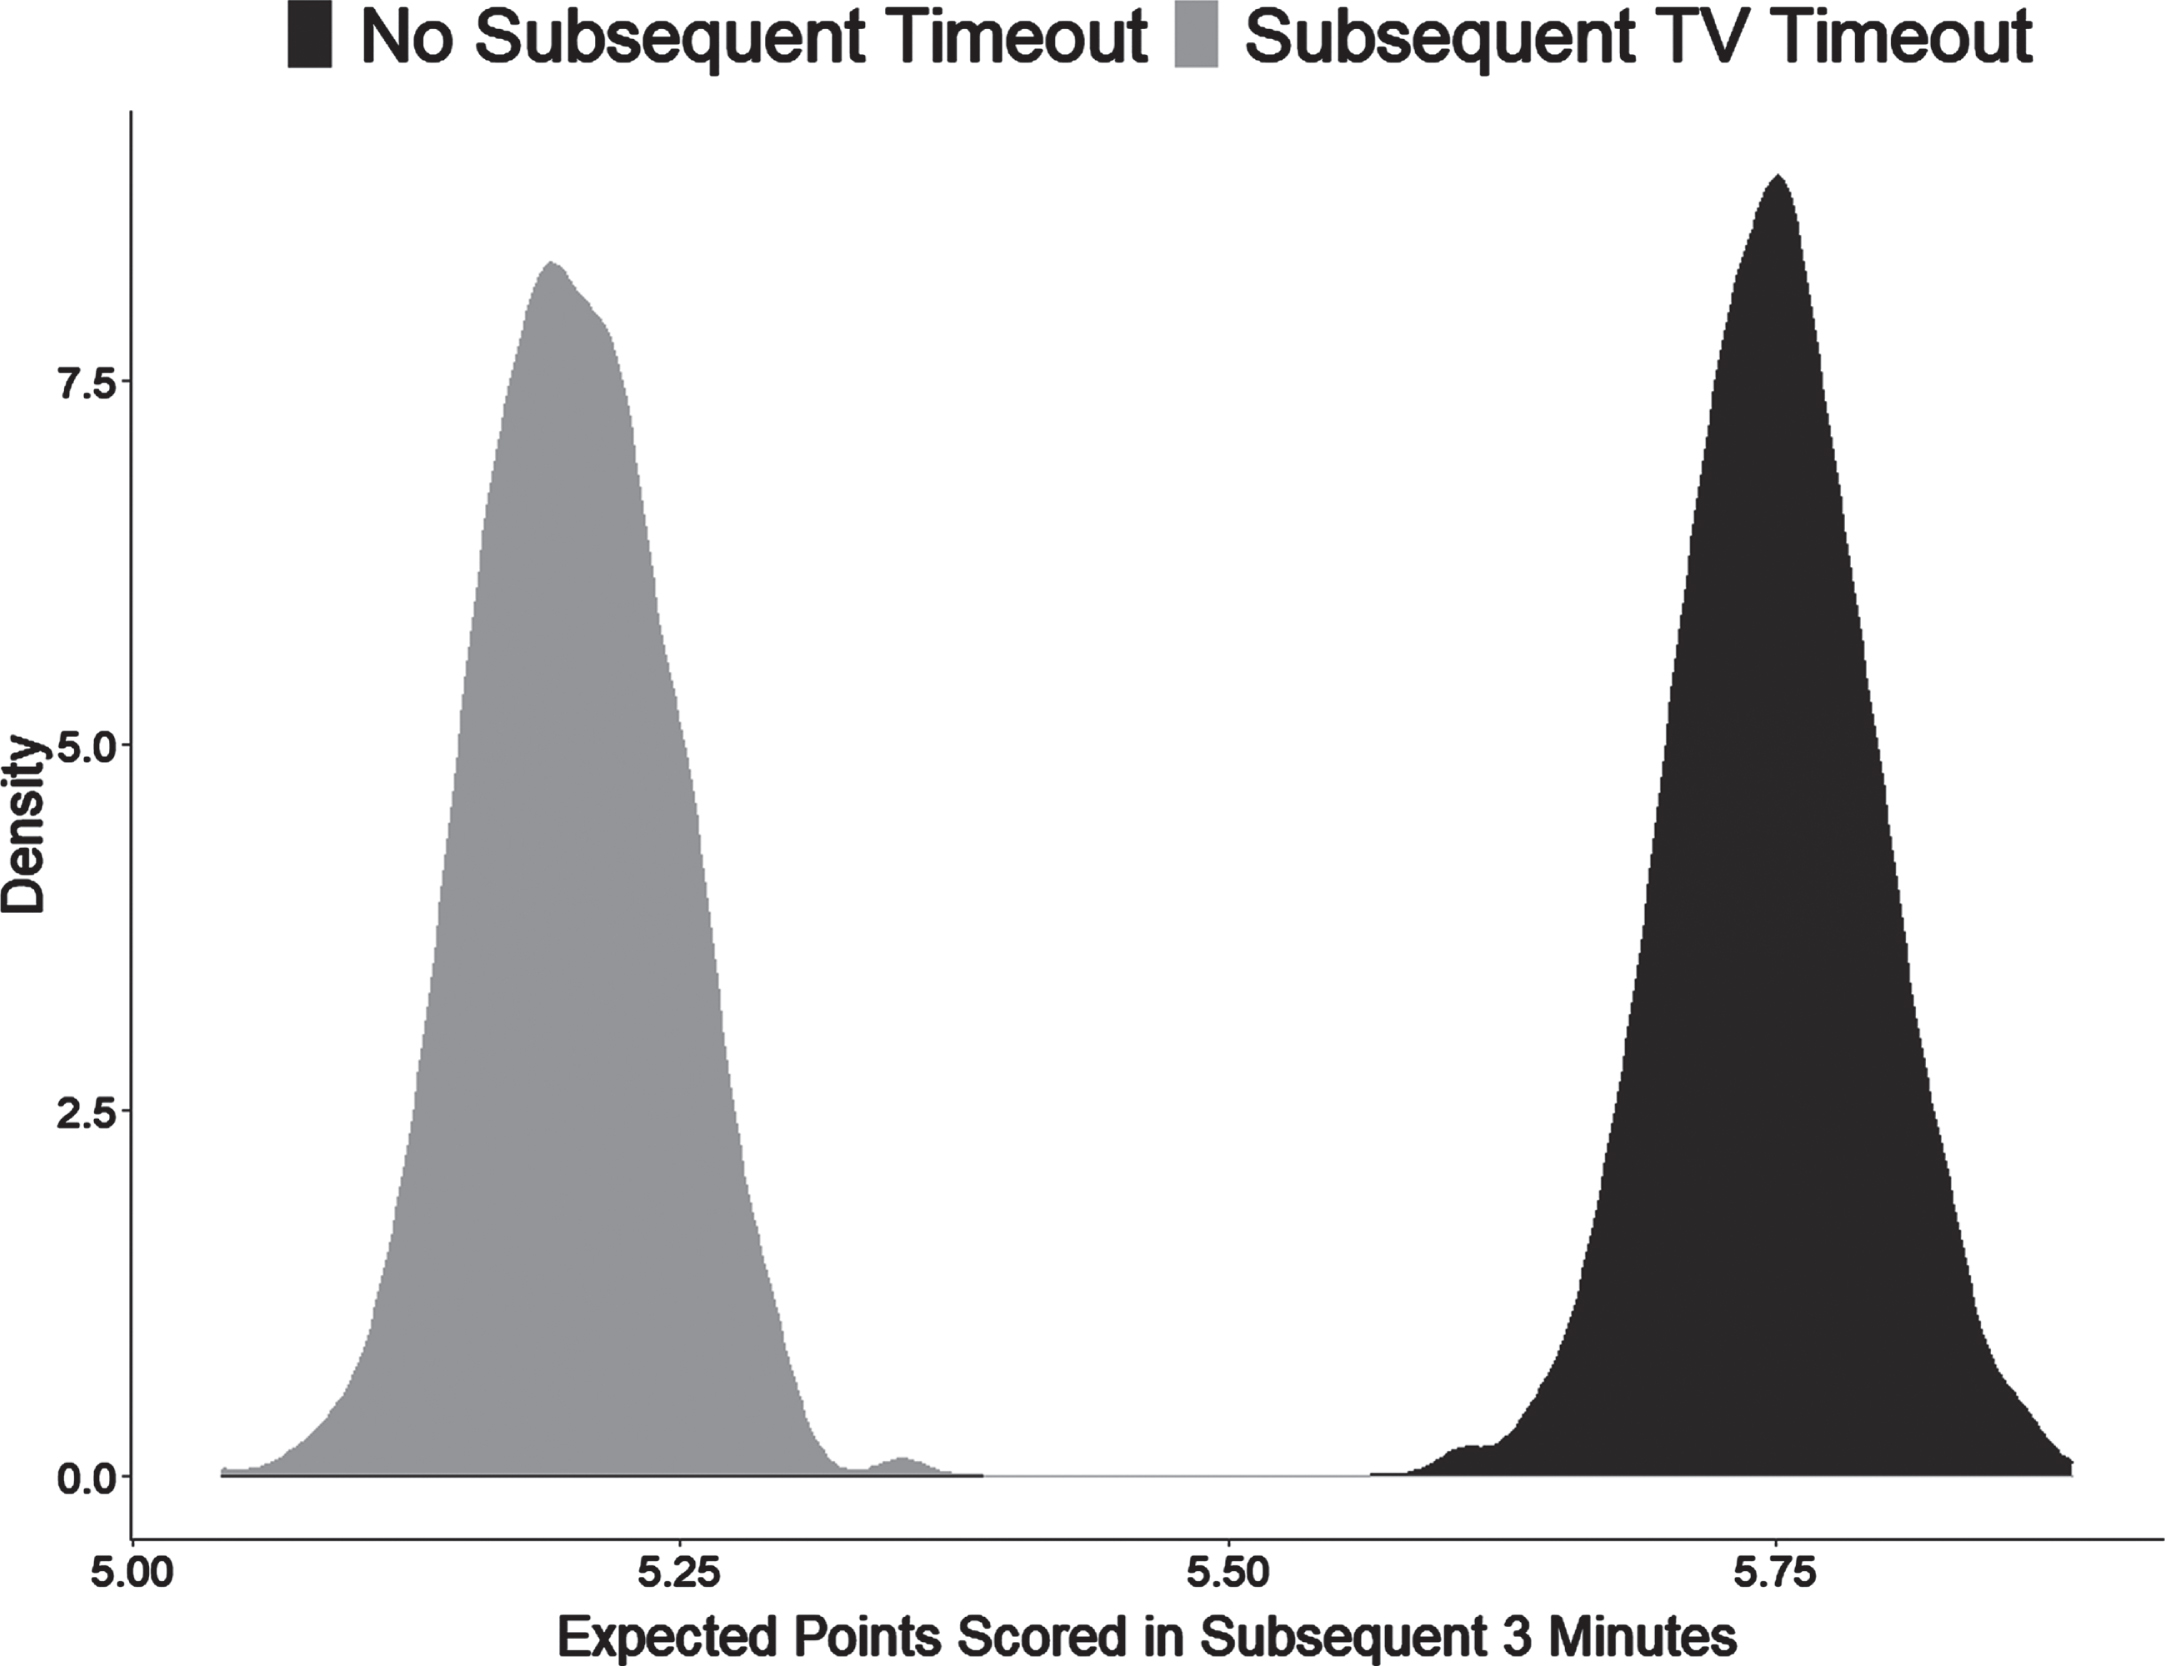
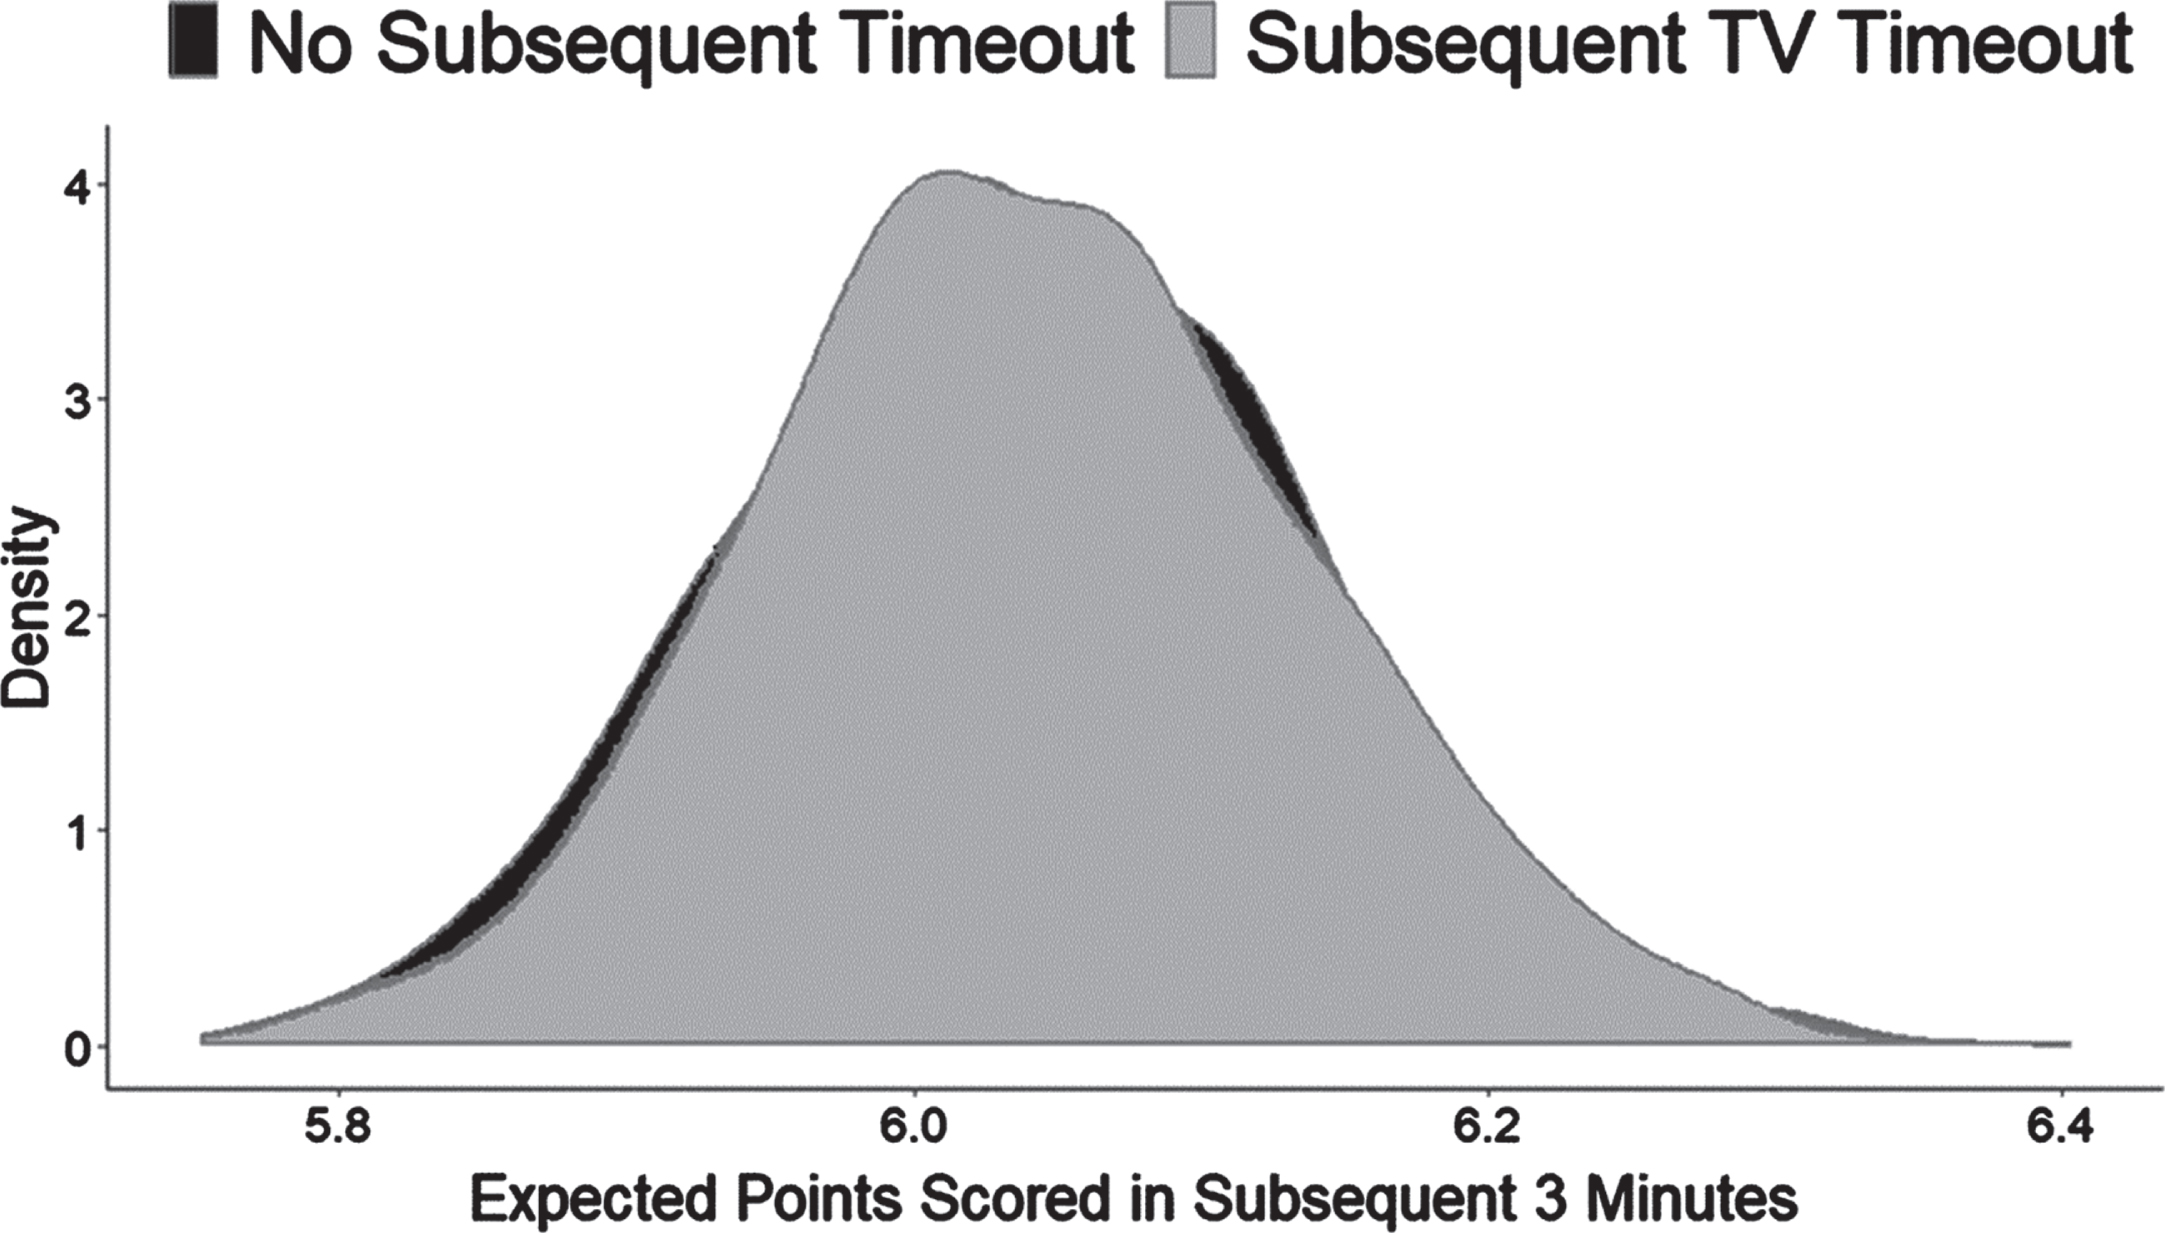
Figure 2 shows the effect size in terms of points scored. The expected difference between the two groups is about 0.56 points over the course of three minutes of gameplay. Though not a large effect at face value, the difference could nonetheless add substantial win probability over the course of a tightly contested game. Moreover, 0.56 points is the minimum effect size because the dependent variable includes three minutes of post-TV timeout gametime. (See Figure A1, discussed in more detail shortly.) The inclusion of this time allows for other factors to buffet and weaken the main effect. When looking immediately after the resumption of play, for example at the number of points scored in the first minute after a TV timeout, the effect on momentum is approximately four times as large.
Fig. 2
Distribution of Points Scored With and Without TV Timeouts. The two density distributions reveal a clear reduction in points scored after a TV timeout (cyan) versus no TV timeout (red).
Because AIC and log-likelihood are not comparable across models with different numbers of observations, it is unclear which model in Table 3 best fits the data. To facilitate this comparison, we sample a random subset of 48 observations, the number of observations of runs of at least 15 points, rerun models 1 and 2, and record their AIC. We repeat this process 1,000 times to bootstrap the distribution of the AIC for the two models. We also repeat this procedure for samples of size 576 for model 1 so that its fit can be compared to model 2. Figure 3 shows the distribution of the 1,000 AICs and includes a vertical line for the AIC of the referent model. (A lower AIC means the model fits the data better.) The 6 and 10 point models fit the data better than the models using 15 point runs; models of 6 point runs fit the data as well as their 10 point equivalent.
Fig. 3
Comparing Model Fit for Runs of at Least 6, 10, or 15 Points. (a) compares the AIC of 1,000 samples of size 576, the number of observations for runs of at least ten points, for runs of at least six points. (b) does the same but the sample size is 48, the number of observations for runs of at least 15 points. The dashed line is the AIC of the comparison model, and a lower AIC is better. By forcing samples of different run lengths to have the same number of observations, the results are directly comparable. (a) shows that TV timeouts explain equally well the change in momentum for runs of at least six or at least ten points, and (b) shows runs of 6 and 10 points better fit the data than runs of at least 15 points.
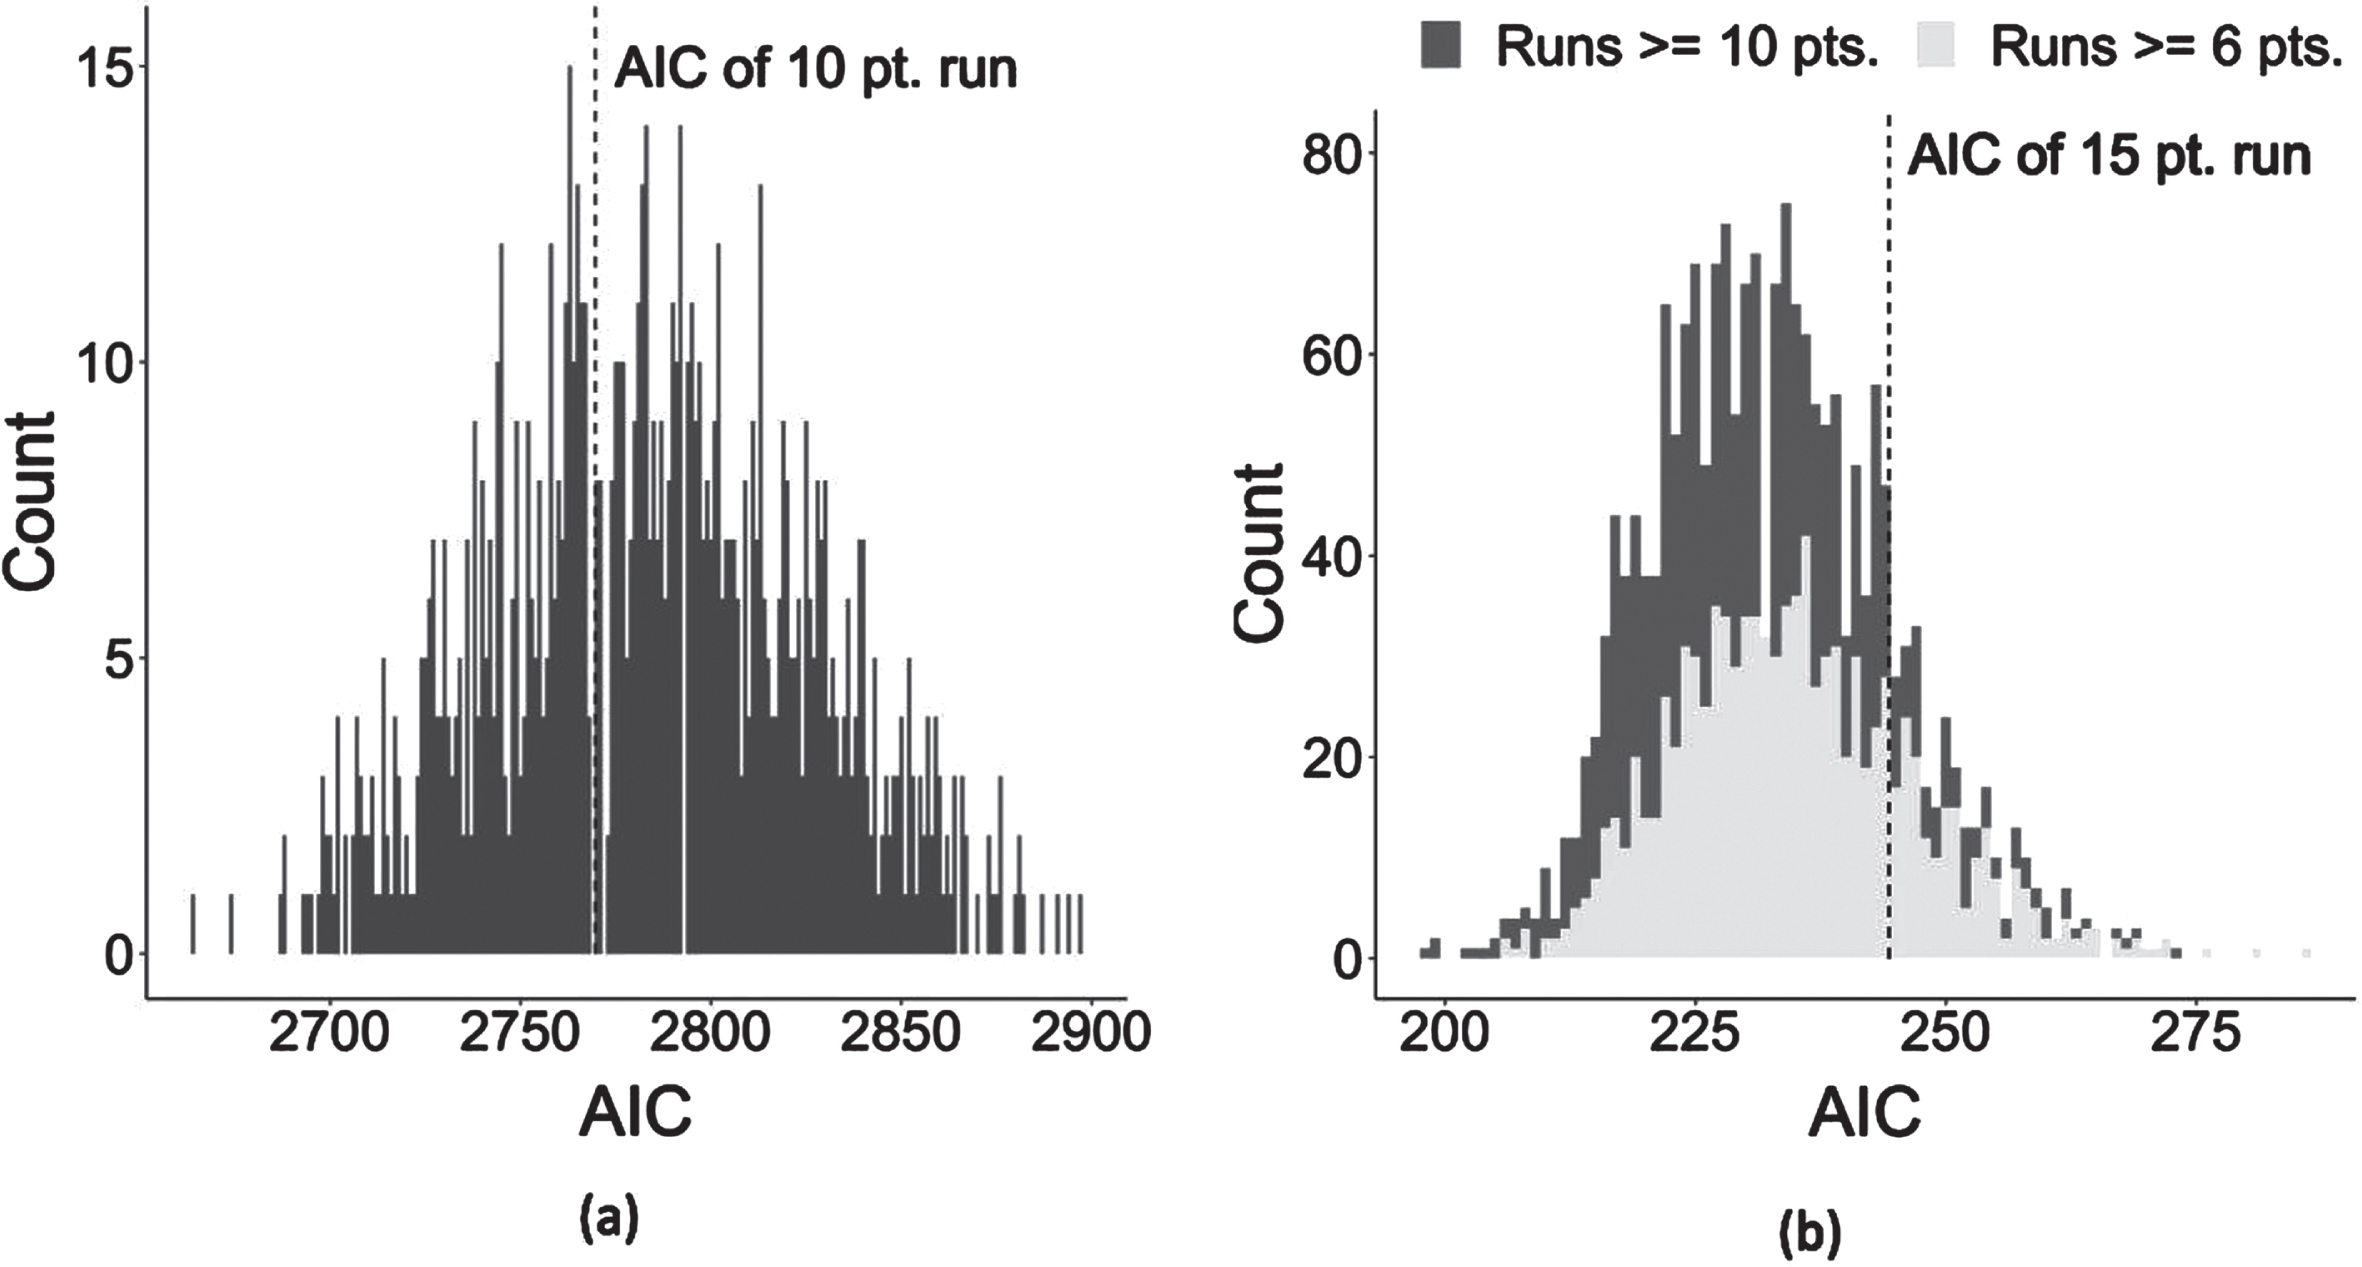
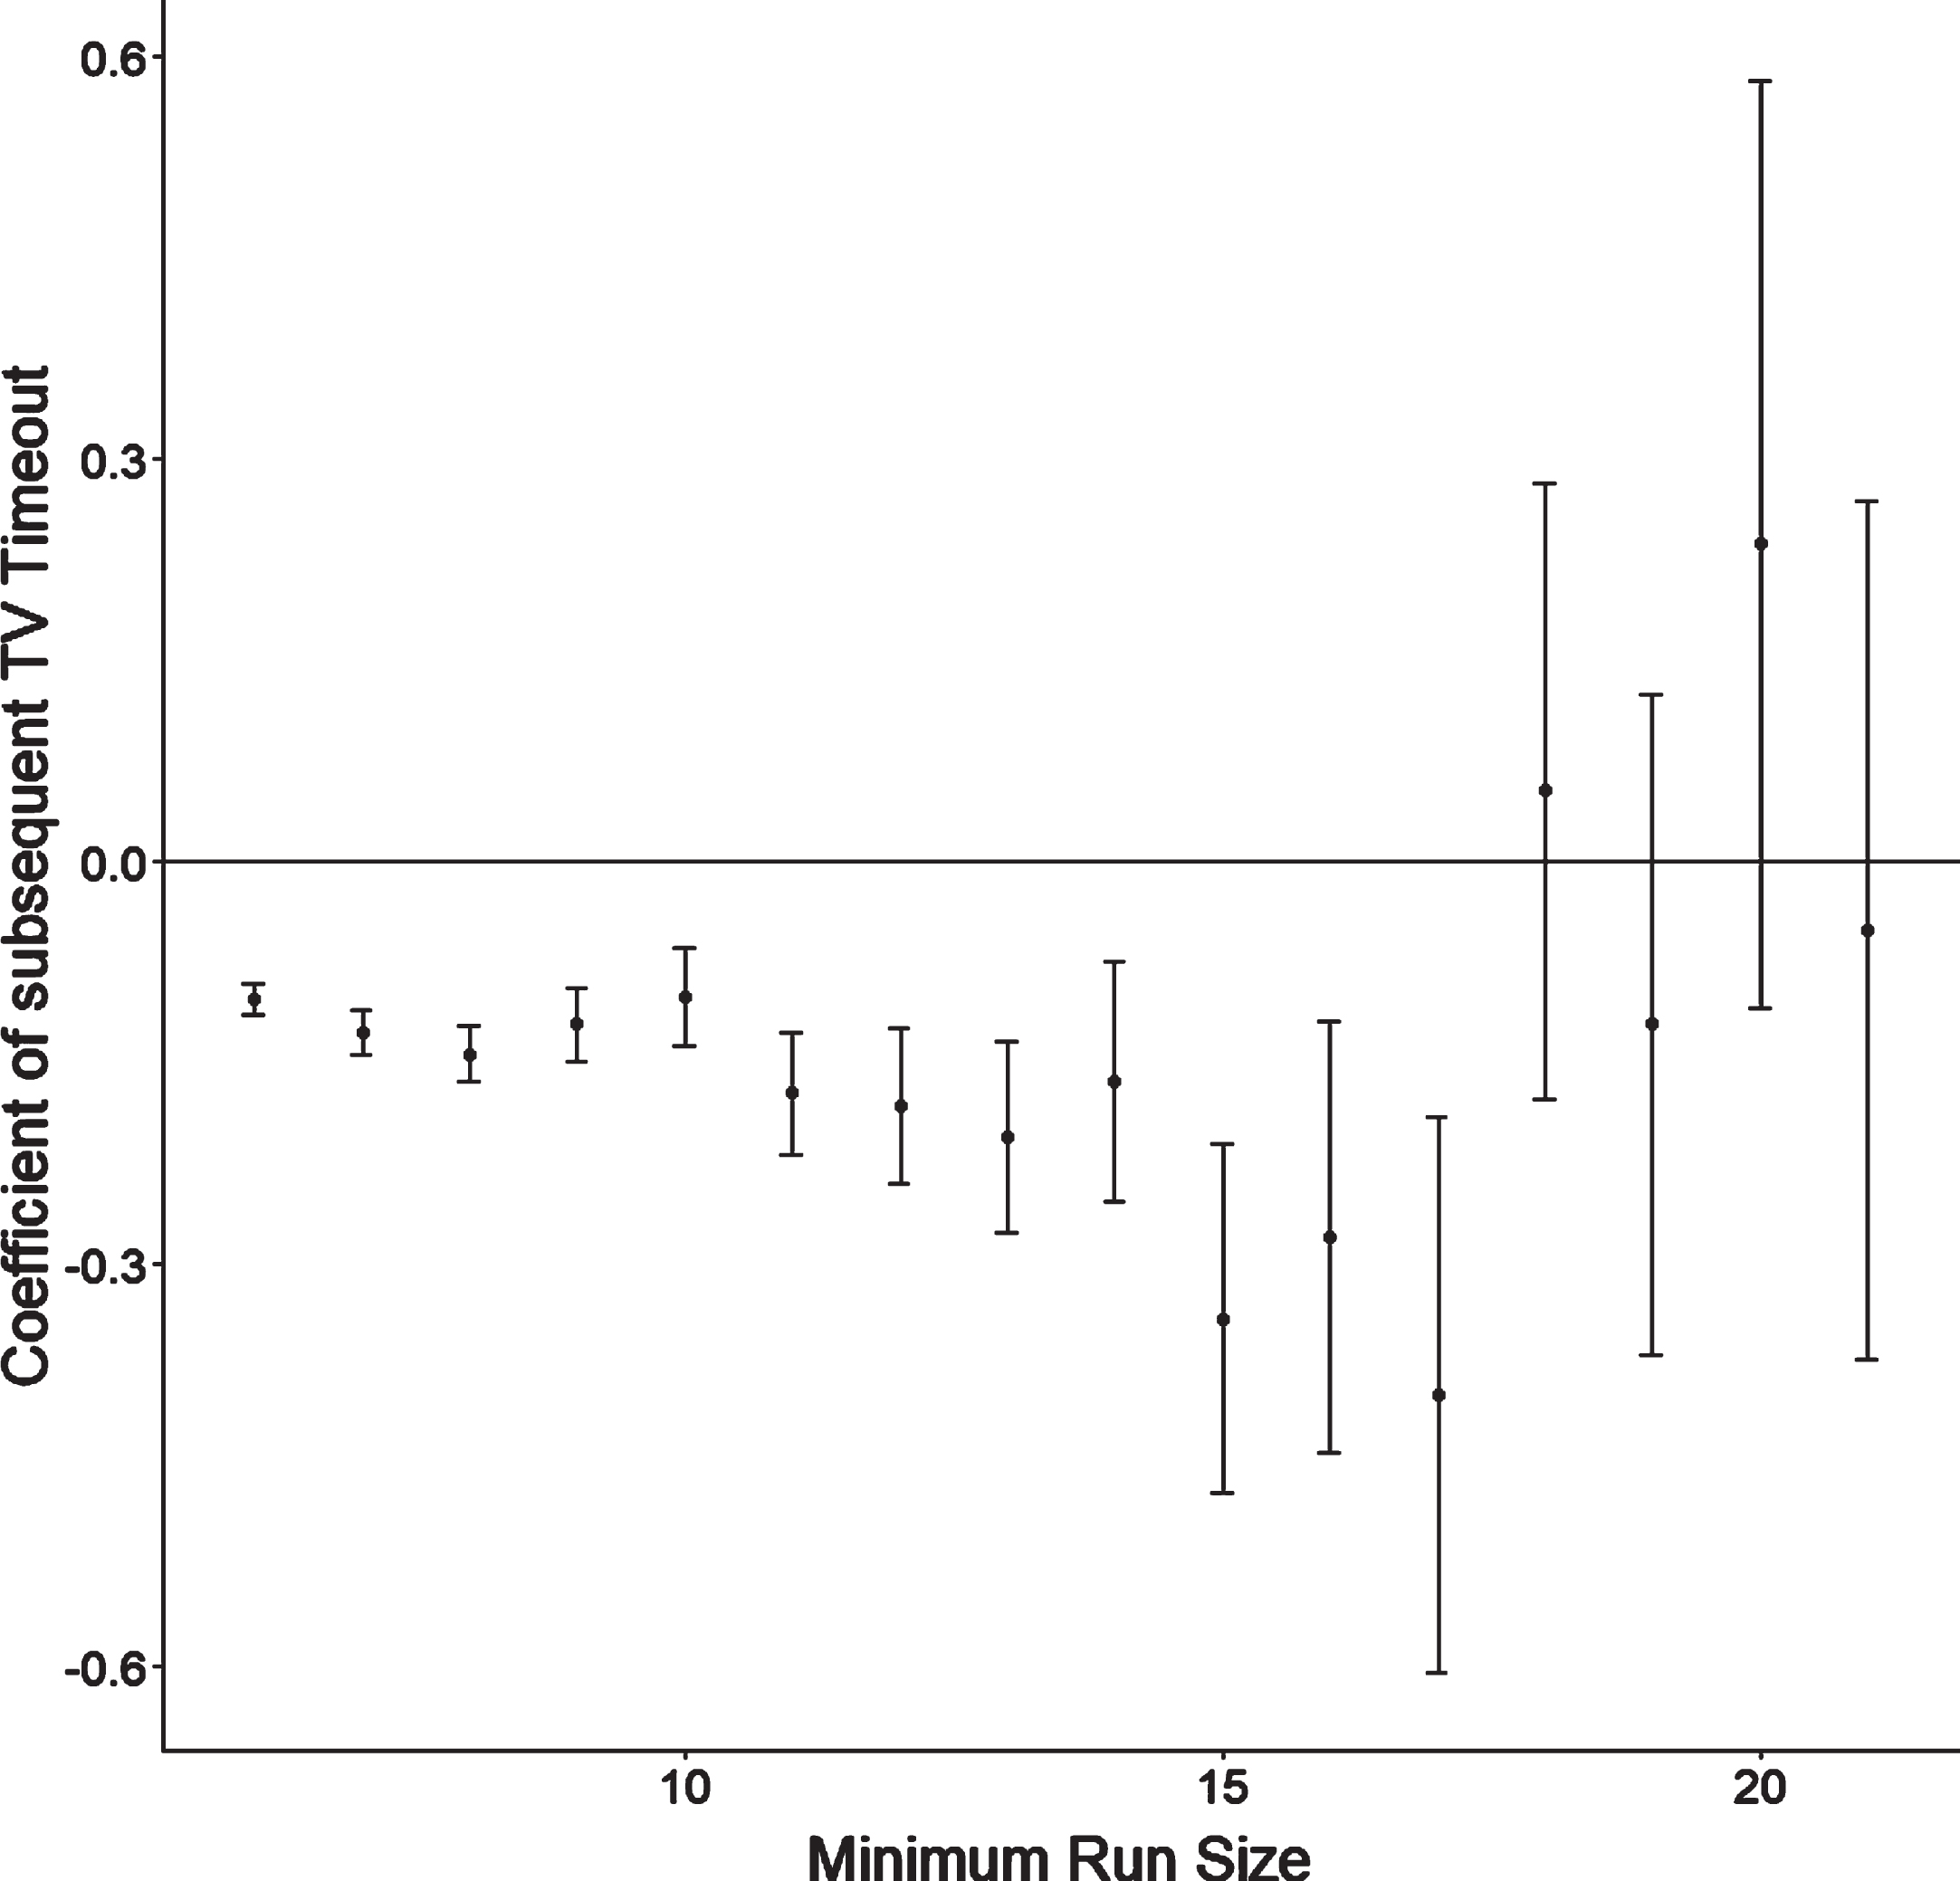
Figure 4 expands Table 3 by showing the effect size of TV timeouts as a function of the momentumed team’s run length. TV timeouts decrease subsequent scoring for runs of 17 points or fewer. The increasing standard errors reflect the scarcity of long runs: only 8.47% of runs of six points or more are of more than 10 points.
Fig. 4
Effect Size as a Function of Run Length. This figure shows that the effect of TV timeouts on momentum is consistent across the range of run sizes up to runs of 17 points. The paper’s finding is therefore not due to selecting runs of a specific size (6, 10, and 15 points).
Two sets of tests investigate whether the apparent effect of TV timeouts is due to changes in strategy; Table 4 and Fig. 5 show their results. If coaches change strategy during TV timeouts, any resulting decrease in points scored for the momentumed team could be due to the concurrent change in strategy and not the interruption of momentum. To decompose these effects, analysis is performed using only TV timeouts in which neither team substitutes a player; assuming strategy change occurs via substitutions, changes in points scored after these observations should therefore only be due to the TV timeout’s interruption of momentum. Table 4 shows these results. After TV timeouts in which neither team substitutes a player, 6.57% fewer points are scored, an effect about 41% smaller than TV timeouts with substitutions (Table 3). This result suggests that TV timeouts stop momentum via stoppage of play (Table 4) and changes in strategy (Table 3), with the former explaining about 59% of the change in points scored and the latter the rest.
Table 4
Effect of Strategy Change on Momentum
| Dependent variable: | |
| Points Scored in Next 3 Minutes by Momentumed Team No Substitutions By Either Team | |
| Subsequent TV Timeout | –0.068*** |
| (0.013) | |
| Run Size by Momentumed Team | –0.015*** |
| (0.003) | |
| Substitutions by Momentumed Team | |
| Substitutions by Opposing Team | |
| Constant | 1.848*** |
| (0.026) | |
| Observations | 4,644 |
| Log Likelihood | –11,195.720 |
| Akaike Inf. Crit. | 22,397.440 |
Note: These results are for the matched runs where no substitutions occur. Since substitutions are the primary way coaches change strategy during a timeout, the result suggests that strategy changes do not explain all of the decrease in momentum. *p < 0.1; **p < 0.05; ***p < 0.01.
Fig. 5
Relationship Between Substitutions and Run Size. If coaches use TV timeouts to change strategy and believe that a longer run reflects a worse strategy on the opposing team’s part, then the number of substitutions should increase as run length increases. Instead, there is no relationship between run length and the number of substitutions by either team, and a regression (not shown) confirms that the slope of this relationship is not distinguishable from zero. While coaches may use substitutions to change strategy, that they do not change the number of substitutions as runs become longer suggest that any strategy change is not related to the run itself.
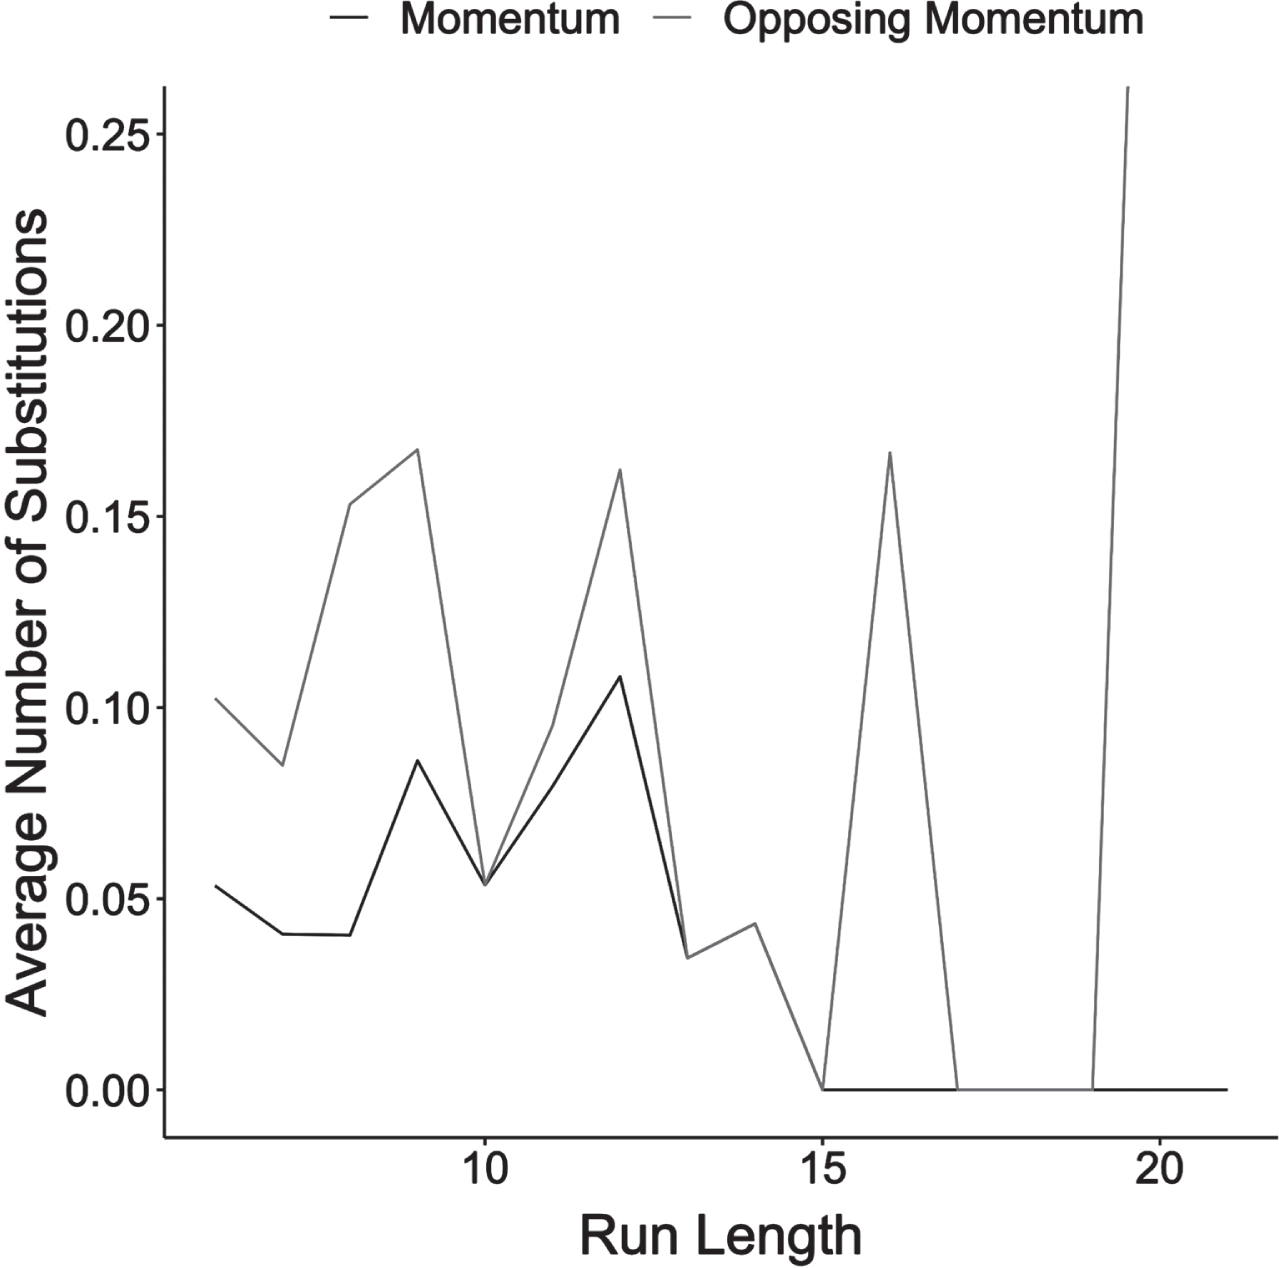
Figure 5 shows that the average number of substitutions does not vary as a function of run length. If coaches use TV timeouts to change strategy and believe that a longer run reflects a worse strategy on the opposing team’s part, then the number of substitutions should increase as run length increases. Instead, there is no relationship between run length and the number of substitutions by either team, and a regression (not shown) confirms that the slope of this relationship is not distinguishable from zero. While coaches may use substitutions to change strategy, that they do not change the number of substitutions as runs become longer suggest that any strategy change is not related to the run itself.
Convinced the main results do not derive from strategic changes reflected in lineup data, we now turn to a series of robustness checks to confirm the results in Table 3.
5.2Robustness Checks
Simulations and several tests validate the results. First, we create a Monte Carlo simulation where the true momentum effect is known. We first simulate a series of 130,000 scoring plays (equivalent to approximately an entire NBA season, including all regular season and playoff games) with zero momentum effect. In other words, each scoring play is an independent random draw with a 50% chance of being a basket scored by each of Team A and Team B. Once every 50 randomly simulated plays, one play is followed by a TV timeout. Substitutions are not simulated because modeling how they affect momentum introduces too many researcher degrees of freedom and the modeled substitution effect would cancel out for both teams. The simulation results are therefore most comparable to the model in Table 4.
Table 5 and Fig. 6 show that the Monte Carlo simulation does not produce a momentum effect. In Table 5, the null result on the variable subsequent TV timeout confirms that our approach to matching does not pick up on a spurious effect where none exists. Figure 6 shows the distribution of points scored after simulated timeouts; they do not differ from points scored during an uninterrupted run.
Table 5
Results of Monte Carlo Simulation
| Dependent variable: | |
| Points Scored in Next 3 Minutes by Momentumed Team | |
| Subsequent TV Timeout | 0.002 |
| (0.022) | |
| Run Size by Momentumed Team | –0.005 |
| (0.004) | |
| Constant | 1.825*** |
| (0.035) | |
| Observations | 1,336 |
| Log Likelihood | –3,123.290 |
| Akaike Inf. Crit. | 6,252.580 |
Note: This table shows results from a Monte Carlo simulation in which scoring plays are not correlated with each other. The first row shows that in these simulations, TV timeouts do not affect subsequent scoring. The simulation also confirms that the research design does not induce spurious correlations (such as those discussed in Miller and Sanjuro, 2018a). *p < 0.1; **p < 0.05; ***p < 0.01.
Fig. 6
Monte Carlo Simulation Results. Each observation in this histogram is a run of the simulation model where the momentum effect is set to zero - that is, simulated TV timeouts have no effect on gameplay. The distribution of expected points scored following the stoppage in play is the same whether or not there was a simulated TV timeout: this serves as a negative control, showing that the matched pairs study design used in this paper correctly fails to observe an effect when no such effect exists.
In addition, the null result from this Monte Carlo simulation provides confidence that the main results of this paper are not a spurious artifact of the methodology used for selecting and matching runs in the data. When performing statistical tests on sequences of Bernoulli outcomes of variable lengths, selecting and comparing sequences of successes (made shots) may introduce subtle and counterintuitive biases. For example, the original result of Gilovich, Vallone, and Tversky (1985) that found no serial correlation in made shots was widely believed for over 30 years until Miller and Sanjuro (2018a) found a “subtle but substantial” selection bias in the sequences of shots that were analyzed, causing an 8 percent error in the estimated percentage of shots made by players on a hot streak versus those on a cold streak. Our approach avoids this trap by using matching rather than directly measuring serial correlations, and the null result from the simulation confirms that this paper’s sampling strategy does not generate a spurious momentum effect.
Appendix B shows an additional robustness check—using negative binomial regressions instead of Poisson ones, a standard check with overdispersed count data (Lawless, 1987). Those results are substantively identical to the ones presented in Table 3.
Next, Appendix C shows three tests to verify further that strategy changes during TV timeouts do not affect results. As a game progresses, coaches may be more likely to alter strategy depending on how the game has unfolded. Subsetting the data to only a game’s first TV timeouts does not change the results. In addition, play during garbage time is likely to be substantively different than play outside of it, as coaches use players deep on the bench and are likely to care less about strategy. Since no standardized definition of garbage time exists, we define it as any play during the final three minutes when either team leads by at least 20 points. Dropping TV timeouts occurring during garbage time does not change results. Finally, teams should be more likely to modify strategy during “crunch time,” the end of games where the score is close. Since there is no standardized definition of crunch time, we drop all observations in the final five minutes when the score difference is equal to or less than 5. Results do not change. Since analyzing only periods of gameplay where strategic changes during TV timeouts are more or less likely to occur than for the data in Table 3 does not change results, these results suggest that strategic changes during TV timeouts do not explain TV timeouts’ effect on momentum.
As a further robustness check, Appendix D uses different timeframes for tallying the post-treatment points scored by the momentumed team. We calculate the number of points scored after a given play in the next 60 seconds, 70 seconds, 80 seconds, and so on, all the way to four minutes. Using these new calculations in place of points scored in the subsequent three minutes as the dependent variable yields substantially similar results: the significant and negative relationship persists across the different dependent variables. However, the point estimate of the coefficient steadily decreases as more post-treatment time is included: the momentum dampening effect of TV timeouts decreases as gameplay progresses after them. Similarly, while there is a significant relationship between a TV timeout and points scored by the team with momentum in the next three minutes, there is no significant relationship between the TV timeout and points scored between the next three and four minutes. This result makes sense because as gameplay moves further from the TV timeout, other events occur that affect points scored, weakening the treatment effect.
As a final robustness check, we replace runs interrupted by TV timeouts with those interrupted by coaches’ timeouts. Results from this analysis are largely similar, though the effect size of coaches’ timeouts is slightly larger on average. Since coaches’ timeouts during runs should be more likely to have strategic changes than TV timeouts during runs, this result suggests TV timeouts contain both elements of momentum stoppage and strategic changes. Similarly, we rerun the analysis by matching runs interrupted by any timeout with uninterrupted runs. In that regression analysis, we then add indicator variables for both coaches’ and TV timeouts, allowing for the direct comparison of the two variables’ coefficients. The difference was not significant. Appendix E shows both these results.
5.3Limitations
A potential limitation of this paper is that TV timeouts may not be exogenous to gameplay change. Put differently, it could be the case that the observed effect of TV timeouts is not a result of stopping momentum, but rather is a result of strategic changes made by either team. If this is the case, then the omission of covariates such as strategic changes other than the number of substitutions could affect the results. For example, a coach could change strategy during a TV timeout without substituting players by altering how their team plays, such as by changing defensive assignments or pick and roll assignments; impassioned speeches could also boost player energy and increase offensive production.
Future research could measure non-substitution strategic changes with notational analysis data. Notational analysis data such as defensive assignments or player speed would allow for testing of these other changes, but we did not pursue it for several reasons. First, we suspect that such changes do not affect this paper’s results because it is unlikely they would have stronger effects during TV timeouts (the treatment group) than during other stoppages of play (the control group). This suspicion is because the substitution effect disappears when analyzing longer runs while the TV timeout effect remains, so any effects uncovered with notational analysis are also unlikely to nullify that of TV timeouts. Second, matching on additional covariates will produce an even smaller sample than the current sample sizes of 5,148, 576, and 48 shown in Table 3, sharply reducing the ability to make any statistical inference. Third and most importantly, we are aware of no readily available source of notational data. Using notational data as a proxy for strategic change therefore remains open for future work.
Finally, several tests described in Section 5.2 constitute attempts to confirm that results are not due to strategic changes made during TV timeouts. Appendix C shows that situations in which strategic shifts are more or less likely to have an effect do not have different results than Table 3. Appendix E shows that using coaches’ timeouts, which are more likely to have strategic changes than TV timeouts, does not change results. While strategic changes probably do occur during TV timeouts, thorough analysis of the available data suggests they do not explain the results.
6Conclusion
This paper brings a novel approach—causal inference techniques and the exogenous treatment of TV timeouts—to one of the most prominent and controversial topics in sports analytics. Doing so finds that TV timeouts cause the momentumed team to score 0.56 fewer points, a decrease of 11.2%, in the next three minutes of game play. This finding provides evidence that team-level, in-game momentum exists and can be reduced by interruptions to the flow of play.
Various robustness checks eliminate plausible alternative explanations for the main effect. The main regression results demonstrate that the observed momentum effect is not the result of mean reversion, and the Monte Carlo simulation serves as a negative control which demonstrates that the effect is not a spurious artifact of selecting runs. The results hold when varying the lengths of the preceding run, varying the outcome timeframe, and using a negative binomial model instead of Poisson. Additionally, coaches’ strategy changes do not explain the momentum effect: the effect of number of substitutions by the opposing team is small, and the same main effect is still seen when subsetting only on TV timeouts without substitutions, subsetting only on those that occur earlier in the game (i.e. excluding garbage time), and subsetting on those that occur outside of crunch time.
These results challenge the conclusion of Morgulev, Azar, and Bar-Eli (2019) and of Schilling (2019) by demonstrating that team-level momentum can exist within basketball games. By using causal inference with the treatment of TV timeouts, an effect is identified that may have been drowned out by other sources of randomness in these and other studies that looked for momentum via serial correlations or length of runs.
If coaches can affect momentum by calling timeouts, then they should be more liberal with their use of them, particularly if the motivation is to halt momentum of opposing teams. Even a single unused timeout adds points, on average, to the opponents’ score. It may not be possible to directly attribute a win to the usage of timeouts, but over the course of a season there will be enough close games that the momentum-reducing effect of timeouts may directly affect a team’s record. Another implication is that coaches of the momentumed team should not substitute players during a TV timeout since doing so causes a greater decrease in subsequent points scored than the timeout or opponent’s substitutions.
Since momentum is debated across sports, this study has implications beyond the realm of basketball. Within-game momentum in any sport, a phenomenon for which evidence has previously been thin, should be explored. Skeptics of analytics claim that the discipline cannot prove outcomes that seem intuitively true about basketball, such as the existence of momentum. The original hot hand research met with skepticism from coaches (Kahneman, 2011), and decisions based on analytics are often criticized if they contradict widespread beliefs (Burke, 2019; Lewis, 2004; Lindbergh, 2013). This paper aligns analytically derived insight with many traditionally skeptical of those insights.
Much of the discipline’s approach has been correlational or predictive. But many questions regarding strategy are fundamentally causal in nature, such as the effect of a timeout on an NFL kicker’s chance of making a field goal or the effect of relieving a starting pitcher after a given pitch count has been reached. We hope that this type of approach will open up new avenues of research for sports analytics.
Acknowledgments
The authors would like to thank Thomas Davids, Jason Basham, Nikola Andric, Scott Guenther, and two anonymous referees for their invaluable feedback which improved this paper.
Supplementary material
{ label (or @symbol) needed for fn } The Appendix is available in the electronic version of this article: https://dx.doi.org/10.3233/JSA-220592.
References
1 | Arkes, J. , and Martinez, J. , (2011) , Finally, evidence for a momentum effect in the NBA, Journal of Quantitative Analysis in Sports 7: (3). |
2 | Arthur, R. , and Matthews, G. , 2017, Baseball’s hot hand is real. FiveThirtyEight. Retrieved from https://fivethirtyeight.com/features/baseballs-hot-hand-is-real |
3 | Assis, N. , Assuncão, R. , and Vaz-de-Melo, P. O. S. , (2020) , Stop the clock: Are timeout effects real?Ghent, Belgium, Proceedings of the European Conference, ECML PKDD: Machine Learning and Knowledge Discovery in Databases, Applied Data Science and Demo Track. 2020. |
4 | Avugos, S. , Köppen, J. , Czienskowski, U. , Raab, M. , and Bar-Eli, M. , (2013) , The “hot hand” reconsidered: A meta-analytic approach, Psychology of Sport and Exercise 14: (1), 21–27. |
5 | Bar-Eli, M. , Avugos, S. , and Raab, M. , (2006) , Twenty years of “hot hand” research: Review and critique, Psychology of Sport and Exercise 7: (6), 525–553. |
6 | Barnwell, B. , 2013, Nomentum, Part 1. Grantland. Retrieved from https://grantland.com/features/bill-barnwell-theory-momentum-football/ |
7 | BigDataBall, 2020, NBAstuffer. Retrieved from https://www.bigdataball.com/ |
8 | Bocskocsky, A. , Ezekowitz, J. , and Stein, C. , 2014, The hot hand: A new approach to an old “Fallacy.” MIT Sloan Sports Analytics Conference, Massachusetts Institute of Technology, Hynes Convention Center, Boston. |
9 | Burke, B. , 2019, Fourth-down decisions changed for good 10 years ago: How the Patriots innovated. ESPN. Retrieved from https://www.espn.com/nfl/story/_/id/28073660/fourth-decisions-changed-good-10-years-ago-how-patriots-innovated |
10 | Camerer, C. F. , (1989) , Does the basketball market believe in the “hot hand”? American Economic Review 79: (5), 1257–1261. |
11 | Cornelius, A. , Silva, J. M. , Conroy, D. E. , and Petersen, G. , (1997) , The projected performance model: Relating cognitive and performance antecedents of psychological momentum, Perceptual and Motor Skills 84: (2), 475–485. |
12 | Cramer, D. , (1977) , Do clutch hitters exist? Baseball Research Journal 6: . |
13 | Csapo, P. , Avugos, S. , Raab, M. , and Bar-Eli, M. , (2015) , The effect of perceived streakiness on the shot-taking behaviour of basketball players, European Journal of Sport Science 15: (7), 647–654. |
14 | Den Hartigh, J. R. , and Gernigon, C. , (2018) , Time-out! How psychological momentum builds up and breaks down in table tennis, Journal of Sports Sciences 36: (23), 2732–2737. |
15 | Duke, A. , and Corlett, J. , (1992) , Factors affecting university women’s basketball coaches’ timeout decisions, Canadian Journal of Sport Science 17: (4), 333–337. |
16 | Fry, M. J. , and Shukairy, F. A. , (2012) , Searching for momentum in the NFL, Journal of Quantitative Analysis in Sports 8: (1). |
17 | Gibbs, C. P. , Elmore, R. , and Fosdick, B. K. , (2022) , The causal effect of a timeout at stopping an opposing run in the NBA, Annals of Applied Statistics 16: (3), 1359–1379. |
18 | Gilovich, T. , Vallone, R. , and Tversky, A. , (1985) , The hot hand in basketball: On the misperception of random sequences, Cognitive Psychology 17: (3), 295–314. |
19 | Ho, D. E. , Imai, K. , King, G. , Stuart, E. A. , (2011) , MatchIt: Nonparametric Preprocessing for Parametric Causal Inference, Journal of Statistical Software 42: (8), 1–28 10.18637/jss.v042.i08. |
20 | Hlavac, Marek . , 2018, stargazer: Well-Formatted Regression and Summary Statistics Tables. R package version 5.2.1. https://CRAN.R-project.org/package=stargazer |
21 | Imbens, G. W. , and Rubin, D. B. , (2015) , Causal Inference for Statistics, Social, and Biomedical Sciences. Cambridge University Press. |
22 | James, B. , (2004) , Underestimating the fog, Baseball Research Journal (33). |
23 | Kahneman, D. , 2011. Thinking Fast and Slow. Doubleday. |
24 | Koehler, J. , and Conley, C. , (2003) , The “hot hand” myth in professional basketball, Journal of Sport & Exercise Psychology 25: , 253–260. |
25 | Lantis, R. , and Neeson, E. , 2021a, The hot hand in the NBA 3-point contest: The importance of location, location, location. National Bureau of Economic Research, working paper No. 29468. Retrieved from https://www.nber.org/papers/w29468. |
26 | Lantis, R. , and Neeson, E. , (2021) b, Hot shots: An analysis of the “hot hand” in NBA field goal and free throw shooting, Journal of Sports Economics 22: (6), 639–677. |
27 | Lawless, J. F. , (1987) , Negative binomial and mixed Poisson regression, Canadian Journal of Statistics 15: (3), 209–225. |
28 | Lewis, M. , 2004, Moneyball: The Art of Winning an Unfair Game. W. W. Norton. |
29 | Lindbergh, B. , 2013, The tragedy of Derek Jeter’s defense. Grantland. Retrieved from https://grantland.com/features/the-tragedy-derek-jeter-defense/ |
30 | Mews, S. , and Ötting, M. , 2021, Continuous-time state-space modelling of the hot hand in basketball, Advances in Statistical Analysis |
31 | Miller, J. , and Sanjuro, A. , (2018) a, Surprised by the gambler’s and hot hand fallacies? A truth in the law of small numbers, Econometrica 86: (6), 2019–2047. |
32 | Miller, J. , and Sanjuro, A. , 2018b, Momentum isn’t magic—vindicating the hot hand with the mathematics of streaks, Scientific American. |
33 | Morgulev, E. , Azar, O. H. , and Bar-Eli, M. , (2019) , Does a “comeback” create momentum in overtime? Analysis of NBA tied games, Journal of Economic Psychology 75: , 102–126. |
34 | Morgulev, E. , Voslinsky, A. , Azar, O. H. , and Bar-Eli, M. , (2020) , Biased perceptions about momentum: Do comeback teams have higher chances to win in basketball overtimes? Judgment and Decision Making 15: (4), 545–560. |
35 | Munoz, E. , Chen, J. , and Thomas, M. , 2019, Momentum in repeated competition: Exploiting the fine line between winning and losing. Retrieved from https://ssrn.com/abstract=3391748 |
36 | National Basketball Association, 2016, Official Rules of the National Basketball Association, 2016-2017. Retrieved from https://ak-static-int.nba.com/wp-content/uploads/sites/3/2016/11/2016-2017-Rule-Book.pdf. |
37 | Permutt, S. , 2011, The efficacy of momentum-stopping timeouts on short-term performance in the National Basketball Association. Thesis, Bryn Mawr College. Retrieved from https://scholarshitricolib.brynmawr.edu/bitstream/handle/10066/6918/2011PermuttS_thesis.pdf?sequence=2. |
38 | Price, K. , Cai, H. , Shen, W. , and Hu, G. , 2022, How much does home field advantage matter in soccer games? A causal inference approach for English Premier League analysis. arXiv. Retrieved from https://arxiv.org/abs/2205.07193. |
39 | Ritzwoller, D. M. , Romano, J. P. , 2021, Uncertainty in the hot hand fallacy: Detecting streaky alternatives to random Bernoulli sequences. arXiv. Retrieved from https://arxiv.org/abs/1908.01406 |
40 | Roane, H. S. , Kelley, M. E. , Trosclair, N. M. , and Hauer, L. S. , (2004) , Behavioral momentum in sports: A partial replication with women’s basketball, Journal of Applied Behavioral Analysis 37: , 385–390. |
41 | Rosenbaum, P. R. , and Rubin, D. B. , (1983) , The central role of the propensity score in observational studies for causal effects, Biometrika 70: (1), 41–55. |
42 | Saavedra, S. , Mukherjee, S. , and Bagrow, J. P. , (2012) , Is coaching experience associated with effective use of timeouts in basketball? Scientific Reports 2: (1), 676. |
43 | Schilling, M. , 2019, Is basketball a game of runs? arXiv. Retrieved from https://arxiv.org/abs/1903.08716 |
44 | Shaw, J. M. , Dzewaltowski, D. A. , and McElroy, M. , (1992) , Self-efficacy and causal attributions as mediators of perceptions of psychological momentum, Journal of Sport and Exercise Psychology 14: (2), 134–147. |
45 | Silva, J. M. , Cornelius, A. E. , and Finch, L. M. , (1992) , Psychological momentum and skill performance: A laboratory study, Journal of Sport and Exercise Psychology 14: (2), 119–133. |
46 | Taylor, J. , and Demick, A. , (1994) , A multidimensional model of momentum in sports, Journal of Applied Sport Psychology 6: , 51–70. |
47 | Vergin, R. C. , (2000) , Winning streaks in sports and the misperception of momentum, Journal of Sport Behavior 23: (2), 181–197. |
48 | Weinbach, J. , 2008, The art of the timeout, Wall Street Journal. Retrieved from https://www.wsj.com/articles/SB120846936079424371 |
49 | Wetzels, R. , Tutschkow, D. , Dolan, C. , var der Sluis, S. , Dutilh, G. , and Wagenmakers, E. , (2016) , A Bayesian test for the hot hand phenomenon, Journal of Mathematical Psychology 72: , 200–209. |
50 | Yam, D. R. , and Lopez, M. J. , (2019) , What was lost? A causal estimate of fourth down behavior in the National Football League, Journal of Sports Analytics 5: (3), 153–167. |
51 | Yousuf, S. , 2018, Rick Carlisle is one of the NBA’s best tacticians. How does he choose when to call a timeout? The Athletic, Retrieved from https://theathletic.com/723304/2018/12/19/rick-carlisle-is-one-of-the-nbas-best-taciticians-how-does-he-choose-when-to-call-a-timeout-its-not-a-simple-answer. |
Notes
1 For details on propensity score matching, see Rosenbaum and Rubin (1983). For details on implementation, see R’s MatchIt package (Imai, 2011). As a robustness check, we also use nonparametric distance measures (Mahalanobis) for matching. These are addressed in Table A2 in Appendix A and are substantively identical to the primary approach.


