
What a fairer 24 team UEFA Euro could look like
Abstract
In 2016, for the first time, the UEFA European Championship gathered 24 men’s national teams. It consisted of a group stage made of 6 groups of 4, followed by a knockout stage starting with the round of 16. We critically examine a number of flaws in the design of the knockout bracket that was used by UEFA: group advantage, lack of win incentive, and arbitrary choices. We suggest two fairer procedures that satisfy the balance and group diversity constraints but eliminate group advantage and significantly increase win incentive, hence interest, in the group stage. The suggested procedures use a global ranking of the 16 teams qualified to the knockout stage based on their performance during the group stage. They apply to any tournament consisting of a round robin stage made of 6 groups of 4, followed by a knockout stage. UEFA has decided to keep the 2016 format for Euro 2020, but has used our work to modify the knockout bracket so as to minimize group advantage.
1Introduction
In 2016, for the first time, the UEFA European Championship, commonly referred to as UEFA Euro, or simply Euro, gathered 24 men’s national teams. It consisted of a group stage, followed by a knockout stage starting with the round of 16.
The simplest symmetrical structure that achieves this consists of dividing the 24 teams into 4 groups of 6, with the best 4 teams of each group qualifying to a symmetrical knockout stage, where group winners play fourth-placed teams and group runners-up play third-placed teams. However, each group of 6 involves 15 matches (5 match days, and 3 games per match day), so 4 groups of 6 would involve 60 matches. Assuming a 3 games per day schedule, teams would play every fourth day, and the group stage itself would last 3 weeks. Adding the knockout stage, the tournament would last 5.5 weeks, which is longer than, for instance, the 32 team FIFA World Cup, and does not fit in the international calendar. Probably for this reason, UEFA has ruled that, instead, the group stage would consist of 6 groups of 4. Each group of 4 involves 6 matches (3 match days, and 2 games per match day), so in this format the group stage has a total of 36 matches and can be completed in 12 days. The 6 groups are drawn randomly: 4 pots of 6 teams are built, based on the UEFA national teams coefficient, with Pot 1 containing the 6 highest ranked teams and Pot 4 the 6 lowest ranked ones, and each group is made of one team randomly drawn from each pot.
However, using a number of groups that is not a power of 2 induces some complication and asymmetry. Since 16 teams must advance to the knockout stage, ideally 16/6 teams per group should advance, which of course is impossible. UEFA has ruled that the 6 group winners and the 6 runners-up would advance, as well as the 4 best third-placed teams. In order to rank the 6 third-placed teams, UEFA considered in order: number of points obtained; goal difference; number of goals scored; fair play conduct in the final tournament; position in the UEFA national team coefficient rankings (see UEFA Euro 2016 regulations (2013), article 18.03).
Because of this asymmetry, it is not obvious to devise a fair, balanced knockout bracket. Reproducing exactly what FIFA did for the 1986, 1990, and 1994 World Cups,1 UEFA chose for the Euro 2016 the bracket reported in Fig. 1. The 6 groups are labeled A to F. 1C denotes the winner of Group C, 2F denotes the runner-up of Group F, etc. 3B/E/F means that the third-placed team in that position can only come from Groups B, E, or F. Article 17.03 in the official UEFA Euro 2016 regulations (2013) describes the third-placed teams allocation mechanism. We have reproduced it in Table 1.
Fig.1
Bracket of the knockout stage of the UEFA Euro 2016.
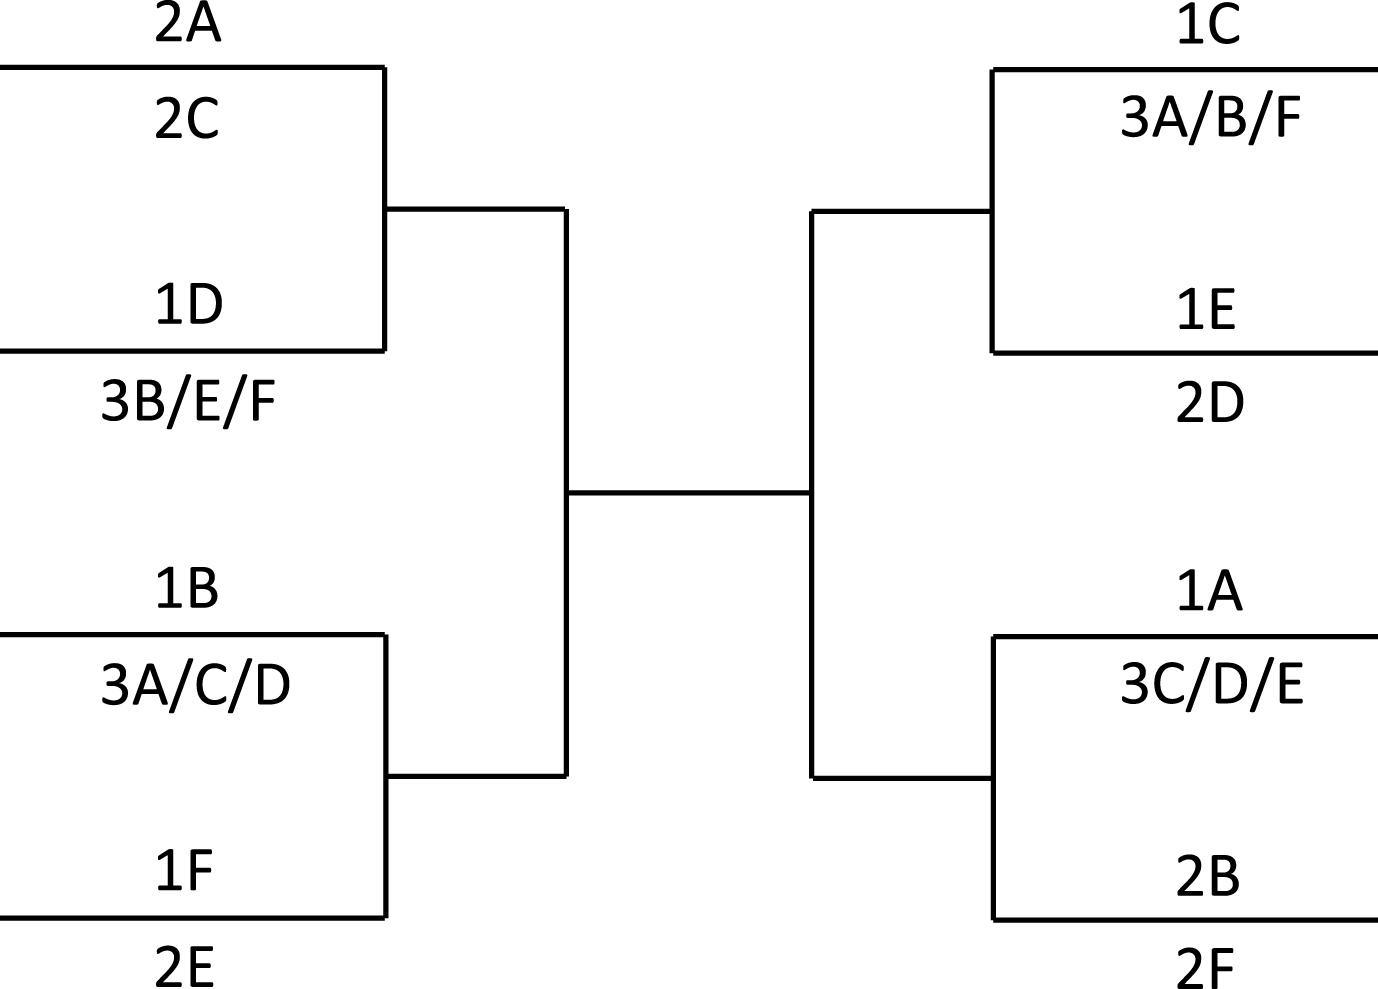
Table 1
Third-placed teams allocation mechanism
| 4 best placed teams | Official rule | All admissible alternative rules | ||||||
| 1A vs | 1B vs | 1C vs | 1D vs | 1A vs | 1B vs | 1C vs | 1D vs | |
| ABCD | 3C | 3D | 3A | 3B | 3D | 3C | 3A | 3B |
| ABCE | 3C | 3A | 3B | 3E | 3E | 3C | 3A | 3B |
| ABCF | 3C | 3A | 3B | 3F | 3C | 3A | 3F | 3B |
| ABDE | 3D | 3A | 3B | 3E | 3E | 3D | 3A | 3B |
| ABDF | 3D | 3A | 3B | 3F | 3D | 3A | 3F | 3B |
| ABEF | 3E | 3A | 3B | 3F | 3E | 3A | 3F | 3B |
| ACDE | 3C | 3D | 3A | 3E | 3D | 3C | 3A | 3E |
| ACDF | 3C | 3D | 3A | 3F | 3D | 3C | 3A | 3F |
| ACEF | 3C | 3A | 3F | 3E | 3E | 3C | 3A | 3F |
| ADEF | 3D | 3A | 3F | 3E | 3E | 3D | 3A | 3F |
| BCDE | 3C | 3D | 3B | 3E | 3D | 3C | 3B | 3E |
| BCDF | 3C | 3D | 3B | 3F | 3C/D/D | 3D/C/C | 3F/B/F | 3B/F/B |
| BCEF | 3E | 3C | 3B | 3F | 3E | 3C | 3F | 3B |
| BDEF | 3E | 3D | 3B | 3F | 3E | 3D | 3F | 3B |
| CDEF | 3C | 3D | 3F | 3E | 3D | 3C | 3F | 3E |
Such bracket has strengths and flaws. Strengths include:
• Balance: Each half of the bracket has 3 group winners, 3 runners-up, and 2 third-placed teams. Moreover, each quarter of the bracket has 1 third-placed team, and either 2 group winners and 1 runner-up, or 1 group winner and 2 runners-up. Besides, third-placed teams play against group winners in the round of 16.
• Group diversity: In each half of the bracket, the 3 group winners and the 3 runners-up come from the 6 different groups. Moreover, in each quarter of the bracket, the 4 teams come from 4 different groups. This is what motivates the third-placed teams allocation mechanism. For instance, the third-placed team in the top left quarter of the bracket can only come from Groups B, E, or F as the three other teams come from Groups A, C, and D. Together these two features ensure that the winner and the runner-up of any given group can only meet again in the final, and that any two teams from any given group cannot meet again earlier than in the semifinals. Group diversity minimizes the probability of repeated matchups during the tournament.
Remark 1. Given that 3 teams from the same group can reach the semifinals, one cannot prevent teams from the same group to meet again in semifinals. Therefore, for knockout tournaments with predetermined bracket routes, the above group diversity condition is the strongest that can be achieved. When the knockout matchups are determined before each round, e.g., by draw, then a stronger group diversity condition can be achieved that prevents 2 teams from the same group to meet in semifinals if no group qualifies 3 teams in semifinals. In that case, if two semifinalists come from the same group, they would automatically be put in two different semifinals.
Flaws include:
• Group advantage: In order to advance as far as possible in the tournament, it is an advantage/disadvantage to be drawn into some groups. For instance, it is a clear advantage to be drawn into Group A, and a clear disadvantage to be drawn into Group E. We will investigate group advantage in detail in Section 2.1. The fact that France was automatically placed into advantageous Group A has raised criticism, see Guyon (2015), McGeady (2015), Wolsing (2015).
• Arbitrariness: The bracket involves arbitrary choices, such as deciding which group winners will play against third-placed teams, or which runners-up will play against group winners, in the round of 16. There is also some arbitrary choices hidden in the third-placed teams allocation mechanism: As reported in Table 1, whatever the 4 groups qualifying their third-placed teams, there always exists at least two admissible allocations, i.e., allocations that satisfy the group diversity constraint (the fact that in each quarter of the bracket, the 4 teams come from 4 different groups). Actually, there always exists exactly two admissible allocations, except if the 4 best third-placed teams come from Groups B, C, D, and F, in which case there exists four of them. In Section 2.2 we will quantify how much of group advantage comes from the arbitrary global structure of the bracket, and how much comes from the arbitrary placement of third-placed teams.
• Lack of win incentive: For some groups, it is unclear whether it is better to finish first or second, or, when the qualification of the third-placed team is secured, whether it is better to finish second or third. We will investigate and quantify lack of win incentive in Section 2.3.
In this article, we first investigate the flaws of the UEFA Euro 2016 bracket into detail (Section 2). Then, in Section 3, keeping the current group stage format intact (6 groups of 4), we suggest two new, fairer brackets in which balance and group diversity are guaranteed, group advantage and arbitrary choices are eliminated, and win incentive is significantly increased. The new brackets use a ranking (from 1 to 16) of the 16 qualified teams, based on group stage performance.
Remark 2. In practice, during the tournament, a team may prefer to play against Team 1 rather than Team 2 even if Team 1 was ranked higher than Team 2 in their respective groups, for instance if Team 2 is a soccer powerhouse, or if its average strength over the recent years is considered larger than that of Team 1. Also, a team may not find it advantageous to be drawn in Group A when it knows that the draw has already placed teams regarded as strong in this group. However, this article does not consider the point of view of teams during the draw or during the tournament, but the point of view of the governing body that organizes and designs the tournament. The knockout bracket, decided years before the tournament takes place, actually even before the qualification phase starts, can therefore only use group results and rankings, and ignores the names of the actual teams and their known strength.
Several theoretical studies have attempted to find a best seeding and formalize different goals of seeding. Hwang (1982) defines a bracket to be monotone if the probability of winning the tournament increases with team skill. He shows that the canonical knockout bracket (see Fig. 8) is not necessarily monotone and suggests an adaptive reseeding method that he proves to be monotone. Schwenk (2000) suggests three axioms for fair seeding (delayed confrontation, sincerity rewarded, favoritism minimized). He proves that the canonical knockout bracket fails to satisfy the second axiom and suggests avariant that satisfies all three seeding axioms, in which subgroups of teams are randomly shuffled. Vu and Shoham (2011) introduce two alternative criteria for fairness (envy-freeness and order preservation) and investigate several impossibility results. Karpov (2015) develops an axiomatic theory of knockout tournaments, gives axiomatic justification for various seedings methods, suggests two new seeding methods (equal gap seeding and increasing competitive intensity seeding), and provides many useful references. Dagaev and Suzdaltsev (2015) study optimal ways to seed a knockout tournament in order to maximize the overall spectator interest in it, assuming that neutral spectators tend to prefer to watch close and intense matches and matches that involve strong teams.
Numerous statistical and simulation studies aim at comparing tournament designs. Glickman (2008) assumes only partial information about competitors’ relative rankings and develops Bayesian locally-optimal design of adaptive knockout tournaments to maximize the probability that the best team advances to the next round. Recently, Glickman and Hennessy (2016) have extended this approach in order to identify the overall best team in fixed knockout tournament brackets. Other utility functions are also considered. Scarf, Yusof, and Bilbao (2009) propose tournament metrics that can be used to measure the success of a sporting tournament, and describe how these metrics may be evaluated for a particular tournament design. This allows them to compare competing designs, such as round robin, pure knockout and hybrids of these designs. They use the UEFA Champions League (soccer) to illustrate their methodology, while Scarf and Yusof (2011) use the FIFA World Cup Finals (soccer). Annis and Wu (2006) compare potential playoff systems for NCAA I-A football. Other relevant literature includes Adler et al. (2017), Baumann et al. (2010), Edwards (1998), Marchand (2002), Ross and Ghamami (2008). Another recent line of research is concerned with fixing a knockout tournament (Vu et al., 2009; Vassilevska Williams, 2010; Stanton and Vassilevska Williams, 2011; Aziz et al., 2014).
2The flaws of the UEFA Euro 2016 bracket
2.1Group advantage
Group advantage is the fact that, in order to advance as far as possible in the final bracket, there is an advantage/disadvantage of being drawn into some groups. I suggest to quantify group advantage by the following measures:
• The worst case advantage W measures, for a given group, the ease of the most difficult route to winning the tournament, averaged over the winner, runner-up, and third-placed team in the group. For a given group, we first define W1 as the minimum sum of the group ranks of the teams that the group winner must defeat in the knockout stage in order to win the tournament. For instance, for Group A, W1 = 3 +2 + 1 +1 = 7, as the most difficult route for the winner of Group A consists of defeating a third-placed team in the round of 16, a runner-up in the quarterfinals, and group winners in the semifinals and finals (see Fig. 2). W2 is the similar quantity for the group runner-up, e.g., W2 = 2 +1 + 1 +1 = 5 for Group A.
The case of third-placed teams is slightly more complicated, as (a) there is only a
Finally, we define the worst case advantage as the weighted average of W1, W2, and W3:The weight• The average advantage A measures, for a given group, the ease of the average route to winning the tournament, averaged over the winner, runner-up, and third-placed team in the group. The ease of the average route for the group winner, A1, is defined as the average sum of the group ranks of the teams that the group winner must defeat in the knockout stage in order to win the tournament, assuming that each team in the bracket has a 50% chance of advancing to the next round. For instance, for Group A,
A2 and A3 are the similar quantities for the runner-up and the third-placed team. As explained above in the case of the worst case advantage, the calculation of A3 involves an average over the two possible positions of the third-placed team in the bracket if it qualifies. The two corresponding valuesFinally, we define the average advantage as
Fig.2
Group advantage
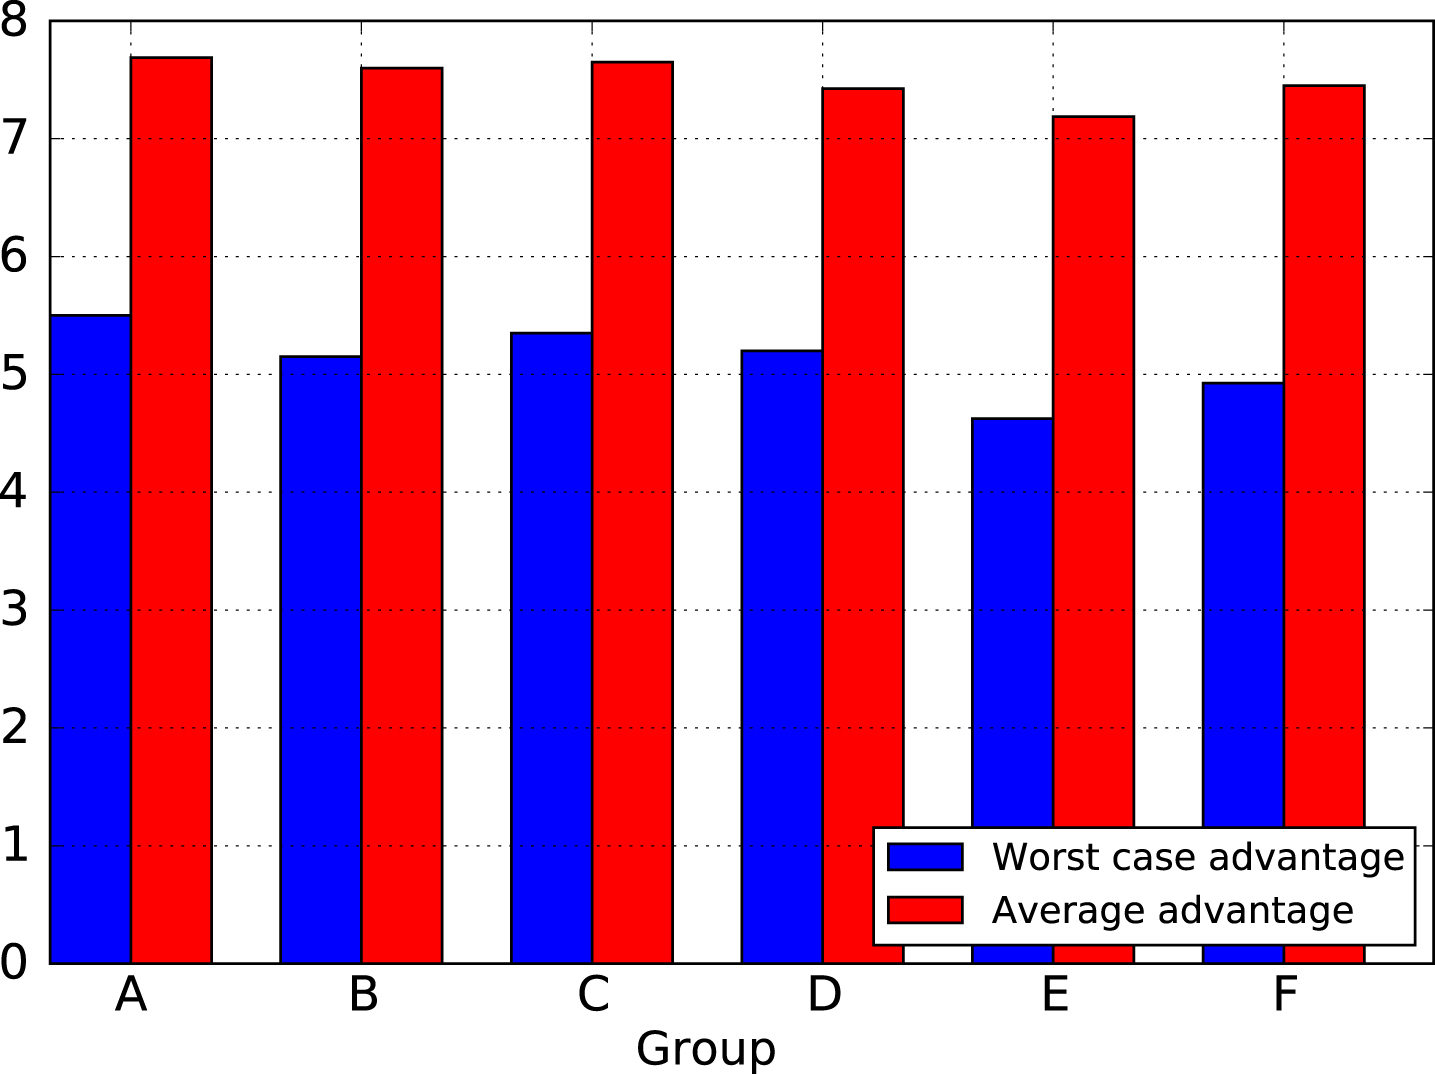
Table 2
Values of the worst case advantage and the average advantage for Groups A to F of the UEFA Euro 2016
| Group | A | B | C | D | E | F |
| W1 | 7 | 6 | 6 | 7 | 5 | 5 |
| W2 | 5 | 5 | 5 | 4 | 4 | 5 |
| W3 (See Table 3) | 4 | 4.1 | 4.9 | 4.3 | 5 | 4.7 |
| W | 5.5 | 5.15 | 5.35 | 5.2 | 4.625 | 4.925 |
|
| 1.375 | 1.2875 | 1.3375 | 1.3 | 1.15625 | 1.23125 |
|
| 4 | 4.5 | 4.5 | 4.5 | 5 | 4.5 |
| W′ | 5.5 | 5.25 | 5.25 | 5.25 | 4.625 | 4.875 |
|
| 1.375 | 1.3125 | 1.3125 | 1.3125 | 1.15625 | 1.21875 |
| A1 | 8.625 | 8.375 | 8.375 | 8.625 | 7.875 | 7.875 |
| A2 | 7.625 | 7.625 | 7.625 | 6.875 | 6.875 | 7.625 |
| A3 (See Table 3) | 6.375 | 6.4 | 6.6 | 6.45 | 6.625 | 6.55 |
| A | 7.6875 | 7.6 | 7.65 | 7.425 | 7.1875 | 7.45 |
|
| 1.921875 | 1.9 | 1.9125 | 1.85625 | 1.796875 | 1.8625 |
|
| 6.375 | 6.5 | 6.5 | 6.5 | 6.625 | 6.5 |
| A′ | 7.6875 | 7.625 | 7.625 | 7.4375 | 7.1875 | 7.4375 |
|
| 1.921875 | 1.90625 | 1.90625 | 1.859375 | 1.796875 | 1.859375 |
Table 3
Values of pl,
| Group | A | B | C | D | E | F |
| Left side opponent of third-placed team | 1B | 1D | 1B | 1B | 1D | 1D |
| pl | 0.7 | 0.1 | 0.1 | 0.7 | 0.7 | 0.7 |
|
| 4 | 5 | 4 | 4 | 5 | 5 |
|
| 6.375 | 6.625 | 6.375 | 6.375 | 6.625 | 6.625 |
| Right side opponent of third-placed team | 1C | 1C | 1A | 1A | 1A | 1C |
| pr | 0.3 | 0.9 | 0.9 | 0.3 | 0.3 | 0.3 |
|
| 4 | 4 | 5 | 5 | 5 | 4 |
|
| 6.375 | 6.375 | 6.625 | 6.625 | 6.625 | 6.375 |
|
| 4 | 4.1 | 4.9 | 4.3 | 5 | 4.7 |
|
| 6.375 | 6.4 | 6.6 | 6.45 | 6.625 | 6.55 |
|
| 0.5 | 0.5 | 0.5 | 0.5 | 0.5 | 0.5 |
|
| 4 | 4.5 | 4.5 | 4.5 | 5 | 4.5 |
|
| 6.375 | 6.5 | 6.5 | 6.5 | 6.625 | 6.5 |
The worst case advantage assumes that the best-ranked team always advances to the next round, while the average advantage assumes that each team in the bracket has a 50% chance of advancing to the next round. Fig. 4 shows the results of the knockout stage of the Euro 2016, and Fig. 5 those of the 1986, 1990, and 1994 World Cups, the only three men’s World Cups that used the same format as Euro 2016.2 Table 4 summarizes some interesting statistics. In particular, it shows that the average advantage is a more realistic measure of group advantage, as globally the best-ranked team advanced to the next round in only 54.3% of the cases. In particular, the empirical probabilities of reaching the semifinals were not a monotonic function of group rank: 33.3% for group winners, 16.7% for runners-up, and 25% for third-placed teams.3.
Fig.3
Worst case advantage and average advantage per team.
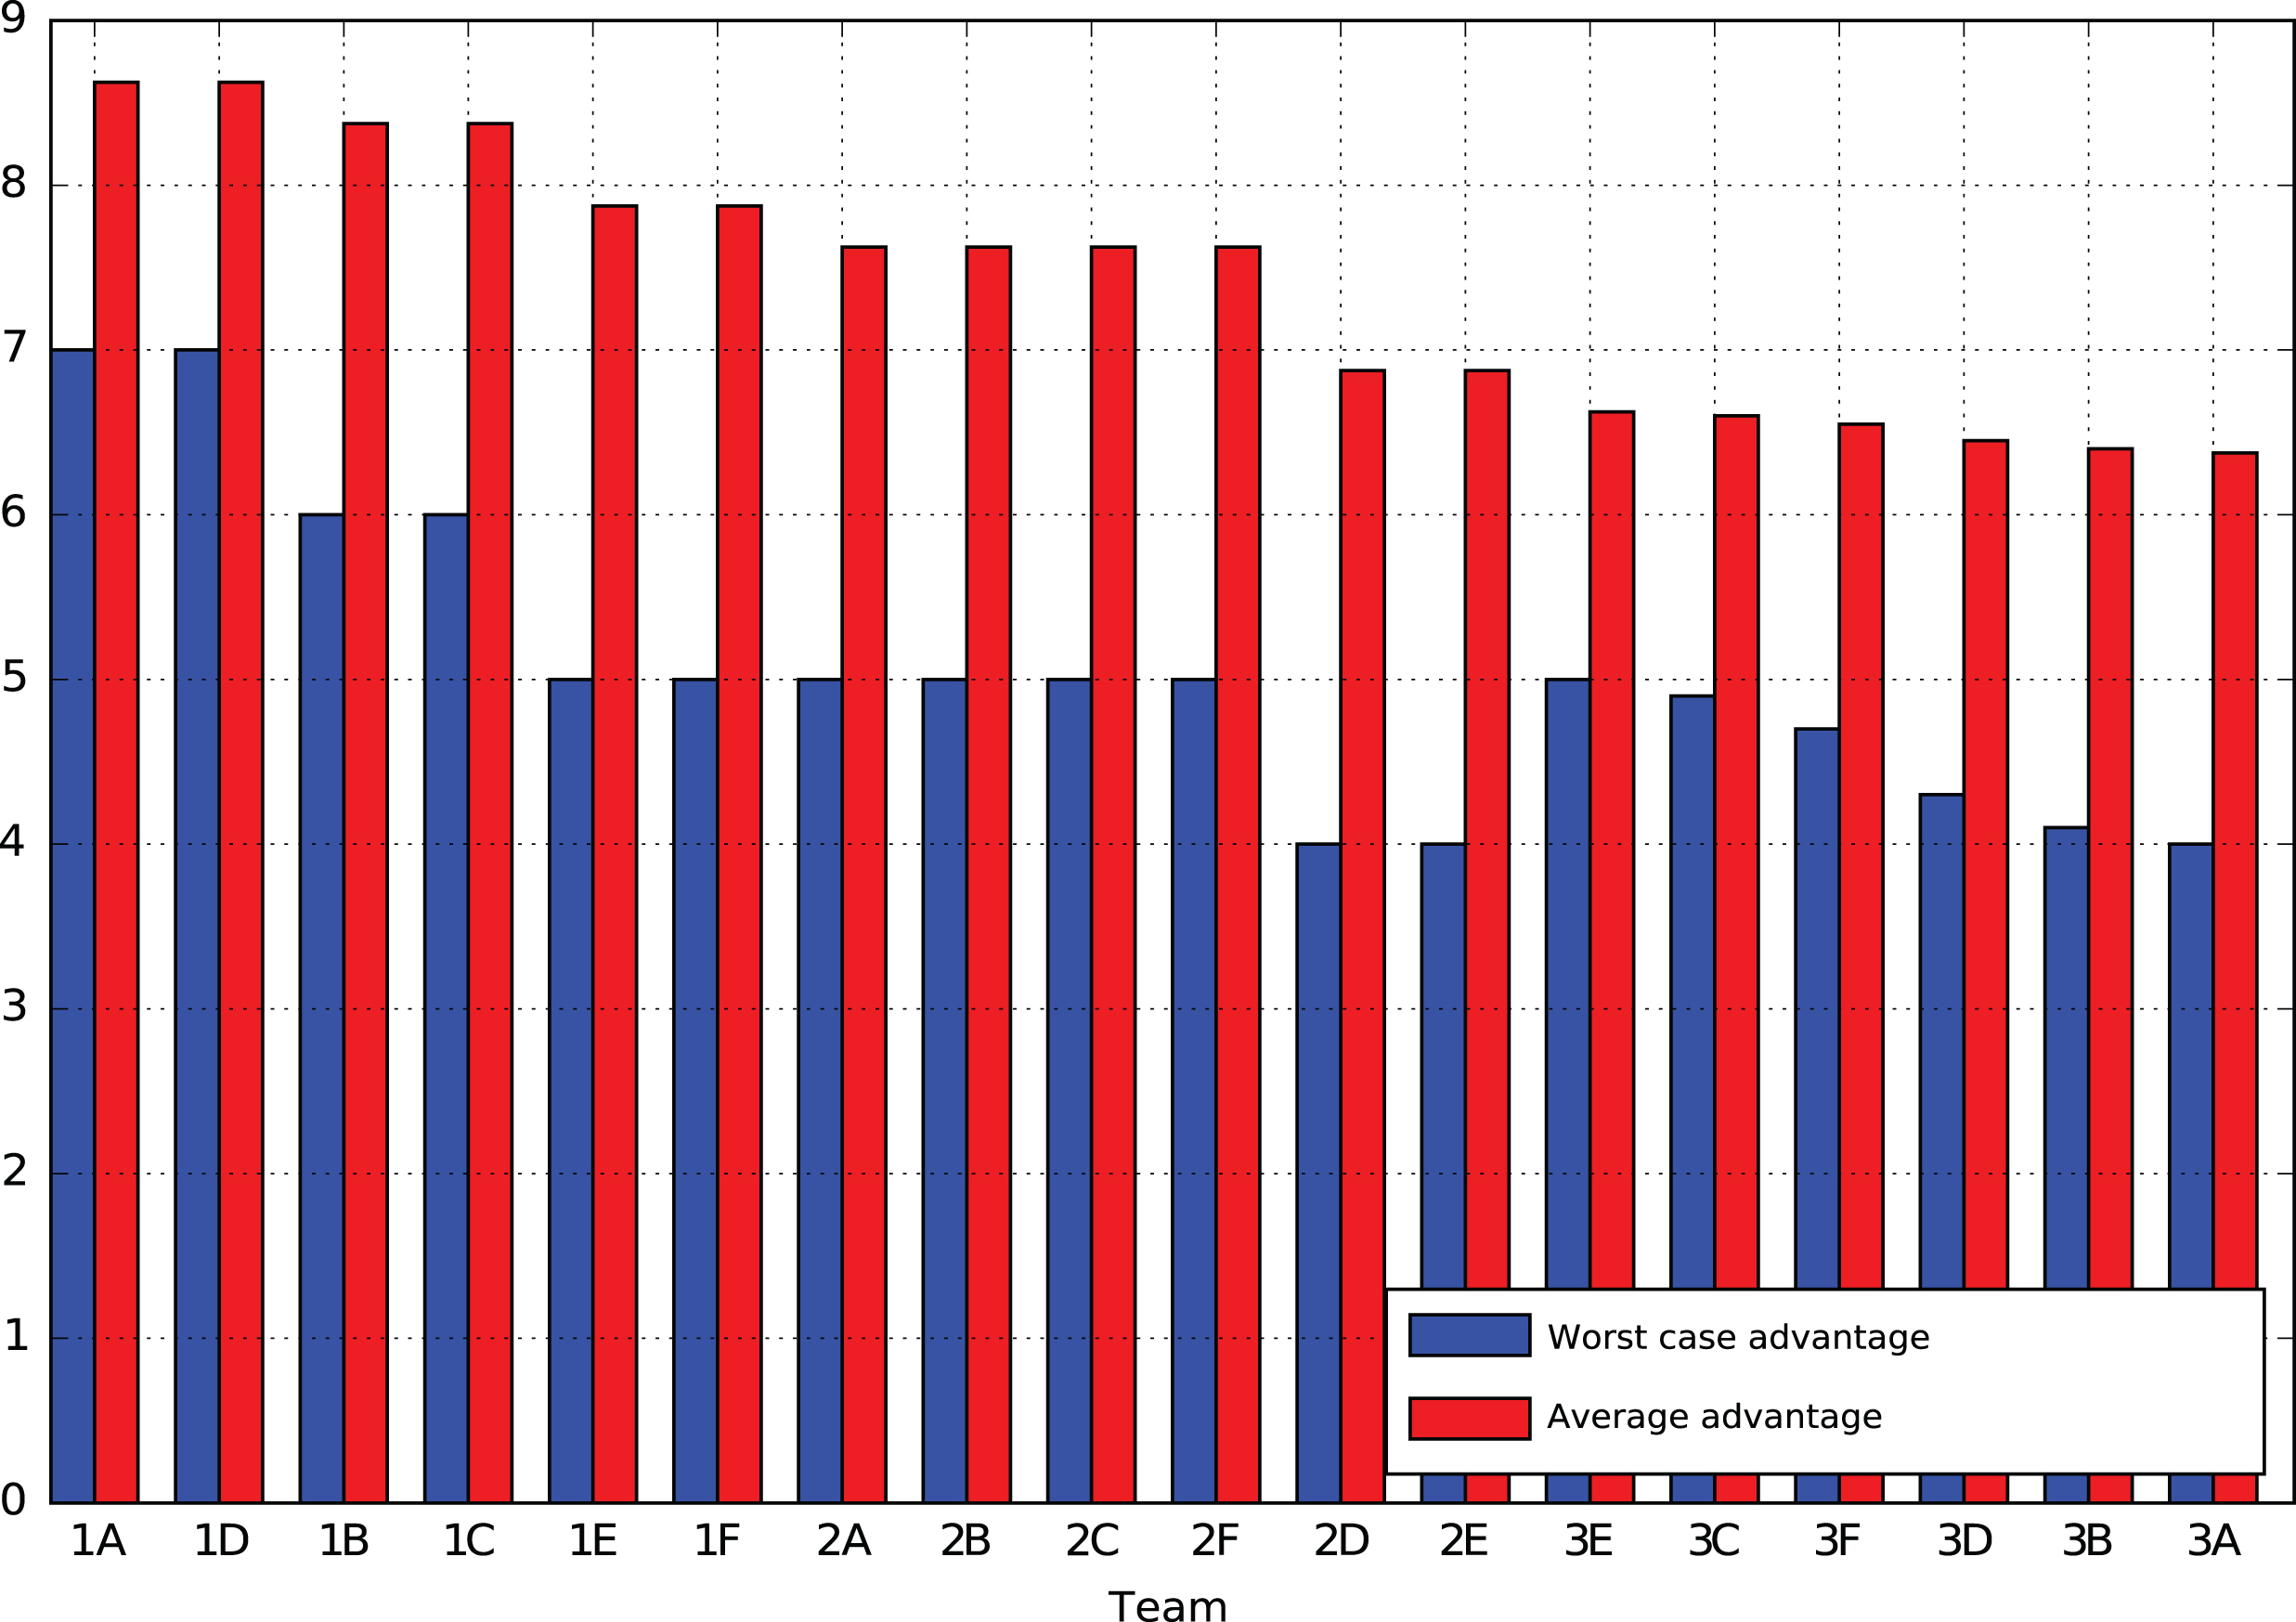
Fig.4
Results of the knockout stage of the UEFA Euro 2016.
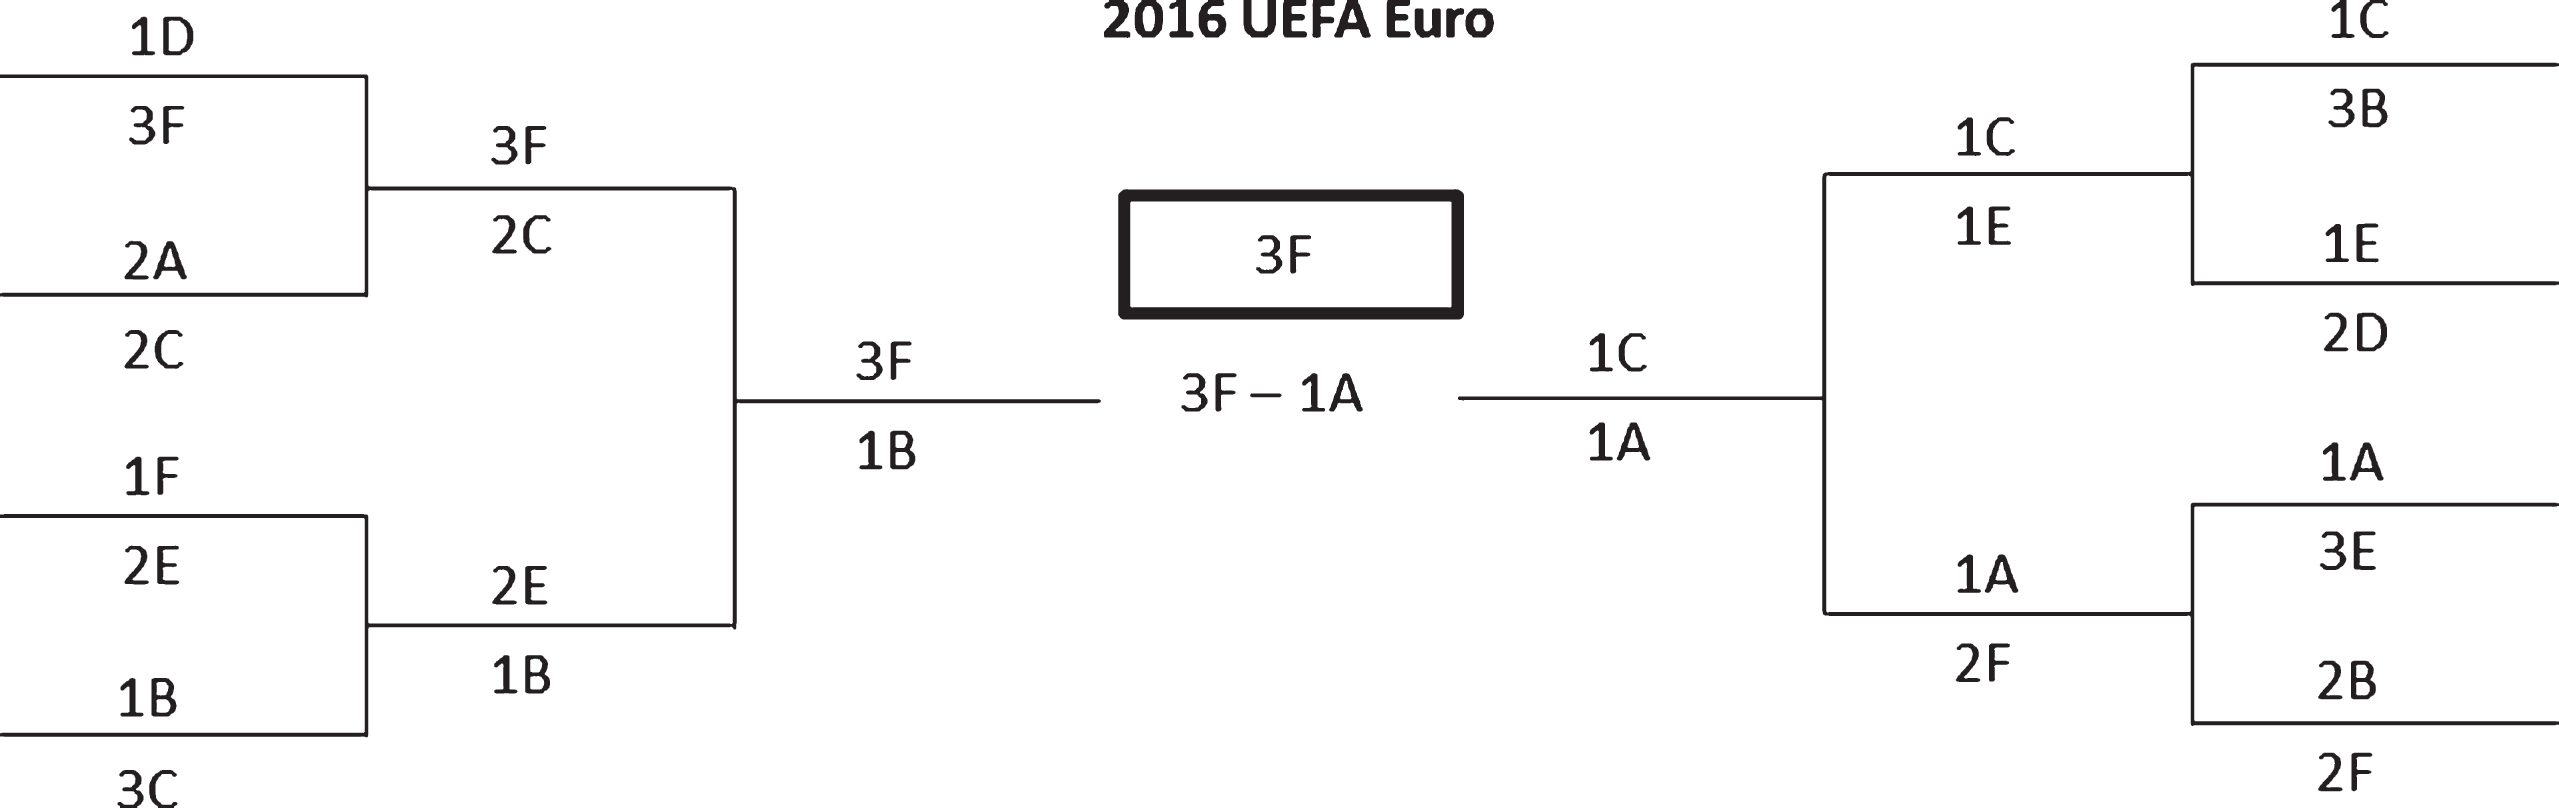
Fig.5
Results of the knockout stages of the 1986, 1990, and 1994 FIFA World Cups.
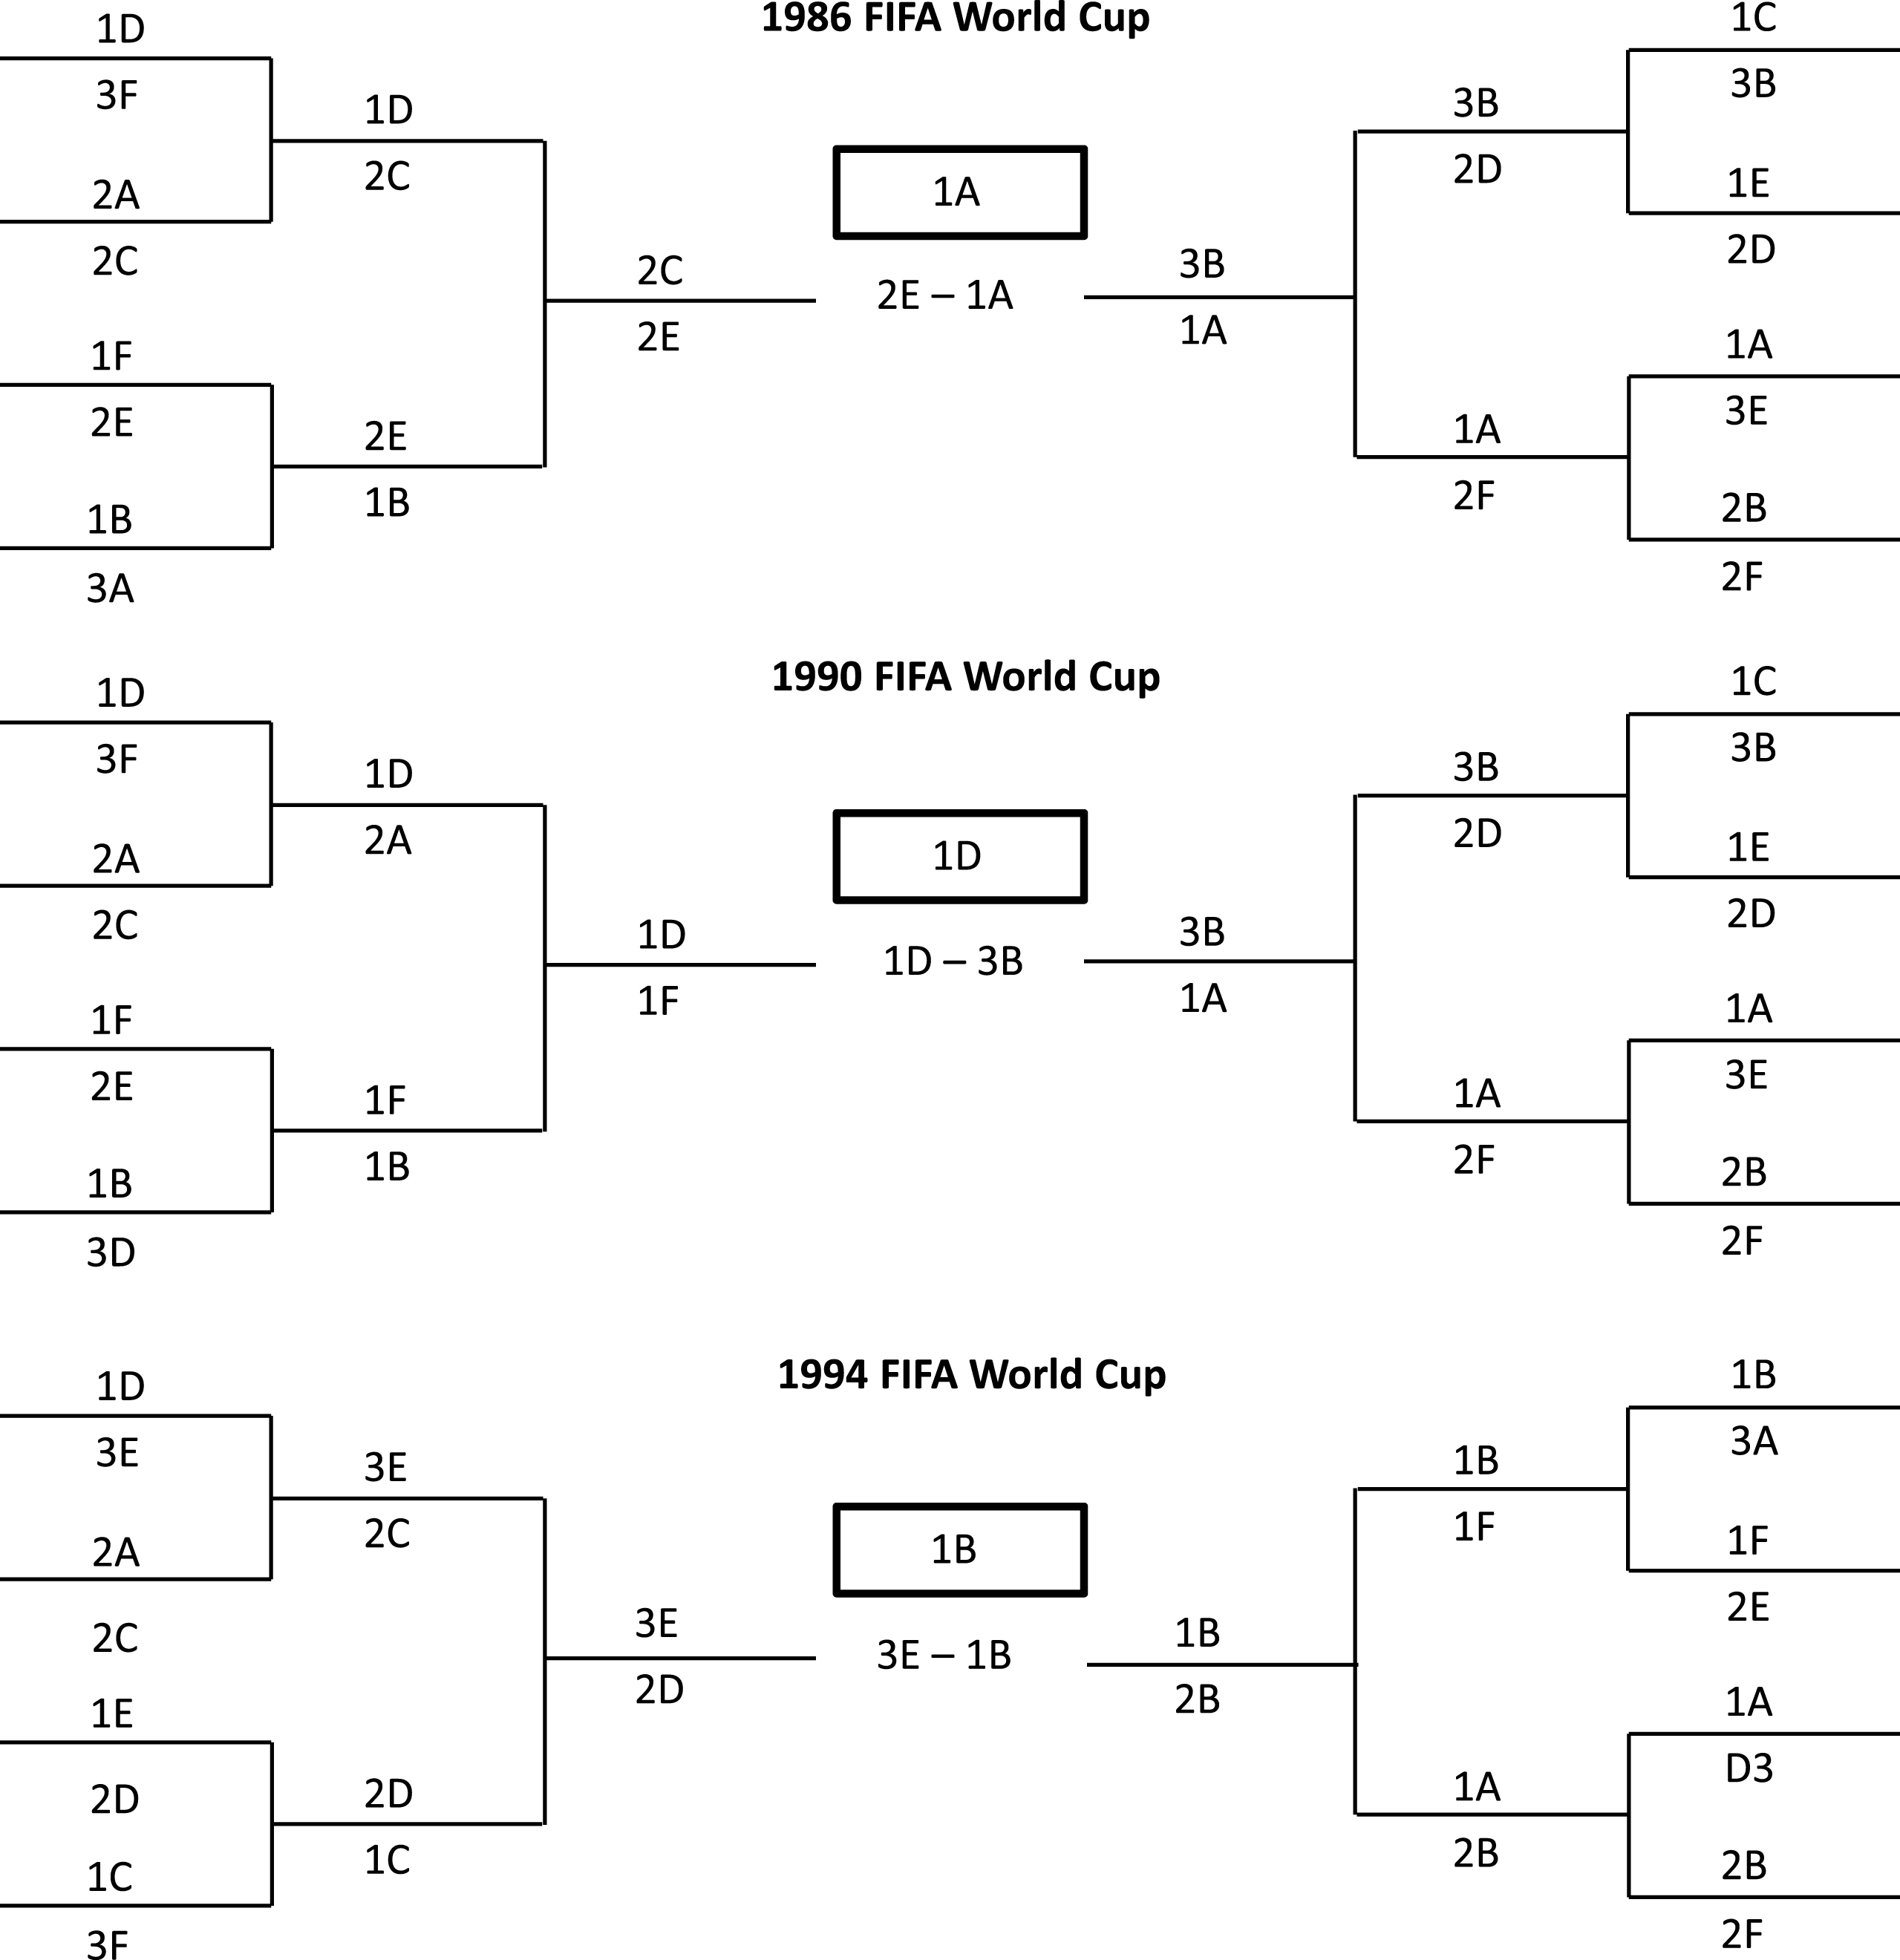
Table 4
Statistics on the knockout stages of the 1986, 1990, and 1994 World Cups and the Euro 2016
| Group ranks of opposing teams | 1-2 | 1-3 | 2-3 | Total |
| Number of games | 19 | 22 | 5 | 46 |
| Best ranked team advances | 10 | 15 | 0 | 25 |
| Ratio | 52.6% | 68.2% | 0% | 54.3% |
| Group rank | 1 | 2 | 3 | Total |
| Number of teams reaching the semifinals | 8 | 4 | 4 | 16 |
| Probability of reaching the semifinals |
|
|
|
|
Remark 3. The W and A metrics contain some arbitrariness. However, since they use the full information that is needed to build the bracket (group ranks), they are likely to be good indicators of group advantage. Including extra information such as points earned, goal difference, opponent strength, etc. would be irrelevant as the bracket ignores them. Note that the average advantage metric mixes two somewhat inconsistent assumptions: that group ranks are good indicators of team strength, and that all teams have a 50% chance of advancing at each knockout round, irrespective of their group rank. The average advantage incorporates these two conflicting facts. That all teams have statistically almost a 50% chance of advancing at each knockout round highlights the importance of luck in soccer.
The worst case advantage W and the average advantage A are given in Table 2 and Fig. 2 for Groups A to F. We have also reported in Table 2 the ‘per round’ quantities
When we look at the team level, the worst case advantage orders teams as follows
• win its group, then it would rather be drawn into Groups A or D, then B or C. It is worth noting that the 3 winners of the 1986, 1990, and 1994 World Cups were teams 1A, 1D, and 1B (even though the fact that Argentina, Germany, and Brazil won the 1986, 1990, and 1994 World Cups is more easily explained by the names of the teams than by their group label).
• be the runner-up of its group, it would rather be drawn into Groups A, B, C, or F.
• be one of the four best third-placed teams, it would rather be drawn into Group E, then C, then F, then D, then B, and finally A.
Note the oddity that, according to the worst case advantage, it is better to be one of the four best third-placed teams from Groups B to F than the runner-up of Group D or E. In the more realistic average advantage, the ordering at team level is consistent with group ranks.
Note that Wolsing (2015) measured group advantage simply by W1 + W2, ignoring the third-placed teams, thus giving only a partial view of it. For instance, it missed the slight advantage given to the third-placed team of Groups E, C, and F, thus exaggerating the global disadvantage of Groups E and F. Third-placed teams should not be disregarded, as the 1986, 1990, and 1994 World Cups and the Euro 2016 all have examples of third-placed teams performing well in the knockout stage: Belgium reaching the semifinals in 1986, Argentina reaching the finals in 1990, Italy reaching the finals in 1994, Portugal winning the Euro 2016 (see also Fig. 5 and Table 4).
2.2Arbitrariness
Two types of arbitrary choices were made when UEFA built the knockout stage:
• the global structure of the bracket, which includes deciding which groups would have their winner play against third-placed teams in the round of 16, which groups would have their runner-up play against group winners, and which group winners cannot play against another group winner before the semifinals,
• the placement of the third-placed teams in the bracket.
2.2.1Arbitrariness of the placement of the third-placed teams in the bracket
The somewhat strange, asymmetric values of the probabilities pl and pr (see Table 3) result from the arbitrary placement of third-placed teams described in the left hand side of Table 1. However, remember that there exists other allocation procedures that respect the group diversity constraint, reported in the right hand side of Table 1. There are 216 = 65, 536 deterministic allocation procedures that respect the group diversity constraint (2 acceptable allocation rules for each of the 15 lines in Table 1, except for the 12th line, for which 4 allocation rules are acceptable). Running a simple computer code shows that among those 65,536 allocation rules, exactly 1,000 are such that pl = pr for all groups.
A symmetric allocation where pl = pr is desirable as it ensures that teams 3B, 3C, 3D, and 3F have a 50% chance of ending in an ‘easy’ quarter of the bracket, i.e., a quarter with 2 runners-up, and a 50% chance of ending up in a ‘tough’ quarter of the bracket, i.e., a quarter with 2 group winners. Team 3A can only end up in a ‘tough’ quarter, while Team 3E can only end up in an ‘easy’ quarter, therefore for these 2 teams the values of pl and pr have no impact on W3 and A3. Once the effect of the asymmetry of the allocation of the third-placed teams has been removed, we can see more clearly the impact of the global structure of the bracket (see Section 2.2.2).
UEFA happens to have arbitrarily picked one of the 64,536 asymmetric rules. Arbitrarily picking one of the 1,000 symmetric rules would already be an improvement, but it would still be an arbitrary choice. A symmetric, non-arbitrary, more natural allocation procedure would be the following: once the 4 best third-placed teams are known, one of the two (or four) admissible allocation rules would be drawn, uniformly. It is easy to check that in this case the new probabilities pl and pr, denoted
where pX is the probability that 3A plays 1B given that the 4 best third-placed teams come fromGroups X.
The new corresponding values of W3, W, A3, and A are denoted with a prime and are also given in Table 2. A comparison of W and W′ (resp. A and A′) is given in Fig. 6. Some symmetry would be restored: Groups B, C, D, and F share the same value of
Fig.6
Comparison of W and W′ (left) and of A and A′ (right).
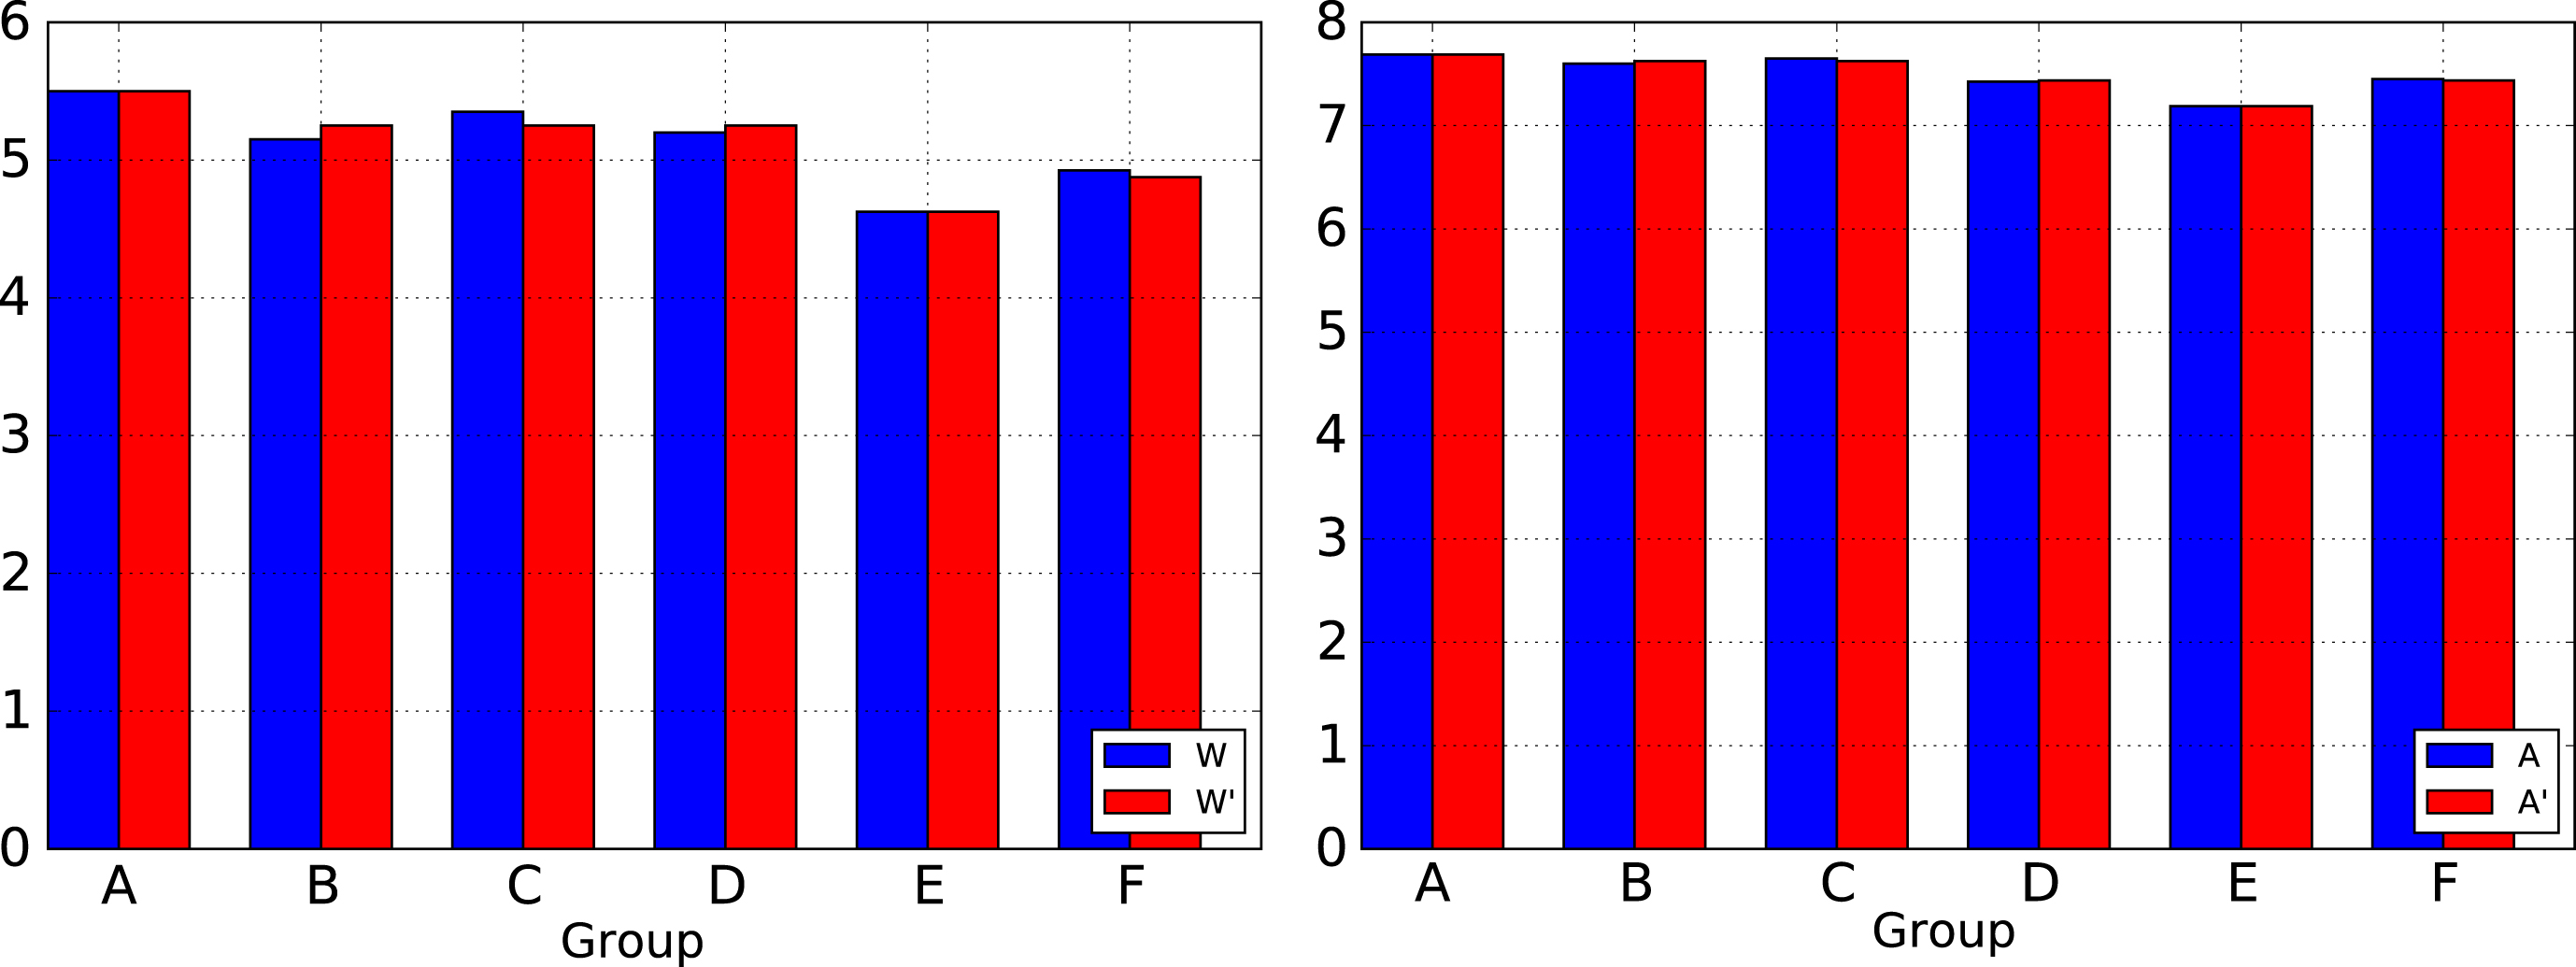
As for the teams ordering, it would be the same as under W and A, except that now we would have 3B = 3C = 3D = 3F. Therefore, the fact that W orders C > D > B, and that A orders C > B and F > D, is only due to the arbitrary allocation of third-placed teams, not to the arbitrary global structure of the bracket. Considering the ‘prime’ version allowed us to disentangle between the arbitrary global structure of the bracket, and the arbitrary allocation of third-placed teams. It will also prove useful when we compare various global bracket structures, as we now show.
2.2.2Arbitrariness of the global structure of the bracket
Let us consider the following three advantages for a given group:
• AdvW3: the winner plays against a third-placed team during the round of 16,
• AdvQF: the winner cannot play against another group winner in quarterfinals,
• AdvRR: the runner-up plays against another runner-up during the round of 16.
Table 5
The five admissible global structures of the bracket. Structure 6 is not admissible since no placement of third-placed teams satisfy the group diversity constraint. The global structure used by UEFA for the Euro 2016 is Structure
| Structure number | 1 | 2 | 3 | 4 | 5 | 6 | ||
| Group | AdvW3 | AdvQF | AdvRR | |||||
| U | ✔ | ✔ | ✔ | ✔ | ✔ | |||
| V | ✔ | ✔ | ✔ | ✔ | ✔ | ✔ | ✔ | |
| W | ✔ | ✔ | ✔ | ✔ | ||||
| X | ✔ | ✔ | ✔ | ✔ | ✔ | ✔ | ||
| Y | ✔ | ✔ | ✔ | ✔ | ✔ | |||
| Z | ✔ | ✔ | ✔ | |||||
There are exactly 5 admissible global structures, which are reported in Table 5. Structure 6 (also reported) is not admissible since no placement of third-placed teams satisfies the group diversity constraint: as proved in the appendix, with Structure 6, we cannot rule out that one quarter of the bracket have two teams from the same group. Structure 6 would become admissible if one slightly relaxed the group diversity constraint by allowing at most one repeated matchup, involving a third-placed team, in quarterfinals.4. The global structure that was used by UEFA for the Euro 2016 is Structure 4, in which 1 group gets the three advantages (Group A), 1 group gets AdvW3 and AdvQF only (Group D), 2 groups get AdvW3 and AdvRR only (Groups B and C), 1 group gets AdvRR only (Group F), and 1 group gets no advantage at all(Group E).
Note that for all admissible global structures of the bracket, at least one group gets all 3 advantages. Note also that Structures 3, 5, and 6 leave no group without advantage. However, this implies a lack of win incentive for both Groups Y and Z, since in those structures both their winner and runner-up would play against a runner-up in the round of 16 (see Section 2.3).
For a given group, the values of the worst case advantages W1, W2, and
Table 6
The worst case advantage W′ and the average advantage A′ for each possible combination of advantages
| Combination of advantages | Euro 2016 group | W′ | A′ |
| AdvW3 + AdvQF + AdvRR | A | 5.5 | 7.6875 |
| AdvW3 + AdvQF | D | 5.25 | 7.4375 |
| AdvW3 + AdvRR | B, C | 5.25 | 7.625 |
| AdvW3 | None | 5 | 7.375 |
| AdvRR | F | 4.875 | 7.4375 |
| No advantage | E | 4.625 | 7.1875 |
Fig. 7 is then derived from Tables 5 and 6. For each global structure of the bracket (from top to bottom: Structure 1 to Structure 6), it shows how the worst case advantage (left) and the average advantage (right) are distributed over the 6 groups. In Table 7 we report the mean, standard deviation, and range of those 12 distributions.
Fig.7
Distribution of the worst case advantage W′ (left) and the average advantage A′ (right) of the 6 groups, for the 6 global structures of the bracket. From top to bottom: Structure 1 to Structure 6. Structure 6 has the smallest standard deviation of group advantage.
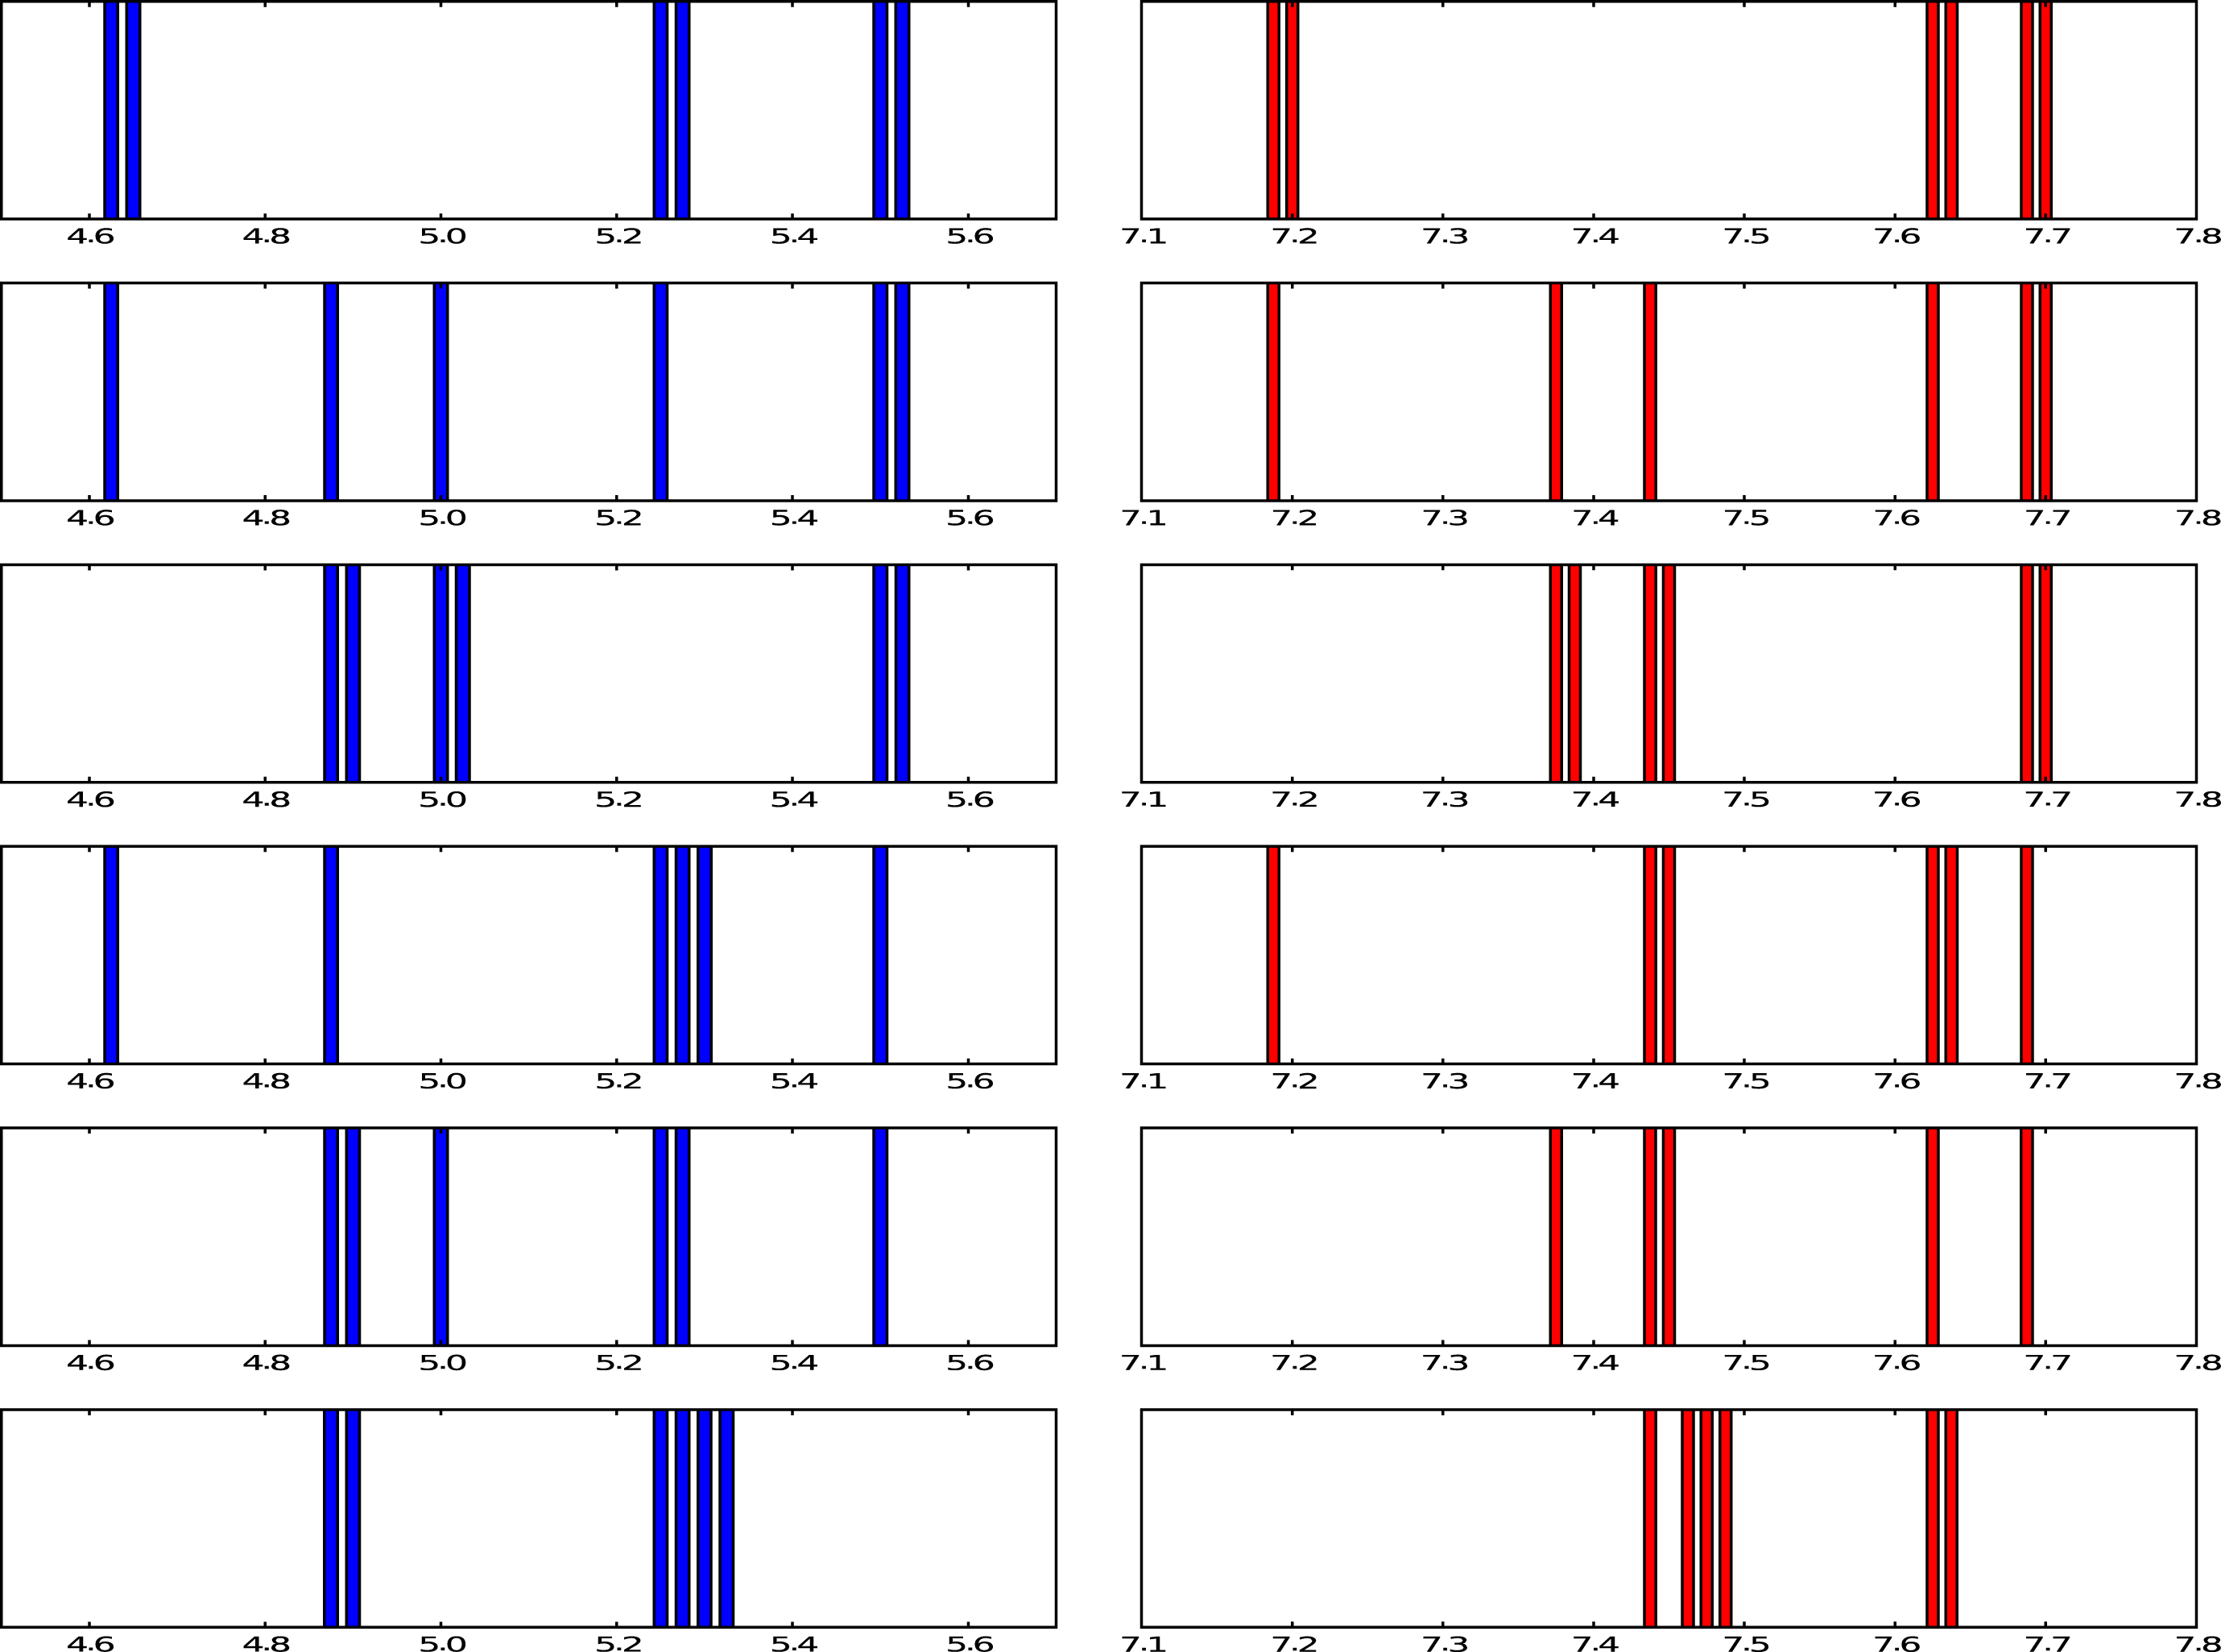
Table 7
Statistics of the worst case and average advantage for each global structure of the bracket. For each global structure of the bracket, mean, standard deviation, and range are taken over the 6 groups. Range denotes maximum value minus minimum value. The global structure used by UEFA for the Euro 2016 is Structure 4
| Structure number | 1 | 2 | 3 | 4 | 5 | 6 | |
| Worst case advantage W′ | Mean | 5.125 | 5.125 | 5.125 | 5.125 | 5.125 | 5.125 |
| Standard deviation | 0.3680 | 0.3227 | 0.2700 | 0.2887 | 0.2282 | 0.1768 | |
| Range | 0.875 | 0.875 | 0.625 | 0.875 | 0.625 | 0.375 | |
| Average advantage A′ | Mean | 7.5 | 7.5 | 7.5 | 7.5 | 7.5 | 7.5 |
| Standard deviation | 0.2224 | 0.1840 | 0.1350 | 0.1693 | 0.1141 | 0.0884 | |
| Range | 0.5 | 0.5 | 0.3125 | 0.5 | 0.3125 | 0.1875 |
Of course, all structures have the same mean. However, standard deviations and ranges vary. A small standard deviation of group advantage is a desirable feature, as it increases fairness by minimizing the impact of group advantage. The global structures that have the smallest standard deviation and range of group advantage (both for worst case and average advantage) are the structures in which the 2 groups that do not benefit from AdvW3 (Groups Y and Z in Table 5) benefit from AdvRR (Structures 3, 5, and 6; Structure 6 yields the smallest standard deviation and range of group advantage). This means that all groups benefit from at least one advantage. However, this raises an issue of win incentive, as we discuss in the next section, since in Groups Y and Z both the winner and the runner-up play against a runner-up in the round of 16.
Conversely, the global structure that does not suffer from this win incentive issue (Structure 1, in which the 4 groups that benefit from AdvRR also benefit from AdvW3) is the structure that has the largest standard deviation of group advantage (both for worst case and average advantage): in this structure 2 groups benefit from the 3 advantages, and 2 groups benefit from none of those. This illustrates that, if one considers only balanced brackets that respect group diversity and are based only on group ranks, one faces a trade-off between minimizing group advantage and maximizing win incentive.
Among the 2 other global structures of the bracket (Structures 2 and 4), Structure 4, the one chosen by FIFA for the 1986, 1990, and 1994 World Cups5 and by UEFA for the Euro 2016, has the smallest standard deviation.
Based on this work, in February 2018, UEFA has adopted Structure 6 for the Euro 2020 (see articles 21.04 and 21.05 in UEFA Euro 2020 regulations (2018)). This means that in 2020 all groups will benefit from at least one advantage and group advantage will be minimized. The small price to pay for this is that for two groups (Groups A and D) both the winner and the runner-up will play against a runner-up in the round of 16, and that there is a 10% chance that one quarterfinal will oppose two teams who were in the same group (see footnote 4).
Finally, when we compare Table 2 with Table 7 (or Fig. 7), we observe that most of the variability in group advantage results from the global structure of the bracket, not from the allocation of third-placed teams.
2.3Lack of win incentive
Lack of win incentive is the fact that, for some groups, it is unclear whether it is better to finish first or second, or, when the qualification of the third-placed team is secured, whether it is better to finish second or third.
For instance, both the winner and the runner-up of Group F will play against a group runner-up in the round of 16 (see Fig. 1), therefore is there a real incentive to win Group F? Group F is the only group such that W1 = W2 (see Table 2), which means that, according to the worst case advantage, it is indifferent to finish first or second in Group F. W1 = W2 is not as bad as W1 < W2, however it is already a sign of bad tournament design. Note that, from Table 2, A1 > A2 for Group F so, according to the average advantage, there is an incentive to win Group F. However, since A1 - A2 is small, this incentive is small too.
This is the situation of groups that benefit from AdvRR but not from AdvW3 (see Section 2.2.2). One can prevent this situation to occur by requiring that the 4 groups that benefit from AdvRR also benefit from AdvW3, but as explained above this yields the global structure of the bracket with maximum variance of group advantage over the 6 groups (Structure 1 in Table 5).
Another interesting case concerns Groups D and E: If they qualify, both the third-placed team and the runner-up of Group D (resp. Group E) will play against a group winner in the round of 16 (see Fig. 1), therefore, if the qualification of the third-placed team is already secured, is there a real incentive to finish second of Group D (resp. Group E), rather than third? For Group E, it seems actually better to be one of the 4 best third-placed teams than to be the runner-up, as in this case the opponent in quarterfinals can only be a group runner-up, not a group winner (see Fig. 1). This is reflected in the fact that, for Group E, W3 > W2. This is actually also true for Group D, as Team 3D, if it qualifies, has a 30% probability to play 1A in the round of 16, in which case it can only play a runner-up in quarterfinals. Note, however, that it is risky to finish third in the group if the qualification of the third-placed team is not secured yet. Note also that A2 > A3 for all groups, so the average advantage indicates that it is always better to finish second than third in the group, however for Groups E and D the quantity A2 - A3, hence the incentive, is small.
3New fairer brackets
In Section 2.2.2 we have proved that group advantage cannot be avoided in a format with predetermined balanced bracket routes that are based only on group ranks and satisfy group diversity. To address this issue, we now suggest two new fairer brackets that use global rankings 1–16 instead of only group ranks, i.e., we will rank the 16 qualified teams from 1 to 16 based on group stage results and build a bracket based on this ranking. Such a rule will not only remove group advantage, it will also increase win incentive. We keep intact the format of the group stage (6 groups of 4), as well as the strengths of the current bracket: balance and group diversity (see Section 1). Of course the suggested procedures work not only for the Euro, but also for any tournament consisting of a round robin stage made of 6 groups of 4, followed by a knockout stage starting with the round of 16.
To prevent group advantage and get rid of arbitrary choices, we suggest that the bracket does not refer to any group in particular. Rather, we would build matchups based on the performance of the teams during the group stage. This means that we would not only rank the third-placed teams, but also the group winners and the runners-up. The same criteria that are used today to rank third-placed teams would be used to also rank group winners and runners-up: number of points obtained; goal difference; number of goals scored; fair play conduct in the final tournament; position in the UEFA national team coefficient rankings (see UEFA Euro 2016 regulations (2013), article 18.03).
Let us denote 1 the best group winner, 2 the second best group winner, and so on until 6, the lowest ranked group winner. Then we denote 7 the best runner-up, 8 the second best runner-up, and so on until 12, the lowest ranked runner-up. Eventually, the four best third-placed teams are denoted, in order, 13, 14, 15, and 16. Table 9 shows what this ranking would have been during the UEFA Euro 2016.
Once the 16 qualified teams have been ordered from 1 to 16, there is a notion of ‘ideal’ or ‘canonical’ bracket, represented in Fig. 8. The ideal bracket satisfies the definition of balance that we gave in Section 1: Each half has 3 group winners, 3 runners-up, and 2 third-placed teams. Moreover, each quarter has 1 third-placed team, and either 2 group winners and 1 runner-up, or 1 group winner and 2 runners-up. Besides, third-placed teams play against group winners in the round of 16. The ideal bracket is actually a perfectly balanced bracket, in the sense that the ranks (from 1 to 16) of any two opponents sum to 17 in the 8 matches of the round of 16, and then, assuming the best ranked team always advances to the next round, the ranks of any two opponents sum to 9 in the 4 quarterfinals, and to 5 in the 2 semifinals. It ensures that teams 1 to 8 cannot meet before the quarterfinals, in which case the quarterfinals are 1-8, 2-7, 3-6, and 4-5; and that teams 1, 2, 3, and 4 cannot meet before the semifinals, in which case the semifinals are 1-4 and 2-3. Not only is this bracket perfectly balanced, it is also free of group advantage, by construction, as the label (A to F) of the group has absolutely no impact on the way the bracket is built, and it also guarantees win incentive, as the more a team wins during the group stage, the weaker its opponents in the knockout stage will be (based on group stage results), and the higher the probability is that it goes far in the tournament.
Fig.8
Ideal bracket, when teams have been ranked from 1 (the best group winner) to 16 (the fourth best third-placed team) after the group stage is over.
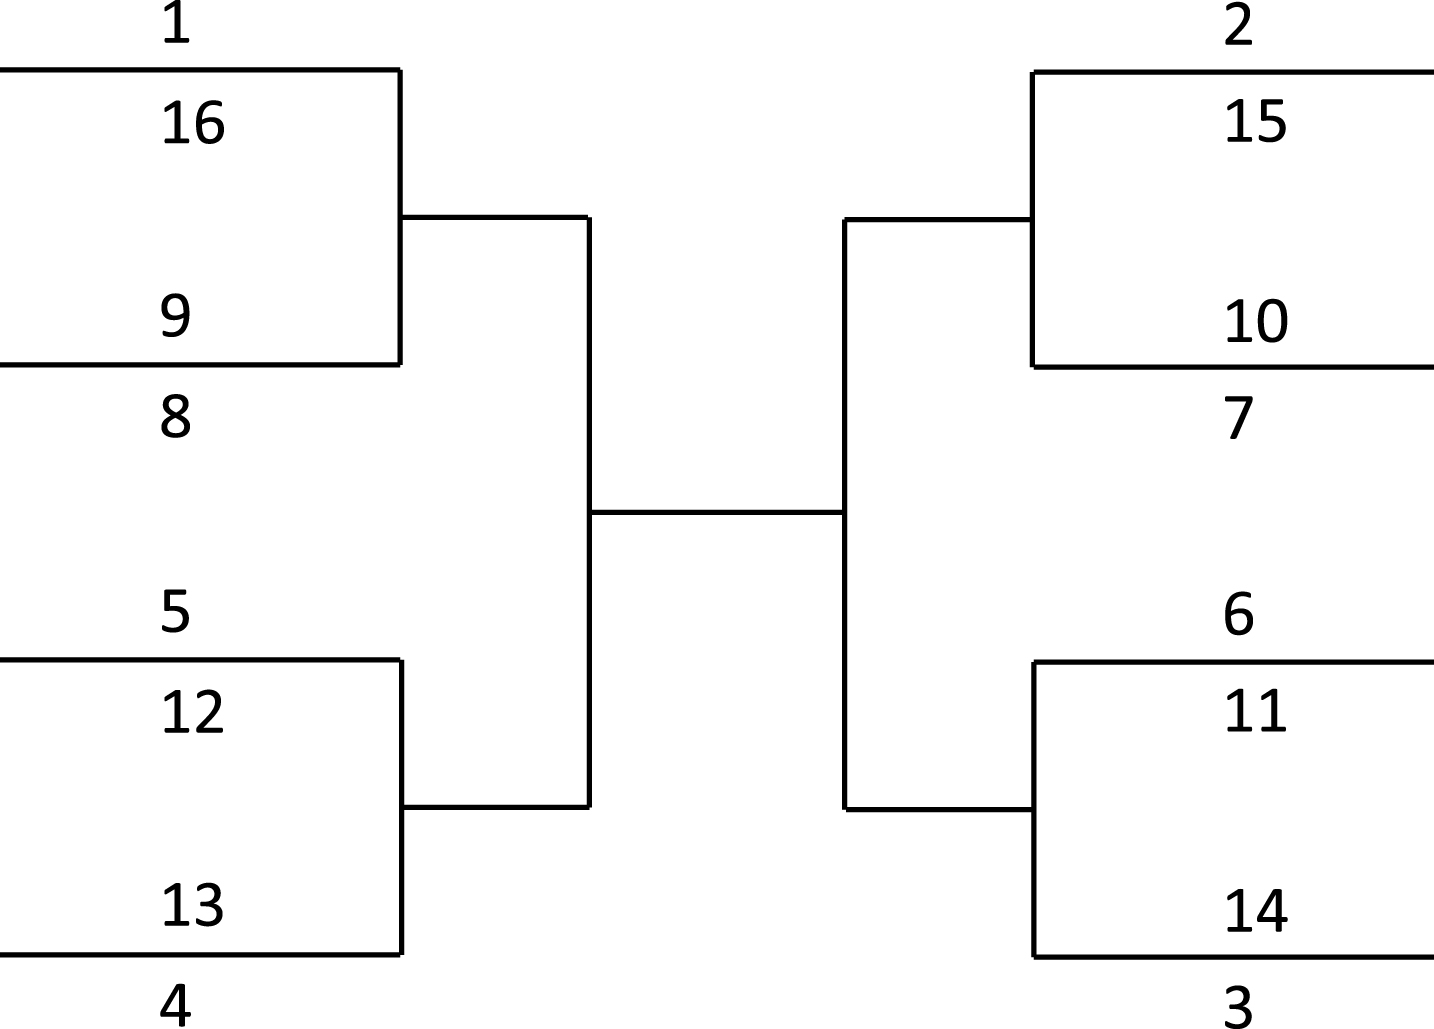
However, this bracket does not satisfy the group diversity constraint, defined in Section 1. Since the group labels are totally ignored, it might be that in one half of the bracket, some group winners and some runners-up come from the same group, for example if team 1 (the best group winner) and team 12 (the lowest ranked runner-up) come from the same group. It might also be that in some quarter of the bracket, several teams come from the same group, for example if teams 1 (best group winner) and/or 8 (second best runner-up) and/or 16 (fourth best third-placed team) come from the same group. These are things that UEFA (like FIFA before) wants to avoid and has ruled impossible in the current bracket.
There are several ways to enforce group diversity while keeping most of the benefits of the ideal bracket of Fig. 8. Here we suggest two ways of minimally distorting the ideal bracket:
• A small deterministic distortion of the ideal bracket: The position of each group winner (teams 1 to 6) in the bracket is kept intact. Then the positions of the runners-up, as well as the positions of the third-placed teams, are shuffled in a deterministic way to ensure group diversity and foster win incentive.
• A small random distortion of the ideal bracket: Alternatively, we can slightly randomize the ideal bracket in a way that ensures group diversity and preserves balance, win incentive, and absence of group advantage. This means that a new draw would be organized, right at the end of the group stage, in order to decide the final bracket.
3.1A new fairer deterministic bracket
3.1.1The suggested procedure
A first solution consists of slightly distorting the ideal bracket (Fig. 8) in a deterministic way. Here is what we suggest. The position of each group winner (teams 1 to 6) in the bracket is kept intact. Then a rearrangement of the 6 runner-up positions and a rearrangement of the 4 third-placed team positions are performed as follows:
• First we look at the groups of teams 1, 4, and 5 (left hand side). To enforce group diversity, the runners-up of these 3 groups can only be placed on the right hand side of the bracket. To guarantee win incentive, the lowest ranked of these 3 runners-up plays against team 6, a group winner. The other 2 runners-up play against each other (positions 7 and 10 of the ideal bracket). Symmetrically, we look at the groups of teams 2, 3, and 6 (right hand side); the runners-up of these 3 groups are placed on the left hand side of the bracket; the lowest ranked of these 3 runners-up plays against team 5, a group winner. The other 2 runners-up play against each other (positions 8 and 9 of the ideal bracket). At this stage, the 6 group winners and the 6 runners-up are positioned in the new bracket.
• We are now left with the 4 third-placed teams, to be placed in the 4 remaining spots (positions 13, 14, 15, 16 of the ideal bracket) in a way that guarantees group diversity. That is, each third-placed team must be assigned to a quarter of the bracket that has no team coming from the group of the third-placed team. There are 135 = 3 ×3 × 15 configurations to consider, corresponding to 3 possible cases for the group of the lowest ranked right runner-up (G1, G4, or G5), 3 possible cases for the group of the lowest ranked left runner-up (G2, G3, or G6), and 15 possible combinations of the 4 third-placed teams. Among those 135 configurations, there are only 6 unfavorable configurations where it is impossible to assign third-placed teams so as to satisfy the group diversity constraint: when the lowest ranked of the 3 right runners-up is from group G1 (the group of team 1), the lowest ranked of the 3 left runners-up is from group G2 (the group of team 2), and 3 of the 4 best third-placed teams come from groups G1, G4, G5 or from groups G2, G3, G6.
Finally we must pick 1 of the 2 or 4 admissible allocations. Note that this could be done through a random draw that would be performed right after the end of the group stage. Alternatively, to foster win incentive, a deterministic allocation could work as follows. Among the 2 or 4 admissible allocations, we keep the ones where the opponent of team 1 has the lowest rank. If only one allocation is left, we use it to define the final bracket. If not, then there are exactly 2 admissible allocations left, both have different opponents for team 2, and to define the final bracket we use the one with the lowest ranked opponent of team 2.– When this does not happen (129 cases out of 135), one can easily check (e.g., running a simple computer code) that there exists 2 (in 112 cases out of 129) or 4 (in 17 cases out of 129) admissible allocations of the 4 best third-placed teams.
– In the unfavorable cases (6 cases out of 135), we suggest to slightly tweak the bracket as follows: instead of playing against the lowest ranked of the 3 right runners-up, team 6 (the lowest ranked group winner) would play against the middle-ranked right runner-up. Then we would be back in the situation where there exists 2 (in 28 cases out of 30)6.
3.1.2An example
We recall the result of the draw of the group stage of the Euro 2016 in Table 8. Table 9 shows what the team rankings from 1 to 16 would have been at the end of the group stage of the UEFA Euro 2016.
Table 8
Result of the draw of the group stage of the Euro 2016 that took place in Paris, France, on December 12, 2015
| Group A | Group B | Group C | Group D | Group E | Group F |
| France | England | Germany | Spain | Belgium | Portugal |
| Switzerland | Russia | Ukraine | Croatia | Italy | Austria |
| Romania | Slovakia | Poland | Czech Rep. | Sweden | Hungary |
| Albania | Wales | N. Ireland | Turkey | Ireland | Iceland |
Table 9
Team rankings after the group stage of the UEFA Euro 2016. Rk stands for Rank, GD for Goal Difference, and GF for Goals For (numbers of goals scored)
| Rk | Team | Group | Pts | GD | GF |
| Group winners | |||||
| 1 | France | G1 = A | 7 | +3 | 4 |
| 2 | Germany | G2 = C | 7 | +3 | 3 |
| 3 | Croatia | G3 = D | 7 | +2 | 5 |
| 4 | Wales | G4 = B | 6 | +3 | 6 |
| 5 | Italy | G5 = E | 6 | +2 | 3 |
| 6 | Hungary | G6 = F | 5 | +2 | 6 |
| Runners-up | |||||
| 7 | Poland | G7 = C | 7 | +2 | 2 |
| 8 | Spain | G8 = D | 6 | +3 | 5 |
| 9 | Belgium | G9 = E | 6 | +2 | 4 |
| 10 | Iceland | G10 = F | 5 | +1 | 4 |
| 11 | England | G11 = B | 5 | +1 | 3 |
| 12 | Switzerland | G12 = A | 5 | +1 | 2 |
| Third-placed teams | |||||
| 13 | Slovakia | G13 = B | 4 | 0 | 3 |
| 14 | Ireland | G14 = E | 4 | -2 | 2 |
| 15 | Portugal | G15 = F | 3 | 0 | 4 |
| 16 | N. Ireland | G16 = C | 3 | 0 | 2 |
Note that in this example the ideal bracket (reported in Fig. 9) does not satisfy the group diversity constraint:
• Wales and Slovakia play against each other in the round of 16 but advanced from the same group (B).
• The three teams that qualified from Group F (Hungary, Iceland, and Portugal) are on the same half of the bracket.
• Several winners and runners-up from the same group (France and Switzerland, Group A; Germany and Poland, Group C; Italy and Belgium, Group E) are also on the same half of the bracket.
• The upper right quarter of the bracket has two teams from Group C (Germany and Poland) and two teams from Group F (Iceland and Portugal).
Fig.9
Ideal bracket if we use the Euro 2016 rankings reported in Table 9. It does not satisfy the group diversity constraint.
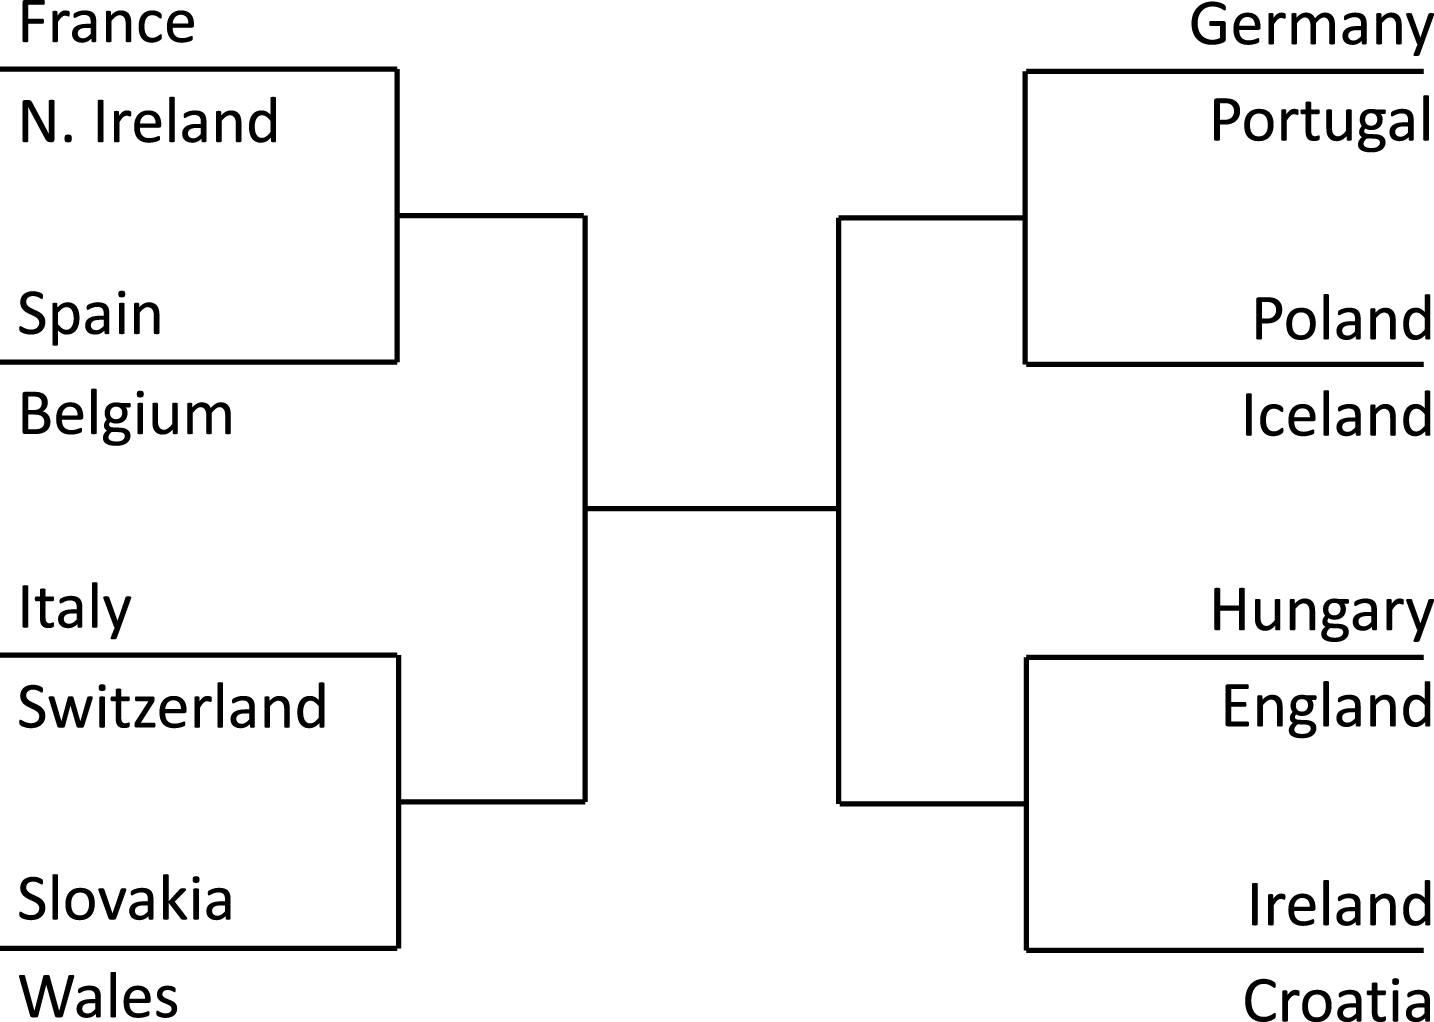
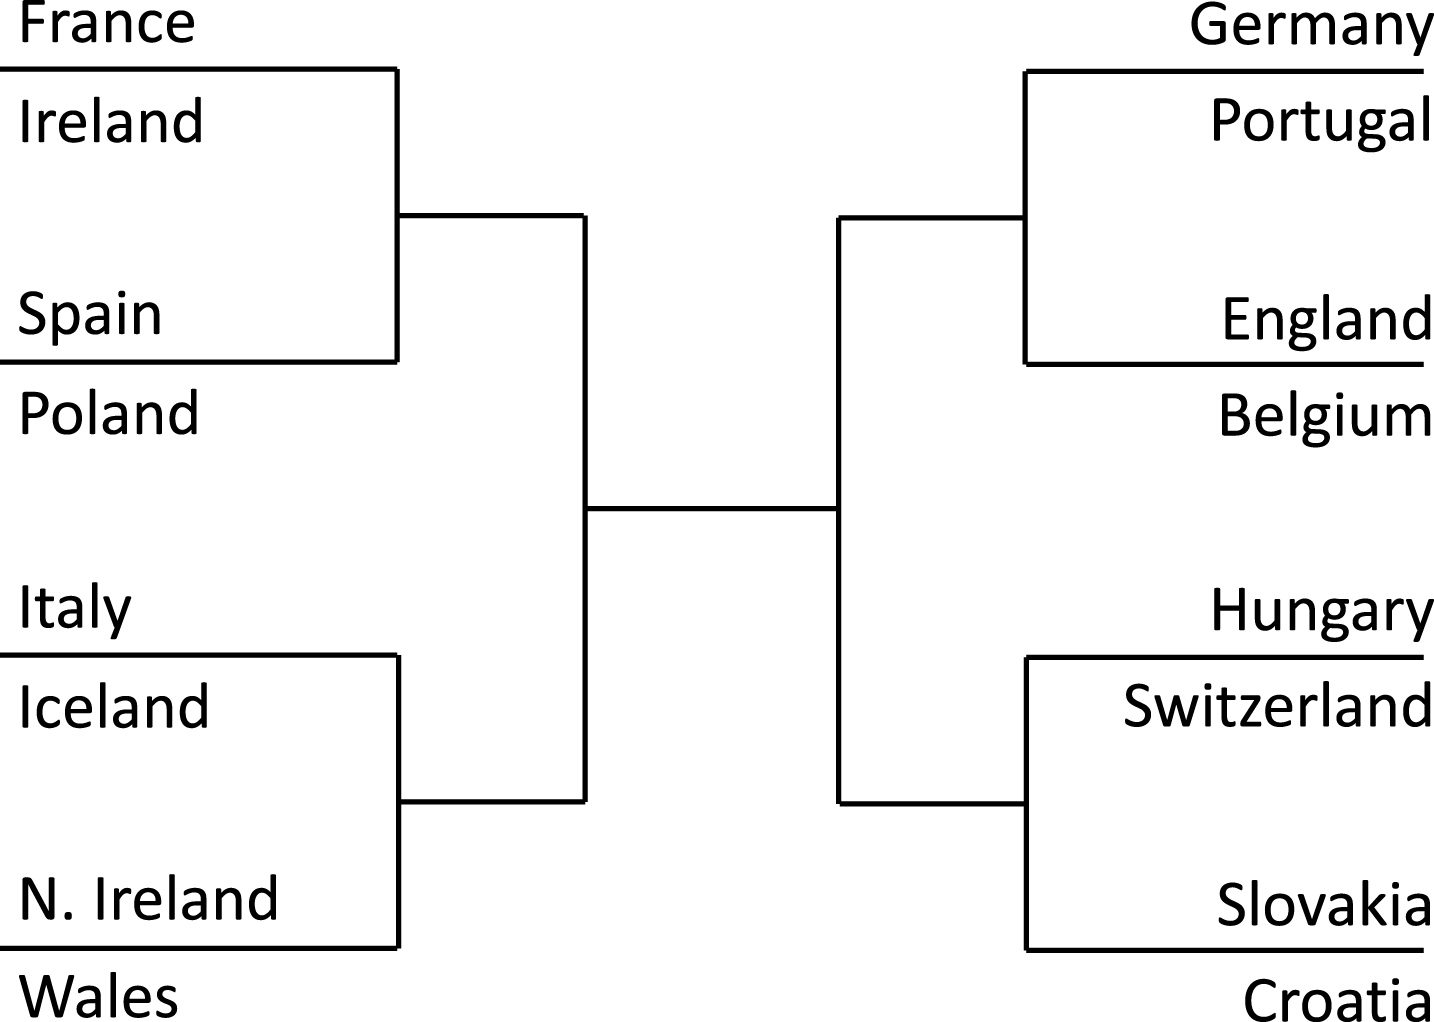
Fig. 10 shows what the bracket would be in this example if we follow our suggested deterministic procedure. First, France, Germany, Croatia, Wales, Italy, and Hungary are placed in positions 1, 2, 3, 4, 5, and 6 of the ideal bracket. The three right runners-up come from the groups of France, Wales, and Italy (the left hand side group winners): Switzerland, England, and Belgium. In our example, Switzerland is the lowest ranked runner-up after the group stage among those 3, so it goes to position 11 of the ideal bracket (against Hungary, the lowest ranked group winner). The other two runners-up, England and Belgium, go to positions 7 and 10. Symmetrically, Iceland, the lowest ranked left runner-up, goes to position 12 (against Italy), and Poland and Spain play against each other in positions 8 and 9. The 4 best third-placed teams come from Groups B, C, E, and F. Since the upper right quarter would have contained England (Group B), Germany (Group C), and Belgium (Group E), the only possible opponent for Germany would have been Portugal (third of Group F). This would probably have been described as a strong quarter, even though it would have contained only one group winner. Since the lower left quarter would have contained Wales (Group B) and Italy (Group E), the only possible remaining opponent for Wales would have been Northern Ireland (Group C). Eventually, the third-placed teams from Groups B and E (Slovakia and Ireland) could have been placed equally in the two remaining quarters of the bracket (upper left and lower right). To foster win incentive, Ireland, the lowest ranked of the two remaining third-placed teams, would have been placed against France, the best ranked team among the two remaining group winners, therefore Slovakia would have been placed against Croatia.
Fig.10
Bracket produced by our suggested deterministic procedure if we use the Euro 2016 rankings reported in Table 9. By construction, the group diversity constraint is satisfied.
3.2A new fairer random bracket
Another solution consists of slightly distorting the ideal bracket in a random way. Here is what we suggest. We denote by Xi the team in position i of the ideal bracket of Fig. 8 in our random bracket, 1 ≤ i ≤ 16 (see Figs. 11 and 12). We will need to consider two cases.
Fig.11
Suggested random bracket: case 1.
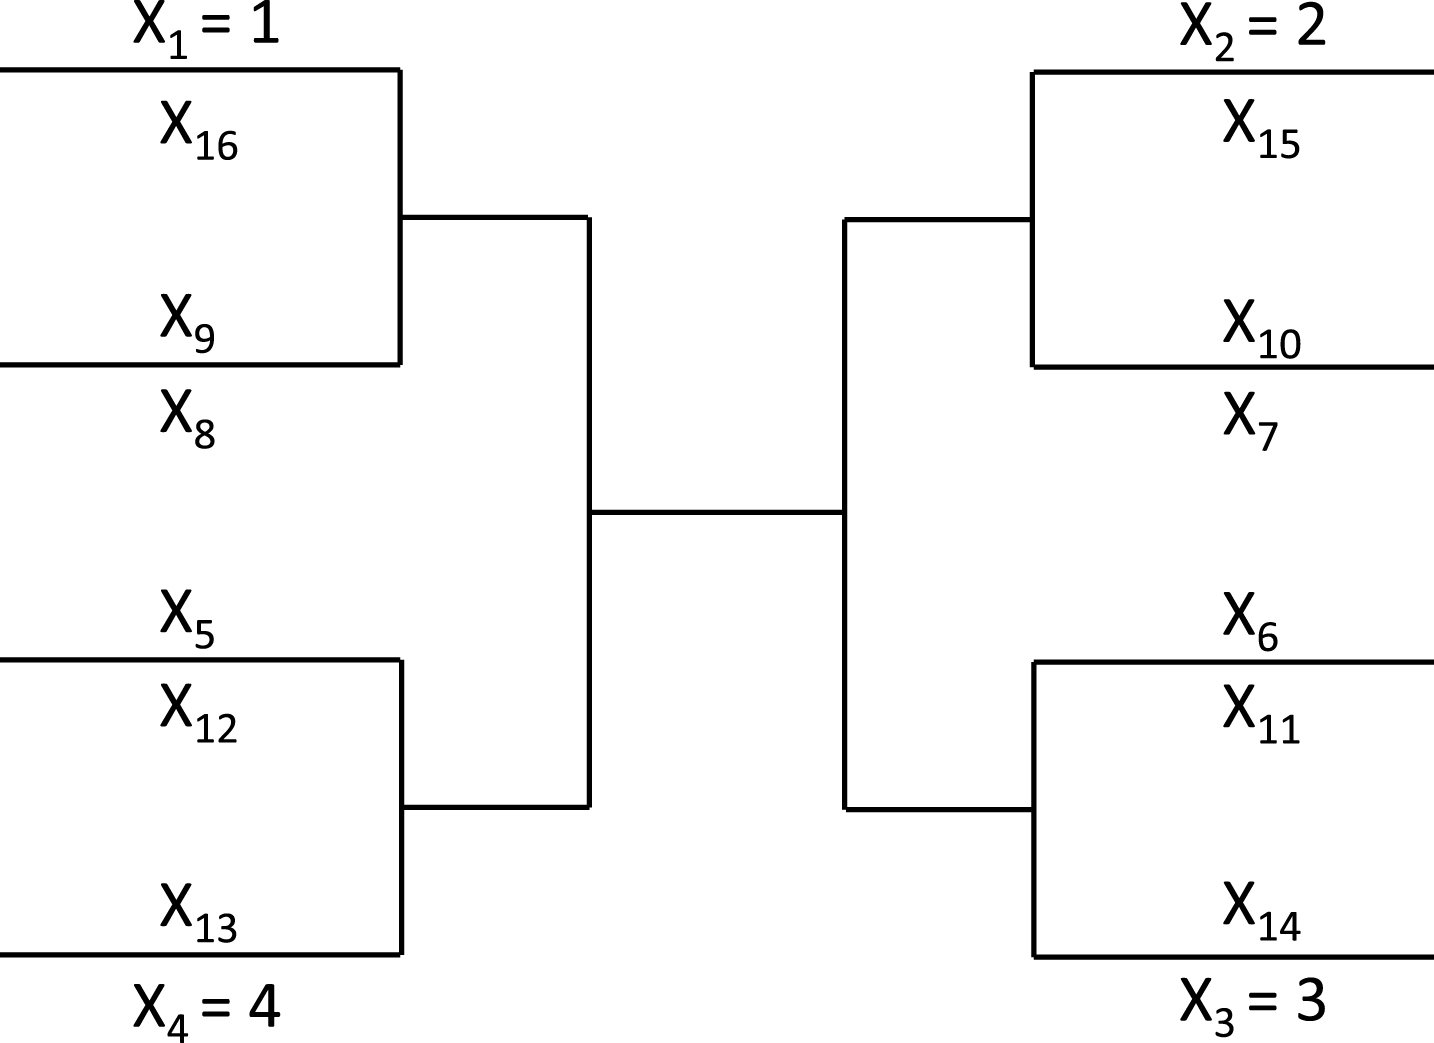
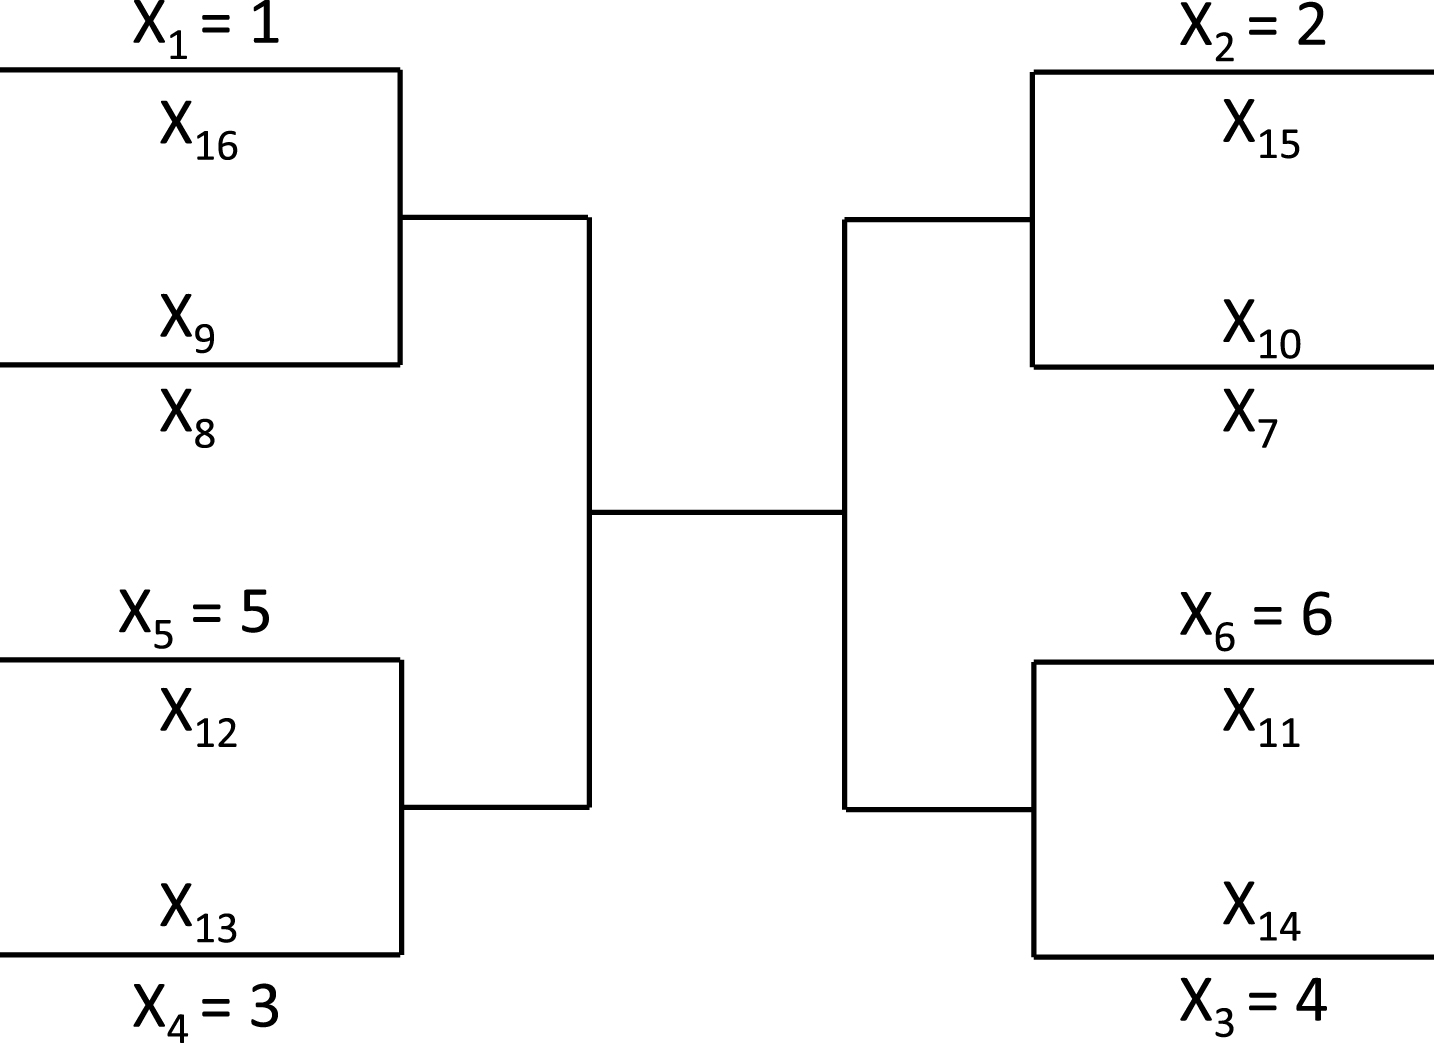
Fig.12
Suggested random bracket: case 2.
3.2.1Case 1: {G7, G8} ≠ {G1, G4} and {G7, G8} ≠ {G2, G3}
In this case, let us consider the bracket of Fig. 11. We set X1 = 1, X2 = 2, X3 = 3, and X4 = 4, and we will draw a combination of teams X5, …, X16 that satisfies the following constraints:
• {X5, X6} = {5, 6}, i.e., teams (X5, X6) can be any permutation of teams (5, 6)
• {X7, X8} = {7, 8}, i.e., teams (X7, X8) can be any permutation of teams (7, 8)
• {X9, X10, X11, X12} = {9, 10, 11, 12}, i.e., teams (X9, X10, X11, X12) can be any permutation of teams (9, 10, 11, 12)
• {X13, X14, X15, X16} = {13, 14, 15, 16}, i.e.,teams (X13, X14, X15, X16) can be any permutation of teams (13, 14, 15, 16)
• # {GX1, GX4, GX5, GX8, GX9, GX12} =6, i.e., the 3 group winners and the 3 runners-up on the left hand side of the bracket come from 6 different groups (# denotes the cardinality)
• # {GX2, GX3, GX6, GX7, GX10, GX11} =6, i.e., the 3 group winners and the 3 runners-up on the right hand side of the bracket come from 6 different groups
• GX16 ∉ {GX1, GX8, GX9}, i.e., the 4 teams of the top left quarter of the bracket come from 4 different groups
• GX15 ∉ {GX2, GX7, GX10}, i.e., the 4 teams of the top right quarter of the bracket come from 4 different groups
• GX14 ∉ {GX3, GX6, GX11}, i.e., the 4 teams of the bottom right quarter of the bracket come from 4 different groups
• GX13 ∉ {GX4, GX5, GX12}, i.e., the 4 teams of the bottom left quarter of the bracket come from 4 different groups
Using a simple computer code, it is easy to check that for any possible sets of groups {G7, G8} and {G13, G14, G15, G16}8 such that {G7, G8} ≠ {G1, G4} and {G7, G8} ≠ {G2, G3}, the number N of combinations of teams X5, …, X16 that satisfy all the constraints above belongs to {6, 8, 10, 12, 16, 18, 20, 24}. This means that, when the group stage is over, teams 1 to 16 would be known, corresponding to particular sets {G7, G8} and {G13, G14, G15, G16}, and if {G7, G8} ≠ {G1, G4} and {G7, G8} ≠ {G2, G3}, then the exhaustive list of the N admissible brackets (i.e., admissible combinations of teams X5, …, X16) would be published, and one of the N brackets would be randomly drawn, uniformly. Section 3.2.3 below provides an illustrating example.
3.2.2Case 2: {G7, G8} = {G1, G4} or {G7, G8} = {G2, G3}
The only situation where N = 0 is when {G7, G8} = {G1, G4} or {G7, G8} = {G2, G3}. Indeed, if {G7, G8} = {G1, G4}, for any permutation (X7, X8) of teams (7, 8), the runner-up X8 must come from the same group as that of a group winner (team 1 or team 4), in the left half of the bracket. Symmetrically, if {G7, G8} = {G2, G3}, for any permutation (X7, X8) of teams (7, 8), the runner-up X7 must come from the same group as that of a group winner (team 2 or team 3), in the right half of the bracket.
In this situation, we suggest to set X1 = 1, X2 = 2, X3 = 4, X4 = 3, X5 = 5 and X6 = 6, i.e., compared with Fig. 11, we permute teams 3 and 4, and additionally we can impose that X5 = 5 and X6 = 6 (see Fig. 12). Then for any possible set of groups {G13, G14, G15, G16}, the number N of combinations of teams X7, …, X16 that satisfy all the constraints above belongs to {8, 10}. Like in case 1, we would then simply draw one of the N admissible brackets randomly, uniformly, to decide the final bracket.
3.2.3An example
We use the example of the Euro 2016 team rankings after the group stage given in Table 9. In this example, {G1, G4} = {A, B}, {G2, G3} = {C, D}, and {G7, G8} = {C, D}, so we are in Case 2 (Section 3.2.2 and Fig. 12). There are N = 8 admissible brackets, all reported in Table 10. Note that, as Germany is in the right half (in position X2 = 2) and Croatia is in the left half (in position X4 = 3), Poland, who is Team 7 and comes from the same group as Germany, can only take position X8 (in the left half), and cannot take position X7 (in the right half), and Spain (Team 8) can only take position X7. As a consequence, the 8 admissible brackets all have X7 = 8 (Spain) and X8 = 7 (Poland).
Table 10
The N = 8 admissible random brackets of our suggested method if we use the actual results of the group stage of the Euro 2016(see Table 9)
| France (X1) - Slovakia (X16) | Germany (X2) - Portugal (X15) |
| Poland (X8) - Iceland (X9) | Spain (X7) - Belgium (X10) |
| Italy (X5) - England (X12) | Hungary (X6) - Switzerland (X11) |
| Croatia (X4) - N. Ireland (X13) | Wales (X3) - Ireland (X14) |
| France (X1) - Ireland (X16) | Germany (X2) - Slovakia (X15) |
| Poland (X8) - Iceland (X9) | Spain (X7) - Belgium (X10) |
| Italy (X5) - England (X12) | Hungary (X6) - Switzerland (X11) |
| Croatia (X4) - Portugal (X13) | Wales (X3) - N. Ireland (X14) |
| France (X1) - Ireland (X16) | Germany (X2) - Portugal (X15) |
| Poland (X8) - England (X9) | Spain (X7) - Belgium (X10) |
| Italy (X5) - Iceland (X12) | Hungary (X6) - Switzerland (X11) |
| Croatia (X4) - Slovakia (X13) | Wales (X3) - N. Ireland (X14) |
| France (X1) - Portugal (X16) | Germany (X2) - Slovakia (X15) |
| Poland (X8) - England (X9) | Spain (X7) - Belgium (X10) |
| Italy (X5) - Iceland (X12) | Hungary (X6) - Switzerland (X11) |
| Croatia (X4) - N. Ireland (X13) | Wales (X3) - Ireland (X14) |
| France (X1) - Slovakia (X16) | Germany (X2) - Ireland (X15) |
| Poland (X8) - Iceland (X9) | Spain (X7) - Switzerland (X10) |
| Italy (X5) - England (X12) | Hungary (X6) - Belgium (X11) |
| Croatia (X4) - Portugal (X13) | Wales (X3) - N. Ireland (X14) |
| France (X1) - Ireland (X16) | Germany (X2) - Slovakia (X15) |
| Poland (X8) - Iceland (X9) | Spain (X7) - Switzerland (X10) |
| Italy (X5) - England (X12) | Hungary (X6) - Belgium (X11) |
| Croatia (X4) - Portugal (X13) | Wales (X3) - N. Ireland (X14) |
| France (X1) - Ireland (X16) | Germany (X2) - Portugal (X15) |
| Poland (X8) - England (X9) | Spain (X7) - Switzerland (X10) |
| Italy (X5) - Iceland (X12) | Hungary (X6) - Belgium (X11) |
| Croatia (X4) - Slovakia (X13) | Wales (X3) - N. Ireland (X14) |
| France (X1) - Portugal (X16) | Germany (X2) - Ireland (X15) |
| Poland (X8) - England (X9) | Spain (X7) - Switzerland (X10) |
| Italy (X5) - Iceland (X12) | Hungary (X6) - Belgium (X11) |
| Croatia (X4) - Slovakia (X13) | Wales (X3) - N. Ireland (X14) |
Since France (Group A) and Italy (Group E) are on the left hand side in positions X1 = 1 and X5 = 5, Switzerland (Team 12, Group A) and Belgium (Team 9, Group E) can only be on the right hand side, in positions X10 or X11. Symmetrically, as Wales (Group B) and Hungary (Group F) are on the right hand side in positions X3 = 4 and X6 = 6, England (Team 11, Group B) and Iceland (Team 10, Group F) can only be on the left hand side, in positions X9 or X12. For each placement of Switzerland and Belgium (2 possibilities), and each placement of England and Iceland (2 possibilities), there are two acceptable positions for the four third-placed teams. This leads to a total of 8 admissible brackets.
Right after the last matches of the group stage are over, a computer would give this exhaustive list of the 8 possible brackets. This list would be numbered, from 1 to 8, and a random number from 1 to 8 would be drawn to decide the final bracket of the Euro.
3.3Benefits and drawbacks of the new suggested systems
In the two new procedures that we have suggested, balance and group diversity are enforced. Moreover, compared to the current rules, group advantage has been eliminated, as the bracket is built ignoring the group labels, and only taking into account team performances during the group stage.
In both new suggested rules, there is a global win incentive, in the sense that, due to the global structure of the bracket, it is better to win the group than to be the runner-up, and to be the runner-up than to be in third place. But the win incentive is deeper than that. With our suggested deterministic bracket, all teams have an incentive to score a lot of goals, even if that does not change their ranking in the group, as it can improve their ranking within group winners, runners-up, or third-placed teams, and the better this ranking is, the weaker their opponents in the knockout stage will be (at least on paper, based on all team performances during the group stage). For instance, teams that are guaranteed to win their group before their last game of the group stage (e.g., Italy during the Euro 2016) still have a win incentive. Teams that are guaranteed to win their group if they draw during their last group stage match (e.g., France and Spain during the Euro 2016) still have a win incentive. Using global rankings 1–16 to build the knockout bracket would significantly increase win incentive, as well as interest and excitement for the groupstage.
With our suggested random bracket, there is an incentive to be one of the 4 best group winners, and it is also better to be one of the 2 best runners-up (teams 7 and 8) than one of the 4 other runners-up (teams 9–12). Note, however, that in this system it makes no difference to be team 9, 10, 11, or 12 (resp. 13, 14, 15, or 16), as the random draw treats teams 9–12 (resp. teams 13–16) on an equal basis.
The suggested random system involves a new draw ceremony, which would take place right after the last matches of the group stage are finished. This could be appealing, as the draw would lend itself to a nice, widely anticipated televised show of about 30 minutes. First, the exhaustive, numbered list of the N admissible brackets, corresponding to the observed combination of {G7, G8} and {G13, G14, G15, G16}, would be displayed. Then, one of these N admissible brackets would be randomly drawn, uniformly. A simple way to do so is to fill a bowl with N balls, each containing a paper with a different number from 1 to N, and then sequentially empty the bowl. Each time a ball is drawn, its number is shown, and the last remaining ball in the bowl would decide the final bracket. Emptying the bowl allows the public to check that the N balls indeed contained the N different numbers from 1 to N.
Another possible benefit of the suggested systems for UEFA is the following. Given that group labels A to F would be totally unrelated to the final bracket, seeded teams could now be allocated to Groups A to F without impacting the knockout stage. For instance, seeded teams could be allocated to groups based on geographical criteria, e.g., so that Spain and Portugal play their group stage games in Bordeaux, Toulouse, and Marseilles; England and Belgium in Lille, Lens, Paris, or Saint-Denis; Germany in Paris, Saint-Denis, Lyon, or Saint-Etienne; etc. This would not be possible in the current system, since for logistic reasons the schedule of the tournament (date and location of each game) is published long before the draw of the group stage. Assigning a seeded team to some locations could then only be done by assigning it to some groups, which in the current system would impact the knockout stage. For instance, in the current system, if seeded teams were arbitrarily placed in Groups B and F, then they would automatically meet in quarterfinals if they win their groups.9 Even though we would not recommend it in view of sporting fairness, UEFA may find this possibility interesting in view of maximizing ticket sales and maximizing the presence of fans of seeded teams.
Note that in the new systems all teams would now need to wait until the end of the group stage to know their opponent in the round of 16 and their possible opponents in future rounds, and to know in what stadiums they would play their successive knockout games. This would complicate logistics (both for teams and fans) and could be seen as a drawback. However, this would improve sporting fairness, by placing all teams on an equal foot.
Finally, among possible drawbacks of the new suggested systems, let us mention that the new brackets may look like more complicated than the UEFA Euro 2016 bracket; and that a draw from a set of previously defined seedings for the knockout phase might give an impression of arbitrariness, even if the set is well-founded from an axiomatic point of view. Note however that UEFA has recently drawn the list of host city pairs for the UEFA Euro 2020 from a set of 6 predefined lists of pairs without raising criticism; and that the team selection rule for the 4 playoffs of the new UEFA Nations League recently decided by UEFA is much more complicated than the rules presented here. Therefore it looks plausible that these new rules could actually be implemented. They could first be tested on youth competitions with similar formats (e.g., 12 teams) for instance.
4Conclusion
In this article we have examined the flaws of the knockout bracket of the Euro 2016: group advantage and lack of win incentive. These flaws result from the way UEFA has enforced balance and group diversity. We have explained that it is impossible to remove group advantage, while enforcing balance and group diversity, if we stick to a predetermined bracket route that is based only on group ranks.
Two new procedures have been suggested. In both of them, teams would be placed in the bracket based on their performances in the group stage, in a way that guarantees balance, group diversity, win incentive, and absence of group advantage. With the first suggested procedure, deterministic rules are used to build the bracket, based on the group stage results. The second suggested procedure allows for a small amount of randomness: it involves a new draw that would take place right after the last games of the group stage are finished in order to decide the final bracket.
We hope that these two new methods are convincing examples of what a fairer 24 team UEFA Euro could look like. In February 2018, UEFA has decided to keep the 2016 format for Euro 2020. However, UEFA has used our work to modify the knockout bracket so as to minimize group advantage: it will use Structure 6 for the knockout stage (see Table 5, Fig. 7, and articles 21.04 and 21.05 in UEFA Euro 2020 regulations (2018)), making Euro 2020 a fairer tournament.
Acknowledgements
I would like to thank the two anonymous referees for their constrcutive remarks, which helped improve this article.
I would also like to warmly thank Dries Goossens for fruitful discussions, as well as Xavier Guyon and Romain Menegaux for their comments on a preliminary version of this article.
Notes
1 There was a slight twist in the 1994 bracket, see Fig. 5 and footnote 2.
2 Notice the small twist in the 1994 bracket, where winners and runners-up of groups B, C, D, and F were in the same half. The reason for this may have been to minimize the probability that the two finalists already met in the group stage. This meant, however, that the winner and runner-up of the same group could meet in the semifinals. As it happened, Brazil and Sweden, winner and runner-up of Group B, met again in the semifinals.
3 Also notice a curiosity: the right halves of the 1986 and 1990 bracket results were exactly identical, up to the semifinal
4 From the proof in the appendix, in Structure 6, there are exactly 6 combinations of advancing third-placed teams (out of the 15 combinations listed in Table 1) for which exactly one quarter of the bracket must have two teams from the same group. Assuming that each team has a 50% chance of advancing at each round of the knockout stage, this means that the probability of a repeated matchup in quarterfinals would be only
5 There was a slight twist in the 1994 bracket, see Fig. 5 and footnote 2.
6 Here the 30 = 2 ×15 configurations correspond to 2 possible cases for the group of the middle-ranked right runner-up (G4 or G5) and 15 possible combinations of the 4 third-placed teams. or 4 (in 2 cases out of 30) admissible allocations of the 4 best third-placed teams.
7 Closeness can for instance be measured by
8 Note that {G9, G10, G11, G12} is simply the complementary set to {G7, G8} in the set of all groups {A,B,C,D,E,F}, as teams 7–12 are the 6 runners-up.
9 For the 2015 Women’s World Cup, which also featured 24 teams, FIFA allocated the 6 seeded teams to groups A to F before the draw, while using the bracket of Fig. 1. This meant that FIFA almost decided that France and Germany would meet in quarterfinals, as they placed Germany in Group B and France in Group F, which implied that if both teams won their group and advanced to the quarterfinals, they would play against each other – which is exactly what happened. This was, of course, a terrible way of organizing the tournament, and proved how difficult it is for FIFA to cope with sporting fairness.
References
1 | Adler I. , Cao Y. , Karp R. , Pekoz E. and Ross S. , (2017) , Random knockout tournaments, Operations Research, 65: (6), 1589–1596. |
2 | Annis D.H. and Wu S.S. , (2006) , A Comparison of Potential Playoff Systems for NCAA I-A Football, The American Statistician, 60: (2), 151–157. |
3 | Aziz H. , Gaspers S. , Mackenzie S. , Mattei N. , Stursberg P. and Walsh T. , (2014) , Fixing a balanced knockout tournament, Proceedings of the Twenty-Eighth AAAI Conference on Artificial Intelligence (AAAI-14), 552–558. |
4 | Baumann R. , Matheson V.A. and Howe C.A. , (2010) , Anomalies in Tournament Design: The Madness of March Madness, Journal of Quantitative Analysis in Sports, 6: (2), Article 4. |
5 | Dagaev D. and Suzdaltsev A. , (2015) , Seeding, Competitive Intensity and Quality in Knock-Out Tournaments, Higher School of Economics Research Paper No. WP BRP 91/EC/2015. |
6 | David H.A. , (1988) , The method of paired comparisons (2nd.), Chapman and Hall, London. |
7 | Edwards C.T. , (1998) , Non-parametric procedure for knockout tournaments, Journal of Applied Statistics, 25: , 375–385. |
8 | Glickman M.E. , (2008) , Bayesian locally optimal design of knockout tournaments, Journal of Statistical Planning and Inference, 138: (7), 2117–2127. |
9 | Glickman M.E. and Hennessy J. , (2016) , Bayesian optimal design of fixed knockout tournament brackets, Journal of Quantitative Analysis in Sports, 12: (1), 1–15. |
10 | Guyon J. , (2015) , Euro: Comment le tableau final favorise la France, Le Monde, December 12, 2015, http://www.lemonde.fr/football/article/2015/12/12/euro-2016-comment-le-tableau-final-favorise-la-france-par-julien-guyon-mathematicien_4830555_1616938.html(in French). |
11 | Horen J. and Riezman R. , (1985) , Comparing draws for single elimination tournaments, Operations Research, 33: (2), 249–262. |
12 | Hwang F.K. , (1982) , New concepts in seeding knockout tournaments, American Mathematical Monthly, 89: (4), 235–239. |
13 | Karpov A. , (2015) , A theory of knockout tournament seedings, University of Heidelberg, Department of Economics, Discussion Paper Series, 600. |
14 | McGeady A. , (2015) , How Euro 2016 unfairly favours France, http://www.andymcgeady.com/how-euro2016-unfairly-favours-france/. |
15 | Marchand E. , (2002) , On the comparison between standard and random knockout tournaments, The Statistician, 51: , 169–178. |
16 | Ross S. and Ghamami S. , (2008) , Efficient Simulation of a Random Knockout Tournament, Journal of Industrial and Systems Engineering, 2: (2), 88–96. |
17 | Scarf P. , Yusof M. and Bilbao M. , (2009) , A numerical study of designs for sporting contests, European Journal of Operational Research, 198: , 190–198. |
18 | Scarf P. and Yusof M. , (2011) , A numerical study of tournament structure and seeding policy for the soccer World Cup Finals, Statistica Neerlandica, 65: (1), 43–57. |
19 | Schwenk A. , (2000) , What is the correct way to seed a knockout tournament? American Mathematical Monthly, 107: (2), 140–150. |
20 | Stanton I. and Vassilevska Williams V. , (2011) , Rigging tournament brackets for weaker players, Proceedings of the nd International Joint Conference on Artificial Intelligence (IJCAI), 357–364. |
21 | UEFA Euro 2016 regulations, 2013, Regulations of the UEFA European Football Championship, 2014–16, http://www.uefa.com/MultimediaFiles/Download/Regulations/uefaorg/Regulations/02/03/92/81/2039281DOWNLOAD.pdf. |
22 | UEFA Euro 2020 regulations, 2018, Regulations of the UEFA European Football Championship, 2018–20, https://www.uefa.com/MultimediaFiles/Download/Regulations/uefaorg/Regulations/02/54/36/05/2543605DOWNLOAD.pdf. |
23 | Vassilevska Williams V. , (2010) , Fixing a tournament, Proceedings of the th AAAI Conference on Artificial Intelligence (AAAI), 895–900. |
24 | Vu T. , Altman A. and Shoham Y. , (2009) , On the complexity of schedule control problems for knockout tournaments, Proceedings of the th International Joint Conference on Autonomous Agents and Multi- Agent Systems (AAMAS), 225–232. |
25 | Vu T. and Shoham Y. , (2011) , Fair seeding in knockout tournaments, ACM Transactions on Intelligent Systems and Technology, 3: (1), 9. |
26 | Wolsing S. , (2015) , Group E in EURO 2016 is the worst one, http://fr.scribd.com/doc/290626039/EURO-2016-The-Group-E-effect. |


