
Women’s modern pentathlon scoring systems and predictive modelling for decision support
Abstract
The purpose of the current investigation was to develop and evaluate an analytics approach to identifying the disciplines that female modern pentathletes should focus on to most improve their total points score. The study comprises of three analyses as well as the description and evaluation of an analytics approach to identify the event that a modern pentathlete should focus on to most improve their overall points. Analysis I revealed that the proportion of total points score derived from the laser run was significantly greater under the currently used scoring system than under the scoring system used prior to 2014 (p < 0.001). Analysis II considered year to year change in points scored for a set of 243 athletes who had completed performances in successive calendar years. The variability of year to year change in points was significantly influenced by discipline (p < 0.001) with the highest variability being in the laser run followed by fencing, riding and swimming. Linear and inverse regression models of year to year change were created during Analysis III and used in a simulation package that allowed year to year change to be predicted synthesising increased emphasis being made on different disciplines. The simulation approach suggests that female athletes can expect to make the greatest gains by emphasising the laser run and fencing within training. An evaluation study using six cases largely agreed with this but there was one of the athletes whose highest actual points improvement was in riding.
1Introduction
The modern pentathlon originated from the ancient Olympic pentathlon. It was created by the founder of the modern Olympic Games, Pierre de Coubertin, who also introduced modern pentathlon into the Olympic Games in Stockholm in 1912. The women’s modern pentathlon was first adopted as an Olympic sport at the 2000 Sydney Olympic Games (Heck, 2012). It has introduced various changes to increase popularity. The biggest change was introducing the laser run, combining shooting and running into a single event, in 2009. An early study of the laser run at a World Cup event found that shooting accuracy of the top third ranked athletes in the overall competition was greater than that of the remaining athletes (Meur et al., 2010). This in turn resulted in a lower shooting time for the top third, but running times did not significantly differ between top third ranked athletes in the overall competition and lower ranked athletes (Meur et al., 2010). At the Olympic Games, this change came into effect in the London Olympics of 2012 (Heck, 2013). As the name implies, the modern pentathlon is a multisport in which each athlete performs five activities, namely fencing, swimming, horse riding, pistol shooting and cross country running in a single day (Cohal, 2019). The first event is fencing. Each athlete fences épée with all the other athletes and has to score one point in one minute; if neither athlete scores a point within a minute then both lose the bout. The second event is 200 m freestyle swimming. Athletes can use any stroke or style. The third event is show jumping in horse riding. Athletes ride random horses and jump over fifteen obstacles. The last event is the laser run which combines two activities; pistol shooting and running. The athlete starts with a handicap that is determined by the three previous events’ scores. This handicapping process ensures that the order in which athletes complete the laser run will correspond to their rank order in the overall modern pentathlon event. The laser run consists of an initial run to the shooting station, then four rounds of five laser pistol shots each followed by 800 m running. Depending on the circumstances, the order of events can be changed and there are no riding events in the qualifying round. Fencing, riding, and shooting can be classified as technical sports; skill and experience are of paramount important. On the other hand, running and swimming represent physical sport, requiring strength and endurance (Lim et al., 2018; Muniz-Pardos et al., 2020) as well as efficient technique.
Research in multisports has analysed the scoring systems used and suggested the disciplines they favour. For example, in the heptathlon Westera (2007) found that the largest relative variability between performers is in the 100 m Hurdles and Long Jump while the lowest is in the Javelin and Shot Put. Slavek and Jović (2012) also found that the 100 m Hurdles and Long Jump were more preferentially awarded points than the throwing disciplines. Gassmann et al. (2016) provided further evidence that the heptathlon scoring system favoured sprint and jump events more than throwing events. In the decathlon, Trkal (2003) highlighted the need for scoring systems to avoid the possibility of athletes who specialise in one discipline being more successful than more versatile athletes. Further research into the top 100 all-time decathlon performances revealed that the scoring system favoured sprinting events and the long jump more than throwing events and the 1500 m (Barrow, 2014). Similar analyses have been applied to modern pentathlon data to identify events favoured by the scoring system. Le Meur et al. (2010) found that the overall World Cup ranking and the laser run ranking are highly correlated, and that riding performance also has a significant impact on the overall modern pentathlon score. In 2014, the scale of the scoring table changed dramatically. Other minor rule changes were made, such as introducing a bonus round in fencing and changing the minus point per 0.5s in swimming. The changes in the rules and scoring table have impacted on the total points scores achieved (Barrow, 2014; Dadswell et al., 2013).
Irrespective of the criticisms made about the scoring systems used in multisports, these scoring systems are being used and, therefore, it is important for athletes and coaches to understand how to best improve athletes’ overall scores based on these scoring systems (Ofoghi et al., 2016). This has motivated the development of predictive modelling approaches that can identify areas where improvements can make the biggest difference to the overall points score. One such approach was proposed for the decathlon (Jayal et al., 2018). This used previous performance data to determine the possible range of improvements in points for each discipline within a year given the current performance level in the discipline. In general, the higher the performance level, the more restricted the amount of improvement that can be made in the next season. The approach of Jayal et al. (2018) can be criticised for analysing variability in pairs of performances by the same athletes separated by one calendar year where the points awarded increased. Year to year change in performance can also be negative. Modelling year to year improvement in points scored for disciplines was also done for the heptathlon (Dinnie and O’Donoghue, 2020). This used a multivariate approach that recognised that improvement in a discipline may be related to improvement in other disciplines with similar fitness requirements. Emphasising different events in training was simulated by ensuring that the predicted improvement in the prioritised disciplines was in the top 50% or 75% of the known range of improvements based on previous evidence. This is a limitation of the approach because no matter how much a discipline is emphasised in training, there is no guarantee that the athlete’s year to year change in the discipline will be among the highest improvements observed in the discipline.
Despite the importance of modern pentathlon as an Olympic sport, little is known about performance in each discipline (Dadswell et al., 2013). It is necessary to look at the distribution of points scored in each discipline as well as their correlations. Moreover, in the early years of the modern pentathlon’s history, frequent rule changes caused a lot of confusion which affected atheltes’ performance and training methods (Heck, 2013). Fencing in the modern pentathlon plays a major role in qualifying and performing well in the finals. By contrast, swimming has the least impactful role on the overall performance (Lee et al., 2020).
The purpose of the current research paper is to analyse women’s modern pentathlon performances and evaluate an approach to target setting that overcomes the limitations of approaches previously used in the decathlon (Jayal et al., 2018) and the heptathlon (Dinnie and O’Donoghue, 2020). This involves answering the following research questions:
1. Does the percentage of points derived from each discipline differ when the current scoring system is used as opposed to the previous scoring system?
2. Are discipline scores correlated under either scoring system?
3. Does the year to year change in scores for the same athletes differ between disciplines?
4. Can year to year change in scores for any disciplines be predicted from the previous year’s scores?
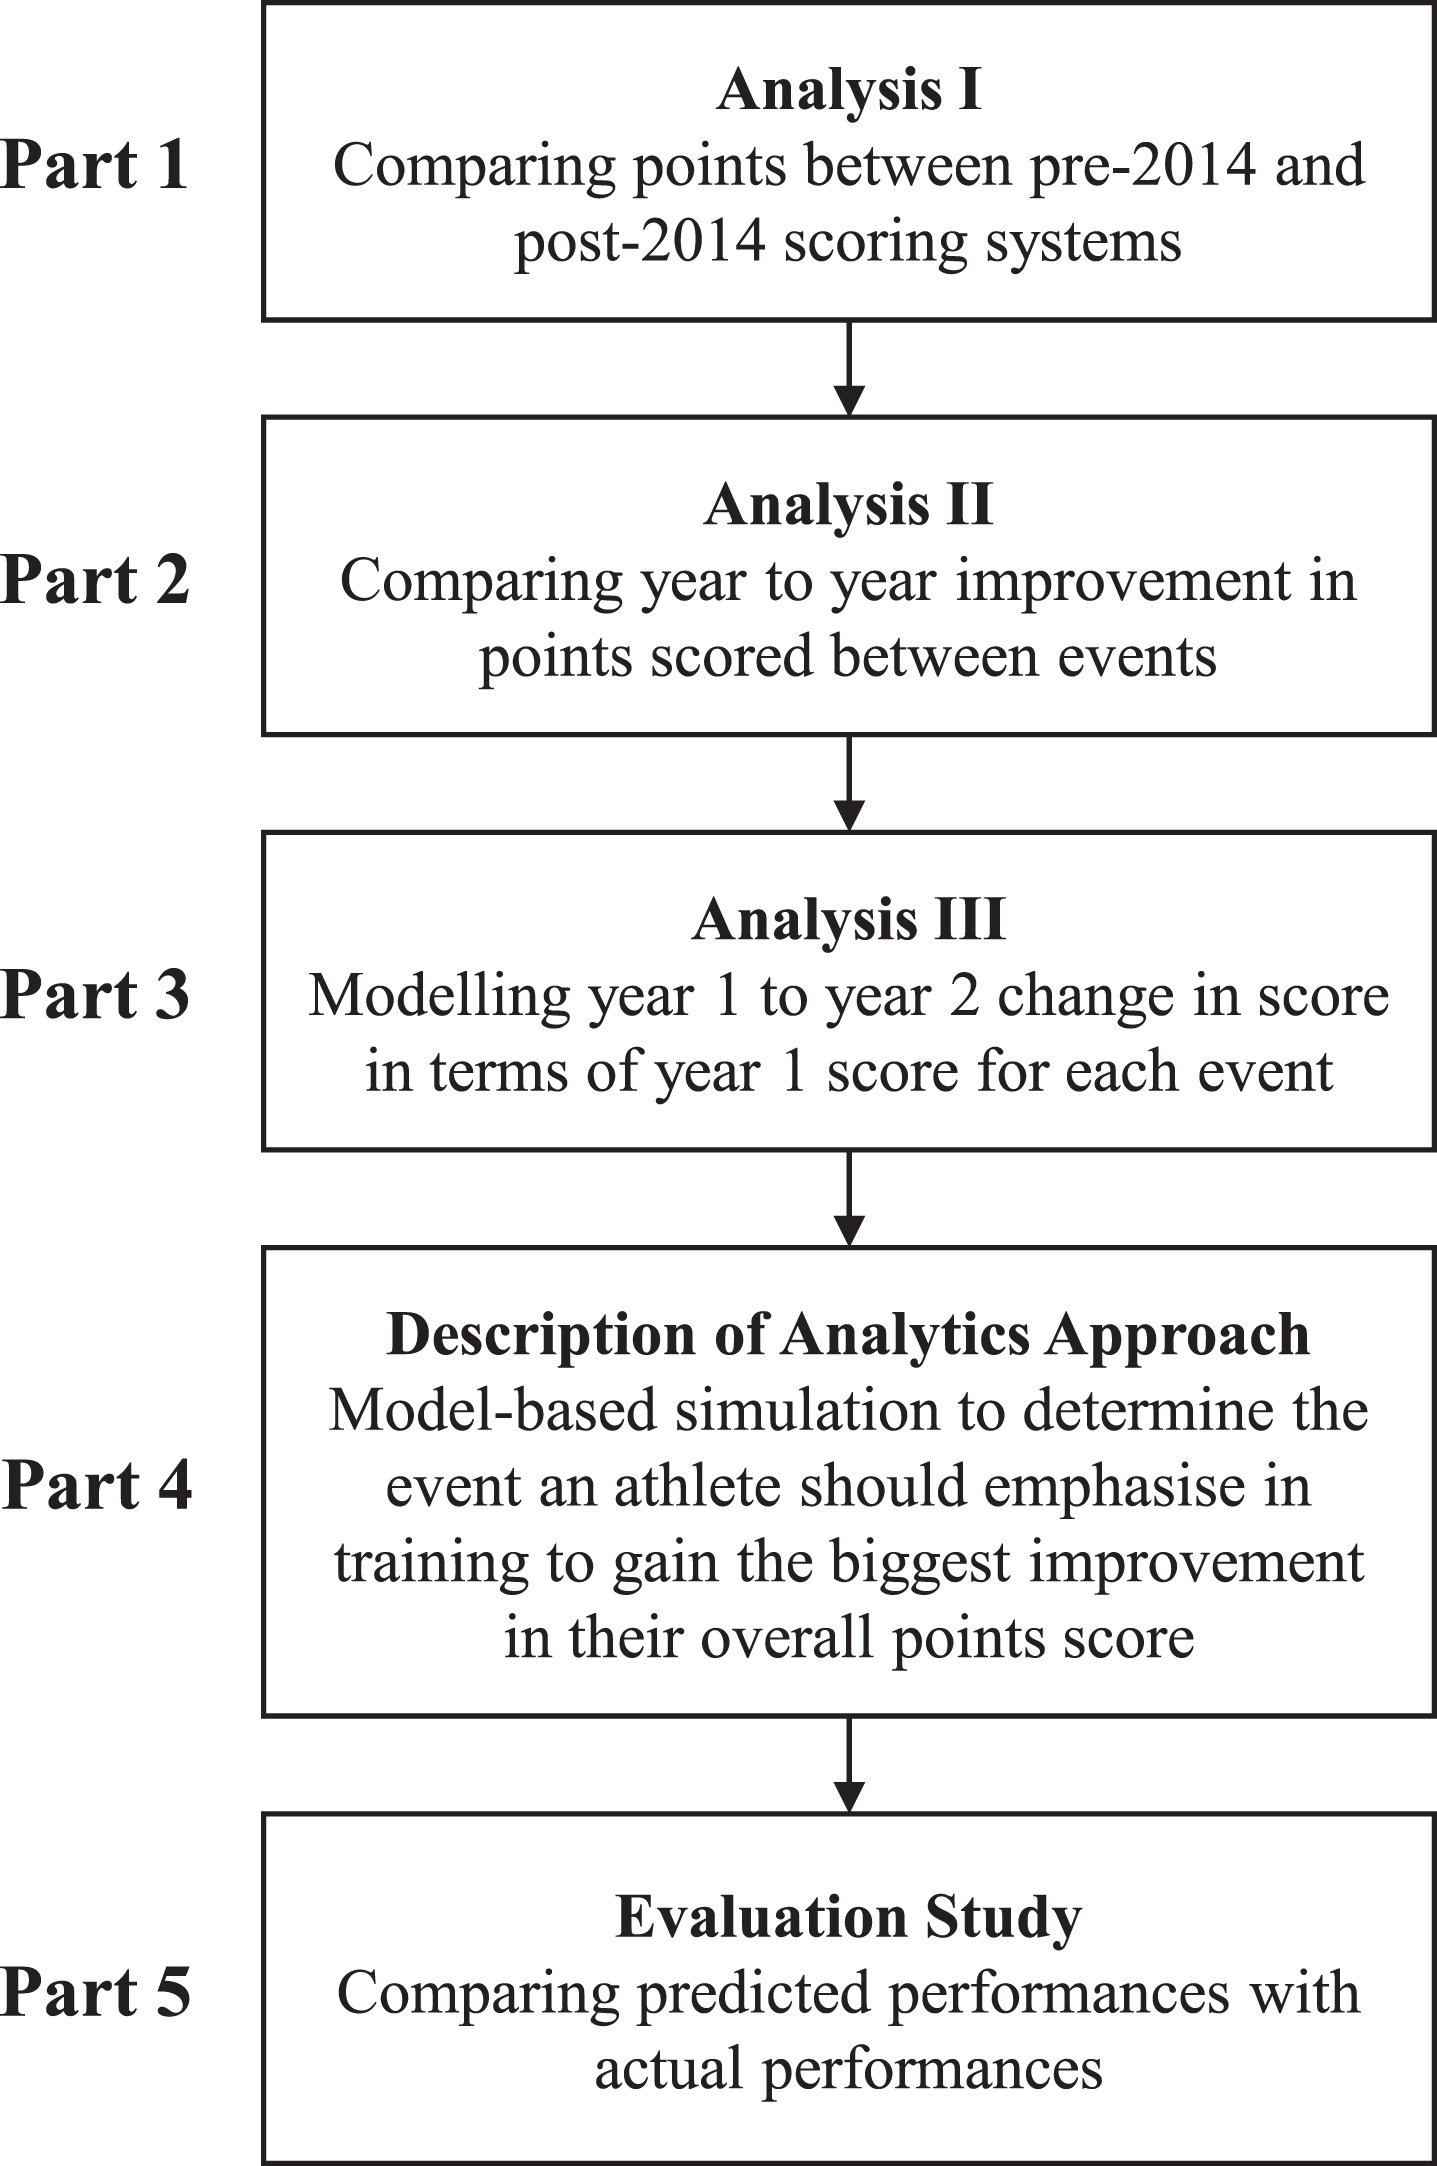
The research includes five parts as shown in Fig. 1. The first three parts analyse modern pentathlon data (Analysis I, II and III). Part 4 describes an approach to identifying the discipline a modern pentathlete should focus on, and Part 5 is an evaluation study. In Analysis I, women’s modern pentathlon performances under the current scoring system (2014–19) are compared with performances under the former scoring system (2009–13). This analyses the proportion of the total points scored coming from each discipline under the two scoring systems and examines the relationships between points scored in different pairs of disciplines. Analyses II and III as well as Parts 4 and 5 of the research are concerned solely with the currently used scoring system. Analysis II compares year to year change in womens’ performances in the between the disciplines of the modern pentathlon. It is also important to compare the variability in the change of points between different disciplines. Analysis III models year to year change in the points scored for each discipline in terms of performance level in the first of the two years. Part 4 is not a study like the first three parts. Instead Part 4 describes an approach to identifying the disciplines where female modern pentathletes can most improve their overall points score. This approach uses simulation to predict year to year change when different disciplines are emphasised in training. The simulation uses the models from the Analysis III as well as evidence about variability in year to year change in performance. The approach is intended to help female modern pentathletes make strategic decisions about disciplines to emphasise in training. Part 5 evaluates the approach to identifying the disciplines to be emphasised using year to year change for six modern pentathletes as examples. This considers the year to year changes predicted by the approach compared to the actual improvements made by these athletes. The paper is completed with an overall discussion and conclusions.
Fig. 1
The five parts of the research study.
2Analysis I: Comparing the current scoring system with the former scoring system
2.1Purpose
The current scoring system has been used in the modern pentathlon since 2014 and transforms performances in the four disciplines into points which are added together to give the total points score. The former system was used up to 2013 and operates in a similar manner but produces different values for points. Indeed the ranges of values used in the two scoring systems are very different. The purpose of Analysis I is to compare the percentage of athletes’ total points score that is derived from each discipline under the two scoring systems to see if any events contribute significantly more under the current scoring system than they did under the former scoring system.
The null hypothesis of Analysis I is that there is no significant difference between the percentage of the total points score derived from any discipline between the current and former scoring systems. The alternative hypothesis is that, for one or more disciplines, the percentage of the total points score coming from that discipline differs between the current and former scoring systems.
2.2Methods
2.2.1Data collection
All of the studies conducted in this research paper were granted ethical approval by the School of Sport and Health Sciences Research Ethics Committee at Cardiff Metropolitan University (Ethics code PGT-4410). Women’s modern pentathlon data were collected from the UIPM (Union Internationale de Pentathlon Moderne) website (UIPM, 2020). These included results of the Olympic Games, World Cups, and World Championships from 2009 to 2019. The variables included the athlete name, athlete nationality, year of competition, performance for each discipline, points for each discipline and overall points. There was a total of 5,519 performance records from 524 different athletes. Since the scoring system was changed in 2014, the performances were classified as operating under the former rules (2009–13) and under the current rules (2014–2019).
2.2.2Data cleaning
There were 237 performance records that were excluded from the investigation because they contained DNS (Did Not Start), DNF (Did Not Finish), DSQ (Disqualified), or non-scoring sections in at least one discipline. A further 2,318 records were removed because these performances were in qualifying rounds rather than finals; this reduced the data set to 2,964 records. The times for swimming, riding and the laser run, as well as wins and losses in fencing were converted into points using the functions applied in the scoring system used (UIMP, 2020). These calculated points for the disciplines were compared with the points recorded in the web data. This process revealed a range of differences from –10 to 40 points because a record from the UIMP data source did not indicate penalties or bonus rounds points. The following differences between the points in the UIPM data source and the calculated points were deemed acceptable with all records with differences outside these ranges being excluded:
• Swimming under the former rules: up to 40 points due to penalties
• Swimming under the current rules: 10 to 20 points due to penalties
• Fencing under the former rules: 10 to 20 points due to penalties
• Fencing under the current rules: –10 points due to bonus round points to 10 due to penalties
This resulted in 963 more performance records being excluded from the investigation. The sum of the points in the four disciplines was checked to ensure it was equal to the total points. After these data cleaning steps were completed, there were a total of 2001 records; 836 under the previous rules and 1165 under the current rules.
2.2.3Data analysis
The points for each discipline were converted into the percentage of the athlete’s total points score that were achieved in the discipline. This was done because the current scoring system awards a greater number of points than the former scoring system for the same performances. Once the data had been pre-processed they were analysed using SPSS Version 27 (SPSS: an IBM company, Armonk, NY). The percentages of the total points awarded in each discipline were compared between the two scoring systems, and presented as box plots. Kolmogorov-Smirnov tests showed that the points scored in fencing were normally distributed under both scoring systems (p > 0.05) and that swimming points were normally distributed under the previous scoring system (p > 0.05). However, the swimming points under the current scoring system were not normally distributed (p = 0.002) and neither were the riding or laser run points under either scoring system (p≤0.006). Therefore, a series of Mann Whitney U tests were used to compare the percentage of total points score coming from disciplines between the two scoring systems and Levene’s test was used to compare the consistency of this variable between the two scoring systems. A p value of less than 0.05 would indicate statistical significance for both of these tests. Cohen’s d was used to determine the effect size of any scoring system effect on the percentage of the total points scored that were derived from a discipline. The correlations between each pair of disciplines within the two scoring systems were analysed using Pearson’s r.
2.3Results
Figure 2 shows that, under each scoring system, more points come from the laser run than any other discipline. The box plots in Fig. 2 make the distribution of scores look similar between the two scoring systems. However, the percentage of the total points score coming from swimming and riding is significantly lower under the current scoring system than the former scoring system while the percentage of the total points score coming from the laser run is significantly greater under the current scoring system. The significance levels are shown in Table 1. Table 1 also shows that scoring system has a very large effect on the percentage of the total points score coming from each discipline (d≥1.44). Levene’s test of equality of variances shows that the percentage of the total points score coming from each discipline is significantly more consistent under the current scoring system than under the former scoring system.
Fig. 2
The percentage of the total points score derived from each discipline under the two scoring systems.
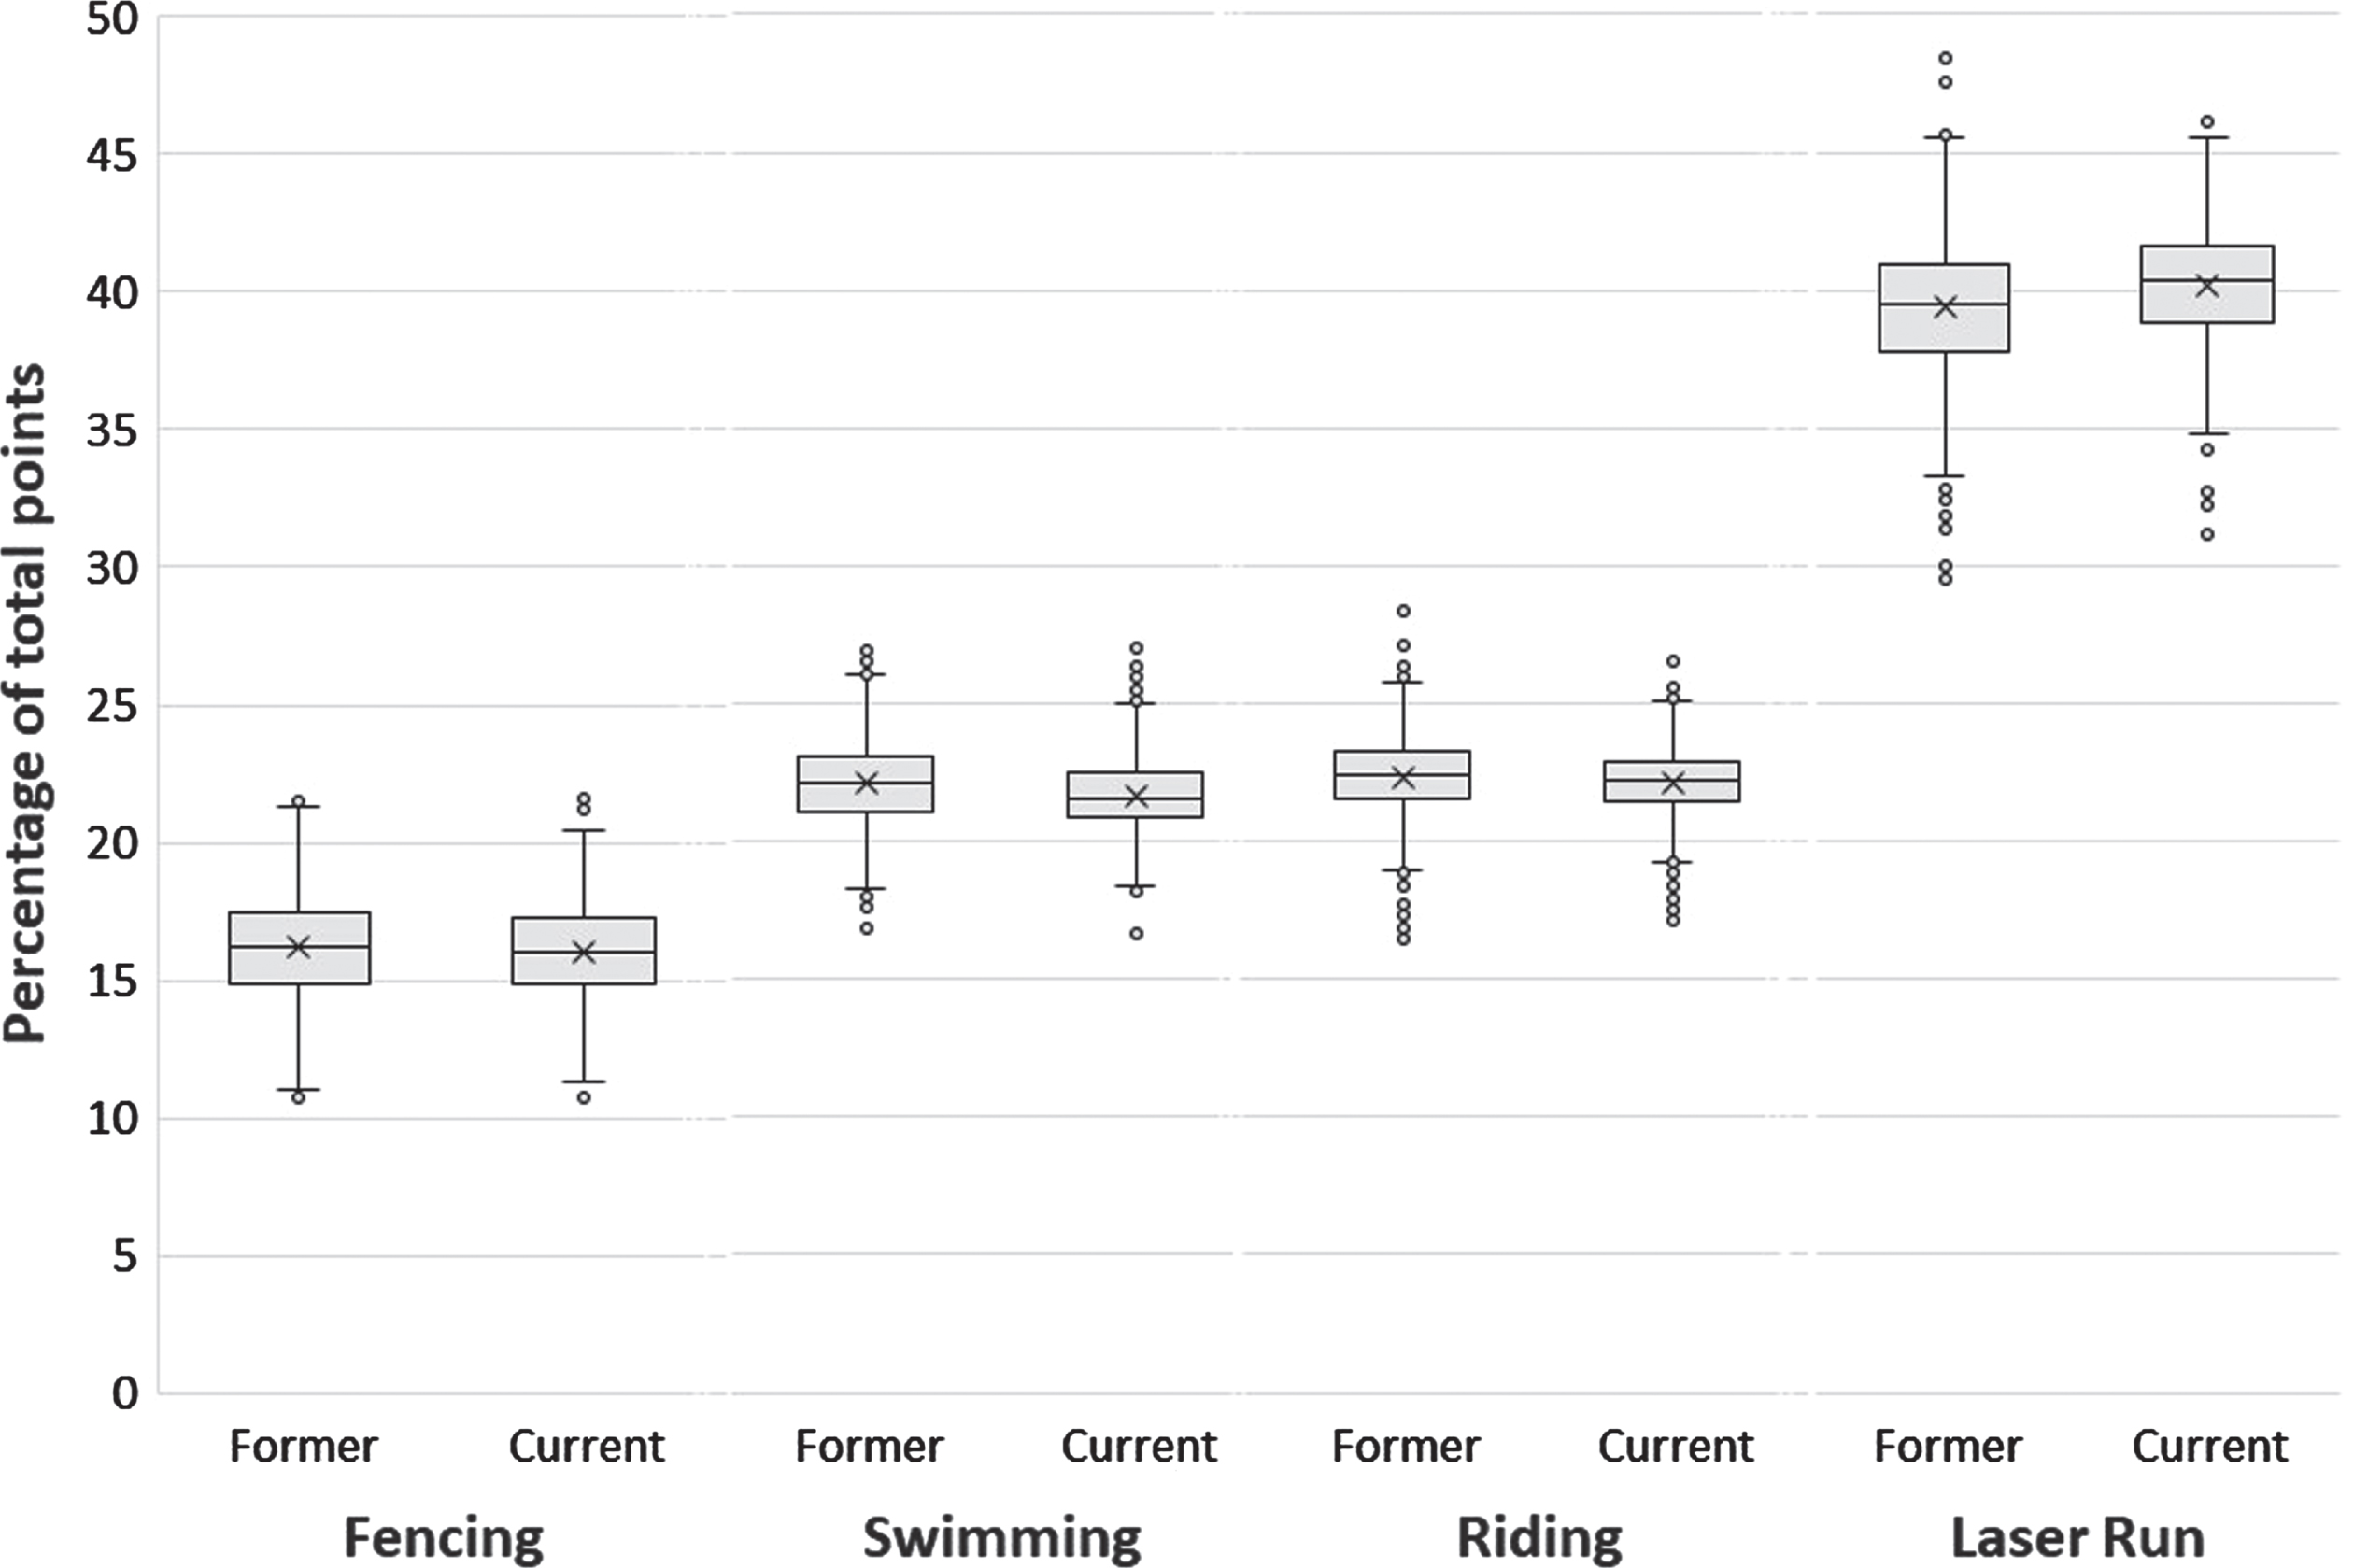
Table 1
Percentage of total points score achieved in each discipline (mean±SD)
| Discipline | Former | Current | p | p | Cohen’s d |
| (n = 836) | (n = 1165) | (Mann Whitney U test) | (Levene’s test) | ||
| Fencing | 16.17±1.91 | 16.03±1.74 | 0.077 | 0.077 | 1.81 |
| Swimming | 22.09±1.61 | 21.69±1.30 | < 0.001 | < 0.001 | 1.44 |
| Riding | 22.34±1.57 | 22.10±1.34 | < 0.001 | < 0.001 | 1.44 |
| Laser run | 39.40±2.44 | 40.18±2.10 | < 0.001 | < 0.001 | 2.25 |
Tables 2 and 3 show the correlation coefficients (Pearson’s r) between each pair of disciplines for under the former and current scoring systems respectively. The absolute correlations are very low under both scoring systems, with smaller absolute correlations being observed under the current scoring system in four out of six pairs of disciplines.
Table 2
Correlations between disciplines under the former scoring system (n = 836)
| Laser run | Riding | Swimming | |
| Fencing | +0.092 | +0.054 | +0.076 |
| Swimming | +0.042 | –0.001 | |
| Riding | +0.170 |
Table 3
Correlations between disciplines under the current scoring system (n = 1165)
| Laser run | Riding | Swimming | |
| Fencing | –0.020 | +0.064 | –0.019 |
| Swimming | –0.035 | +0.020 | |
| Riding | +0.089 |
2.4Summary
Analysis I found that the percentage of points coming from the four events differed from the ideal 20:20:20:40 split with the lowest contribution coming from fencing. The current scoring system has led to a slight reduction in the points coming from swimming and riding and an increase in the laser run. This has brought the points coming from these three events closer to the ideal 20:20:40 split. However, the contribution from fencing has reduced further below the ideal 20%. The modern pentathlon requires athletes to be versatile as shown by the low correlations between the events. All of the absolute correlations in the data from the current scoring system were less than 0.1.
3Analysis II: Comparing the year to year changes in points awarded between the different disciplines
3.1Purpose
Analysis I described the distribution of the percentage of the total points score that came from each discipline. A wider spread of points being observed in one discipline than the others does not necessarily mean that this would be the discipline where athletes are most likely to improve. Therefore, Analysis II compares the year to year improvement made in each discipline. This uses the actual number of points awarded in the disciplines rather than the percentage of the total points score that comes each discipline. The scope of this second study is restricted to performances that used the current scoring system.
The null hypothesis for Analysis II is that there is no significant difference in the year to year change in the points awarded between different disciplines. The alternative hypothesis is that discipline does have a significant effect on the year to year change in points awarded.
3.2Methods
3.2.1Data Set
A second version of the data set for the current scoring system was compiled containing pairs of women’s performances by the same athletes in consecutive calendar years. Any athlete who had performances included in the first study that were performed in consecutive years was considered for conclusion in this second study. Where an athlete had more than one performance in a given calendar year in the data set, the one with the highest total points score was considered for the current investigation. This assumed that the higher score was more representative of the athlete’s ability. There were 296 instances where athletes had more than one performance in the same calendar year. In 189 of these instances, the athlete’s best performance was there last performance of the year within our data set. This may reflect a tendency for athletes to peak at the climax of the season. There were 253 pairs of performances in consecutive calendar years by the same athletes. The second year performance in some of these records was the same as the first year performance in other records where athletes had complete modern pentathlon performances in more than two consecutive calendar years included in the first study.
3.2.2Data analysis
The data were analysed using SPSS Version 27. There were 4 extreme values for year to year improvement in riding and 1 for swimming within the set of 253 year to year records. When these cases were removed, it reduced the variability of these two variables, but this meant that two new cases became extreme values, 1 for year to year improvement in riding and 1 in swimming. After these were removed and variability in the data was explored once more, there was one final extreme value in swimming that needed to be removed. When this was removed, the 245 remaining year to year records did not contain any extreme values in the year to year differences in points awarded for any discipline. There were, however, two year to year records where the initial points scores for riding were extreme values. These were removed leaving 243 cases for the analysis of year to year change. Kolmogorov-Smirnov tests revealed that the year to year differences for the laser run were normally distributed (p > 0.05), but this was not the case for the other three disciplines (p≤0.012).
Box plots were used to show the range of change in the scores from one year to the next for the four disciplines. Correlations were also determined between each pair of disciplines for year to year change in points score. A Friedman test was used to determine if there was a significant effect of discipline on year to year change in points score. Partial eta squared was used to determine the effect size. If a significant effect was found by the Friedman test (p < 0.05), Bonferroni adjusted post Wilcoxon signed ranks tests were used to compare year to year improvement between each pair of disciplines. A significant difference between pairs of disciplines would be concluded if p was less than 0.008. The spread of year to year differences were compared between each pair of disciplines using a series of Levene’s tests of homogeneity of variances. A significant difference in spread of year to year differences was concluded between pair of disciplines where Levene’s test resulted in a p value of less than 0.05.
3.3Results
Figure 3 shows the year to year change in the points scored in the four disciplines. A Friedman test revealed a significant difference between disciplines for the year to year change (
Fig. 3
Year to year improvement in points scored in the four disciplines (n = 243).
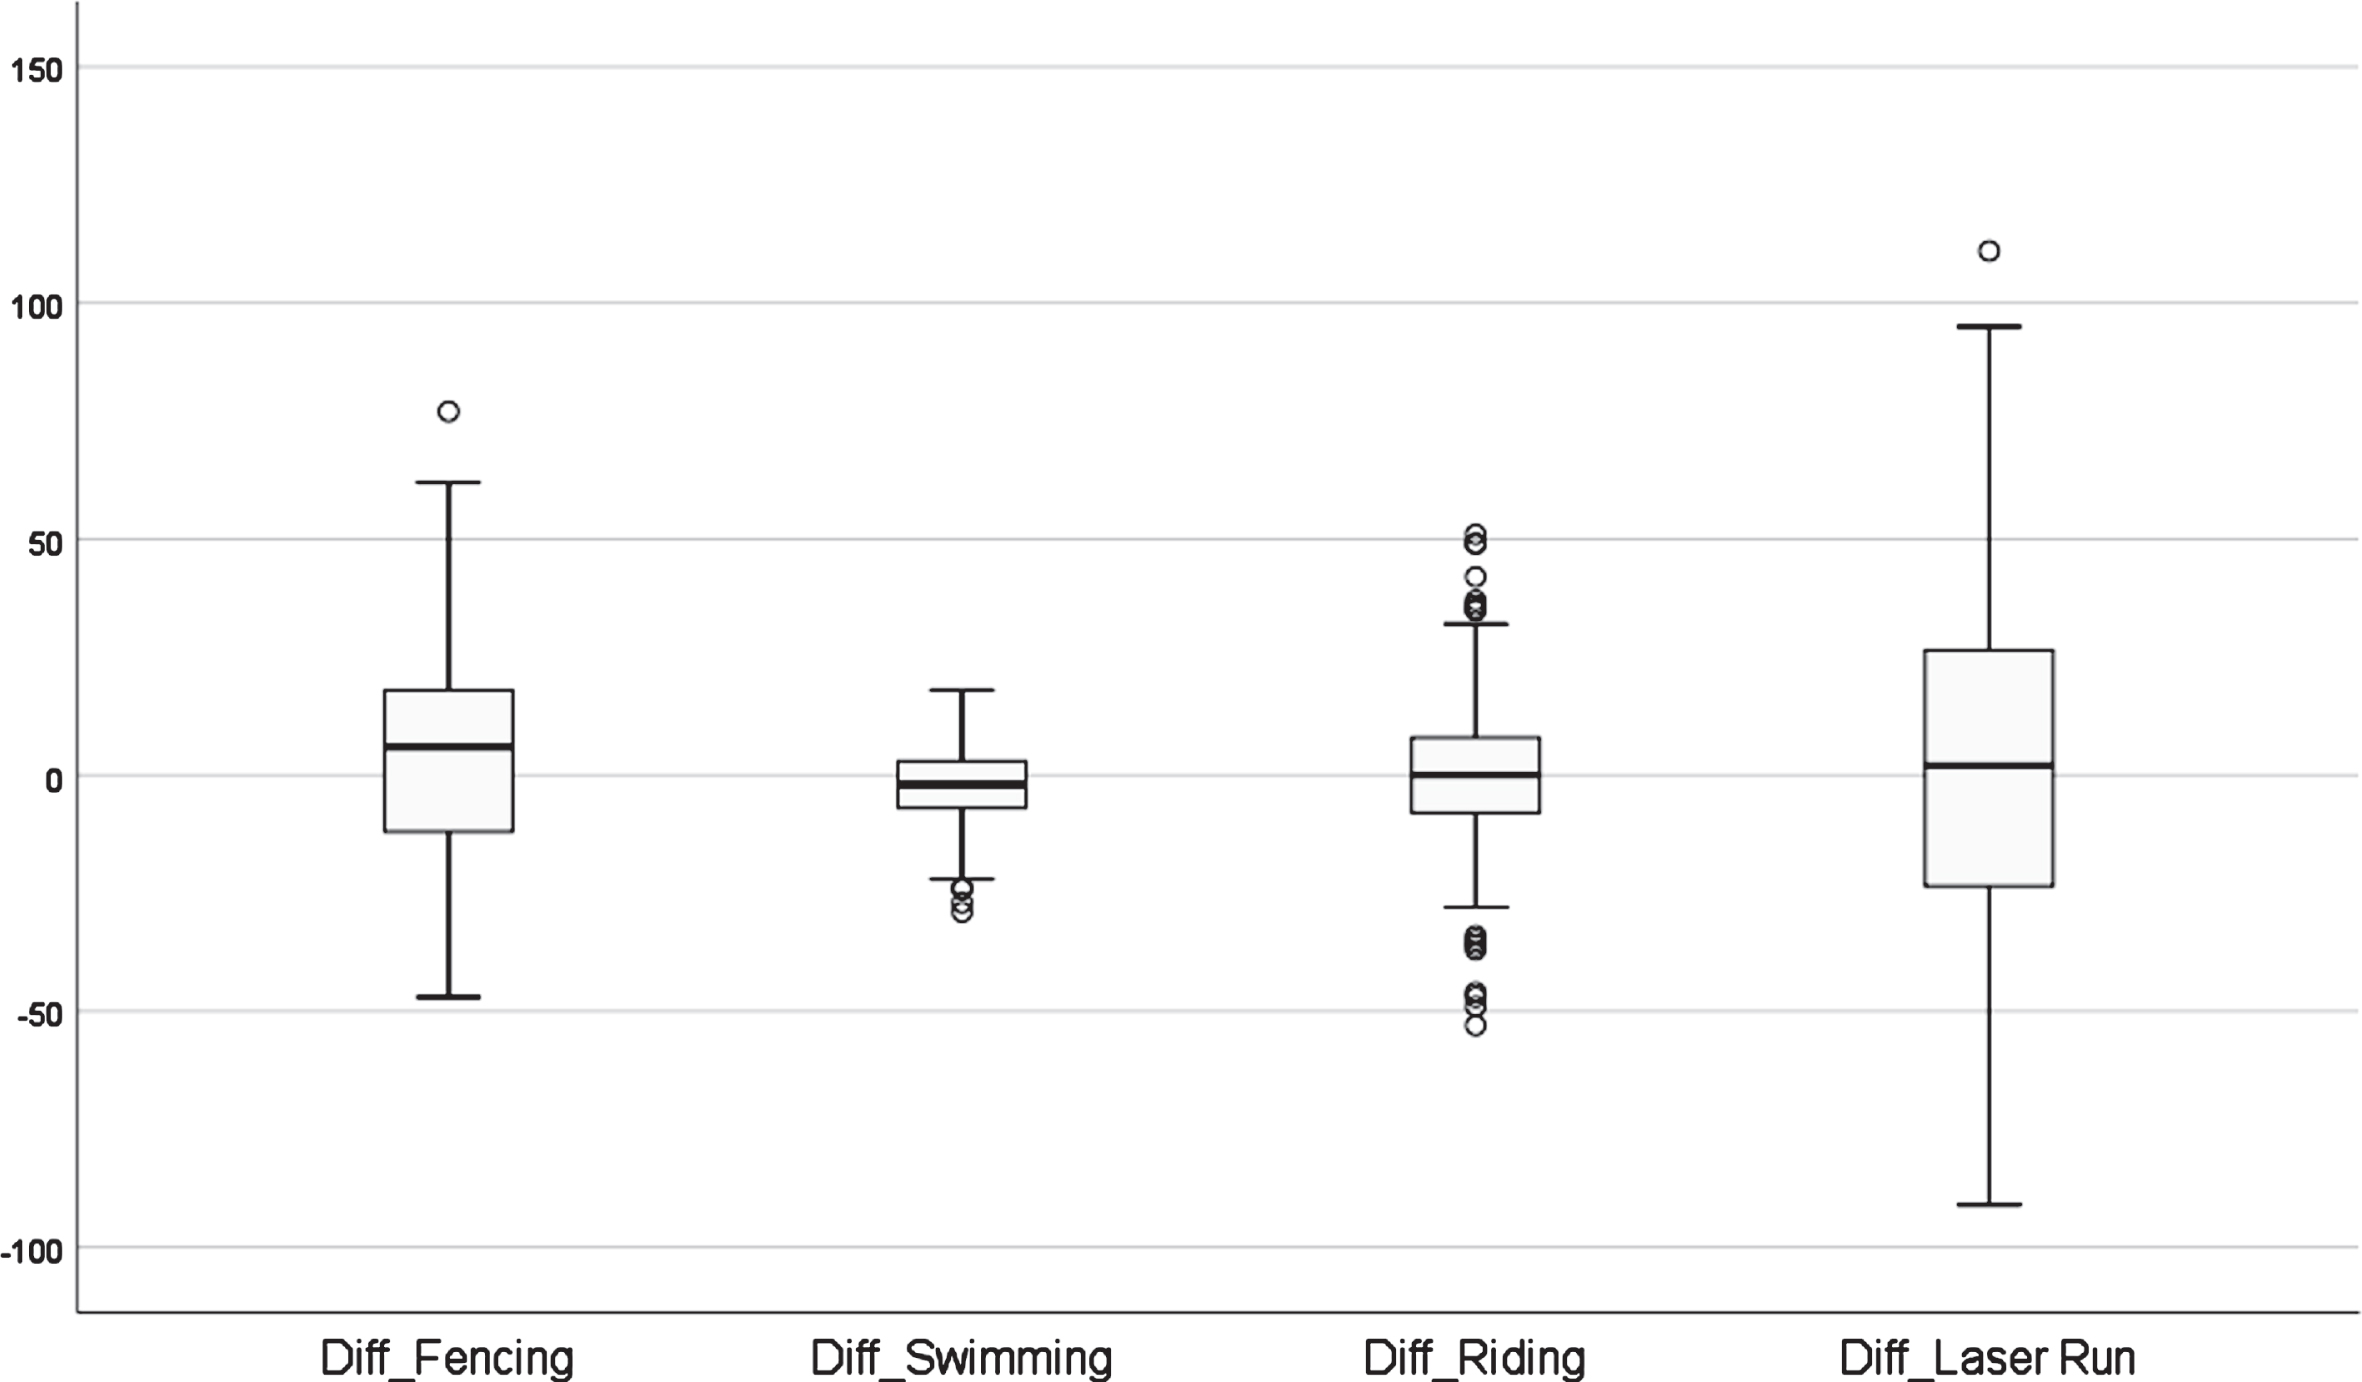
Table 4
Correlations between year to year change score in disciplines under the current scoring system (n = 243)
| Laser run | Riding | Swimming | |
| Fencing | –0.090 | +0.020 | –0.101 |
| Swimming | +0.387 | –0.042 | |
| Riding | –0.014 |
3.4Summary
Year to year improvement on average is higher in fencing than the other disciplines. The spread of year to year change values show that some athletes improve their score in a given event while others get lower scores. The range of values for year to year change is greatest in the laser run, followed by fencing, riding and swimming. An athlete’s score change in one event is unrelated to any other events except for riding and swimming where the correlation is +0.387.
4Analysis III: Modelling year to year improvement in each discipline
4.1Purpose
The purpose of Analysis III was to use regression techniques to determine predictive models of year to year change in each discipline based on the initial points in each discipline in the first of the two years. Initially data needed to be explored to determine if there were any multivariate relationships between disciplines and also the nature of any relationships between year to year change in a discipline and any individual predictor variable. The null hypothesis was that there would be no significant predictive model for year to year change in any of the disciplines. The alternative hypothesis was that there would be a significant predictive model for year to year change in at least one of the disciplines.
4.2Methods
Year to year change in points in each discipline was modelled in terms the initial points (the points from the previous year). This is necessary because the level of improvement that is possible may differ between those with weaker initial scores and those with stronger initial scores; for example those with stronger initial scores may have less scope for improvement. This was done using the 243 pairs of performances in consecutive years that were analysed in Analysis II. Where the absolute correlation between year to year improvement for a discipline and any candidate independent variable was 0.387 or greater (r2 being 0.15 or greater), the model was created entering the variable. Hence some year to year change variables could be modelled in terms of more than one independent variable. Initially, curve fitting was used to explore the relationship between year to year change and each candidate independent variable. This would determine if any relationship between variables were linear, logarithmic, inverse, quadratic or cubic. Once this was done, any independent variables with non-linear relationships with the dependent year to year change variable were transformed. Then regression analysis was applied to each year to year change variable in turn, including any candidate independent variables. Where the regression analysis produced more than one significant model, the most significant model was chosen. This model would typically have the highest R2 value of the possible models. As we will see later in the results, all of the models would include a single independent variable each.
Regression modelling has assumptions that need to be satisfied by the modelling data if the simulation is to simulate variability using a normal distribution. Firstly, there need to be enough cases for the number of different independent variables used. This was easily satisfied with 243 cases and each model using a single independent variable. The normality of the residuals was tested using Kolmogorov-Smirnov tests as well as the z scores for skewness and kurtosis. There would be evidence of deviation from a normal distribution where either of these z scores were outside the range –1.96 to +1.96 (Ntoumanis, 2001). Finally, homoscedasticity of the residuals was tested by determining the correlations between predicted values and residual values as well as between predicted values and absolute residual values. All of the modelling and assumption testing was done in SPSS Version 27.
4.3Results
Absolute correlations between the previous year’s points and year to year change in points were only greater or equal to than 0.387 (r2 > = 0.15) where the two values were for the same event. Therefore, multivariate models of year to year change in points could not be produced. Exploratory curve fitting revealed that the strongest models between year to year change for a discipline and the previous year’s points for the discipline were for linear models for each discipline except the laser run where an inverse relationship gave the most significant model. Table 5 summarises the relationship between year to year change and the points achieved in the first of the two years. There were significant negative correlations between year to year change and initial points score indicating that the higher an athlete’s initial score, the harder it is for them to improve. There were no correlations between year to year change in a discipline and initial value for any other discipline that exceeded an absolute value of 0.387 (r2 = 0.15) (–0.259≤r≤+0.094). Therefore, the year to year improvement for each discipline was modelled solely using the initial points score for that discipline.
Table 5
Modelling year to year change in terms of initial points score (n = 243)
| Discipline | Year to | Correlation | Model | Significance | b0 | b1 |
| year | between | of model | (constant) | |||
| difference | year to year | |||||
| (mean±SD) | change and | |||||
| initial points | ||||||
| score | ||||||
| Fencing | +5.1±23.6 | –0.501 | Linear | p < 0.001 | 99.036 | –0.448 |
| Swimming | –2.1±8.2 | –0.414 | Linear | p < 0.001 | 58.471 | –0.217 |
| Riding | +0.1±15.6 | –0.716 | Linear | p < 0.001 | 277.334 | –0.959 |
| Laser run | +3.9±38.1 | –0.574 | Inverse | p < 0.001 | –323.126 | 170820.126 |
Table 6 shows that the residuals for swimming were normally distributed. However, the residuals for the other three disciplines cannot be considered as normally distributed. Residuals for fencing are positively skewed, residuals for riding are negatively skewed and leptokurtic, and the residuals for the laser run are negatively skewed. Therefore, rather than assuming normally distributed residuals when simulating year to year improvement, the actual distribution of residuals is used.
Table 6
Normality and homoscedasticity of residuals
| Discipline | Residual Mean ±SD | p(Kolmogorov-residual) | zSkew | zKurt | r (predicted v abs residual) | r (predicted v Smirnov) |
| Fencing | 0.00±20.34 | 0.200 | +2.130 | +0.003 | 0.000 | +0.025 |
| Swimming | 0.00±7.43 | 0.200 | +0.308 | +0.261 | 0.000 | –0.229 |
| Riding | 0.00±10.85 | < 0.001 | –10.115 | +9.414 | 0.000 | +0.048 |
| Laser run | 0.00±30.97 | 0.200 | –3.289 | +1.260 | 0.000 | +0.097 |
4.4Summary
The year to year change in score for each event was modelled in terms of the previous year’s points for the same discipline. This univariate approach was necessitated because the year to year change in score for each event was not sufficiently correlated with the previous year’s scores for any other discipline (r2 < 0.15). The univariate models were all linear except for the laser model which was an inverse model. The residual values for three of the events were not normally distributed meaning that the normal distribution could not be used within a simulation of performance to be done in Parts 4 and 5.
5Part 4. An approach to identifying the disciplines where the greatest points gains can be made
5.1Purpose
Part 4 does not test formal research hypotheses in the way that Analyses I, II and III did. Instead, it proposes and illustrates an approach to making strategic decisions about preparation for modern pentathlon competition. Ultimately, an athlete wishes to make the best improvement they can to their overall points total. The purpose of this approach is to identify the discipline(s) where the greatest improvements in points can be achieved. This depends on the evidence about how much improvement is possible in each discipline for women’s modern pentathletes of the athlete’s ability. As Fig. 3 shows, it is possible that year to year change may be negative and that the level of improvement being aimed for might not be achieved, even in events being emphasised in training. Therefore, simulation is used to represent the variability in year to year change that is shown in Fig. 3.
5.2Representing variability in year to year change
The regression models shown in Table 5 are applied to an athlete of interest to predict their year to year change as well as determine the potential variability about the predicted year to year change. Modern pentathlon performance is then simulated based on the initial performance level, predicted year to year change and applying the evidenced variability in each discipline to produce a range of total points scores. Disciplines can be experimented with to simulate emphasis being made on them during training. This is the most important aspect of the approach because it allows simulation results to be compared between situations where different disciplines are emphasised. This type of simulation is suitable because it allows us to place emphasis on different disciplines allowing overall effect of such emphasis to be studied (Dinnie and O’Donoghue, 2020). The resulting information can assist female modern pentathletes and their coaches to make informed decisions about which disciplines to concentrate on most.
The magnitude of the residual values for year to year change in swimming is negatively correlated with the predicted value as shown in Table 6 (r = –0.229). Essentially, the more an athlete is expected to improve from one year to next at swimming, the less variability we expect in that year to year improvement. Splitting the 243 pairs of year to year performances into three equal thirds ordered on predicted value shows that the standard deviation of the residual values is 8.640 to 6.997 to 6.356 for the first 81, second 81 and third 81 cases of ordered data respectively. The mean predicted values for these thirds of the data are –5.807, –1.901 and 1.474 respectively. A crude linear regression applied to these values suggests that the standard deviation that should be applied to the residual values for year to year improvement in swimming should be as shown in Equation (1).
(1)
Applying this equation to the predicted values for year to year change for swimming gives a range of standard deviations from 4.182, for the athlete predicted to improve the most in swimming points, to 10.781, for the athlete expected to improve least.
5.3Simulation (without emphasising any disciplines)
The approach involves applying the regression model to an individual athlete. This is illustrated using Sehee Kim of Korea as an example. Her best performances in 2018 and 2019 are shown in Table 7. The regression equations shown in Table 5 were used to determine the predicted year to year change from 2018 to 2019.
A Microsoft Excel spreadsheet was programmed to simulate 2019 performance for the athlete 1000 times. In each of these simulations, a residual value was chosen at random for fencing, riding and the laser run from the 243 residual values for these disciplines that were determined in Analysis III. Each residual value had an equal chance of being chosen.
It was necessary to truncate the simulated performances for riding to ensure they did not exceed the maximum of 300 points. An exploratory analysis added the predicted year to year change for each of the 243 athletes used in Study 3 to determine the 243 predicted values for this discipline. The full set of 243 residuals for year to year change were added to each of these values to give 59,049 simulated values for year two swimming points. These values ranged from 245 to 302 points after rounding with 4.16% of the values being greater than 300. Given the low percentage of values that exceeded the maximum of 300 and the relatively small extent to which they exceeded the maximum, it was decided to simply truncate riding values to 300 if the simulated value exceeded 300.
An extended version of this process was used with swimming because the variability of the residuals had to be scaled depending on the athlete’s predicted performance for this discipline. When equation (1) is applied to the predicted year to year change value of –2.07 for Sehee Kim, we get a standard deviation to be used of 7.33. Table 6 shows that the standard deviation of the residual values for year to year change in swimming is 7.43. Therefore, the residuals for swimming needed to be multiplied by a factor of 7.33 / 7.43 when used to simulate year to year change in swimming for this athlete. Table 7 shows that there is a range of predicted performances with the mean simulated performance being 1296 points which is short of the 1321 points the athlete actually achieved in 2019. However, 247 of the 1000 simulations did predict a points total of 1321 or higher. It is worth considering that the data used in this paper contains four 2018 and two 2019 performances for Sehee Kim. In 2018, her overall performance improved over the year from 1155, to 1219, 1251 and finally 1279. Similarly, her best performance of 2019 was the second of her two performances in the data (1278 and 1321). The predicted 1296 points sits between her two performances in 2019.
Table 7
Actual and simulated performances for Sehee Kim without emphasising disciplines
| Discipline | Actual | Predicted | Simulated 2019 performances | |||
| Performance | change | (n = 1000) | ||||
| 2018 | 2019 | Mean±SD | Minimum | Maximum | ||
| Fencing | 208 | 223 | –2.47 | 206.0±20.8 | 157 | 266 |
| Swimming | 279 | 272 | –2.07 | 276.9±7.3 | 256 | 297 |
| Riding | 292 | 296 | –2.69 | 289.4±11.0 | 247 | 300 |
| Laser run | 515 | 530 | +8.56 | 523.5±31.5 | 428 | 593 |
| Total | 1294 | 1321 | 1295.8±40.3 | 1158 | 1411 | |
5.4Simulation (experimenting with different disciplines)
The next stage of the approach experimented with different disciplines to determine the impact that emphasising these would have on the simulated performances of an athlete. The initial simulations for Sehee Kim, that are summarised in Table 7, gave each of the 243 residual values for a discipline an equal chance of being added to the athlete’s predicted score. Hence a uniform probability distribution was applied to determine the row of the ordered residual table to look up (1 to 243). Emphasising an individual discipline was represented by changing this uniform distribution to a sloped uniform distribution as illustrated in Fig. 4. Let N be the number of residuals being used in the simulation process (in our case 243). The probability distribution is actually a finite discrete distribution of N values, as shown by the columns in the background of Fig. 4. The probabilities increase with a uniform interval allowing the probabilities to be calculated using a straight line that passes through the mid-points at the tops of the columns. The “bias” for a discipline is the probability that an athlete’s year to year change for a discipline (not including the predicted improvement according to the given regression model) will be in the top 50% of the residual values for the discipline. Therefore, a bias of 0.5 is represented by a standard uniform distribution, as shown in Fig. 4, with each residual having a probability of 1/N of being used in the simulation. The maximum bias used in this approach is 0.75 meaning that higher residual values are more likely to be selected than lower residual values. The reason for 0.75 being the maximum is that this probability for the top half of residual values is achieved by a sloped uniform distribution running from the (row location, probability) co-ordinates (1,0) to (N, 2/N) with a gradient of 2 / (N(N-1)). Figure 4 uses the term “gradient factor” which is the gradient multiplied by N(N-1). If the gradient factor were any greater than 2, the sloped uniform distribution would be suggesting negative probabilities for the lowest residual values. With the gradient factor of 2, the lowest residual has a 0 probability of being selected at random, the highest residual has a 2/N probability of being selected at random with the ith residual having a probability being determined by the equation of this line. The gradient and intercept of the equation of the sloped uniform distribution are given in equations (2) and (3) respectively. These are determined using the bias that has been applied.
Fig. 4
Use of a sloped uniform distribution to represent emphasis on a discipline during training.
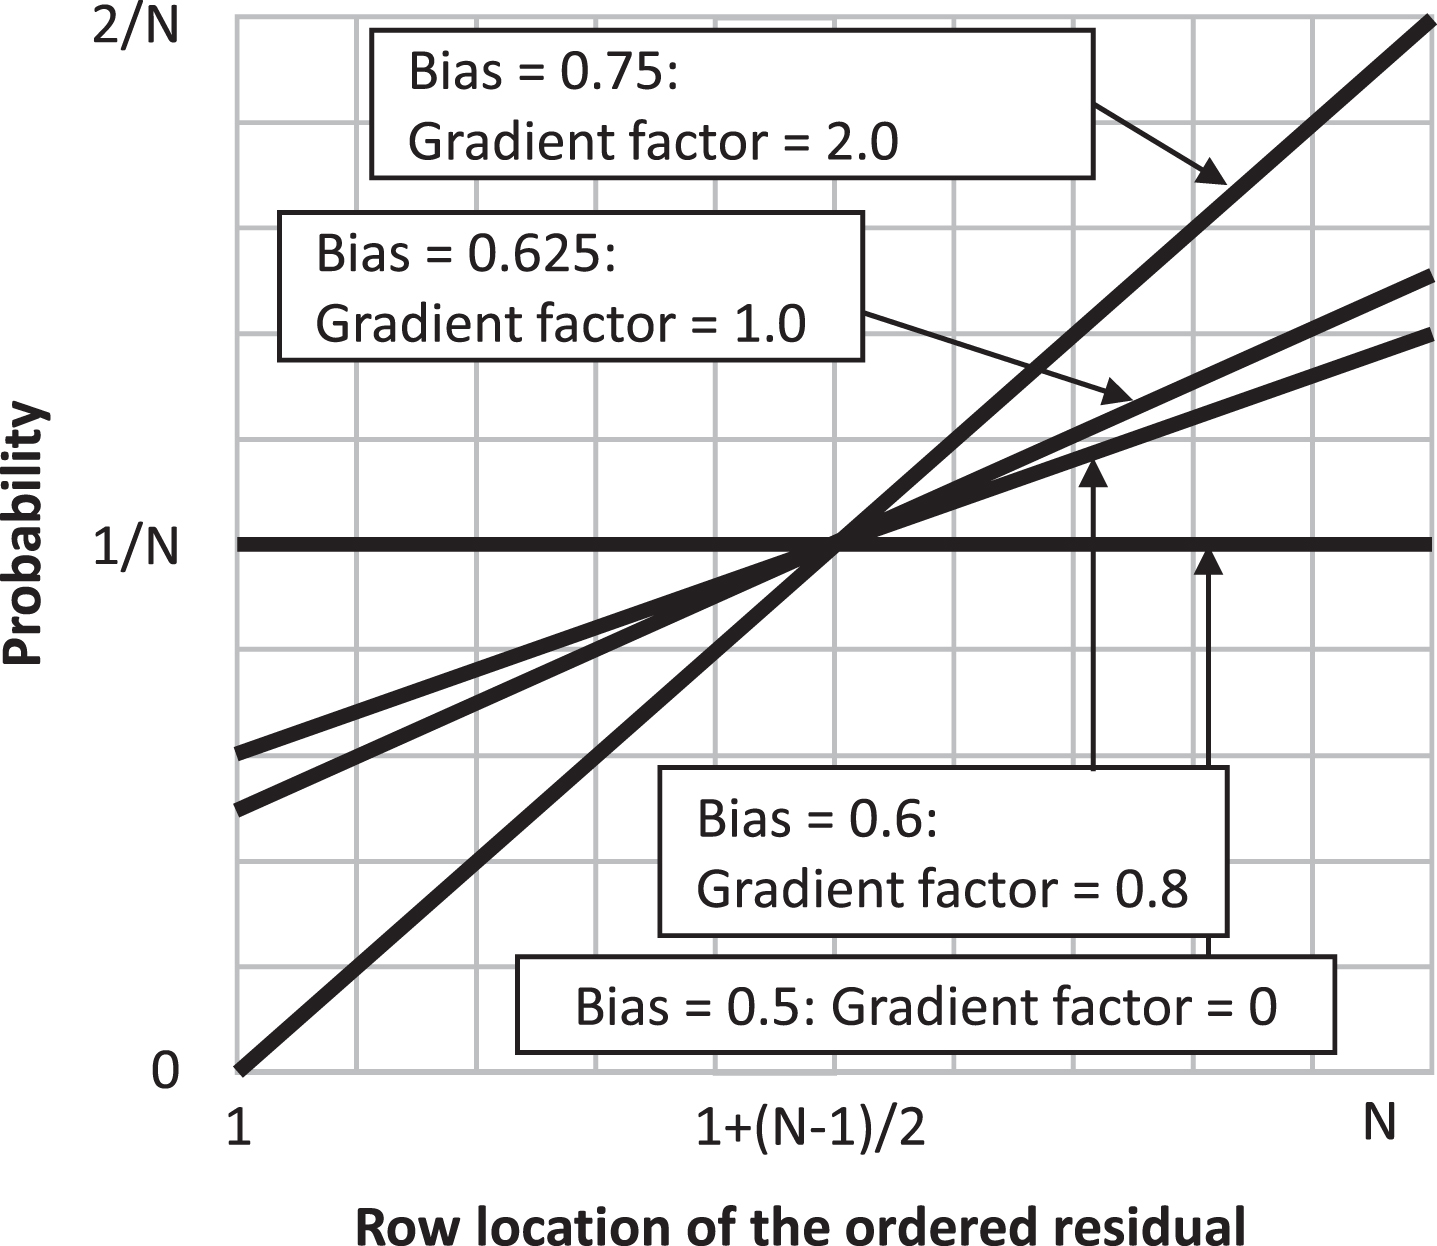
A bias of 0.75 means that the area under the line from 1 + 0.5(N-1) to N must be 0.75. Therefore, the line must pass through the co-ordinate (1 + 0.75(N-1), 1.5/N) if this is a sloped uniform distribution. The bias of 0.75 also means that the area under the line from 0 to 1 + 0.5(N-1) must be 0.25. Therefore, the line must pass through the co-ordinate (1 + 0.25(N-1), 0.5/N). In general, where we have a bias between 0.5 and 0.75, the line must pass through the co-ordinates (1 + 0.25(N-1), 2(1-Bias)/N) and (1 + 0.75(N-1), 2 Bias/N). The gradient of a straight line between these points is as shown in equation (2).
Any sloped uniform distribution based on a bias between 0.5 and 0.75 must pass through the co-ordinate (1 + 0.5(N-1), 1/N) for the total area of the N columns to be 1. This in combination with the gradient shown in equation (2) allows us to determine the constant (intercept) of the line. This is the probability for a 0th row in the ordered residual table and is given by equation (3). Where the bias is 0.75 and the gradient is 0.000034 (gradient factor is 2), this gives a small negative number (–0.000034) allowing the probability for the 1st row of the ordered residual table to be 0.
(2)
(3)
The simulator was programmed to apply the sloped uniform distribution to determine the row location of the residual to be applied. The user enters a value of 0.5 for the bias for any discipline not to be emphasised any more than usual in training and a value between 0.51 and 0.75 for a discipline to receive special emphasis in training. Table 8 compares the points simulated for Sehee Kim when each of the disciplines are emphasised with different biases. Biases of 0.75 are used with each of the disciplines being emphasised with the others remaining with biases of 0.5. However, the laser run combines running and pistol shooting and may therefore require greater emphasis to give the same probability of being in the top half of year to year change values than would be the case in the other disciplines. Therefore, the laser run was simulated using a bias of 0.625.
Table 8
Simulated points for Sehee Kim when emphasising different disciplines (mean±SD)
| Discipline | Discipline being emphasized in training | |||||
| None | Fencing | Swimming | Riding | Laser run | Laser run | |
| Bias = 0.75 | Bias = 0.75 | Bias = 0.75 | Bias = 0.75 | Bias = 0.625 | ||
| Fencing | 206.0±20.8 | 217.5±18.4 | 205.6±20.4 | 206.8±20.2 | 206.3±20.1 | 206.7±21.2 |
| Swimming | 276.9±7.3 | 276.9±7.4 | 281.4±6.2 | 277.1±7.8 | 276.7±7.6 | 277.5±7.5 |
| Riding | 289.4±11.0 | 289.3±10.7 | 289.2±10.7 | 294.7±6.1 | 289.8±11.0 | 289.3±11.0 |
| Laser run | 523.5±31.5 | 523.1±30.7 | 524.5±30.5 | 522.8±31.4 | 540.2±23.3 | 531.8±28.8 |
| Total | 1295.8±40.3 | 1306.8±37.6 | 1300.6±39.0 | 1301.5±38.7 | 1312.3±33.1 | 1305.4±37.8 |
The simulations suggests that the two events where emphasis would have the greatest impact on Sehee Kim’s total points score are fencing and the laser run.
6Part 5. Evaluation Study
The simulation approach, described in Part 4, was applied to six different female athletes to determine the discipline to emphasise to best improve their total points score. These athletes were selected due to the variety of relative strengths and scope for improvement they had in different disciplines as well as for the range of improvements actually observed. For example, Misaki Uchida had a relatively low score for fencing in the initial year while Sophia Hernandez had a relatively low score for the laser run, Eevi Bengs had a relatively low score for swimming, and Aurora Tognetti had a relatively low score for riding. The results of the simulations are summarised in Table 9. Table 9 shows that irrespective of which discipline the athletes had their lowest scores in, the simulation process suggested the greatest improvement to points score would be achieved by emphasising fencing followed by the laser run. Considering the actual initial results and results a year later, Sehee Kim, Sunwoo Kim, Misaki Uchida, and Sophia Hernandez all improved their points in fencing and the laser run to a greater extent than they did in the other two disciplines. Eevi Bengs, despite apparently having the greatest potential to improve her score in swimming, made the greatest gains in fencing and riding. Aurora Tognetti did improve her points total by 49 points in riding achieving the maximum score of 300 in 2019. Her greatest points gain was, however, in the laser run.
Table 9
Simulated performances for six different athletes
| Variable | Athlete | |||||
| Name | Sehee | Sunwoo | Misaki | Sophia | Eevi | Aurora |
| Kim | Kim | Uchida | Hernandez | Bengs | Tognetti | |
| Years | 2018-19 | 2015-16 | 2017-18 | 2015-16 | 2014-15 | 2018-19 |
| First year | ||||||
| Fencing | 208 | 214 | 136 | 184 | 172 | 214 |
| Swimming | 279 | 280 | 290 | 248 | 233 | 267 |
| Riding | 292 | 286 | 272 | 300 | 257 | 251 |
| Laser run | 515 | 516 | 484 | 428 | 495 | 461 |
| Total | 1294 | 1296 | 1182 | 1160 | 1157 | 1193 |
| Second year | ||||||
| Fencing | 223 | 226 | 184 | 202 | 202 | 220 |
| Swimming | 272 | 287 | 288 | 255 | 234 | 277 |
| Riding | 296 | 293 | 293 | 293 | 286 | 300 |
| Laser run | 530 | 552 | 514 | 501 | 429 | 533 |
| Total | 1321 | 1358 | 1279 | 1251 | 1151 | 1330 |
| Simulated second year (mean±SD) | ||||||
| Emphasising fencing | 1306.8±40.3 | 1310.9±39.9 | 1266.7±39.3 | 1250.4±39.5 | 1243.7±38.8 | 1282.5±38.5 |
| Emphasising swimming | 1300.6±39.0 | 1303.5±40.6 | 1261.8±38.8 | 1243.1±39.7 | 1235.2±37.8 | 1273.5±38.5 |
| Emphasising riding | 1301.5±38.7 | 1302.8±37.6 | 1262.7±38.6 | 1245.6±38.6 | 1238.8±38.1 | 1277.3±38.6 |
| Emphasising laser run | 1305.4±37.8 | 1308.1±38.2 | 1264.6±39.8 | 1248.5±35.1 | 1240.1±37.1 | 1280.4±39.3 |
7Discussion
Analysis I found that the scoring system used has a significant and meaningful effect on the proportion of the total points score derived from each discipline. Therefore, coaches and athletes should make strategic decisions based on the most up-to-date rules and scoring system used in the sport. The currently used scoring system in the modern pentathlon results in a greater proportion of the total points score coming from the laser run than before while the other disciplines contributed to a lower proportion of the total points score than they did before 2014.
The four events of the modern pentathlon have low correlations. This is in contrast to what is seen in other multisports such as the heptathlon where factor analyses have identified performance dimensions with absolute correlations of greater than 0.7 with some disciplines (Gassmann et al., 2016; Dinnie and O’Donoghue, 2020). Similarly, the first two principal components derived from decathlon performances have absolute correlations greater than 0.7 with the points scored in more than one discipline each (Jayal et al., 2018). In the triathlon, swimming position and speed significantly correlate with cycling and running race position (Wu et al., 2014). The absence of such high correlations between pairs of disciplines in the modern pentathlon suggests that athletes in this sport need to be more versatile than athletes in the heptathlon, decathlon and triathlon. The International Modern Pentathlon Union (UIPM) has confirmed that horse riding will be removed from the modern pentathlon after the 2024 Olympic Games in Paris (Church, 2021). If horse riding is replaced by a discipline where performance is highly correlated with an existing discipline, the modern pentathlon may favour certain types of specialist athletes rather than more versatile athletes.
Table 1 shows that for the average modern pentathlete the largest proportion of their total points score comes from the laser run followed by riding, swimming and fencing. However, this does not reflect the true importance of each of these disciplines to the overall points score. If all of the athletes were scoring a similarly high number of points in a discipline then effort expended on this discipline would not have the same impact as effort expended on a discipline with higher variability in year to year improvement. It is high variability in performance that makes disciplines important, particularly variability in improvements that can be made in performance. Figure 3 shows that the laser run has the largest variability in year to year change. Part of the explanation for this may be because the laser run is usually the final discipline of the modern pentathlon and some athletes may not be as competitive as in earlier disciplines if their final finishing position has been largely determined by the previous disciplines. There is a tendency for variability due to negatively skewed distributions in the final discipline of other multisports. For example, most outliers in the 800 m of the heptathlon (Dinnie and O’Donoghue, 2020) and the 1500 m of the decathlon (Jayal et al., 2018) are where athletes have scored a low number of points in these disciplines. The points scored in the preceding disciplines are used to determine the time handicap used in the laser run. The handicaps applied to the athletes mean that the athlete finishing first in the laser run will be the winner of the overall modern pentathlete. The knowledge of position during the laser run means that athletes only need to run as fast as they need to in the last 800 m section to achieve the best position they can feasibly achieve. This means that athletes may not run as fast as they are capable of running in the final 800 m. A further factor explaining the high variability in year to year change in laser run performance is that the running courses used in this discipline may vary due to cross country type courses being used, with varying terrains, rather than standard athletics tracks. For example, rubberized surfaces have smaller impact forces for runners than asphalt and acrylic surfaces (Dixon et al., 2000). Running on harder surfaces also leads to increased leg stiffness compared to running on softer surfaces (Ferris et al., 1998). Surface can also effect the mechanics of running stride (Creagh et al., 1998). Much of the variability in the laser run may be explained by the fact that this discipline typically has higher points scores than the other disciplines. However, athletes and coaches must still recognise that, in absolute terms, improvements the laser run have a higher impact on the overall points total than similar rank improvements in other disciplines.
The discipline with the second highest variability in year to year change in points score is fencing. Thus even though fencing makes the lowest contribution to the overall points total for most athletes, it has much greater scope for athletes to improve their points total from one year to the next than riding or swimming. This disagrees with the findings of Le Meur et al. (2010) that riding was the second most impactful discipline after the laser run. The disagreement between the findings of Le Meur et al. (2010) and the current investigation can be explained by Le Meur et al.’s study being conducted on performances under the scoring system that applied at the time which was different to the currently used scoring system. A further factor that may explain the high variability in fencing performance is that the athletes have to compete against all of the other competitors. The athletes obviously cannot compete against themselves in fencing meaning that the best fencer will be competing with inferior fencers while the worst fence will be competing against superior fencers. Thus even though the sets of opponents are largely the same for each fencer, points scored for wins will differ between athletes the same way as they would be expected to do so in a round robin tournament in a team sport.
There is a greater variability in points scored in riding than swimming, both when variability is considered between different athletes and year to year improvement within the same athletes. This may be explained by athletes having to ride random horses. The analysis of variability in the current study agrees with previous research that concluded that swimming is the discipline with the lowest impact on the points total (Lee et al., 2020).
The current study found that irrespective of athletes’ abilities in the different disciplines, the greatest gains in the total points score would be achieved by emphasising the laser run in training. The only exceptions to this year to year change pattern in the evaluation study was for the athlete who’s overall points score decreased from one year to the next. This finding is explained by variance in year to year change in points being unrelated to athlete ability in three of the disciplines. This disagrees with approaches used in the decathlon (Jayal et al., 2018) and heptathlon (Dinnie and O’Donoghue, 2020) where higher ability was associated with lower variability in year to year improvement for most disciplines. The approach developed in the current paper suggests that heptathletes’ primary focus should be on the laser run. This is supported Le Meur et al.’s (2010) finding that the correlation between laser run ranking and world cup ranking was higher than other events. Preparation for the laser run needs to optimise the elements of shooting accuracy and speed in this discipline (Madalena et al., 2020).
Fencing is the second most important discipline according to the current research. Therefore, modern pentathletes need to specifically prepare for the demands of this discipline including the technical demands (Lee et al., 2020) and physical demands (Wylde et al., 2013, 2014). A final point to make about any analytics approach is that decision making should not rely solely on quantitative analysis but should also consider training and competition context (Alamar, 2013).
There are some limitations in the approach used to identify the disciplines athletes have the most potential to improve their total points in. Firstly, there was a correlation of 0.387 between year to year improvement in swimming and the laser run (Table 4). This correlation between the year to year change in these disciplines was noted in the current research, but it could not be included in a predictive model due to the year to year improvements in events being unknown at the time the models would be applied in practice. However, when using the approach, biases above 50% could be applied to both of these disciplines given the knowledge of the relationship between them. The residual values used in the simulation are based on 243 year to year changes observed in international women’s modern pentathlon competition. The approach would be improved with a greater volume of year to year change data for athletes. A third limitation is the use of a sloped uniform distribution to determine the location of the residual to be applied within a simulated performance. This does allow a consistent method to compare the impact of emphasising certain disciplines in training. Therefore, the relative results of the simulations may be sound. However, if data were available where athletes reported which disciplines they gave special emphasis to between one year and the next, we might find that this results in a different distribution to a sloped uniform distribution. A further limitation was using the higher of two or more modern pentathlon performances in the same calendar year in the analysis of year to year improvement.
In conclusion, this study reveals that the scoring system used since 2014 has resulted in more consistent points scoring in all disciplines. The study has also found that performance in the four disciplines have low correlations with each other, suggesting modern pentathletes need to be more versatile than athletes in other multisports. The most important disciplines are those with the greatest potential to improve the overall score. The current research suggests that the laser run and fencing are the two most important disciplines in this respect. Future research could be extended to applying the predictive modelling technique within coaching scenarios, to real athletes and receiving feedback on whether it helped their decision making and preparation. Another area of future research is to analyse points scored in the modern pentathlon after riding is replaced by an alternative discipline.
References
1 | Alamar B , (2013) . Sports Analytics: A Guide for Coaches, Managers and Other Decision Makers. New York: Columbia University Press. |
2 | Barrow J , (2014) , Decathlon: The Art of Scoring Points. In: 50 Visions of Mathematics, edited by D. O’Briain, 11–15. Oxford, UK: Oxford University Press. |
3 | Cohal D.C. , (2019) , The History of pentathlon competitions. In international conference knowledge-based organization, Sciendo, 25: (2), 234–239. |
4 | Church B , (2021) , Modern Pentathlon opts to remove horse riding from competition after Tokyo 2020 incident. CNN, https://edition.cnn.com/2021/11/05/sport/modern-pentathlon-horse-riding-olympics-spt-intl/index.html, accessed 6th March 2022. |
5 | Creagh U. , Reilly T. , Less A. , (1998) , Kinematics of running on “off-road” terrain, Ergonomics, 4: , 1029–1033. |
6 | Dadswell C.E. , Payton C. , Holmes P. , Burden A. , (2013) ,Biomechanical analysis of the change in pistol shooting format in modern pentathlon, Journal of Sports Sciences, 31: (12) 1294–1301. |
7 | Dinnie A. , O’Donoghue P.G. , (2020) , Strategic target setting in the heptathlon, Journal of Sports Analytics, 6: (2) 129–145. |
8 | Dixon S. , Collop A. , Batt M. , (2000) , Surface effects on ground reaction forces and lower extremity kinematics in running, Medicine & Science in Sports & Exercise, 32: , 19191926. |
9 | Ferris D. , Louie M. , Farley C. , (1998) , Running in the real world: Adjusting leg stiffness for different surfaces, Proceedings: Biological Sciences, 265: , 989–994. |
10 | Gassmann F. , Fröhlich M. , Emrich E. , (2016) , Structural analysis of women’s heptathlon, Sports (Basel), 4: (1) 12. |
11 | Heck S. , (2012) , Breaking down the sex barrier: The emancipation of female modern pentathlon in West Germany, {International Journal of the History of Sport, 29: (2), 318–338. |
12 | Heck S. , (2013) , Modern pentathlon at the london 2012 olympics: Between traditional heritage and modern changes for survival, International Journal of the History of Sport, 30: (7), 719–735. |
13 | Jayal A. , McRobert A. , Oatley G. , O’Donoghue P.G. , 2018 Sports Analytics: Analyzing, visualization and decision mak1054 ing in sports performance, London: Routledge. |
14 | Le Meur Y. , Hausswirth C. , Abbiss C. , Baup Y. , Dorel S. , (2010) , Performance factors in the new combined event of modern pentathlon, Journal of Sports Sciences, 28: (10), 1111–1116. |
15 | Lee S.H. , Park J.C. , Kim K.B. , Kim S.J. , Ko B.G. , (2020) , Comparisons of performances for determining the relative importance in the modern pentathlon, Korean Journal of Sport Science, 31: (3), 571–580. |
16 | Lim C.-H. , Yoon J.-R. , Jeong C.-S. , Kim Y.-S. , (2018) , An Analysis of the performance determinants of modern pentathlon athletes in laser-run, A newly-combined event in modern pentathlon, Exercise Science, 27: (1), 62–70. |
17 | Maddalena T. , Bacot V. , Cohen C. , Clanet C. , (2020) , Optimal shooting cadence in the laser-run trial of modern pentathlon, Proceedings, 4: (1), 46. |
18 | Muniz-Pardos B. , Gomez-Bruton A. , Matute-Llorente A. , Gonzalez-Aguero A. , Gomez-Cabello A. , Gonzalo-Skok O. , Vicente-Rodriguez G. , 2020. Nonspecific resistance training and swimming performance: Strength or power? A systematic review, Journal of Strength and Conditioning Research. doi: 10.1519/JSC.0000000000003572. |
19 | Ntoumanis N. , 2001. A step-by-step guide to SPSS for sport and exercise studies, London: Routledge. |
20 | Ofoghi B. , Zeleznikow J. , Macmahon C. , Rehula J. , Dwyer D.B. , (2016) , Performance analysis and prediction in triathlon, Journal of Sports Sciences, 34: (7). 607–612. |
21 | Slavek N. , Jović A. , (2012) . Application of grey system theory to software projects ranking, Automatika 53: (3), 284–293. doi: 10.7305/automatika.53-3.80 |
22 | Trkal VN. , (2003) . The development of combined events scoring tables and implications for the training of decathletes, New Studies in Athletics 18: , 7–12. |
23 | UIPMModern Pentathlon Rules Handbook (2018), (2014), (2013), (2011). https://www.uipmworld.org/, accessed 7th September 2020. |
24 | UIPM (2020), https://www.uipmworld.org/, accessed 7th September 2020. |
25 | Westera W. , 2007. Under attack: The heptathlon scoring method, Canadian Athletics Coaching Centre. Available as e-paper at http://www.athleticscoaching.ca.http://dspace.ou.nl/handle/1820/2089 |
26 | Wu S.S. , Peiffer J.J. , Brisswalter J. , Nosaka K. , Abbiss C.R. , (2014) . Factors influencing pacing in triathlon, Open Access Journal of Sports Medicine 5: (Default) 223–234. |
27 | Wylde M.J. , Tan F.H.Y. , O’Donoghue P.G. , (2013) A time-motion analysis of elite women’s foil fencing, International Journal of Performance Analysis in Sport, 13: (2) 365–376. |
28 | Wylde M.J. , Yong L.C. , (2015) . Time-motion and heart-rate characteristics of adolescent female foil fencers, Journal of Human Sport and Exercise, 10: (Special Issue 2). |


