
Major League Draft WARs: An Analysis of Wins Above Replacement in Player Selection
Abstract
Major League Baseball (MLB) teams have 20 rounds to select players with projectable ability to compete at the MLB level. In this exploratory study, players were evaluated for differences in Wins Above Replacement (WAR) related to draft round, first round pick, educational designation, and by team. It was hypothesized WAR differences exist by round, pick number, educational designation and by team. From 2005–2015, 1,623 players were examined to determine population differences owed to draft selection. First round draftees had greater average career WAR compared to Rounds 2 to 20. Collectively, the first five picks had greater WAR versus picks grouped 16 through 30. High school (HS) draft picks were selected in earlier rounds versus collegiate athletes and HS hitters displayed more WAR in first round versus 4-year college pitchers. WAR outcomes in the first 15 picks offer more success with greater performance of HS hitters versus 4-year college pitchers. These trends may influence the current landscape of scouting and draft selection in the new draft format that has reduced player selection from 40 to 20 rounds.
1Introduction
The Major League Baseball (MLB) draft is the most extensive professional athlete selection event by comparison to other professional sports in the United States and has gone through a profound evolution since its inception in 1965. Physical size characteristics, such as body weight and body mass index, have increased from 1950 to 2010 (Crotin et al., 2014b, 2014a; Forsythe et al., 2017). Combined with the emergence of larger analytics staffs working for individual MLB teams, physical size intersects with process metrics (sabermetrics and ball flight characteristics) in predicting future success (Hoffman et al., 2009). Sport science has recently integrated in scouting to evaluate athleticism, biomechanics, and future health to deepen scouting models and justify money spent on high priority player selections. Despite all scientific advances, only 23 players in the history of the MLB draft have ever gone straight to the Major Leagues with the most current being Garret Crochet who debuted in the COVID-19 pandemic season (Catania, 2020).
The MLB draft has condensed from 2019 that featured 40 rounds to 20 rounds starting in 2020 and is believed to be the drafting platform indefinitely (Bernstein, 2019). With a reduced player pool due to a 50% reduction in draft rounds, MLB teams may have limited opportunities to select for the so called “diamond in the rough” players who are picked in later rounds for significantly less money. In contrast, players picked in the first round will likely receive much higher signing bonuses to encourage them to sign with the MLB team to balance economics, being bonus dollars for drafted and signed players, with future Wins Above Replacement ratings.
Wins Above Replacement (WAR) is a summary performance statistic that shows how a player contributes to wins above a replacement player and normalizes comparisons between players of different positions (Chandler and Rosenbaum, 2018). A higher WAR rating indicates a more impactful player and previous researchers have encouraged front office personnel to protect their top 20 picks, especially within the first five rounds, by additions to the 40-man roster, as they have been shown to produce the highest WAR (Chandler and Rosenbaum, 2018). However, these analyses were performed in the “pre-Moneyball” era and they require further research to evaluate the influence of modern scouting analytics on future WAR projections (Lewis, 2004).
To address the gap in the literature, the purpose of this study is to evaluate the top 20 rounds in the modern era from 2005–2015 to identify the following; (1) The percentage of players entering MLB by round, (2) Average career WAR by round and average WAR of signed players who make the major leagues, (3) WAR by pick in the first round, (4) WAR by educational sector (high school, junior college, 4-year institution), and (5) WAR rating on players drafted by each of the 30 MLB teams during the analysis period. We hypothesize the following; (1) Selection rounds will show a successive decline in making it to the MLB level from the first round, (2) WAR for total players drafted by round and players who have entered MLB will successively decrease from the first round, (3) WAR by first round draft pick will decline successively when assessing first round draft picks by increments of five draft picks, (4) Collegiate athletes coming from 4-year schools are expected to go earlier in the draft and provide greater WAR ratings, and (5) WAR disparities will be seen between MLB teams to infer differences in scouting or player development ability for each team. The application of this work entails providing insights to professional baseball teams in understanding the current conditions of the MLB draft, including educational demographic influences, and expected future WAR projections, which may help teams make more informed financial decisions and successfully focus scouting department efforts.
2Methods
2.1Experimental approach to the problem
MLB draft results and WAR statistics were compiled for all drafted players signed by drafting MLB organizations who were selected within the first twenty rounds between the years of 2005–2015. For analyses comparing draft rounds, players were distributed into the round in which they were selected. For example, Round 1 players were associated with the first round, Round 2 players with the second round, until finally, Round 20 players were associated with the twentieth round. For our analysis comparing draft round groupings, players were distributed into the round grouping from which they were selected in five round increments starting with Rounds 1–5 and culminating with Rounds 16–20. For the analysis comparing draft picks in the first round only, players were distributed into the draft pick order from which they were selected. Specifically, first picks in Round 1 would be assigned to the Pick 1 group and the thirtieth picks in the draft would be assigned to the Pick 30 group. Since differences in signing bonuses paid can differ by pick selection, picks 1–5 were considered the group that commands the highest signing bonuses and formed the reference group to compare all other incremental pick groups. As such, future WAR outcomes could be evaluated based on the general vicinity of where a first round selection could occur (ie. if a team had a pick option between 6–10) related to the upper echelon of first round picks being the first five picks. Grouping procedures mentioned above provided the frameworks to study round performance with respect to WAR and secondary analyses that were focused on the first round. Similarly, player demographics permitted the investigation to evaluate selection differences based on educational designation being high school, junior college and 4-year institution.
2.2Subjects
Players studied in this analysis were gathered from a public website warehousing drafted players (“Baseball America MLB Draft Database,” 2021). In total, 1,623 players were examined for each hypothesis including Rounds 1 through 20 and 319 players were examined for each hypothesis involving only the first round. Evaluation of WAR statistics involved publicly available data spanning 2006–2020 seasons from Fangraphs.com. The data used did not require IRB approval given the absence of confidential information (“Fangraphs Career WAR for Pitchers,” 2020, “Fangraphs Career WAR for Position Players,” 2020).
2.3Procedures
Players’ total WAR spanning 2006 to 2020 was treated equally regardless of the length of the players’ MLB careers. For example, the WAR for a player who was drafted and signed, who proceeded to play in the major leagues from the 2006 to 2020 season, would include 15 seasons to represent his WAR value. A second scenario illustrating WAR rating entails a player drafted and signed, who proceeded to enter and play in MLB from the 2019 to 2020 season, and therefore, his WAR metric included 2 seasons. Signing bonus allotment paid to drafted players were also tabulated to indicate the money spent on players per round, and such data was gathered from the same public website as previously mentioned (“Baseball America MLB Draft Database,” 2021).. The selected date range for analyses from 2005–2015 permitted the investigators to evaluate current MLB players that had at least 7 years to enter the MLB level and contribute to WAR ratings.
Compensation picks, or competitive balance picks, were assigned to the round preceding the compensation or competitive balance draft round. To illustrate this procedure, Compensation Round A selections that followed Round 1 were designated as Round 1 draft picks. Furthermore, Compensation Round B selections that followed Round 2 were designated as Round 2 draft picks and Compensation Round C selections that followed Round 3 were designated as Round 3 draft picks. Additionally, the analysis of the first 30 draft picks selected from each draft included Compensation Round A selections that fell within the first 30 draft picks. To demonstrate this data treatment, if the first and second Compensation Round A selections are picks 29 and 30, these were considered selections within the first 30 picks.
In determining pick groupings, the investigators followed the typical valuation of prospects by bonus allocation in that the first five picks of the draft are considered to earn a higher signing bonus than the next five picks in succession.
2.4Statistical analyses
All calculations were performed through JASP software (Amsterdam, Netherlands). Since the total population of players drafted from 2005–2015 were included in this exploratory investigation, parametric testing was not needed to examine characteristics between pick selection, round comparisons, WAR ratings, educational designations, or team data.
3Results
3.1Percentage of players entering major league baseball by round and signing bonus
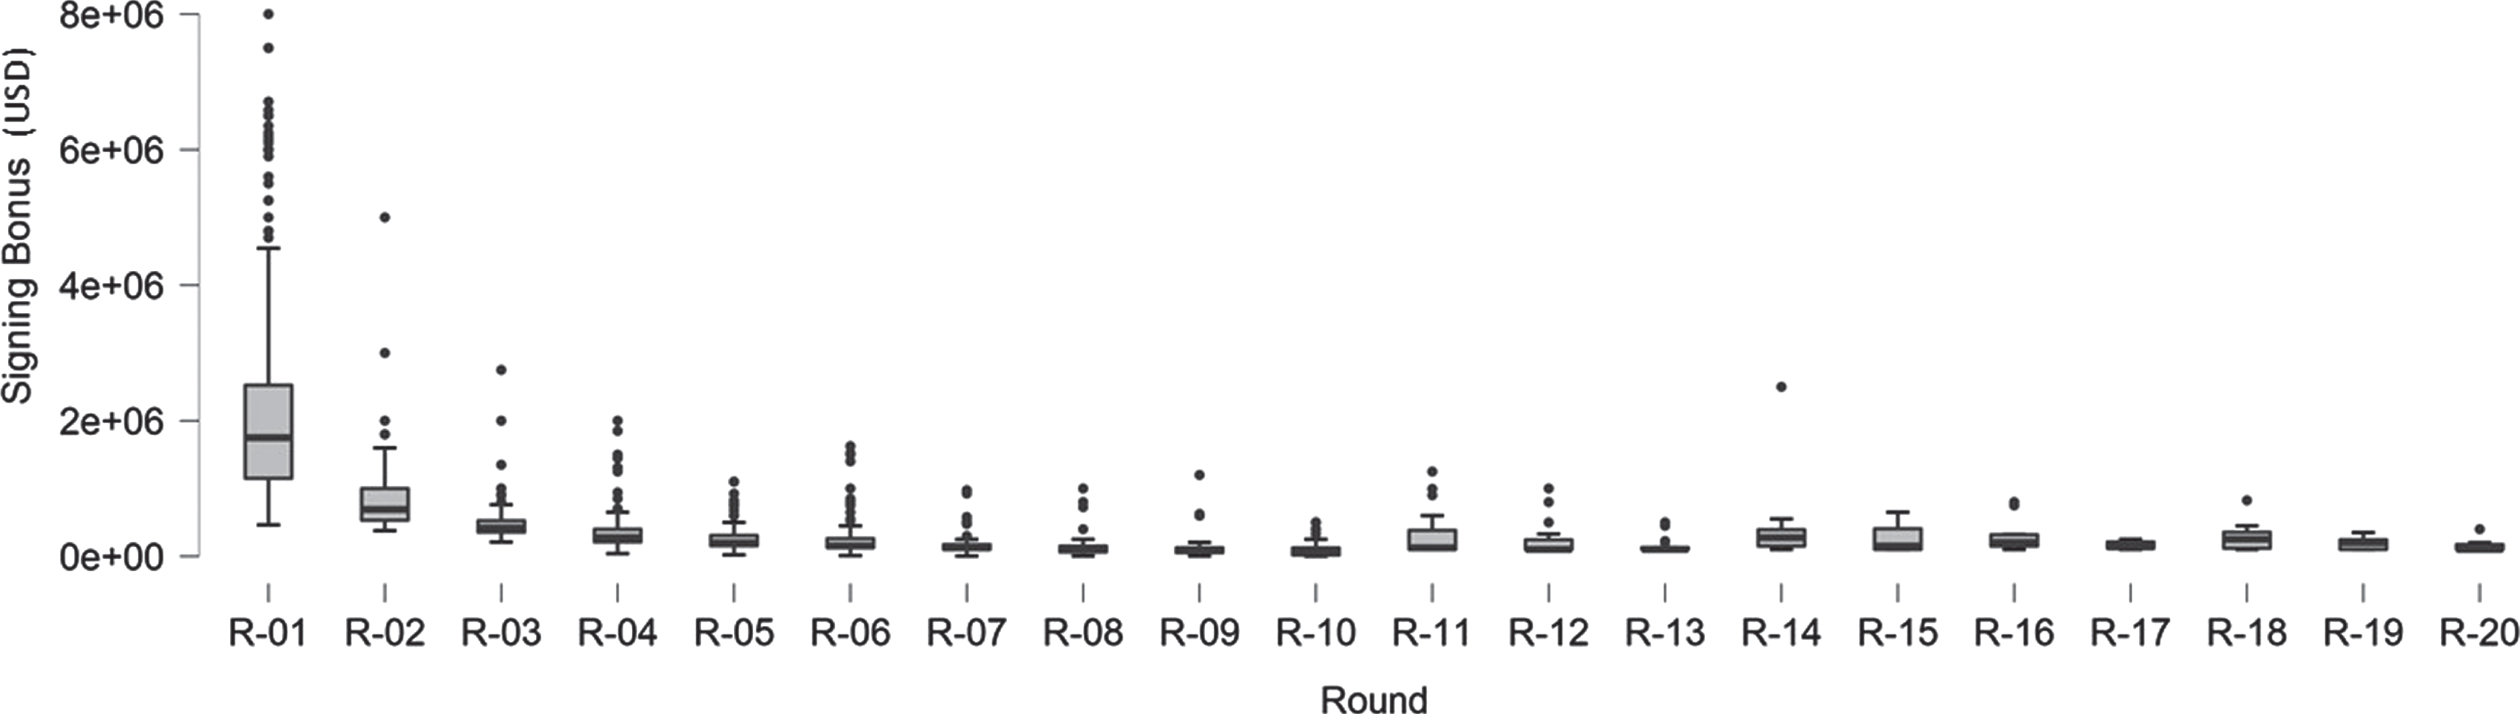
The analysis indicated that 82.6% of the bonus dollars spent in the first 20 rounds of the MLB was concentrated within the first 5 rounds. This totaled 1.629 billion dollars, and more than 1.4 billion dollars more than the following 5-round increment (Rounds 6 to 10) indicating more financial emphasis on the first 5 rounds. To indicate a competitive return on investment, a total of 1.083 billion dollars were spent on players drafted in the first 5 rounds and signed, who then went on to play at the MLB level. This figure translated to approximately 66.5% of the total bonus dollars spent in rounds 1–5 (1.629 billion dollars) that was used on viable major league talent. Interestingly, each of the following 5 round increments had a smaller percentage of bonus dollars awarded to future MLB players. Only 28.7% of the bonus dollars awarded in Rounds 6–10, 26.3% of the bonus dollars awarded in Rounds 11–15, and 22.7% of the bonus dollars awarded in Rounds 16–20 were spent on players that played at least one game at the MLB level (Table 1). The distribution of signing bonus as a function of round shows a higher density of Round 1 players that may be considered outliers as compared to lower round draft picks (Fig. 1).
Table 1
Draft compensation for signed draft picks and MLB prospects from 2005–2015
| Round Grouping | Bonus Dollars for Drafted & Signed Players | % Of Bonus vs Total Bonus in First 20 Rounds | Bonus Dollars for Drafted & Signed Players That Made the MLB | % Of Drafted & Signed Player Bonuses that Made the MLB |
| Round 1–5 | $1,629,758,480 | 82.6% | $1,083,833,920 | 66.5% |
| Round 6–10 | $216,101,000 | 11.0% | $61,983,600 | 28.7% |
| Round 11–15 | $87,604,200 | 4.4% | $23,009,400 | 26.3% |
| Round 16–20 | $38,768,950 | 2.0% | $8,813,850 | 22.7% |
| Total | $1,972,232,630 | 100.0% | $1,177,640,770 | 59.7% |
Fig. 1
Signing bonus by round distribution for signees competing in MLB.
In exploring the chance of playing one MLB game by round (i.e., a plate appearance or an inning out pitched), the percentage of players drafted and signed that eventually made it to the MLB decreased as the draft proceeded from round 1 onward. Of players drafted in Round 1 and signed, 71.5% made it to MLB. This percentage dropped just over half for Round 2 players who were drafted and signed, and than consecutively lowered round-by-round to a level of less than 10% entering MLB at round 20 (Table 2).
Table 2
Percentage of Players Drafted and Signed Who Entered MLB from 2005–2015
| Round | Players Drafted & Signed | Players Who Entered MLB | % Of Players Drafted & Signed Who Made it to the MLB Level |
| 1 | 527 | 377 | 71.5% |
| 2 | 339 | 177 | 52.2% |
| 3 | 327 | 142 | 43.4% |
| 4 | 318 | 110 | 34.6% |
| 5 | 314 | 117 | 37.3% |
| 6 | 311 | 99 | 31.8% |
| 7 | 315 | 71 | 22.5% |
| 8 | 309 | 62 | 20.1% |
| 9 | 309 | 63 | 20.4% |
| 10 | 294 | 55 | 18.7% |
| 11 | 291 | 49 | 16.8% |
| 12 | 296 | 45 | 15.2% |
| 13 | 285 | 51 | 17.9% |
| 14 | 276 | 39 | 14.1% |
| 15 | 257 | 29 | 11.3% |
| 16 | 269 | 34 | 12.6% |
| 17 | 242 | 26 | 10.7% |
| 18 | 258 | 28 | 10.9% |
| 19 | 252 | 26 | 10.3% |
| 20 | 238 | 23 | 9.7% |
| Total | 6027 | 1623 | 26.9% |
From the 6027 total players drafted from 2005–2015, 26.9% of players who were signed made it to the MLB level. To determine the percentage of players entering MLB by round, the number of players who entered the league for a specific round were expressed as a percentage of the total players who were drafted and signed in the same round.
3.2Average career WAR per round for drafted players who signed and entered MLB
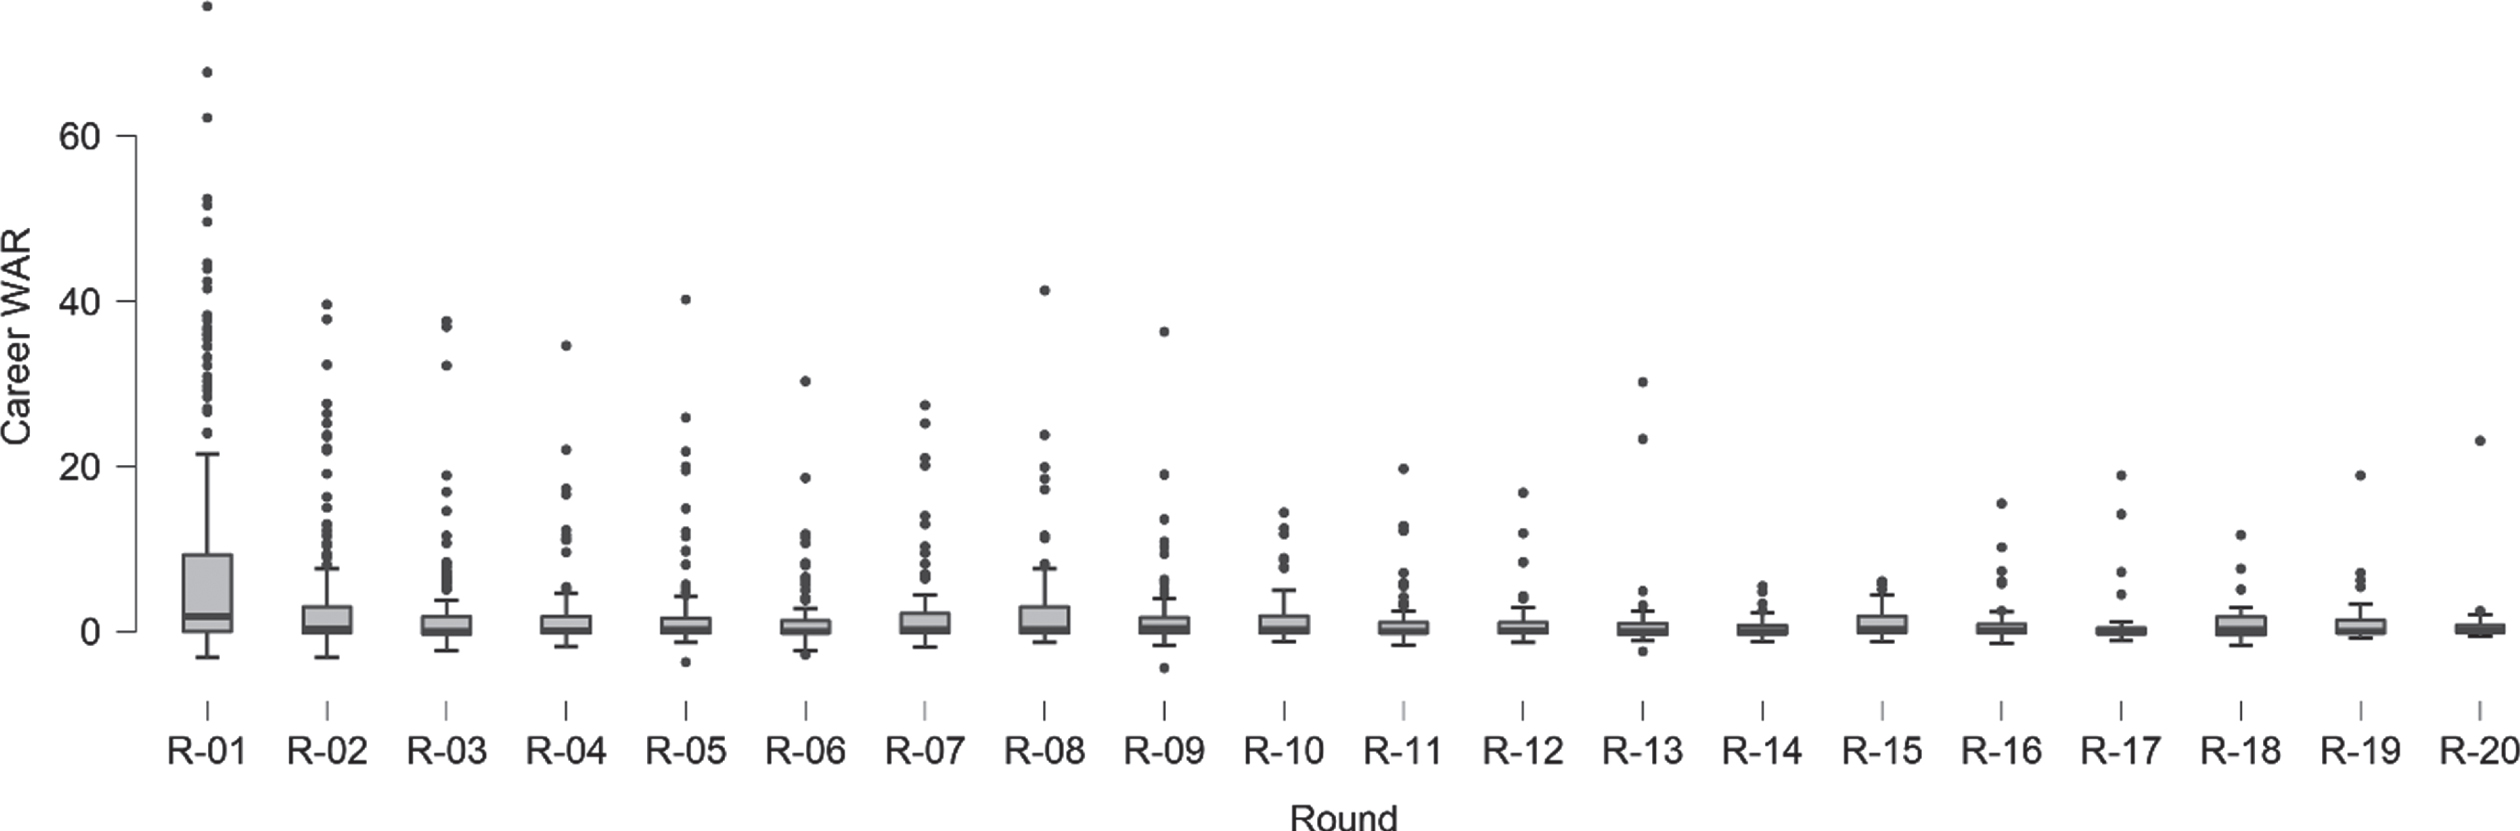
Players drafted and signed in Round 1, who eventually ended up earning an MLB roster spot, produced greater average career WAR compared to Rounds 2 to 20. Minimal career WAR differences were seen between Rounds 2 to 20 (Table 3). The distribution of WAR as a function of round shows a higher density of Round 1 players that may be considered outliers as compared to lower round draft picks (Fig. 2).
Table 3
Average career war for drafted and signed players who entered MLB
| Round | Average Career WAR for Drafted & Signed Players That Made the MLB | Number of Players |
| 1 | 6.93 | 377 |
| 2 | 3.30 | 177 |
| 3 | 2.11 | 142 |
| 4 | 2.06 | 110 |
| 5 | 2.22 | 117 |
| 6 | 1.52 | 99 |
| 7 | 2.80 | 71 |
| 8 | 3.28 | 62 |
| 9 | 2.38 | 63 |
| 10 | 1.78 | 55 |
| 11 | 1.72 | 49 |
| 12 | 1.49 | 45 |
| 13 | 1.41 | 51 |
| 14 | 0.51 | 39 |
| 15 | 1.16 | 29 |
| 16 | 1.49 | 34 |
| 17 | 1.68 | 26 |
| 18 | 1.15 | 28 |
| 19 | 1.68 | 26 |
| 20 | 1.34 | 23 |
| Total | 3.24 | 1,623 |
For players drafted between 2005–2015, Round 1 draft picks had higher WAR than all other rounds.
Fig. 2
Average career WAR distribution by round for signees competing in MLB.
3.3Average career WAR by pick for the first 30 picks
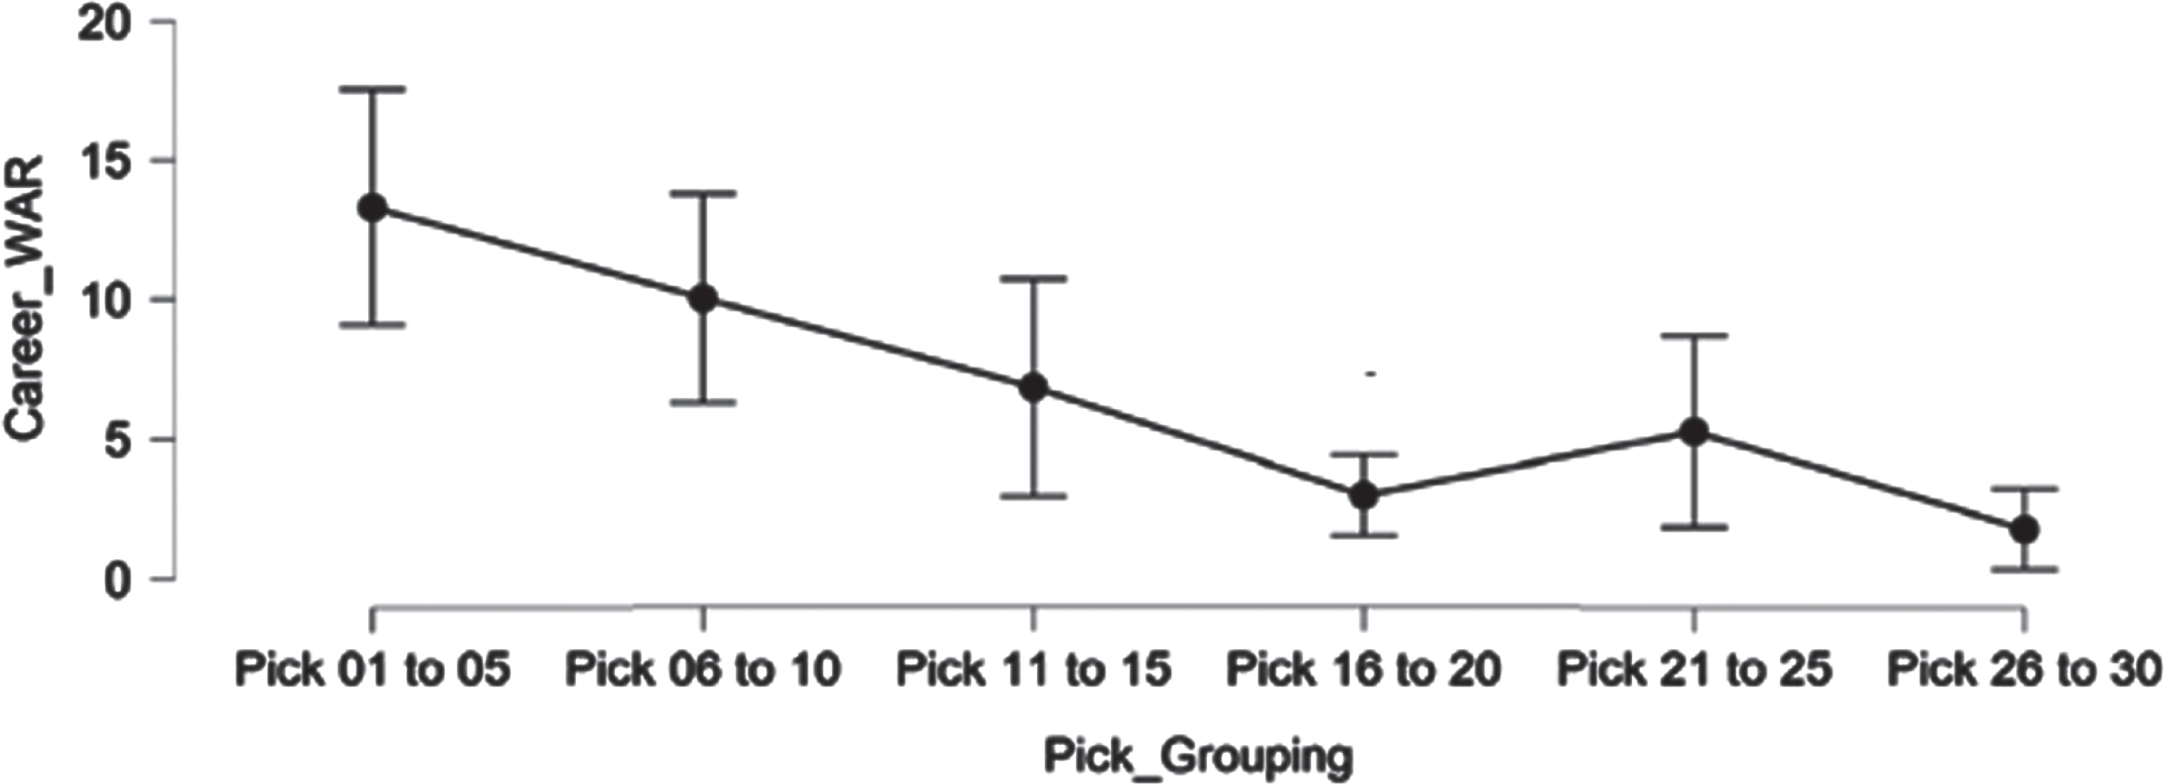
Selection pick grouping with the highest average career WAR were picks 1 to 5 that produced an average career WAR rating of 13.29. WAR decreased between each of the following groupings of five picks, except picks 21 to 25 where average career WAR increased from 3.03 within picks 16 to 20 to a WAR rating of 5.26. Pick group 1 to 5 was greater than pick groups 16 to 20, 21 to 25, and 26 to 30. No differences were seen between pick group 1 to 5 and 6 to 10, or group 1–5 compared to 11 to 15. The pick group 6 to 10 was greater than pick groups 16 to 20 and 26 to 30, but not different from pick groups 11 to 15 and 21 to 25 (Fig. 3).
Fig. 3
Career WAR differences by pick groupings (5 Pick Increments). Pick group 1–5 indicated the highest career WAR amongst MLB players who were drafted between 2005–2015.
3.4Educational status on draft selection
Differences were seen between each of the three school types (High School, Junior College and 4-Year Institution) and average draft pick status for the first 20 rounds. High school draft picks that signed averaged the most immediate selections at round 7.56, followed by 4-year college draft picks that signed at an average round of 10.2 and then junior college draft picks that signed at an average round of 11.6. WAR evaluation between school types for players entering MLB in the first 20 rounds did not yield significant differences, and therefore, for players entering the highest level of competition, WAR on average is similar between educational designations.
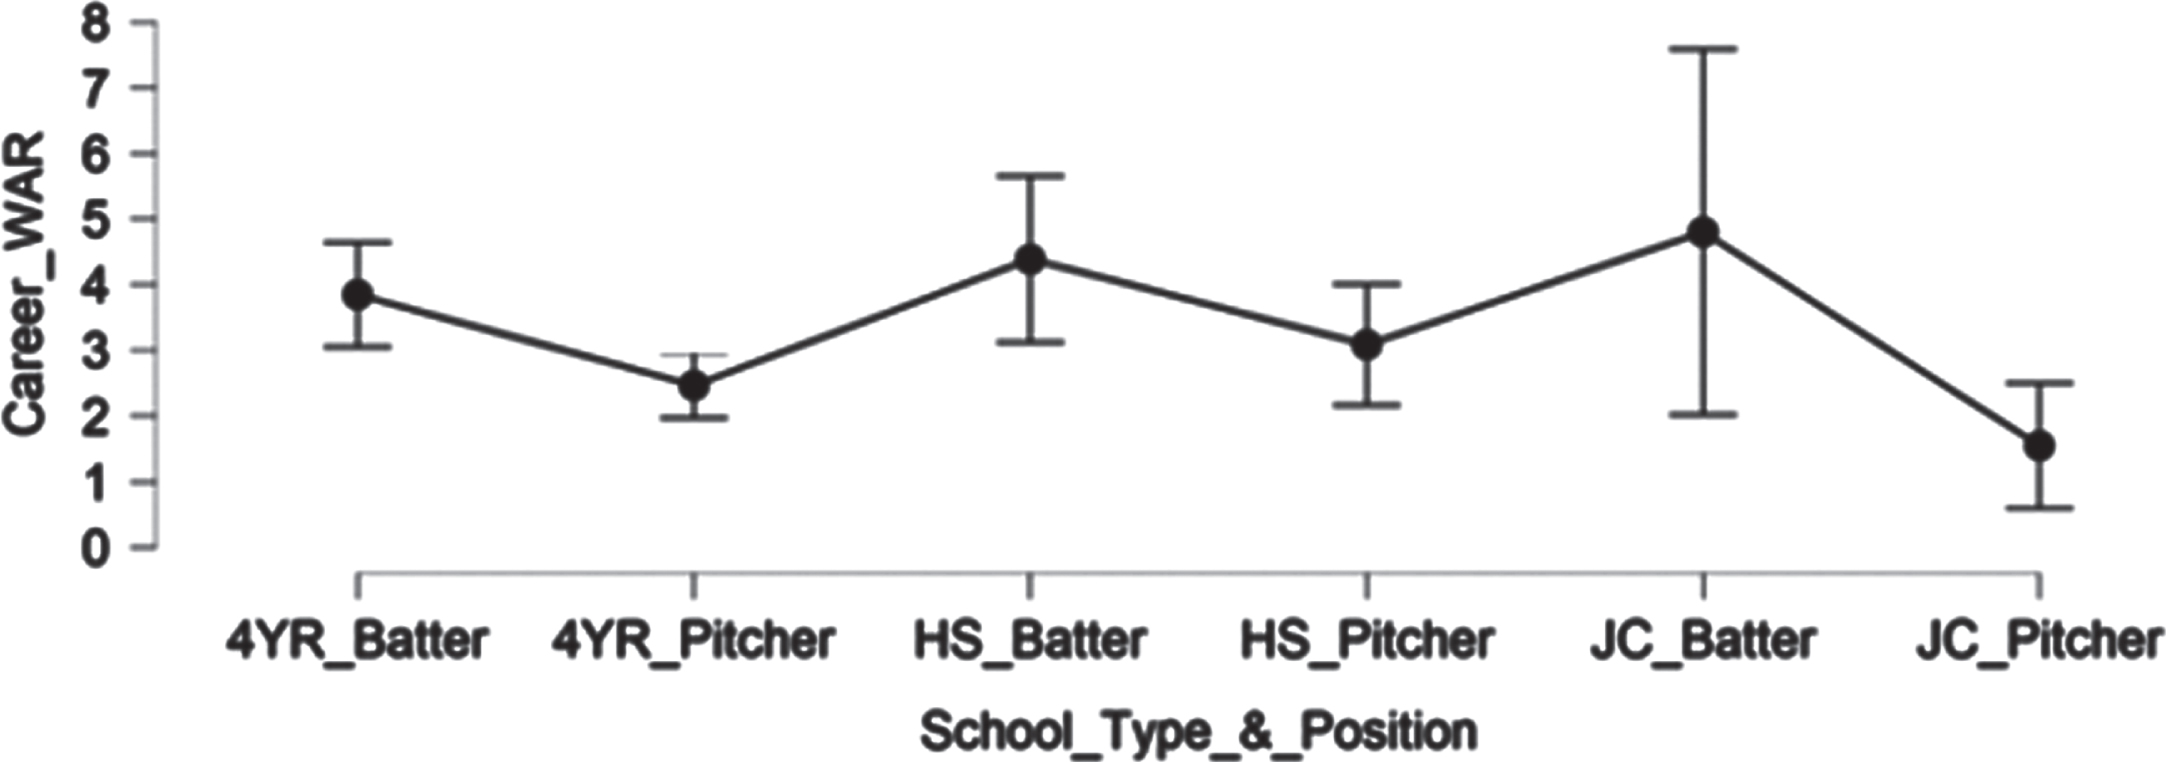
When evaluating the first round only, no significant differences were seen to suggest pick selection biases toward drafting a high school, collegiate or junior college athlete at a higher slot in the draft. Therefore, all educational designations have equal opportunity to be selected within the first round. With respect to WAR, differences were seen between 4-year pitchers and high school batters who were selected in the first round, as high school batters had higher WAR (See Fig. 4).
Fig. 4
Career WAR differences by educational groupings in the first round. Less WAR was seen in first round pitchers from 4-year institutions compared to 4-year and high school hitters.
3.5Career WAR by team for first round selections
There were no differences in evaluating WAR ratings across divisions (NL East, Central, West; AL East, Central and West) to indicate overall, divisional WAR based on first round selection are essentially equal across 2005–2015. A team-by-team approach did show differences, as the Nationals, Cubs and Diamondbacks have returned the highest average career WAR per draft pick in round 1. In contrast, the Rangers, Padres and Phillies have returned the lowest WAR for the first round (Table 4).
Table 4
Team total WAR and average career WAR per drafted signee for round 1
| Team | Total Career WAR | Players Drafted & Signed | Average Career WAR per Player Drafted & Signed |
| Nationals | 162.80 | 14 | 11.63 |
| Cubs | 117.40 | 15 | 7.83 |
| Diamondbacks | 171.50 | 22 | 7.80 |
| Angels | 122.80 | 16 | 7.68 |
| Giants | 141.60 | 19 | 7.45 |
| Reds | 128.70 | 18 | 7.15 |
| Pirates | 105.70 | 15 | 7.05 |
| Dodgers | 93.80 | 14 | 6.70 |
| Astros | 113.50 | 17 | 6.68 |
| Orioles | 83.50 | 14 | 5.96 |
| Tigers | 68.70 | 13 | 5.28 |
| White Sox | 68.00 | 13 | 5.23 |
| Royals | 83.40 | 16 | 5.21 |
| Athletics | 77.60 | 15 | 5.17 |
| Mets | 67.00 | 13 | 5.15 |
| Rays | 110.40 | 22 | 5.02 |
| Brewers | 82.90 | 18 | 4.61 |
| Rockies | 89.70 | 20 | 4.49 |
| Cardinals | 112.10 | 26 | 4.31 |
| Twins | 75.30 | 19 | 3.96 |
| Marlins | 65.20 | 17 | 3.84 |
| Indians | 55.70 | 15 | 3.71 |
| Red Sox | 94.60 | 28 | 3.38 |
| Braves | 57.20 | 17 | 3.36 |
| Mariners | 41.70 | 13 | 3.21 |
| Yankees | 43.20 | 14 | 3.09 |
| Blue Jays | 68.90 | 25 | 2.76 |
| Phillies | 33.10 | 13 | 2.55 |
| Padres | 52.90 | 24 | 2.20 |
| Rangers | 24.10 | 22 | 1.10 |
| Total | 2,613.00 | 527 | 4.96 |
Total career WAR, player pool size and total career WAR per first round drafted signees for all 30 MLB teams for the years 2005–2015.
4Discussion
Draft years of 2005–2015 are considered recent with respect to allotted time to project talent and provided novel insights into trends concerning procurement and future projection of MLB talent. Our results confirmed our hypotheses in that MLB entry declines steadily after the first round and that WAR for total players drafted by round, who have entered MLB successively, saw decreases from the first round with no change from the second round onward. Similarly, WAR disparities were seen between MLB teams to infer differences in scouting and player development ability amongst professional organizations.
Our first-round pick hypothesis was partially confirmed, as the first 5 picks offered the highest WAR, yet it did not significantly offer greater WAR from picks 6–10, or picks 11–15, and therefore was only greater than picks 16–30. Our hypotheses about educational designation were not realized as collegiate athletes coming from four-year colleges were not chosen earlier in the draft, nor did WAR differ over 20 rounds between educational designations. However, first round high school hitters had greater WAR than 4-year collegiate pitchers that further evidenced that 4-year collegiate players were not superior in future projection for MLB performance.
Our results differed from previous research that evaluated earlier drafts from 1980–2005. During these draft years, it was found that teams could add value by selecting collegiate hitters within the first 50 picks over any other position or educational designation and were projected to have greater success in the Major Leagues (Carluccio, 2011). Our draft time frame from 2005–2015 showed a greater interest in drafting high school athletes earlier in the draft and that WAR for 4-year collegiate hitters was not statistically different from high school and junior college players. It is speculated that amateur development may have improved prospect quality amongst high school pitchers and hitters by comparison to the 1980–2005-time frame, or the potential of player development programs improving in professional baseball for younger athletes who have not had the experience of 4-year collegiate baseball.
During 1980–2005, WAR had decreased as the pick number increased, as the decline occurred at a greater percentage for 4-year collegiate hitters and pitchers and less by comparison amongst high school athletes (Carluccio, 2011). Our findings were similar as WAR decreased after the first round in athletes, however examination of WAR loss between position groups were beyond our study’s scope and forms a basis of future investigation. In other work investigating the first round from 1992–1999, college and high school hitters had not shown significant differences in future performance, however collegiate pitchers demonstrated greater MLB impact compared to high school pitchers (Wang, 2009). There appears to be selection discrepancies between high school, junior college and 4-year college athletes depending on the years of examination, where at present, high school selections appear to be more coveted in the current climate of the MLB draft within the first 20 rounds and that collegiate hitters do not appear to maintain a competitive advantage over other players in each round that contrasts with other work (Carluccio, 2011; Wang, 2009).
Our results showed that most of the bonus money is spent in the first five rounds, and therefore, teams need to concentrate efforts on this cohort of drafted athletes to receive the greatest return on investments. Furthermore, WAR ratings for first round players who entered MLB was more than 2-fold greater than the WAR demonstrated by any other round. It is no surprise that the industry focuses on profiling the top athletes eligible for the annual draft and teams spend most of their energy on the first-round selection, as the greatest returns are to be expected and this study substantiates such efforts.
Approximately 72% of first round players entered MLB during the analysis period, and therefore, almost 30% of first round picks never made it to the MLB level. Examination of first round pick number to illustrate whether WAR differences are seen depending on draft order revealed that teams who can secure a top five pick may see advantages compared to teams selecting picks 16–30. Given significant differences were not seen between the first five picks and picks 6–15, it is safe to say that the first half of the teams making draft selections have equal chance of producing an athlete with higher WAR compared to the remaining teams selecting the 16th pick onward. The concept of earlier draft selections revealing greater MLB productivity was confirmed by other work (Hubley, 2012). In contrast, Hubley (2012) found that only 64% of first round selections from 1989 to 2009 made the MLB level. As a result, the increased statistical probability of entering MLB in the current draft reflects potential influences by a few different factors; (1) Improved player talent during the draft years, (2) Advancement in player development processes to enhance drafted players’ talent, decision-making and physical capabilities, (3) Potential for a decline in existing talent at the MLB level that increased opportunities for drafted players to enter the league, or (4) A possibility that existing MLB players saw increased injuries that opened up roster spots for drafted athletes during this time frame.
Draft WAR analyses by teams indicated a disparity in scouting performance for the first round during the 2005–2015 period. The range of average career WAR for first round selections were between 1.10 (Texas Rangers) to 11.63 (Nationals). The disparity may reflect draft selection order. Given we have seen picks 16–30 demonstrate lower WAR compared to the first 15 picks, it is possible that teams that produced lower WAR may have had later first round picks over the course of drafts from 2005–2015. Similarly, it may be construed that teams that reveal higher WAR potentially have a stronger player development system. Future research could explore team WAR and the average number of innings pitched and plate appearances recorded by players entering the league to determine how quickly athletes advance through each minor league system. In MLB, urgency in player development is important, as a younger player entering MLB can expect to have more productive years before peak competitive age is realized, which is approximately 29 years old for pitchers and hitters (Bradbury, 2009). To expedite players entry into MLB, teams should construct scouting models that reflect player development strengths for their respective organization. For example, if strength and conditioning programs are effective at improving position player speed, teams may find players with tools that are more challenging to be developed, and in this case, select a player who may not grade as high on speed. Furthermore, with the emergence of the 2021 MLB Draft Combine, baseball players will be inclined to improve athleticism at an earlier age, as combine data may point to physical, visual, and cognitive attributes that lend themselves to greater WAR and player development advancement irrespective of educational designation. Although scouting predictive models concerning ball flight characteristics and movement-based inferences are addressed in the current climate for MLB drafting approaches, less is understood about human physiology, and this may point to a new frontier in scouting to evaluate how physical size, strength, speed, and power may give rise to acquiring athletes who are more injury resilient and impactful in offering higher overall WAR across all rounds.
In conclusion, we have identified that teams drafting between 2005–2015 are not equal in scouting or player development capacity and must focus attention on the first round as it yields the highest WAR returns, and more specifically, the first 15 picks appear to offer greater player WAR at the MLB level. Educational preference was not seen in the first round, yet high school hitters in Round 1 offered greater WAR than 4-year collegiate pitchers during the 10-year period.
Conflicts of interest
The authors of this work do not declare any conflicts of interest.
References
1 | Baseball America MLB Draft Database [WWW Document], 2021.. Baseb. Am. URL https://www.baseballamerica.com/draft-history/mlb-draft-database/#/ (accessed 1.6.21). |
2 | Bernstein, D. , 2019. MLB Draft Picks 2019: Complete Results from Rounds 1-40 in Baseball Draft [WWW Document]. Sport. News. URL https://www.sportingnews.com/us/mlb/news/mlb-draft-picks-2019-complete-draft-results-baseball/1t7fouk89jbba19ru478frpplv |
3 | Bradbury, J.C. , (2009) . Peak athletic performance and ageing: evidence from baseball. J Sports Sci, 27: , 599–610. |
4 | Carluccio, C. , 2011. Drafting Strategies in the Major League Base-ball Draft. |
5 | Catania, J. , 2020. Players to go straight from MLB Draft to the The Show [WWW Document]. MLB.com. URL https://www.mlb.com/news/players-who-went-directly-from-the-draft-to-mlb |
6 | Chandler, G. and Rosenbaum, S. , (2018) . An Analysis of the First Round of the MLB First-Year Player Draft. CHANCE, 31: , 37–43. |
7 | Crotin, R.L. , Forsythe, C.M. , Bhan, S. and Karakolis, T. , 2014a. Changes in physical size among major league baseball players and its attribution to elite offensive performance. J Strength Cond Res, 28. |
8 | Crotin, R.L. , Forsythe, C.M. , Karakolis, T. and Bhan, S. , 2014b. Physical size associations to offensive performance among major league leaders. J Strength Cond Res, 28. |
9 | Fangraphs Career WAR for Pitchers [WWW Document], 2020. Fangraphs.com. URL https://www.fangraphs.com/leaders.aspx?pos=all&stats=pit&lg=all&qual=0&type=8&season=2020&month=0&season1=2020&ind=0&team=0&rost=0&age=0&filter=&players=0&startdate=&enddate=(accessed1.6.21). |
10 | Fangraphs Career WAR for Position Players [WWW Document], 2020. Fangraphs.com. URL https://www.fangraphs.com/leaders.aspx?pos=all&stats=bat&lg=all&qual=y&type=8&season=2020&month=0&season1=2020&ind=0&team=&rost=&age=&filter=&players=&startdate=&enddate=(accessed1.6.21). |
11 | Forsythe, C.M. , Crotin, R.L. , Greenwood, M. , Bhan, S. and Karakolis, T. , (2017) . Examining the influence of physical size among major league pitchers. J Sports Med Phys Fitness, 57: . |
12 | Hoffman, J.R. , Vazquez, J. , Pichardo, N. and Tenenbaum, G. , (2009) . Anthropometric and performance comparisons in professional baseball players. J Strength Cond Res, 23: , 2173–2178. |
13 | Hubley, B. , 2012. Signing Bonuses & Subsequent Productivity: Predicting Success in the MLB Draft. |
14 | Lewis, M. , (2004) . Moneyball: The art of winning an unfair game. WW Norton & Company. |
15 | Wang, V. , 2009. Valuing the Draft (Part 2) [WWW Document]. The Hardball Times. URL https://tht.fangraphs.com/valuing-the-draft-part-2/ (accessed 3.7.21). |


