
Effect of performance standard and sex on 24 h ultra-marathon pacing profiles
Abstract
The purpose of the present study was to examine the effect of sex and performance standard on pacing profiles in a 24 h ultra-marathon race. Performance data of 283 participants (237 men and 46 women) from the last decade’s versions (2011 until 2020, with the exception of the 2017 version) of the International Ultramarathon Festival held in Athens-Hellinikon, Greece, were analyzed and pacing profiles were evaluated based on performance standard and sex. Relative speed for every hour and % distance covered in 6 h and 12 h segments and coefficient of variation (CV) were calculated. Mean distance ran was 159.99±36.04 km. Runners followed a reverse J-shaped race pace (p < 0.001). Sex did not seem to interact with pacing (p > 0.05 in every case), while performance standard interacted significantly with pacing (p < 0.001). CV was negatively correlated with total distance covered and total running time (–0.761, p < 0.001 and –0.753, p < 0.001, respectively). In conclusion, the overall pacing profile adopted by runners in a 24 h ultra-marathon race was a reverse J-shaped model, with better runners following a more even pacing than slower runners, with lower velocity variability.
1Introduction
Ultra running contains all races that are longer than 42.195 km or last more than six hours. Therefore, ultra running is divided in races with set distance (50 km, 100 km, etc) or set time (6 h, 24 h and multi-day events) (World Athletics, 2020). Ultra-marathon events are rapidly evolving worldwide, with an increasing number of participants of both genders each year (Scheer, 2019). A 24 h ultra-marathon race is a very challenging and demanding event. Physiological parameters, such as maximal oxygen uptake (VO2max), running economy, blood cardiac biomarkers, etc., can affect ultra-endurance running performance (Baumann et al., 2014; Millet et al., 2011; Gimenez et al., 2013; Hohl et al., 2019). Another factor that affects performance in endurance events in general is pacing. Pacing is the way each runner distributes his/her energy expenditure during the race (Foster et al., 2005). There are various pacing strategies that a runner can follow. It has been shown that runners in prolonged endurance events (> 2 min) tend to use even or varying strategy, while runners in ultra-marathon events (> 4 h) tend to use positive strategy, which means that there is a progressive reduction of their initial running velocity, although it is not quite clear if those are the optimal pacing strategies for each type of event (Abbiss and Laursen, 2008). The fact that using different pacing strategies, such as slow-start vs self-paced race, does not always seem to affect performance in ultra-marathon (Matta et al., 2019) confirms that performance is not only about how a runner distributes his/her energy, but a multifactorial issue. Literature shows that runners of different performance levels seem to adopt different pacing strategies too. In endurance events, higher lever athletes seem to be able to maintain their initial velocity for longer, as well as following a more even pacing strategy, with less changes in their running velocity, in distances from half-marathon (Hanley, 2015), to marathon (Santos-Lozano et al., 2014; Renfree and St. Clair Gibson, 2013; Haney and Mercer, 2011) and ultra-marathon races (Lambert et al., 2004; Renfree et al., 2016; Knechtle et al., 2015). It is quite impressive that in a 161 km mountain ultra-marathon the winners had significantly lower variations in running velocity than the rest of the top 5 finishers (Hoffman, 2014). Another factor that could differentiate pacing strategies followed by endurance and ultra-endurance runners is sex. In the past there was an increased difference in performance between the genders, especially in ultra-marathon events (Coast et al., 2004), but since more and more women started to participate in such events, the difference between men and women seems to be reduced (Knechtle et al., 2016; Waldvogel et al., 2019). Although in smaller distances, such as the half-marathon, both genders follow the same pacing strategy (Nikolaidis et al., 2019), in marathon (Nikolaidis et al., 2019; Hanley, 2016; Deaner et al., 2015; March et al., 2011; Trubee et al., 2014) and ultra-marathon (Renfree et al., 2016) women adopt a more even strategy than men, having smaller variations in their running velocity. According to our knowledge only three previous studies have examined pacing in 24 h ultra-marathon races. The pacing strategy adopted by the participants was a reverse J-shaped pattern (Bossi et al., 2017; Inoue et al., 2019). This is the pattern where the runners start their race with a high initial velocity, which is progressively reduced, forming a reverse-J shape when shown in a diagram. High level runners adopted a more even, with less variations of velocity, strategy (Takayama et al., 2016; Bossi et al., 2017; Inoue et al., 2019), while sex did not seem to affect pacing profiles (Bossi et al., 2017). The purpose of the present study was to further investigate the pacing profile adopted in a 24 h ultra-marathon analyzing data from a longer period (10 years) using well trained ultra-distance runners, as well as to clarify how sex and performance standard can affect it. Our hypotheses were that the runners would follow a positive pacing profile and that better runners and women would have a more even profile.
2Methods
This study analyzed data from the International Ultramarathon Festival that takes place every year in Athens-Hellinikon, Greece. The chosen event was the 24 h race and the analyses were performed for the last decade’s versions of the race (2011 until 2020), with the exception of the 2017 version, as the full hour-per-hour results were not published. The data were retrieved by the official website of the International Ultramarathon Festival (www.dayrunners.gr). The race is performed annually in an asphalt flat 1 km round route at the ex-olympic games Athens 2004 installations (basketball arena), at Hellinikon, Greece. Passing timing data were recorded for every 1 km lap using RFID based electronic timing system (Race Result, Germany). The initial sample consisted of 418 runners (359 men and 59 women. According to Millet et al. (2011) the effective running time in a 24 h maximal effort is 18 h 39±41 min and, as proposed by previous research, a limit of at least 19.2 h (80%) running time was set to exclude those who did not intend to complete the race (Bossi et al., 2017). Thus, after excluding 135 runners who did not meet the criteria, the remaining 283 runners (237 men and 46 women, aged between 24 and 71 years old) were separated based on the total distance covered into 4 performance standard groups (4 quartiles, each consisted of 25% of the total sample) (Santos-Lozano et al., 2014; Renfree and St. Clair Gibson, 2013; Renfree et al., 2016; Bossi et al., 2017): high level (HL, n = 71), moderate to high level (MHL, n = 71), moderate to low level (MLL, n = 71) and low level (LL, n = 70). The pacing profile was examined using three different ways. The first one was by calculating the relative velocity in each one of the 24 h of the race, setting the mean velocity of the runner as the 100% point. The second and the third way proposed were by dividing the race in four and two segments of 6 h and 12 h, respectively, and calculating the relative distance covered in each time based race segment. Coefficient of variation (CV) was also calculated, by dividing the standard deviation of the 24 hours’ running velocities by the overall mean velocity for the race in every runner. The study was approved by a local university ethics committee and was conducted in accordance with the guidelines of the Declaration of Helsinki.
Separate 1-way repeated-measures ANOVAs (or t-test, for the 12 h segment case) with Bonferonni post-hoc were performed to analyze the pacing profiles of the runners. In order to determine if sex and performance standard affect pacing profile (i.e. % mean velocity and % distance covered on selected time segments), separate 2-way mixed ANOVAs were performed with sex (sex X mean velocity and sex X distance covered) and performance standard (performance standard X mean velocity and performance standard X distance covered) as fixed factors. Pearson’s r was used to examine the relationship between CV, total running time and total distance covered by the participants. Effect size was estimated by calculating partial eta squared (η2). Significance level was set at P < 0.05 and all values are presented as mean±standard deviation. All the analyses were performed using the IBM SPSS Statistics 23.
3Results
Mean distance covered was 159.99±36.04 km and effective running time was 23.07±1.30 h. The pacing profile of the runners by their relative hourly velocity revealed a reverse J-shaped strategy. A significant difference between the hourly relative velocities was found (p < 0.001, η2 = 0.481, Fig. 1). Pacing profiles on hourly calculated time segments, expressed by % mean velocity had a significant interaction with performance standard (p < 0.001, η2 = 0.083, Fig. 3), but not with sex (p = 0.774, η2 = 0.002, Fig. 2). Bonferroni post-hoc analysis revealed significant differences between HL-MLL (p = 0.001), HL-LL (p < 0.001), MHL-LL (p < 0.001) and MLL-LL (p < 0.001).
The 6 h segment analysis also revealed a reverse J-shaped pacing profile with significant differences between the % of total distance covered in each part of the race (p < 0.001, η2 = 0.673, Table 1). Although there was not a significant interaction between pacing and sex (p = 0.111, η2 = 0.008, Table 1), a significant interaction was found between pacing and performance standard (p < 0.001, η2 = 0.175, Table 2).
Fig. 1
Overall pacing profile (p < 0.001, η2 = 0.481) - * significant difference from the previous hour (p < 0.01), # significant difference from the first hour (p < 0.01), $ significant difference from the second hour (p < 0.01).
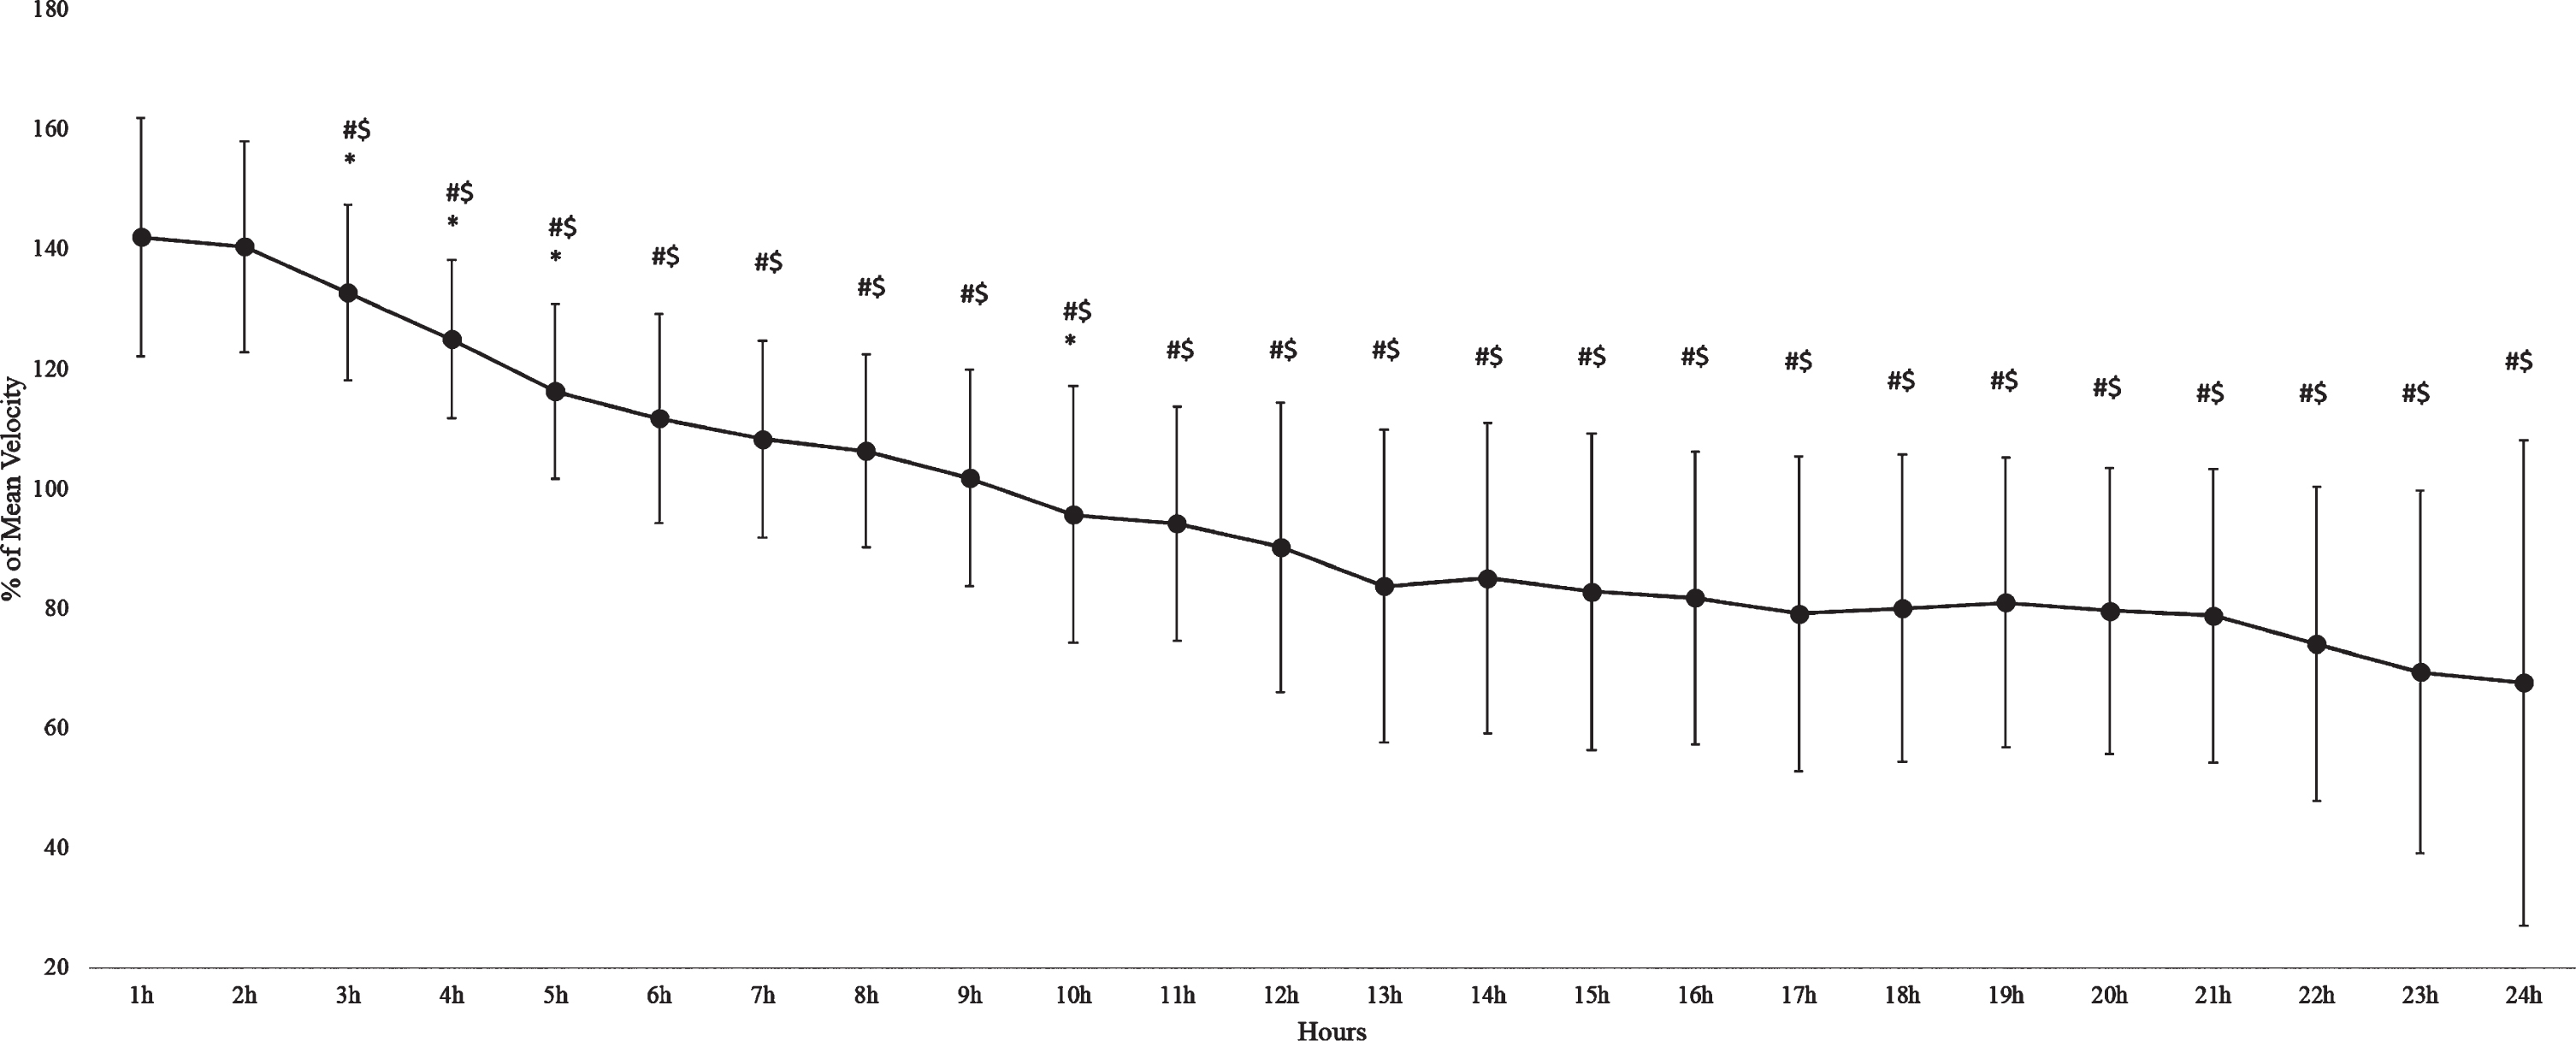
Fig. 2
Hourly pacing profile and sex.
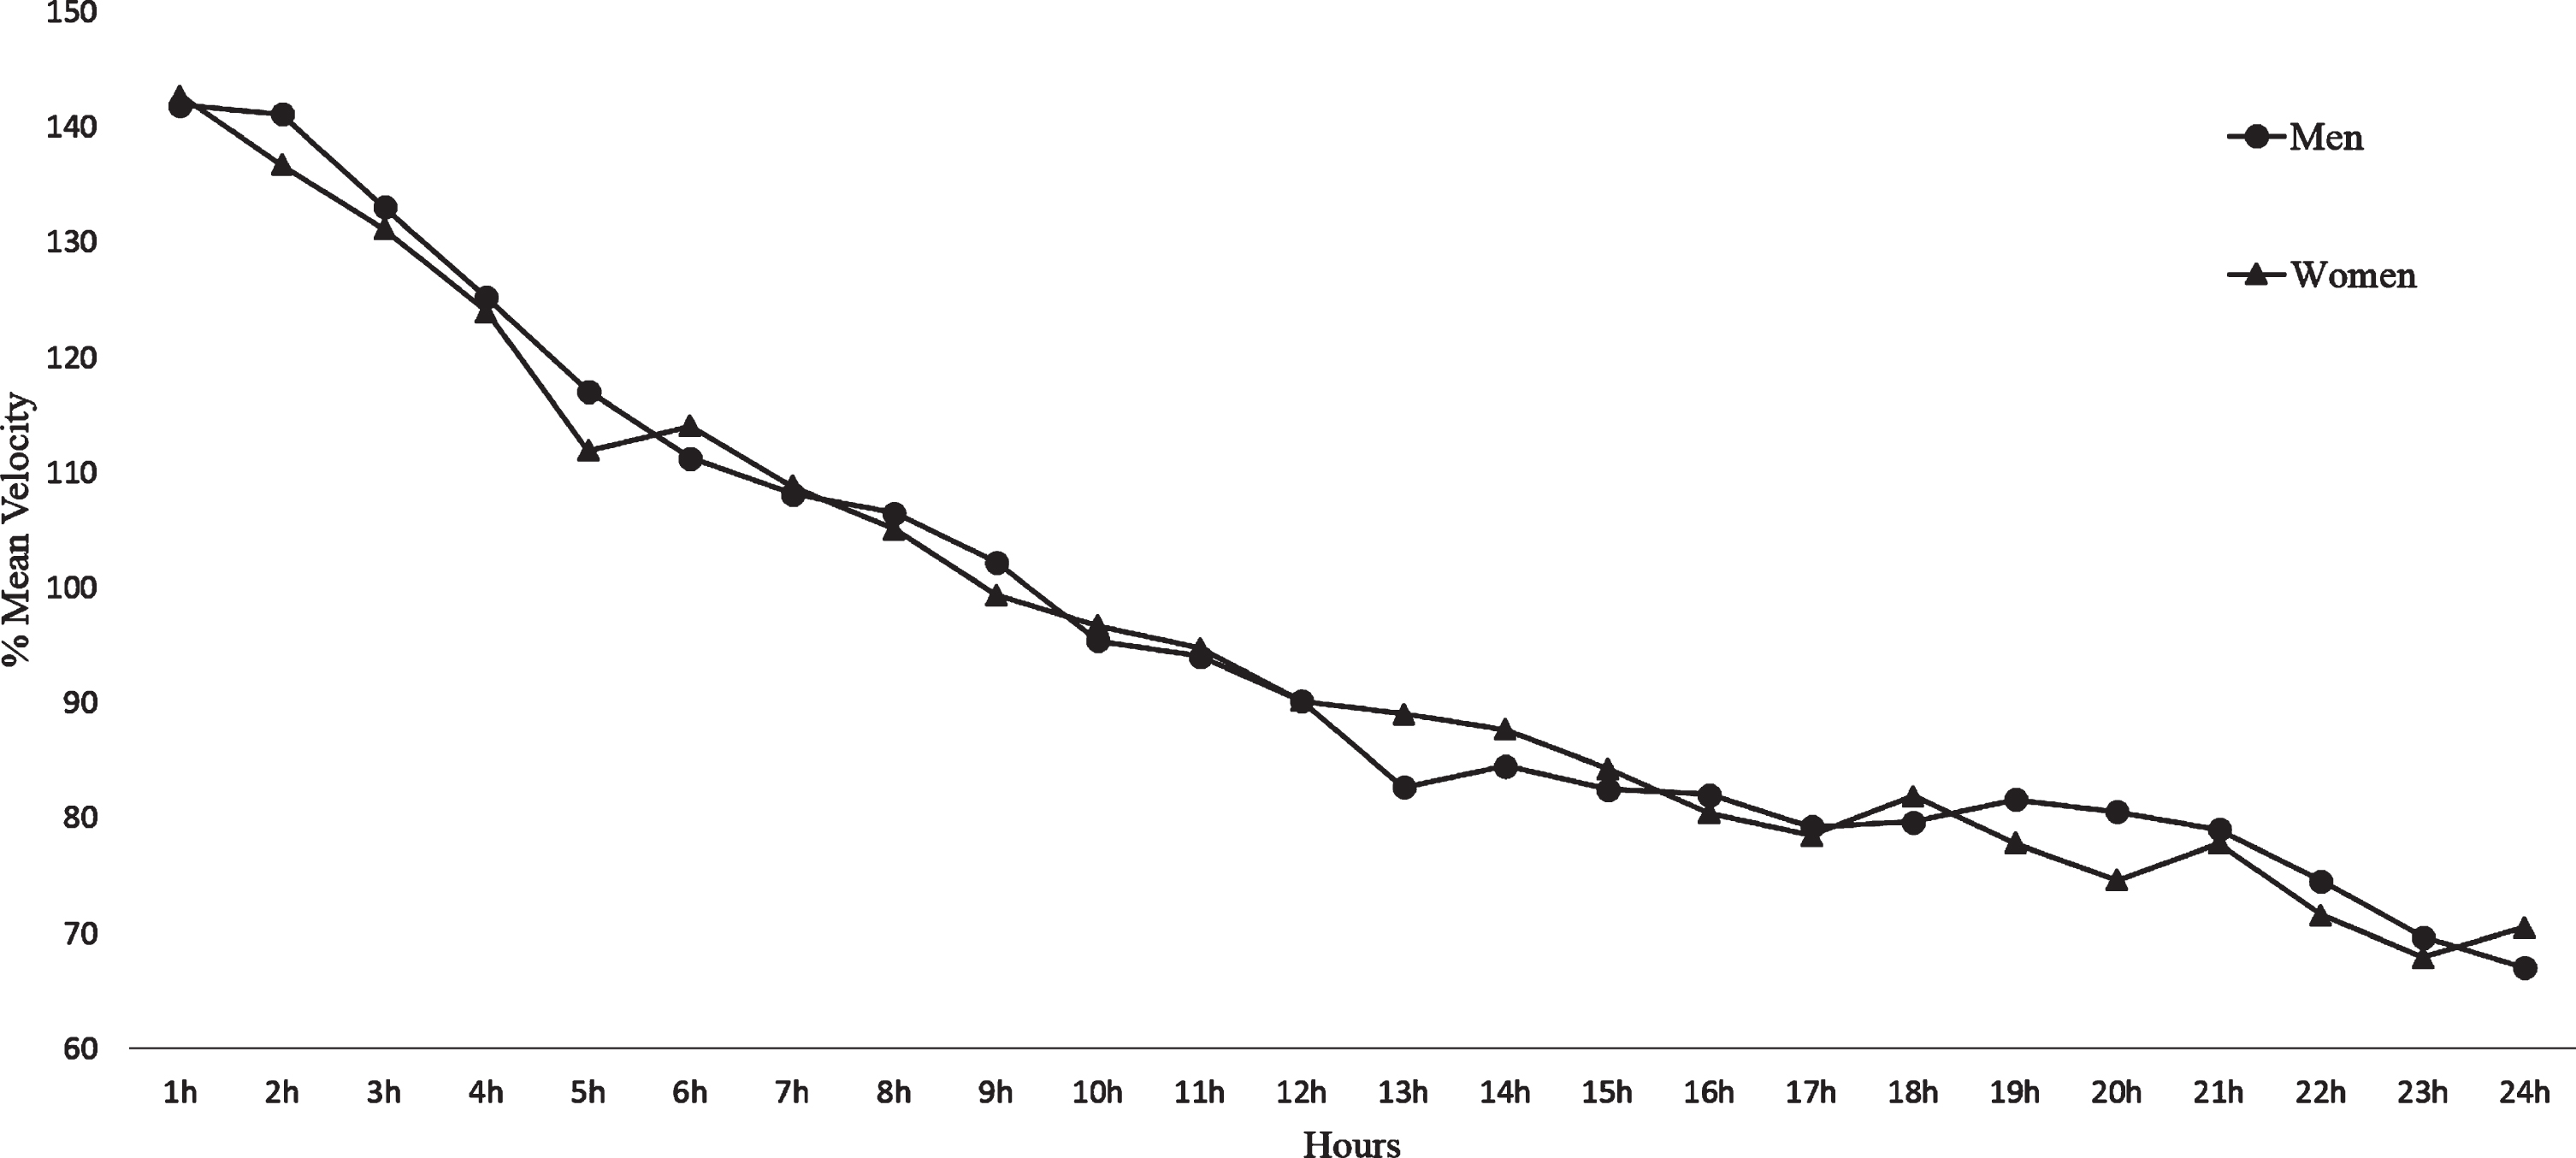
Fig. 3
Hourly pacing profile and performance level (p < 0.001, η2 = 0.083).
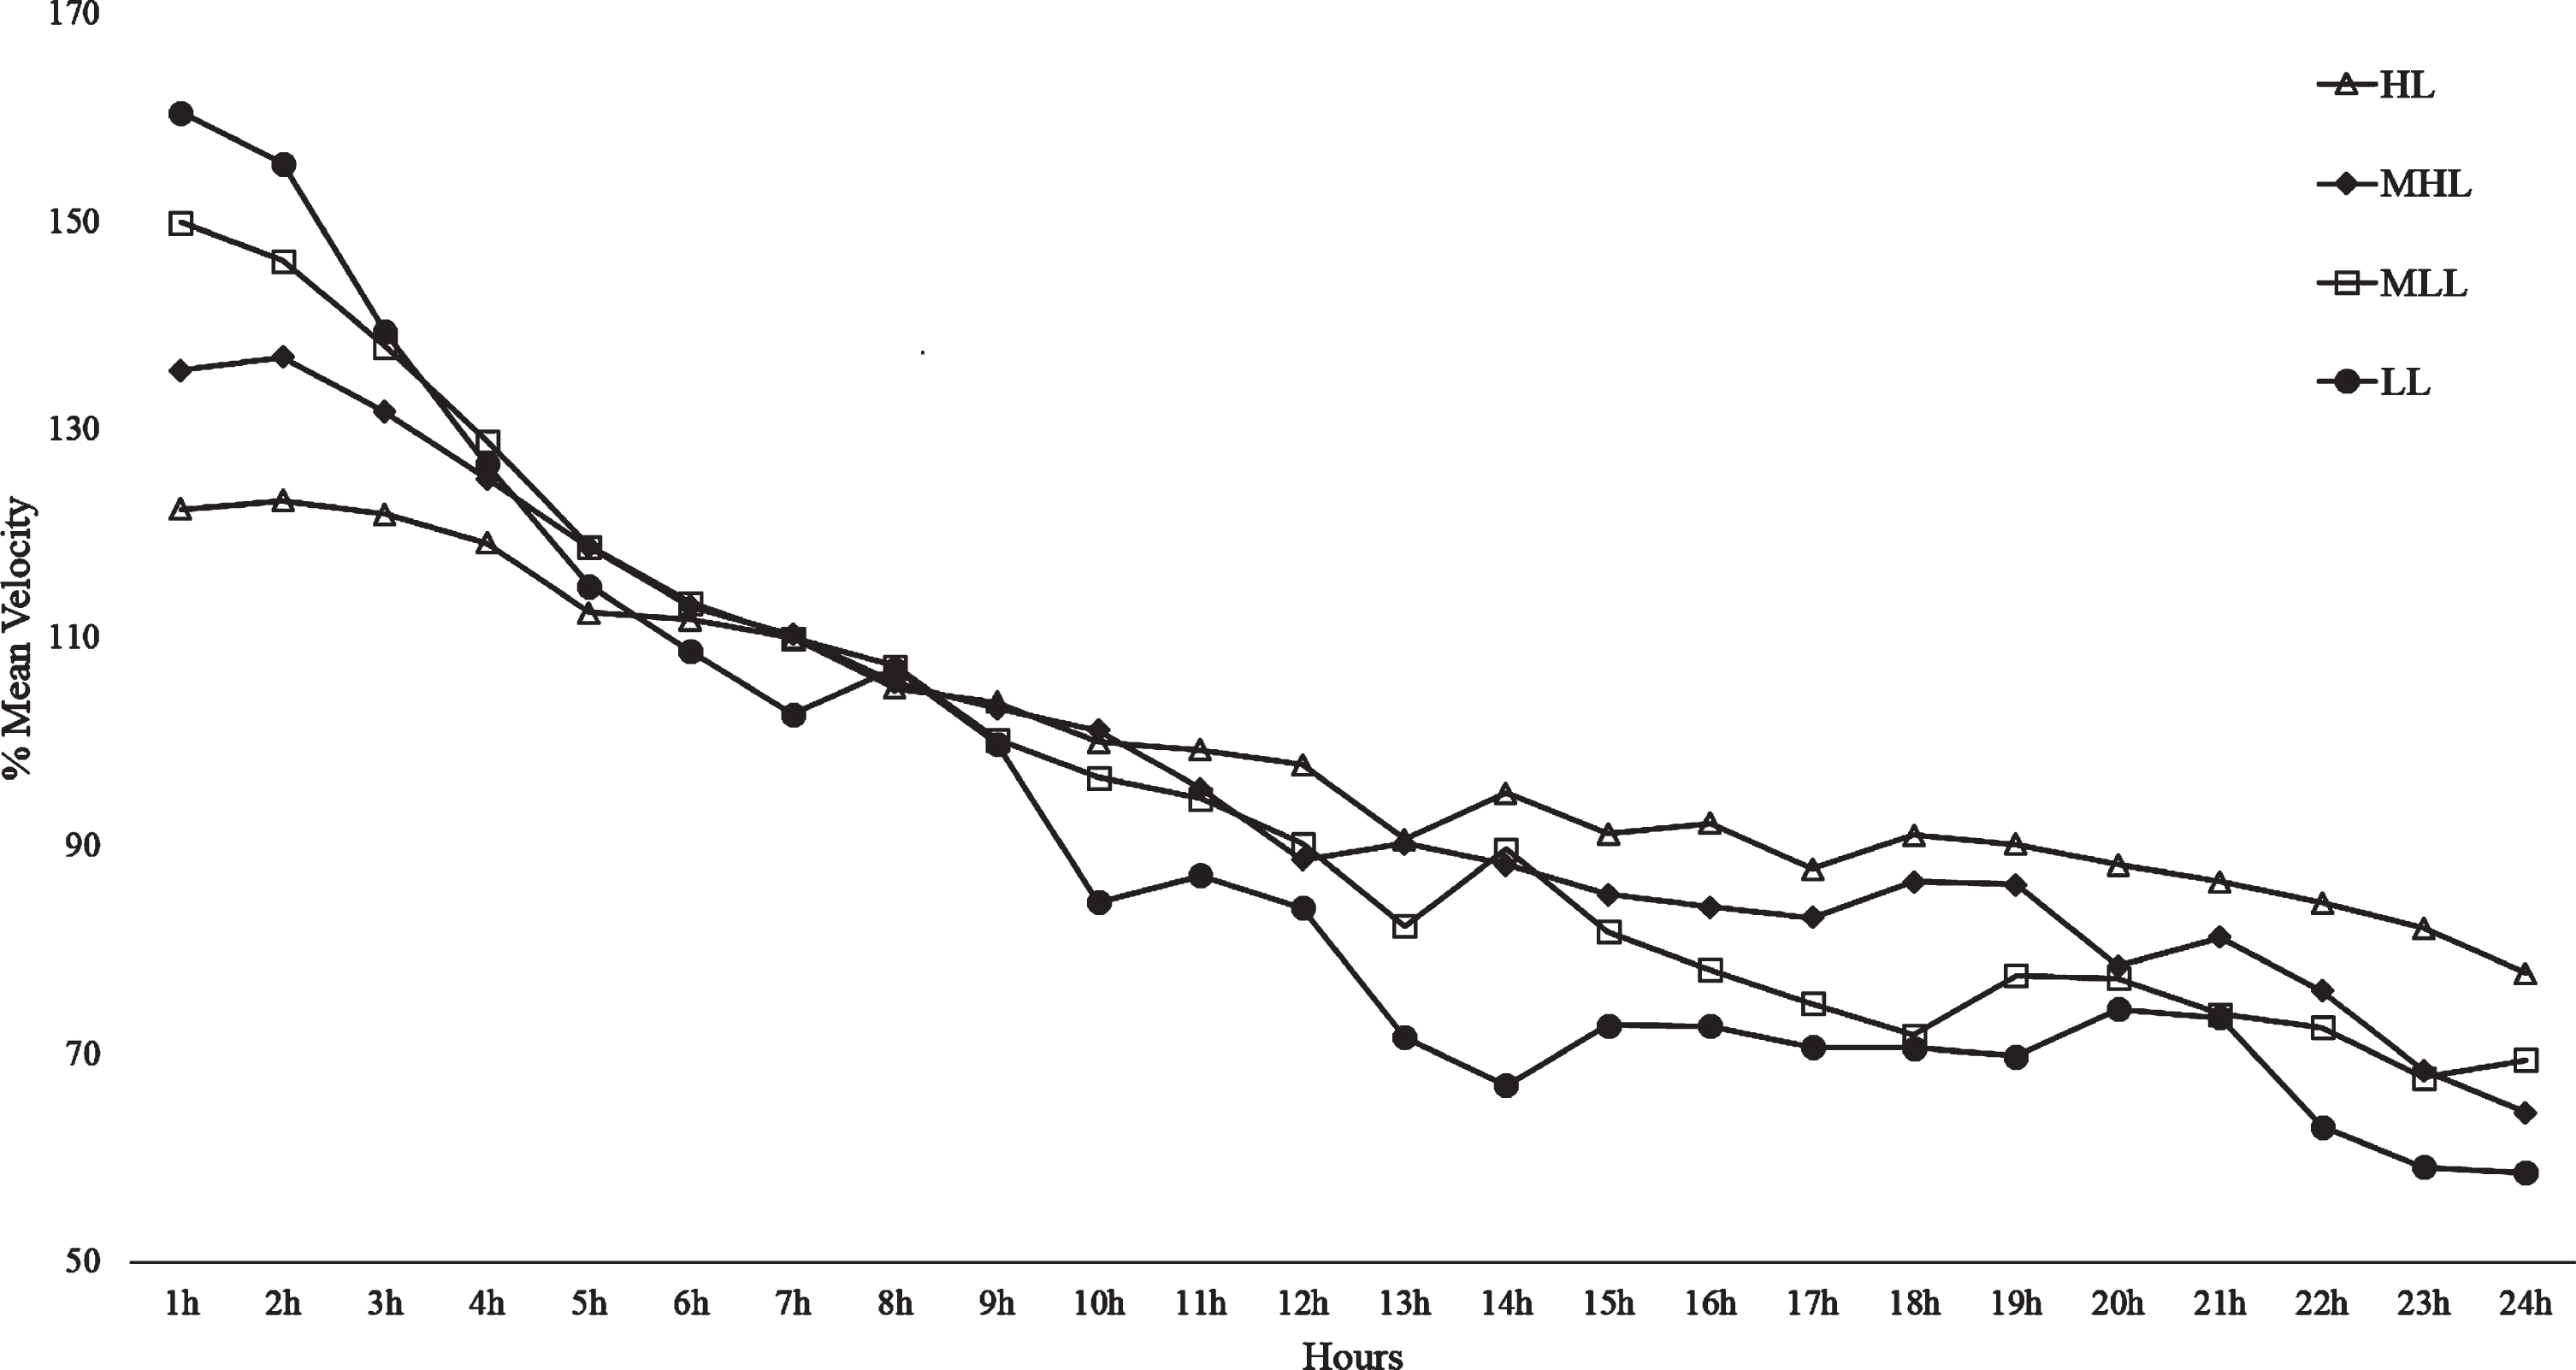
Table 1
Overall and sex descriptive statistics (M±SD)
| Parameter | Overall Data | Men | Women | p | Partial η2 |
| Total Distance (km) | 159.99±36.04 | 158.08±36.49 | 169.85±32.21 | 0.043* | 0.015 |
| Total Running Time (h) | 23.07±1,30 | 23.03±1.33 | 23.31±1.10 | 0.179 | 0.006 |
| CV (%) | 29.7±11.6 | 30.6±11.6 | 25.2±10.6 | 0.004* | 0.029 |
| Distance covered 1 h–6 h (%) | 33.43±3.83 | 33.67±3.84 | 32.22±3.55 | 0.111 | 0.008 |
| Distance covered 7 h–12 h (%) | 25.88±2.85 | 25.76±2.91 | 26.51±2.42 | ||
| Distance covered 13 h–18 h (%) | 21.30±3.33 | 21.18±3.42 | 21.89±2.79 | ||
| Distance covered 19 h–24 h (%) | 19.39±4.83 | 19.39±4.99 | 19.38±3.98 | ||
| Distance covered 1 h–12 h (%) | 59.31±5.17 | 59.43±5.20 | 58.73±4.98 | 0.403 | 0.002 |
| Distance covered 13 h–24 h (%) | 40.69±5.17 | 40.57±5.20 | 41.27±4.98 |
*Significant difference between men and women.
Table 2
Descriptive statistics (M±SD) of the four performance levels
| Parameter | HL | MHL | MLL | LL | p | Partial η2 |
| Total Distance (km) | 208.04±17.61 | 170.79±8.13 | 144.72±7.05 | 115.81±12.65 | < 0.001* | 0.888 |
| Total Running Time (h) | 23.84±0.51 | 23.38±1.13 | 23.11±1.09 | 21.95±1.46 | < 0.001* | 0.288 |
| CV (%) | 17.9±6.9 | 27.1±8.4 | 32.7±7.9 | 41.4±8.2 | < 0.001* | 0.544 |
| Distance covered 1 h–6 h (%) | 29.84±2.02 | 32.63±2.69 | 34.48±2.87 | 36.84±3.63 | <0.001* | 0.175 |
| Distance covered 7 h–12 h (%) | 25.86±1.63 | 25.93±2.48 | 25.96±2.80 | 25.76±4.03 | ||
| Distance covered 13 h–18 h (%) | 22.98±2.09 | 22.17±2.56 | 20.69±3.01 | 19.33±4.12 | ||
| Distance covered 19 h–24 h (%) | 21.32±2.90 | 19.27±4.88 | 18.87±4.78 | 18.07±5.80 | ||
| Distance covered 1 h–12 h (%) | 55.70±3.07 | 58.56±4.35 | 60.43±4.41 | 62.60±5.86 | < 0.001* | 0.241 |
| Distance covered 13 h–24 h (%) | 44.30±3.07 | 41.44±4.35 | 39.57±4.41 | 37.40±5.86 |
*Significant difference between performance levels.
When the 24 h ultra-marathon race was divided in two 12 h segments, the repeated measures t-test showed that significantly higher percentage of the total distance was covered during the first part of the race (p < 0.001, η2 = 0.765, Table 1). As mentioned above, a significant interaction was found between pacing and performance standard (p < 0.001, η2 = 0.241, Table 2), but not between pacing and sex (p = 0.403, η2 = 0.002, Table 1).
The overall CV was 29.7±11.6%. CV was significantly different between men and women (Table 1). Significant differences were also found between performance levels (Table 2), with Bonferroni post-hoc test revealing differences between all possible group combinations (p < 0.001). Moderate positive significant correlation was found between total distance covered and total running time (0.538, p < 0.001) and moderate to high negative correlation between CV and total distance covered (–0.761, p < 0.001), as well as between CV and total running time (–0.753, p < 0.001).
4Discussion
The results of the present study showed that the runners followed a reverse J-shaped pacing profile. The positive pacing found indicated that the running velocity decreased progressively throughout the race, without being affected by the sex. However, it was clear that the variations in velocity reduced as the performance standard increased.
The pacing profile of the participants in the 24 h race of the last decade’s International Ultramarathon Festival held in Athens-Hellinikon, Greece, confirmed that runners in such events follow a reverse J-shaped profile, as found in previous research (Bossi et al., 2017; Inoue et al., 2019). It was quite noteworthy that almost 60% (59.31±5.17%) of the total distance was covered by the runners during the first half of the 24 h race, likewise 33.43±3.83% was covered during the first 6 hours, with a significant thereafter progressive reduction of the percentage of the distance covered during the following segments of the race.
Velocity changes throughout the race, expressed by CV, were inversely correlated with the total distance covered by the runners, indicating that better runners run with a more even pacing strategy than slower runners (Hoffman, 2014; Takayama et al., 2016; Inoue et al., 2019). The CV values in the present study are higher than those reported in a 100 km ultra-marathon race (Lambert et al., 2004; Renfree et al., 2016), but comparable with those published in a previous 24 h ultra-marathon race (Takayama et al., 2016), featuring the extreme physiological and biochemical demands of the prolonged submaximal effort (Gimenez et al., 2013; Baumann et al., 2014; Millet et al., 2011; Martin et al., 2010). Furthermore, to the best of our knowledge it is the first time CV is directly compared between the two genders in an ultra-endurance running event, showing that men experienced greater changes in their velocity during the race when compared to women.
In accordance with existing literature (Renfree et al., 2016; Knechtle et al., 2015; Lambert et al., 2004; Takayama et al., 2016; Bossi et al., 2017; Inoue et al., 2019), the successful pacing profile followed by the better participants was due to the fact that they ran in lower relative velocity at the beginning of the race, maintaining higher percentage of their mean velocity during the final parts of the race, than the slower runners, which may be due to physiological (differences in running economy, energy utilization, etc. between different performance standard runners) (Sjodin and Svedenhag, 1985) and psychological variables (Renfree and St. Clair Gibson, 2013).
Although performance standard seems to affect pacing followed by runners in the 24 h ultra-mara-thon, the hypothesis that sex would also play an important role in pacing was not confirmed. In the present study men and women had the same pacing profile. These results are in accordance with Bossi et al. (2017), although other studies have found significant sex by performance standard and sex by relative velocity interaction (Inoue et al., 2019). Furthermore, previous studies indicated that women follow a more even pacing profile than men in various distances, from marathon (Hanley, 2016; March et al., 2011; Deaner et al., 2015; Trubee et al., 2014) to ultra-marathon (Renfree et al., 2016). The differences in pacing between genders found in the literature may be explained by physiological (Temesi et al., 2015; Devries, 2016) and psychological (Renfree et al., 2016; Deaner et al., 2015; Deaner, 2013) parameters. Although, the fact that we did not find any significant differences in pacing between men and women may be explained by other factors, such as the different nature of work distribution in time-based and distance-based endurance events (Abbiss and Laursen, 2008), the small percentage of women runners in the examined races (16% vs 84% of men participants) and a possible herd principle, as proposed in previous research (Bossi et al., 2017).
The results of this study could be of great interest for ultra-endurance runners and their coaches. In order to create a pacing strategy for an upcoming ultra-endurance running event, the runners should take into consideration that with the existing data the most effective seems to be a more even pacing profile. The participants may consider to begin running in a constant velocity, trying to maintain it with the minimum possible variations in velocity. The runners are advised to have their individual mean velocity as accurately as possible identified prior to the race, in order to be able to follow the appropriate pacing strategy. Although, it is quite clear that better performance in ultra-marathon events is not achieved just by following a good pacing strategy. Further research is required in order to come to safer conclusions.
In summary, the results of the present study confirmed that ultra-marathon runners use a reverse J-shaped pacing profile during a 24 h race, with a progressive reduction of running velocity throughout the race. Variations in velocity were negatively correlated with total distance covered, indicating that even strategy might be the most appropriate in 24 h ultra-marathon events. It was also found that men and women did not differ in their profiles, while performance standard affected the pacing profile of the runners, with faster participants following a more even strategy than those of lower-level.
Acknowledgments
The authors declare no conflicts of interest and no funding.
References
1 | Abbiss, C.R. and Laursen, P.B. , (2008) , Describing and understanding pacing strategies during athletic competition, Sports Medicine, 38: (3), 239–252. |
2 | Baumann, C.W. , Brandenberger, K.J. , Ferrer, D.A. and Otis, J.S. , (2014) , Physiological Parameters Associated with 24 Hour Run Performance, International Journal of Sport Studies, 4: (12), 1450–1454. |
3 | Bossi, A.H. , Matta, G.G. , Millet, G.Y. , Lima, P. , Pertence, L.C. , de Lima, J.P. and Hopker, J.G. , (2017) , Pacing Strategy During 24-Hour Ultramarathon-Distance Running, International Journal of Sports Physiology and Performance, 12: , 590–596. |
4 | Coast, J.R. , Blevins, J.S. and Wilson, B.A. , (2004) , Do gender differences in running performance disappear with distance? Canadian Journal of Applied Physiology, 29: (2), 139–145. |
5 | Deaner, R.O. , (2013) , Distance running as an ideal domain for showing a sex difference in competitiveness, Archives of Sexual Behavior, 42: , 413–428. |
6 | Deaner, R.O. , Carter, R.E. , Joyner, M.J. and Hunter, S.K. , (2015) , Men are More Likely than Women to Slow in the Marathon, Medicine & Science in Sports & Exercise, 47: (3), 607–616. |
7 | Devries, M.C. , (2016) , Sex-based differences in endurance exercise muscle metabolism: impact on exercise and nutritional strategies to optimize health and performance in women, Experimental Physiology, 101: , 243–249. |
8 | Foster, C. , Hoyos, J. , Earnest, C. and Lucia, A. , (2005) , Regulation of Energy Expenditure during Prolonged Athletic Competition, Medicine & Science in Sports & Exercise, 37: (4), 670–675. |
9 | Gimenez, P. , Kerherve, H. , Messonnier, L.A. , Feasson, L. and Millet, G.Y. , (2013) , Changes in the Energy Cost of Running during a 24-h Treadmill Exercise, Medicine & Science in Sports & Exercise, 45: (9), 1807–1813. |
10 | Haney, T.A. and Mercer, J.A. , (2011) , A Description of Variability of Pacing in Marathon Distance Running, International Journal of Exercise Science, 4: (2), 133–140. |
11 | Hanley, B. , (2015) , Pacing profiles and pack running at the IAAF World Half Marathon Championships, Journal of Sports Sciences, 33: (11), 1189–1195. |
12 | Hanley, B. , (2016) , Pacing, packing and sex-based differences in Olympic and IAAF World Championship marathons, Journal of Sports Sciences, 34: (17), 1675–1681. |
13 | Hoffman, M.D. , (2014) , Pacing by Winners of a 161-km Mountain Ultramarathon, International Journal of Sports Physiology and Performance, 9: , 1054–1056. |
14 | Hohl, R. , de Rezende, F.N. , Millet, G.Y. , da Mota, G.R. and Marocolo, M. , (2019) , Blood cardiac biomarker responses are associated with 24h ultramarathon performance, Heliyon, 5: (6), e01913. |
15 | Inoue, A. , Santos, T.M. , Hettinga, F.J. , Alves, D.D. , Viana, B.F. , Terra, B.D. and Pires, F.D. , (2019) , The Impact of Sex and Performance Level on Pacing Behavior in a 24-h Ultramarathon, Frontiers in Sports and Active Living, 1: , 1–11. |
16 | Knechtle, B. , Valeri, F. , Nikolaidis, P.T. , Zingg, M.A. , Rosemann, T. and Rüst, C.A. , (2016) , Do women reduce the gap to men in ultra-marathon running? SpringerPlus, 5: (1), 2016–10.1186/s40064-016-2326-y. |
17 | Knetchle, B. , Rosemann, T. , Zingg, M.A. , Stiefel, M. and Rust, C.A. , (2015) , Pacing strategy in male elite and age group 100 km ultra-marathoners, Open Access Journal of Sports Medicine, 6: , 71–80. |
18 | Lambert, M.I. , Dugas, J.P. , Kirkman, M.C. , Mokone, G.G. and Waldeck, M.R. , (2004) , Changing in running speeds in a 100 km ultra-marathon race, Journal of Sports Science and Medicine, 3: , 167–173. |
19 | March, D.S. , Vanderburgh, P.M. , Titlebaum, P.J. and Hoops, M.L. , (2011) , Age, sex, and finish time as determinants of pacing in the marathon, Journal of Strength and Conditioning Research, 25: , 386–391. |
20 | Martin, V. , Kerhervé, H. , Messonnier, L.A. , Banfi, J.C. , Geyssant, A. , Bonnefoy, R. , Féasson, L. and Millet, G.Y. , (2010) , Central and peripheral contributions to neuromuscular fatigue induced by a 24-h treadmill run, Journal of Applied Physiology, 108: , 1224–1233. |
21 | Matta, G.G. , Bossi, A.H. , Millet, G.Y. , Lima, P. , de Lima, J.P. and Hopker, J.G. , (2019) , Influence of a slow-start on overall performance and running kinematics during 6-h ultramarathon races, European Journal of Sport Science, 16: , 1–10. |
22 | Millet, G.Y. , Banfi, G.C. , Kerherve, H. , Morin, J.B. , Vincent, L. , Estrade, C. , Geyssant, A. and Feasson, L. , (2011) , Physiological and biological factors associated with a 24h treadmill ultra-marathon performance, Scandinavian Journal of Medicine and Science in Sports, 21: , 54–61. |
23 | Nikolaidis, P.T. , Cuk, I. and Knechtle, B. , (2019) , Pacing of Women and Men in Half-Marathon and Marathon Races, Medicina, 55: (1), E14. |
24 | Renfree, A. and St Clair Gibson, A. , (2013) , Influence of Different Performance Levels on Pacing Strategy during the Women’s World Championship Marathon Race, International Journal of Sports Physiology and Performance, 7: , 279–285. |
25 | Renfree, A. , do Carmo, E.C. and Martin, L. , (2016) , The influence of performance level, age and gender on pacing strategy during a 100-km ultramarathon, European Journal of Sport Science, 16: (4), 409–415. |
26 | Santos-Lozano, A. , Collado, P.S. , Foster, C. , Lucia, A. and Garatachea, N. , (2014) , Influence of Sex and Level on Marathon Pacing Strategy. Insights from the New York City Race, International Journal of Sports Medicine, 35: (11), 933–938. |
27 | Scheer, V. , (2019) , Participation Trends of Ultra Endurance Events, Sports Medicine and Arthroscopy Review, 27: (1), 3–7. |
28 | Sjodin, B. and Svhag, J. , (1985) , Applied physiology of marathon running, Sports Medicine, 2: , 83–99 eden. |
29 | Takayama, F. , Aoyagi, A. and Nabekura, Y. , (2016) , Pacing strategy in a 24-hour ultramarathon race, International Journal of Performance Analysis in Sport, 16: , 498–507. |
30 | Temesi, J. , Arnal, P.J. , Rupp, T. , Féasson, L. , Cartier, R. , Gergelé, L. , Verges, S. , Martin, V. and Millet, G.Y. , (2015) , Are females more resistant to extreme neuromuscular fatigue? Medicine & Science in Sports & Exercise, 47: , 1372–1382. |
31 | Trubee, N.W. , Vanderburgh, P.M. , Diestelkamp, W.S. and Jackson, K.J. , (2014) , Effects of heat stress and sex on pacing in marathon runners, Journal of Strength and Conditining Research, 28: , 1673–1678. |
32 | Waldvogel, K.J. , Nikolaidis, P.T. , Di Gangi, S. , Rosemann, T. and Knechtle, B. , (2019) , Women Reduce the Performance Difference to Men with Increasing Age in Ultra-Marathon Running, International Journal of Environmental Research and Public Health, 16: (13), 2377. |
33 | World Athletics 2020, Ultra Running, Available at https://www.worldathletics.org/disciplines/ultra-running/ultra-running, Accessed May 15, 2020. |


