
Overtaking in Formula 1 during the Pirelli era: A driver-level analysis
Abstract
The introduction of DRS and rapidly-degrading tires in 2011 boosted on-track overtaking levels in Formula 1 to unprecedented highs. Since then, overtaking has steadily decreased again, culminating in a 60-percent reduction in 2017. In this paper, using a Poisson model on individual-level overtaking data from 2011 to 2018, it was found that about half the decrease can be attributed to the cars, 20 to 30 percent to the reduction in field size and about 20 percent to more uniform race strategies.
1Introduction
Overtaking is an essential ingredient in motor racing. However, in Formula 1, overtaking has been somewhat difficult since at least the 1980s due to the strong reliance on aerodynamic downforce, which creates wake turbulence (Mafi, 2007; Newbon, Sims-Williams, and Dominy, 2016), in combination with the twisty nature of the tracks, which prevents large-scale slipstreaming. As a result, in Formula 1, wheel-to-wheel battles and subsequent overtakes have not been very common throughout most of its history.
Over the years, several attempts have been made to increase overtaking. Usually aerodynamic downforce was reduced in order to reduce wake turbulence. This was especially true for the 2009 regulation changes, which aimed at a 50-percent reduction in downforce (Newbon, Sims-Williams, and Dominy, 2017). Also more overtaking-friendly tracks, consisting of long straights and long braking zones, were added to the calendar.
The most important changes took place between 2010 and 2011. In-race refueling had been banned in 2010 and at the end of that season, tire supplier Bridgestone pulled out of the sport and was replaced by Pirelli. The 2011 season would become the start of the high-tire-degradation era, as Pirelli was required to artificially increase tire degradation. Along with the change of tire suppliers, DRS (Drag Reduction System, a driver-adjustable rear wing to increase top speed) was introduced to boost overtaking.
The 2011 rule changes proved to be highly successful, as (dry-race) overtaking tripled from 2010 to 2011 (Clip the Apex, n.d.). In fact, there was far more overtaking in 2011 than there had been in at least the previous three decades. The introduction of DRS is generally thought of as the main reason for the big increase in on-track overtaking in 2011, but it is unknown to what extent the rapidly-degrading tires contributed to this, as these changes took place simultaneously. An analysis at the end of the 2011 season revealed that nearly half of the overtakes took place in DRS zones (Mercedes Brazilian GP feature, 2011), but it is unclear how many of these overtakes would have occurred without the help of DRS.1
Since the ban on in-race refueling in 2010, race strategies have only been dictated by tire wear. Back in 2010, tire monopolist Bridgestone generally produced very durable tires, which greatly limited the available strategic options. The sole exception was the 2010 Canadian Grand Prix, a race characterized by very high degradation, which was arguably one of the most entertaining races of the season. As a result of this, high tire degradation was thought to be a magic tool to produce more interesting races.
Tire stops are fundamentally different from the fuel stops that were usually blamed for the lack of on-track action in the late-1990s and the early-2000s (Merlino, 2007). With fuel stops, drivers not only lose track position when they pit, they also lose speed as the added fuel load slows them down. As a result, drivers could relatively easily jump one another during the pit-stop sequence. Tire stops, on the other hand, trade track position for speed. This produces the situation in which cars on fresh tires are continually trying to regain lost track position, which creates on-track battles and induces on-track overtaking. Therefore, the rapidly-degrading tires likely played a part in the very good overtaking statistics in 2011.
2011 turned out to be the high-water mark in terms of overtaking. Despite the large-scale introduction of double DRS zones, the following seasons saw a gentle but steady decrease, culminating in a 60-percent reduction in 2017, to a level not too dissimilar to the (pre-DRS) 2010 overtaking levels (Clip the Apex, n.d.). It is not entirely clear what caused this decrease. The collapse of the teams that entered in 2010 and the subsequent reduction in grid size likely contributed to this. Furthermore, small aerodynamic changes intended to slow the car down by reducing ground-effect downforce may have increased the difficulty of following another car, as well as the wider, more aerodynamically-dependent cars stipulated by the 2017 rules (Kelsall, 2018). However, their exact impact on overtaking is unknown. Therefore, in this paper, a detailed model on the driver level is used to get a better understanding to what factors caused the season-to-season changes in overtaking frequencies.
2Data
In this paper, overtaking data is combined with lap-time data. The detailed overtaking statistics are provided by Clip the Apex, which is compiled by race enthusiasts and has the most complete and accurate overtaking data available. The number of overtakes are derived from lap charts, in combination with actual race footage, as passes may be obscured in the lap charts by pit-stops or retirements. Not every on-track position change automatically counts as an overtake. Throughout this paper, the Clip the Apex definition is used, which excludes position changes on the first lap, position changes due to drivers yielding (surrendering the place without fighting), or car problems (Clip the Apex, n.d.). In this paper, only dry races are analyzed, to exclude the possibility that bad weather affects overtaking. Races under changeable weather conditions are especially hard to compare, so wet-weather races are ignored for fair intra-season comparisons. In this paper, wet-weather races are defined as races in which at least one driver uses wet-weather tires at some point in the race.
The overtaking data is combined with lap-time and pit-stop data derived from the Ergast API (Newell, 2009). Data from 2011 to 2018 is used in the analysis. This includes 158 races, of which 141 are dry. Excluding the drivers who retired from the race before the end of the first lap (and were therefore unable to affect the overtaking statistics), this leaves me with 2932 different driver-race combinations (the observations).
The combined dataset contains information on the number of times any driver passed or was passed by another driver in the race, as well as timing information, such as the race order at the end of the first lap and the fastest lap-times during the weekend. Race strategies, such as the number of pit-stops and the timing of the first pit-stop, are also known.
3Theoretic framework
3.1Introduction
Overtaking in Formula 1 has not received a lot of attention in scientific literature. Some attention is given to aerodynamics and their detrimental effect on overtaking (Mafi, 2007), but an in-depth analysis on overtaking is still missing. As overtaking varies a lot on a race-to-race basis, focusing solely on the impact of aerodynamics misses out on a lot of other factors.
A prerequisite for overtaking is the presence of a faster car behind a slower car. However, as the best grid slots are awarded to the fastest drivers in qualifying, the faster cars tend to be ahead of the slower cars. Drivers may still find themselves chasing a slower car for several reasons. First, they may have been out of position at the beginning of the race due to a bad start or a grid penalty. Second, they may be out of position during the pit-stop sequence later in the race. Third, their race pace may be strong compared to their qualifying pace. All in all, there are quite a few ways in which faster cars can be trapped behind slower cars, generating overtaking potential. The actual amount of overtaking then depends on how easily this potential can be converted into actual overtakes, which depends on the overtake-friendliness of the track, the effectiveness of DRS and the amount of wake turbulence produced by the cars.
The wake turbulence is likely affected by regulation changes on the aerodynamic level. During the Pirelli/DRS era the rules have changed dramatically. These rule changes were not only on an aerodynamic level (for example, the wider cars stipulated by the 2017 rules, see Fédération Internationale de l’Automobile, 2017), but also on the engine level (the switch to turbo engines in 2014) and on the tire level (after initially decreasing the durability of the tires, Pirelli has become more conservative since mid-2013). Table 1 shows the most important rule changes per season.
Table 1
Most important rule changes per season
| Season | Rule changes |
| 2011 | Pirelli tires, DRS2, gradual introduction of double DRS zones |
| 2012 | Ban of blown diffuser3, reduction of the height of the nose4 |
| 2013 | |
| 2014 | Turbo engines5, fuel and fuel-flow limit, reduction of the height of the nose6 |
| 2015 | Reduction of the height of the nose7 |
| 2016 | Third tire compound8 |
| 2017 | Wider cars and tires9, fuel limit increased to 105 kg10 |
| 2018 | Halo11, introduction of triple DRS zones |
The overtake-friendliness of the tracks or the wake turbulence created by the cars cannot be directly observed, so the analysis focuses on the observable factors that may influence overtaking on the driver level to indirectly estimate these unobservable factors. The observable factors largely come in four categories: the reliability and field size, pit-stops, the magnitude to which cars are being out of position after the start and pit-stops, and the interference of the safety car, which are briefly discussed below.
3.2Reliability and field size
The number of overtakes per race likely increases with the number of cars. A larger field size and better reliability (lower breakdown rates) help increase the number of cars circulating at any given moment, thereby increasing the likelihood of overtaking. However, as reliability is fairly good nowadays (mechanical issues, driver errors and collisions typically reduce the total race distance completed by the field by only 5 to 10 percent compared to its maximum), the impact on race-to-race or year-to-year variation in overtaking is likely limited.
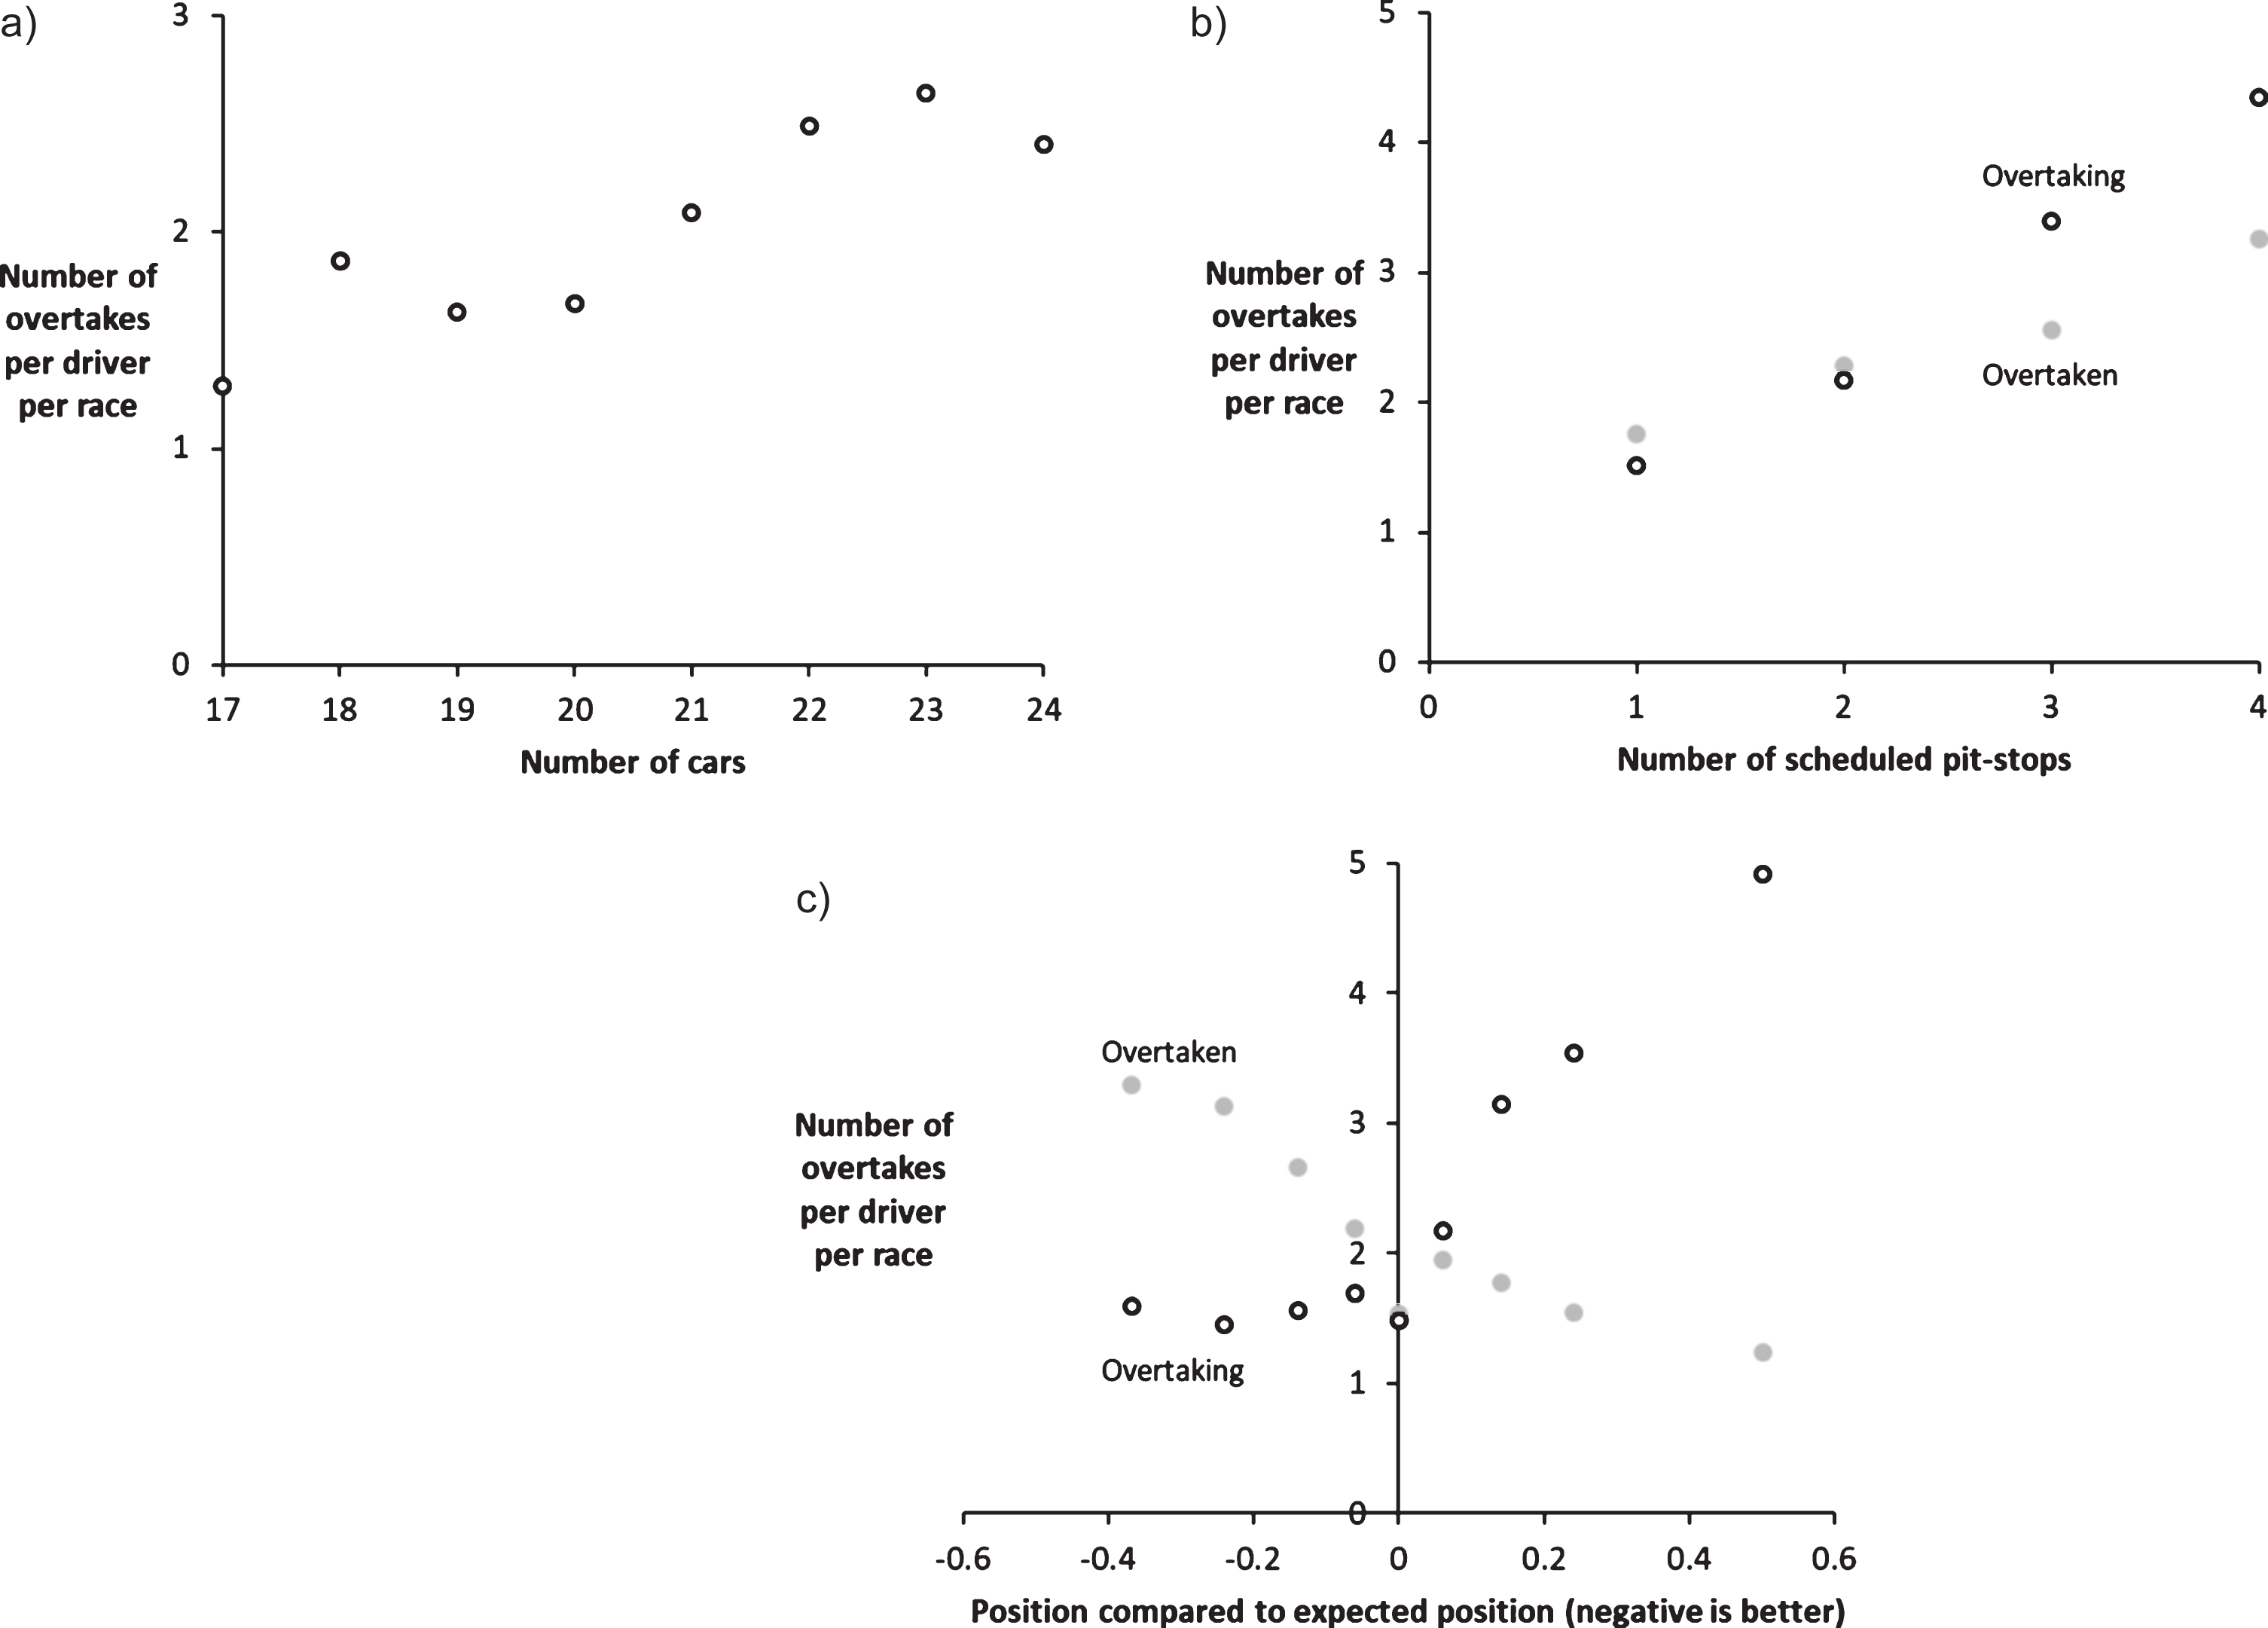
Figure 1a shows that throughout the study period there is a strong positive correlation between the number of cars surviving the first lap of the race and the average number of passes per driver in that race, indicating that a larger field size more than proportionally increases overtaking. This positive correlation may, however, also be the result of overtaking being easier when the field was large (in 2011 and 2012) than when it was smaller (in 2015, 2017 and 2018), which is not taken into account.
Fig. 1
a to c: Correlation of overtaking on an individual level with various controls. a) Overtaking plotted against the number of cars. b) Overtaking plotted against the number of scheduled pit-stops. c) Overtaking plotted against position at the start relative to expected race-pace.
3.3Pit-stops
Pit-stops may also mix up the order, and as a result they may have a strong effect on overtaking. Pit-stops may promote pit-lane overtaking (the most common method of using pit-stops to gain places is the so-called undercut, in which a driver uses the performance advantage of his fresh tires to jump a rival by pitting earlier), but at the same time they allow drivers to trade track position for speed, which usually produces new on-track battles and creates overtaking potential, especially during the pit window. It is unknown which effect dominates. On the driver level, there is a strong relationship between the number of pit-stops and the number of overtakes, shown in Fig. 1b. Again, this relationship does not prove that pit-stops increase overtaking, as overtaking may have been intrinsically easier when multiple-pit-stop races were more common.
One may expect pit-stops to boost overtaking when many drivers are on different strategies, in which drivers who pit more often have to use their fresh tires to make up time and positions in the race. Also, if the first round of pit-stops starts early, drivers will lose more positions, as the field is still close, which could also induce overtaking. This effect is especially strong if the front-runners pit earlier than the back-markers. Furthermore, unscheduled pit-stops (these are pit-stops to repair accident damage, such as a broken front wing or a puncture) may induce overtaking as well, especially when fast cars are involved. As a result, drivers may encounter a lot of other cars after an unscheduled stop, especially when it occurs early in the race.12
3.4Cars being out of position
If a fast car starts from the back of the grid, it is almost guaranteed to do some overtaking. The degree to which a car is out of position can be determined by comparing its position at the beginning of the race (at the end of the first lap to be exact) with its rank based on its expected race-pace. In this case, the fastest lap of the weekend is used as a proxy for race pace. If a driver is in a worse position than where he would be based on his expected race-pace, he is more likely to overtake another car himself and less likely to be overtaken, whereas the opposite is true if a driver is in a better place than expected. Figure 1c shows that these effects are nonlinear, especially on the number of cars a driver manages to overtake (open circles), whereas the number of times a driver is overtaken (solid dots) is more or less linear. All in all, more mixing seems to increase overtaking.
3.5Safety car
The deployment of the safety car to clear the track after an accident is fairly common nowadays. As the safety car eradicates the gaps between the cars, this may increase the amount of on-track battles and overtakes after the restart. Since 2015, the virtual safety car has generally been used after smaller accidents. The main difference between the normal safety car and the virtual safety car is that the virtual safety car preserves the gaps between the drivers and has therefore less of an impact on racing. Therefore, virtual-safety-car periods are ignored in the analysis, as well as safety-car periods after the start or at the very end of the race.
4Model
The analysis on overtaking relies on count data. Therefore, a Poisson regression is used to model how often each driver passes or gets passed in each race. As both the total number of places gained and the total number of places lost matter for this analysis, they are estimated simultaneously. Both estimations share some race and driver-specific fixed effects, while other race and driver-specific effects are estimated separately. In short, the expected number of places gained by driver i on track j in season t Gijt and the expected number of places lost Lijt given race circumstances (a vector of variables referred to as xijt) is modelled in the following way:
Most observed variables are not directly used in the model. They are instead used as auxiliary variables to derive the variables used in the analysis. Table 2 shows the auxiliary variables, most of which are directly observed. The main exceptions are the standardized rank and position, which are normalized to the [0,1] or [– 1,1] interval by dividing the ranks with the number of cars running at the end of the first lap.13 Furthermore, a dummy variable is used to determine whether or not a driver is likely to stop again. As a cut-off value 75 percent of the race distance is used, which will be about the moment where one can expect the last pit-stops of the race. In the table, the driver race-specific variables are in lowercase, whereas the race fixed effects are in capitals.
Table 2
Auxiliary variables
| Variable | Formula | Description |
| pijt | Position at the end of the first lap | |
| rijt | Ranking based on fastest lap of the weekend | |
| nijt | Number of laps completed | |
| Njt | Race distance in number of laps | |
| lijt | Lap at which first pit-stop is made | |
| kijt | kijt = lijt/ - Njt | Perc. of race distance at which first pit-stop is made |
|
| Unscheduled stop in first 5 laps | |
|
| Unscheduled stop after lap 5 | |
|
|
| Unknown strategy |
| Cjt | Number of cars running at the end of the first lap | |
| ρijt | ρijt = 1 - (rijt - 1)/ - (Cjt - 1) | Standardized rank [0,1] |
| πijt | πijt = (2 (pijt - 1)/ - (Cjt - 1)) - 1 | Standardized position [– 1,1] |
| ψijt | ψijt = 1 - (pijt - 1)/ - (Cjt - 1) | Standardized position [0,1] |
Table 3
Variables used in the model
| Variable | Formula | Description |
| Race fixed effects | ||
| Cjt | Number of cars running at the end of the first lap | |
| μjt | μjt = ∑injit/ - Njt | Race-average proportion of laps completed |
| λjt |
| Race-average distance at which first pit-stop is made |
| Sjt | One or more safety car periods (dummy variable) | |
|
|
| Number of unscheduled stops in first 5 laps |
|
|
| Number of unscheduled stops after lap 5 |
| Driver race-specific effects | ||
| vijt | vijt = nijt/ - Njt | Proportion of laps completed |
| qijt | Number of scheduled pit-stops | |
|
| Percentage of drivers pitting more often | |
|
| Percentage of drivers pitting less often | |
|
| Unknown strategy | |
| χijt | χijt = πijt (kijt - λijt) | Pit-stop mixing |
| δijt | δijt = ψijt - ρijt | Position compared to expected position |
|
|
| Low pit-stop mixing |
|
|
| High pit-stop mixing |
|
|
| Better than expected position at the end of first lap |
|
|
| Worse than expected position at the end of first lap |
Table 3 shows the actual variables used in the model and how they were derived from the auxiliary variables, categorized as either race fixed effects or driver race-specific effects. The race fixed effects are usually the sum of auxiliary variables, except for the number of cars Cjt, which is an auxiliary variable itself, and the safety-car dummy, which is directly observed. Note that the variable does not count the number of safety-car periods, only if there was at any point during the race a safety-car period in-between two green-flag periods. Also, virtual-safety-car periods do not count.
The driver race-specific effects are mostly directly observed, except for the pit-stop and position interaction variables. Pit-stop mixing χijt is the product of standardized position πijt and the difference between the timing of the first pit-stop and the race average. Positive values are obtained if either a back-marker pits late (then both terms are positive), or if a front-runner pits early (in which case both terms are negative). In either case, one can expect some mixing of the field, which is likely to induce overtaking. On the other hand, if one term is positive, while the other is negative, less mixing and therefore less overtaking can be expected. The variable is then split into a positive and a negative part, with
In the same way, δijt measures the degree to which a driver is out of position. Positive values for δijt indicate that a driver is running in a higher (worse) position than where he is expected to be given his fastest lap of the weekend. Conversely, negative values indicate he is running ahead of where he is expected to be. The variable is then also separated into a positive and negative part. Table 4 shows its race-averaged value djt, (djt = 2∑i (|δijt|/ - Cjt)) for every race j in every year t, as well as other season averages for dry races. In the same way the average number of pit-stops (Qjt) is the race-averaged value of qijt. The average speed differential is defined as the percentage difference between the fastest and the median driver.
Table 4
Season averages (dry races only)
| Variable | 2011 | 2012 | 2013 | 2014 | 2015 | 2016 | 2017 | 2018 |
| Number of overtakes | 59.1 | 53.6 | 52.0 | 43.6 | 30.2 | 52.2 | 24.4 | 32.2 |
| Number of cars (Cjt) | 23.3 | 23.2 | 21.6 | 20.5 | 18.9 | 21.2 | 19.0 | 19.0 |
| Overall reliability (μjt) | 90.8% | 92.2% | 93.6% | 90.3% | 92.6% | 91.9% | 90.5% | 92.0% |
| Cars out of position (mixing) (djt) | 19.0% | 27.1% | 24.3% | 24.4% | 22.6% | 29.2% | 25.1% | 25.5% |
| Safety car (Sjt) | 31% | 24% | 28% | 24% | 35% | 22% | 22% | 20% |
| Number of pit-stops per car (Qjt) | 2.41 | 1.93 | 2.22 | 2.01 | 1.86 | 2.05 | 1.27 | 1.23 |
| Timing of first pit-stop (λjt) | 26.4% | 29.9% | 24.3% | 28.0% | 29.5% | 24.0% | 37.6% | 40.4% |
| Number of unscheduled early stops
| 0.44 | 0.18 | 0.33 | 0.29 | 0.12 | 0.39 | 0.39 | 0.20 |
| Number of unscheduled late stops
| 2.38 | 1.82 | 2.17 | 1.12 | 1.41 | 0.67 | 1.61 | 0.55 |
| Average speed differential | 3.17% | 2.04% | 1.87% | 2.18% | 2.36% | 2.20% | 2.35% | 2.15% |
Table 4 shows there is a noticeable downward trend in overtaking. Overtaking peaked in 2011, the first year of the Pirelli/DRS era, and was at its lowest in 2017, just after a major aerodynamic overhaul aimed at making the cars faster. Some of the control variables, however, also show a clear downward trend. The number of cars surviving the first lap dropped from 23.3 in 2011 to 18.9 in 2015 as teams had gone bankrupt (HRT at the end of 2012, Caterham at the end of 2014 and Marussia at the end of 2016), while only one team entered the sport during the study period (Haas in 2016). On the other hand, overall reliability (defined as the average number of laps completed divided by the total number of laps) has remained at a more or less stable at a fairly high level (90 to 94 percent).
The number of scheduled pit-stops per car dropped from 2.41 in 2011 to only 1.23 in 2018. As a result of the reduction in pit-stops, the pit-stops took place later in the race. In 2013 and 2016 the drivers made their first scheduled stop at about 24 percent of the race distance, compared to over 40 percent of the race distance in 2018.
Speed differentials and the number of cars that are out of position (mixing) roughly show the opposite pattern. This seems plausible, as with larger speed differentials a suboptimal qualifying performance is less likely to affect a driver’s grid position. Mixing was about 22 to 30 percent of the theoretical maximum, except for 2011, which had the largest speed differential of the entire study period, when it was only 19 percent. Therefore, mixing certainly does not explain downward trend in overtaking.
5Results
5.1Baseline results
The Poisson model is run on both the number of places gained and lost by every driver. Table 5 shows the incidence-rate ratios of the baseline model, rather than the coefficients, as they are much easier to interpret.14 In Column (1) a fairly simple model is estimated. This specification uses season and track fixed effects, as well as the number of cars, reliability, the number of pit-stops made by a driver, the strategic variation and the amount of mixing at the end of the first lap.
Table 5
Baseline results
| Number of overtakes per car (incidence-rate ratios) | ||||||
| (1) | (2) | (3) | ||||
| Season | ||||||
| 2011 | Reference | Reference | Reference | |||
| 2012 | 0.966 | (0.053) | 0.965 | (0.054) | 0.971 | (0.055) |
| 2013 | 1.030 | (0.059) | 0.942 | (0.059) | 0.964 | (0.061) |
| 2014 | 0.869** | (0.059) | 0.857** | (0.061) | 0.868** | (0.061) |
| 2015 | 0.693*** | (0.060) | 0.666*** | (0.063) | 0.675*** | (0.063) |
| 2016 | 0.947 | (0.061) | 0.897 | (0.065) | 0.904 | (0.066) |
| 2017 | 0.643*** | (0.059) | 0.606*** | (0.057) | 0.620*** | (0.058) |
| 2018 | 0.751** | (0.070) | 0.762*** | (0.072) | 0.747*** | (0.071) |
| Race fixed effects | ||||||
| Number of cars (log) | 1.072 | (0.309) | 0.913 | (0.279) | 0.947 | (0.285) |
| Overall laps completed | ||||||
| < 87% | Reference | Reference | Reference | |||
| 87– 90% | 1.287*** | (0.078) | 1.296*** | (0.079) | 1.279*** | (0.077) |
| 90– 93% | 1.288*** | (0.075) | 1.319*** | (0.079) | 1.325*** | (0.078) |
| 93– 96% | 1.267*** | (0.074) | 1.366*** | (0.084) | 1.355*** | (0.082) |
| > 96% | 1.094 | (0.071) | 1.150** | (0.078) | 1.140** | (0.076) |
| Timing of the first stop | ||||||
| First 20% of the race | Reference | Reference | ||||
| 20– 25% | 0.862*** | (0.043) | 0.872*** | (0.044) | ||
| 25– 30% | 0.814*** | (0.048) | 0.818*** | (0.049) | ||
| 30– 40% | 0.792*** | (0.065) | 0.823** | (0.068) | ||
| > 40% | 0.764*** | (0.075) | 0.791** | (0.078) | ||
| Safety car | 1.408*** | (0.054) | 1.402*** | (0.058) | 1.396*** | (0.057) |
| Driver race-specific effects | ||||||
| Percentage of laps completed (log) | 1.852*** | (0.098) | 2.462*** | (0.207) | 2.428*** | (0.212) |
| Number of pit-stops | 1.132*** | (0.045) | 1.058 | (0.057) | 1.061 | (0.058) |
| On probability of being overtaken | ||||||
| Percentage pitting more often | 2.158*** | (0.195) | 2.206*** | (0.215) | 1.882*** | (0.192) |
| Percentage pitting less often | 0.845* | (0.088) | 0.996 | (0.110) | 0.963 | (0.107) |
| Unknown strategy | 1.785*** | (0.208) | 1.724*** | (0.205) | ||
| Number of unscheduled early stops | 1.101*** | (0.034) | 1.104*** | (0.033) | ||
| Number of unscheduled late stops | 1.012 | (0.014) | 1.011 | (0.014) | ||
| Timing of stops: high mixing | 16.504*** | (7.056) | ||||
| Timing of stops: low mixing | 0.602 | (0.453) | ||||
| Position after first lap: better | 7.953*** | (1.466) | 7.325*** | (1.357) | 6.770*** | (1.258) |
| Position after first lap: worse | 0.451*** | (0.074) | 0.409*** | (0.068) | 0.315*** | (0.056) |
| On probability of overtaking | ||||||
| Percentage pitting more often | 0.809** | (0.076) | 0.711*** | (0.073) | 0.739*** | (0.061) |
| Percentage pitting less often | 1.562*** | (0.139) | 1.730*** | (0.170) | 1.874*** | (0.189) |
| Unknown strategy | 1.007 | (0.121) | 1.101 | (0.133) | ||
| Unscheduled early stop×rank | 3.037*** | (0.482) | 3.201*** | (0.562) | ||
| Unscheduled late stop×rank | 1.774*** | (0.206) | 1.793*** | (0.207) | ||
| Timing of stops: high mixing | 0.998 | (0.480) | ||||
| Timing of stops: low mixing | 0.093*** | (0.057) | ||||
| Position after first lap: better | 0.445*** | (0.098) | 0.524*** | (0.114) | 0.526*** | (0.114) |
| Position after first lap: worse | 8.192*** | (0.797) | 8.483*** | (0.868) | 9.119*** | (1.036) |
| Track fixed effects | yes | yes | yes | |||
| Number of observations | 5864 | 5864 | 5864 | |||
| Log likelihood | – 11398 | – 11279 | – 11187 | |||
Note: Displayed are the incidence-rate ratios. Asterisks depict significance levels. *10% significance level, **5% significance level, ***1% significance level.
The incidence-rate ratios of the seasons show a statistically significant reduction in overtaking in 2014 and 2015, as well as 2017 and 2018, compared to 2011. Furthermore, the incidence-rate ratios of the control variables have plausible values. For example, overtaking increases with percentage of laps completed.
In Column (2) the timing of the first pit-stop and unscheduled stops are added to the equation. The timing of the first pit-stop does affect overtaking, as earlier pit-stops seem to boost overtaking. Also, drivers for which the strategy is not known (because they did not complete at least 75 percent of the race distance) are more likely to be overtaken. The number of unscheduled pit-stops has a small but significant positive effect on the probability of being overtaken. In the analysis on the probability of overtaking the unscheduled pit-stop dummy is interacted with the driver’s rank (based on his expected race pace). As expected, a better race pace increases the probability of overtaking after an unscheduled pit-stop.
In Column (3), which is the preferred specification, the mixing due to pit-stops is taken into account. If the front-runners pit earlier than the back-markers, then this will result in more mixing and therefore more overtakes. This indeed seems to be the case, as for both overtaking and being overtaken the incidence-rate ratio is far higher in case of high mixing. Despite this, the season incidence-rate ratios have not substantially changed. There is now a slight structural decline in overtaking from 2011 to 2014 a significant drop in 2015 and structurally less overtaking from 2017 onward.
The results further indicate that the number of cars do not affect overtaking on an individual level, which suggests that the number of overtakes per race is proportional to the number of cars. Reliability does increase overtaking. This is especially obvious on an individual level. The incidence-rate ratio of 2.46 suggests that the elasticity of overtaking with respect to the number of laps completed is about 89 percent (ln 2.46 ≈ 0.89). This suggests that a 10-percent increase in completed laps results in roughly 9 percent more overtakes. This is plausible, as overtaking is likely more common at the beginning of the race, when the gaps between the cars are still small. The results also suggest that safety cars increase overtaking by about 40 percent.
Pit strategies seem to increase overtaking as well. The effect of the number of pit-stops on overtaking is statistically insignificant, although the coefficient is slightly positive. Strategic variation, however, has a much larger effect on overtaking. As expected, drivers who pit more often than the opposition overtake significantly more cars, whereas drivers who pit less often are overtaken significantly more often (about 90 percent higher in both cases). While drivers who pit more often are significantly less likely to be overtaken, this effect is not enough to cancel out the positive effect of strategic variation.
Furthermore, if a driver’s position at the end of the first lap is better than expected, he is more likely to be overtaken. In the extreme case where the slowest driver is leading the race at the end of the first lap, that driver will be overtaken nearly seven times more than an average driver. On the other hand, if the fastest driver is at the back of the field at the end of the first lap, he will be overtaken half as much as the average driver, whereas he is expected to overtake nine times more cars than the average driver. As expected, the incidence-rate ratios are almost exactly in the opposite way for the probability of overtaking.
The track fixed effects are listed in Table A1 in the Appendix and indicate that Monaco, the reference track, is clearly the worst track for overtaking. As expected, overtaking is relatively difficult at narrow, twisty tracks, such as the Hungaroring, Singapore and Albert Park (the latter two tracks being street circuits). Perhaps not too surprisingly, the best-performing tracks are all Hermann Tilke-designed tracks, such as Istanbul Park, Shanghai and Sakhir (Bahrain), which consist of long straights and long braking zones to promote overtaking. Interestingly, a couple of Tilke-designed tracks, such as Yeongam (Korea), Sochi (Russia) and Buddh (India), show up among the worst-performing tracks, even though they consist of long straights and long braking zones as well.
5.2Sensitivity analysis
In this section several sensitivity analyses are performed to test the robustness of the baseline results in column (3) of Table 5. In the analysis, it was implicitly assumed that the overtaking count is the product of the individual effect of all control variables. This may hold for most variables, such as the number of cars, but not for all variables. When tire wear is high, the advantage of fresh tires may be big enough to enable overtaking even at the least overtaking-friendly circuits, where overtaking is generally rare. Therefore, the influence of the number of pit-stops is likely less sensitive to the overtaking-friendliness of the track. Similarly, the impact of drivers being out of position at the end of the first lap on overtaking may not be affected too much by the overtaking-friendliness of the track.
Table 6 shows the results of the models with track interaction effects. In both specifications the number of pit-stops is interacted with track and in specification (2) the degree to which a driver is out of position is interacted with track.15 The track fixed effects and the coefficients of the track interactions can be found in Tables A2a, A2b and A2c.
Table 6
Sensitivity analysis: track interaction effects
| Number of overtakes per car (incidence-rate ratios) | ||||
| (1) | (2) | |||
| Season | ||||
| 2011 | Reference | Reference | ||
| 2012 | 0.959 | (0.057) | 0.978 | (0.075) |
| 2013 | 0.922 | (0.059) | 0.923 | (0.068) |
| 2014 | 0.870* | (0.063) | 0.861* | (0.077) |
| 2015 | 0.675*** | (0.066) | 0.661*** | (0.078) |
| 2016 | 0.868* | (0.064) | 0.861 | (0.080) |
| 2017 | 0.593*** | (0.057) | 0.584*** | (0.080) |
| 2018 | 0.751*** | (0.073) | 0.761*** | (0.090) |
| Race fixed effects | ||||
| Number of cars (log) | 0.870 | (0.282) | 0.786 | (0.313) |
| Overall laps completed | ||||
| < 87% | Reference | Reference | ||
| 87– 90% | 1.287*** | (0.079) | 1.280*** | (0.105) |
| 90– 93% | 1.307*** | (0.080) | 1.292*** | (0.116) |
| 93– 96% | 1.387*** | (0.086) | 1.374*** | (0.112) |
| > 96% | 1.180** | (0.080) | 1.160 | (0.112) |
| Timing of the first stop | ||||
| First 20% of the race | Reference | Reference | ||
| 20– 25% | 0.866*** | (0.045) | 0.832** | (0.062) |
| 25– 30% | 0.806*** | (0.050) | 0.793*** | (0.067) |
| 30– 40% | 0.787*** | (0.069) | 0.764** | (0.087) |
| > 40% | 0.751*** | (0.080) | 0.725** | (0.104) |
| Safety car | 1.385*** | (0.058) | 1.405*** | (0.075) |
| Driver race-specific effects | ||||
| Laps completed (%) | 2.382*** | (0.207) | 2.416*** | (0.216) |
| Number of pit-stops | Interacted with track | Interacted with track | ||
| On probability of being overtaken | ||||
| Percentage pitting more often | 1.867*** | (0.200) | 1.895*** | (0.240) |
| Percentage pitting less often | 0.927 | (0.107) | 0.960 | (0.123) |
| Unknown strategy | 1.673*** | (0.209) | 1.726*** | (0.241) |
| Number of unscheduled early stops | 1.097*** | (0.034) | 1.089 | (0.039) |
| Number of unscheduled late stops | 1.011 | (0.014) | 1.010 | (0.019) |
| Timing of stops: high mixing | 14.655*** | (6.375) | 19.217*** | (9.809) |
| Timing of stops: low mixing | 0.569 | (0.433) | 0.684 | (0.553) |
| Position after first lap: better | 6.368*** | (1.174) | Interacted with track | |
| Position after first lap: worse | 0.310*** | (0.056) | Interacted with track | |
| On probability of overtaking | ||||
| Percentage pitting more often | 0.728*** | (0.080) | 0.766** | (0.096) |
| Percentage pitting less often | 1.827*** | (0.188) | 1.894*** | (0.195) |
| Unknown strategy | 1.083 | (0.135) | 1.082 | (0.159) |
| Unscheduled early stop x rank | 3.082*** | (0.569) | 2.974*** | (0.559) |
| Unscheduled late stop x rank | 1.809*** | (0.208) | 1.742*** | (0.223) |
| Timing of stops: high mixing | 0.788 | (0.379) | 0.791 | (0.356) |
| Timing of stops: low mixing | 0.086*** | (0.054) | 0.299*** | (0.183) |
| Position after first lap: better | 0.487*** | (0.106) | Interacted with track | |
| Position after first lap: worse | 9.236*** | (1.032) | Interacted with track | |
| Track fixed effects | yes | yes | ||
| Number of observations | 5864 | 5864 | ||
| Log likelihood | – 11127 | – 11063 | ||
Note: Displayed are the incidence-rate ratios. Asterisks depict significance levels. *10% significance level, **5% significance level, ***1% significance level.
The coefficients of the control variables are very similar to those in specification (3) of the baseline analysis, yet the track fixed effects have changed somewhat. The most significant change is that the decrease from 2011 to 2013 has become more noticeable, even though the decline is far from statistically significant. Again, 2017 is clearly the worst performing season, with over 40 percent less overtaking than in 2011.
Another potential confounding factor may be the drivers. In the previous analyses it was implicitly assumed that the drivers are interchangeable and that only the circumstances mattered for overtaking. This may not be the case, so driver fixed effects are added to the main analysis.
The impact of speed differentials has not been examined yet. Bigger speed differentials increase the likelihood of the attacking car to create enough of a performance advantage to overtake, so overtaking may be positively correlated with speed differentials. On the other hand, bigger speed differentials also increase the gaps between cars, making it less likely for them to overtake later in the race. Also, due to the larger gaps there may be less shuffling during the pit-stop window, which may also reduce overtaking, so the impact of speed differentials on overtaking is not obvious. Speed differentials are analyzed in two different ways: first, the race-averaged speed differentials are added to the model and second, speed differentials on the driver level (measured as a driver’s speed deficit to the fastest driver of the weekend) are included.
Column (1) of Table 7 shows that the inclusion of driver fixed effects almost completely equalizes the coefficients of the first three seasons, in contrast to the gentle decline in previous estimates. Overall, the incidence-rate ratios for the remaining seasons have remained more or less the same, which suggests that the effect of driver heterogeneity is limited. This seems plausible, given the relatively small season-to-season changes in driver line-ups.
Table 7
Sensitivity analysis: driver fixed effects and speed deficits
| Number of overtakes per car (incidence-rate ratios) | ||||||
| (1) | (2) | (3) | ||||
| Season | ||||||
| 2011 | Reference | Reference | Reference | |||
| 2012 | 1.006 | (0.061) | 1.181* | (0.108) | 1.090 | (0.060) |
| 2013 | 1.016 | (0.071) | 1.092 | (0.098) | 1.053 | (0.065) |
| 2014 | 0.886 | (0.067) | 0.967 | (0.090) | 0.905 | (0.062) |
| 2015 | 0.663*** | (0.067) | 0.711*** | (0.075) | 0.696*** | (0.063) |
| 2016 | 0.868* | (0.071) | 0.883 | (0.075) | 0.889* | (0.062) |
| 2017 | 0.597*** | (0.061) | 0.624*** | (0.065) | 0.610*** | (0.055) |
| 2018 | 0.696*** | (0.074) | 0.787** | (0.082) | 0.763*** | (0.070) |
| Race fixed effects | ||||||
| Number of cars (log) | 0.972 | (0.290) | 1.024 | (0.315) | 0.981 | (0.286) |
| Overall laps completed | ||||||
| < 87% | Reference | Reference | Reference | |||
| 87– 90% | 1.279*** | (0.076) | 1.281*** | (0.077) | 1.239*** | (0.071) |
| 90– 93% | 1.314*** | (0.077) | 1.336*** | (0.077) | 1.305*** | (0.072) |
| 93– 96% | 1.349*** | (0.081) | 1.359*** | (0.083) | 1.318*** | (0.075) |
| > 96% | 1.126* | (0.074) | 1.163** | (0.076) | 1.114* | (0.069) |
| Timing of the first stop | ||||||
| First 20% of the race | Reference | Reference | Reference | |||
| 20– 25% | 0.875*** | (0.043) | 0.818*** | (0.045) | 0.840*** | (0.039) |
| 25– 30% | 0.822*** | (0.048) | 0.764*** | (0.049) | 0.809*** | (0.044) |
| 30– 40% | 0.835** | (0.068) | 0.723*** | (0.066) | 0.799*** | (0.060) |
| > 40% | 0.801** | (0.078) | 0.704*** | (0.075) | 0.761*** | (0.069) |
| Average speed differential | ||||||
| < 1.5% | Reference | |||||
| 1.5– 2.0% | 1.430*** | (0.172) | ||||
| 2.0– 2.5% | 1.260* | (0.154) | ||||
| > 2.5% | 1.484*** | (0.202) | ||||
| Safety car | 1.400*** | (0.057) | 1.378** | (0.056) | 1.403*** | (0.054) |
| Driver race-specific effects | ||||||
| Laps completed (%) | 2.479*** | (0.219) | 2.421*** | (0.213) | 2.500*** | (0.218) |
| Number of pit-stops | 1.088*** | (0.059) | 1.077 | (0.054) | ||
| Number of stops×speed differential | ||||||
| < 1.5% | 1.050 | (0.071) | ||||
| 1.5– 2.0% | 0.987 | (0.060) | ||||
| 2.0– 2.5% | 1.087 | (0.074) | ||||
| > 2.5% | 0.988 | (0.069) | ||||
| On probability of being overtaken | ||||||
| Percentage pitting more often | 1.828*** | (0.181) | 1.856*** | (0.191) | 1.821*** | (0.190) |
| Percentage pitting less often | 0.920 | (0.100) | 0.999 | (0.115) | 0.997 | (0.110) |
| Unknown strategy | 1.719*** | (0.207) | 1.645*** | (0.197) | 1.702*** | (0.191) |
| Number of unscheduled early stops | 1.108*** | (0.033) | 1.125*** | (0.035) | 1.103*** | (0.032) |
| Number of unscheduled late stops | 1.012 | (0.013) | 1.012 | (0.014) | 1.011 | (0.013) |
| Timing of stops: high mixing | 16.830 | (6.735) | 15.883*** | (6.869) | 7.278*** | (3.047) |
| Timing of stops: low mixing | 0.753 | (0.491) | 0.593 | (0.446) | 0.678 | (0.405) |
| Position after first lap: better | 4.978*** | (0.925) | 6.814*** | (1.253) | 3.889*** | (0.713) |
| Position after first lap: worse | 0.309*** | (0.056) | 0.313*** | (0.057) | 0.590** | (0.114) |
| Individual speed differential | ||||||
| < 1% | Reference | |||||
| 1-2% | 1.974*** | (0.146) | ||||
| 2-3% | 2.513*** | (0.180) | ||||
| 3-4% | 3.276*** | (0.242) | ||||
| 4-5% | 3.403*** | (0.276) | ||||
| 5-6% | 3.200*** | (0.287) | ||||
| 6-7% | 3.102*** | (0.359) | ||||
| > 7% | 2.916*** | (0.362) | ||||
| On probability of overtaking | ||||||
| Percentage pitting more often | 0.710*** | (0.078) | 0.730*** | (0.078) | 0.661*** | (0.071) |
| Percentage pitting less often | 1.799*** | (0.185) | 1.946*** | (0.202) | 1.626*** | (0.162) |
| Unknown strategy | 1.081 | (0.133) | 1.058 | (0.129) | 1.055 | (0.126) |
| Unscheduled early stop x rank | 3.241*** | (0.727) | 3.253*** | (0.574) | 3.088*** | (0.557) |
| Unscheduled late stop x rank | 1.776*** | (0.222) | 1.773*** | (0.206) | 1.579*** | (0.185) |
| Timing of stops: high mixing | 1.033 | (0.532) | 0.933 | (0.440) | 1.252 | (0.583) |
| Timing of stops: low mixing | 0.085*** | (0.052) | 0.089*** | (0.055) | 0.096*** | (0.059) |
| Position after first lap: better | 0.372*** | (0.087) | 0.522*** | (0.113) | 0.334*** | (0.075) |
| Position after first lap: worse | 10.111*** | (1.291) | 9.072*** | (1.028) | 7.648*** | (0.868) |
| Individual speed differential | ||||||
| < 1% | 2.168*** | (0.179) | ||||
| 1-2% | 2.803*** | (0.224) | ||||
| 2-3% | 2.974*** | (0.236) | ||||
| 3-4% | 2.857*** | (0.277) | ||||
| 4-5% | 1.527*** | (0.203) | ||||
| 5-6% | 0.956 | (0.156) | ||||
| 6-7% | 0.588*** | (0.118) | ||||
| > 7% | 0.396*** | (0.103) | ||||
| Track fixed effects | yes | yes | yes | |||
| Driver fixed effects | yes | no | no | |||
| Number of observations | 5864 | 5864 | 5864 | |||
| Log likelihood | – 10950 | – 11148 | – 10538 | |||
Note: Displayed are the incidence-rate ratios. Asterisks depict significance levels. *10% significance level, **5% significance level, ***1% significance level.
The inclusion of speed differentials in Column (2) and (3) raises the incidence-rate ratios of all seasons relative to the 2011 season. In Column (2) race-averaged speed differentials seem to increase overtaking, whereas its effect on the number of pit-stops is absent. In Column (3) individual speed deficits seem to increase the probability of a driver being overtaken, even with all control variables included. Interestingly, the probability of a driver overtaking another car only starts to decrease if a driver is over 4 percent slower than the fastest driver. Again, 2012 and 2013 have slightly higher incidence-rate ratios than 2011, but the difference is statistically insignificant. These results, however tentative, may point to the effectiveness of the large-scale inclusion of double DRS zones in 2012.
5.3What-if analysis
The main analysis showed the impact of a lot of observables on overtaking. However, it is still unclear to what extent they contributed to the between-season differences in overtaking. In order to test the magnitude of these effects, a what-if analysis is performed. In the what-if analysis, increasingly more variables are set to the database average. Then the adjusted model is run and compared its predicted number of overtakes with the actual season average number of overtakes per race.
The variables are grouped in six categories: the impact of the cars’ aerodynamics on overtaking (the season fixed effects), track, strategy, mixing, reliability and safety car. The categorization of the variables can be found in Table 8. With every specification one more group is set to the database average, which gives an indication how sensitive overtaking is to the group of variables in question.16
Table 8
Groups of control variables
| Category | Variables |
| Cars | Season fixed effects |
| Tracks | Track fixed effects |
| Strategy | •Number of pit-stops |
| •Percentage pitting more/less often | |
| •Timing of first stop (individual and race average) | |
| •Unknown strategy | |
| •Unscheduled early/late stops | |
| Mixing | Position after first lap compared to expected position |
| Reliability | •Number of cars surviving the first lap |
| •Laps completed (individual and race average) | |
| Safety car | Safety car dummy |
The impact on overtaking is then compared to the impact of overtaking in 2011, which had the highest number of overtakes. Table 9 shows the actual season average number of overtakes per race in different scenarios.
Table 9
Season average number of overtakes per race in different scenarios
| Season | Actual | – Cars | – Track | – Strategy | – Mixing | – Reliability | – Safety car |
| 2011 | 59.1 | 50.6 | 49.9 | 46.3 | 48.4 | 44.0 | 43.0 |
| 2012 | 53.6 | 47.3 | 46.7 | 48.3 | 47.5 | 42.8 | 43.0 |
| 2013 | 52.0 | 46.3 | 49.8 | 46.1 | 46.6 | 43.5 | 43.0 |
| 2014 | 43.6 | 43.0 | 41.5 | 41.4 | 41.8 | 42.8 | 43.0 |
| 2015 | 30.2 | 38.3 | 41.3 | 41.8 | 41.9 | 43.7 | 43.0 |
| 2016 | 52.2 | 49.5 | 46.6 | 43.2 | 41.8 | 42.6 | 43.0 |
| 2017 | 24.4 | 33.8 | 34.6 | 38.1 | 37.9 | 42.6 | 43.0 |
| 2018 | 32.2 | 36.9 | 35.5 | 40.0 | 39.3 | 42.3 | 43.0 |
| Average | 43.0 | 43.0 | 43.0 | 43.0 | 43.0 | 43.0 | 43.0 |
The first column shows the actual season averages. In the second column the predicted overtaking averages are shown in case of average cars. As the season averages are now much closer than in the actual situation. In the next column the impact of the tracks is removed. In general, the impact is very limited, as the season-to-season calendar changes are minor. The results show that overtaking was slightly hampered by the tracks in 2013 and 2015, while 2016 was slightly flattered by its tracks.17 All in all, the unobservable factors explain a considerable part of the inter-season variation in overtaking.
Removing the differences in strategy between the seasons further decreases differences in overtaking. The 2011, 2013 and 2016 seasons are negatively affected, whereas 2017 and 2018 are positively affected. Conversely, removing the mixing of cars actually boosts overtaking in 2011, whereas it reduces overtaking in 2012 and 2016. Averaging the number of cars per season negatively affects the 2011 and 2012 seasons, when there were 24 cars, whereas it boosts overtaking in the 2017 and 2018 seasons, when there were only 20 cars. Finally, the safety car had a small impact on per-season overtaking. With essentially every variable removed from the equation, every season is now predicted to have 43 overtakes per race.
Figure 2 shows the individual contribution of every group of variables on the per-season overtaking averages. The contributions are then rescaled so they are nonnegative for every year. This leaves every season with a base of about 18 overtakes per race, the average number of overtakes in case of the worst circumstances possible (2011 mixing, 2013 tracks, 2017 cars and reliability, 2018 strategy and safety cars). The remaining differences in per-season overtaking probabilities are then explained by the groups of control variables.
Fig. 2
Composition of per-season overtaking averages.
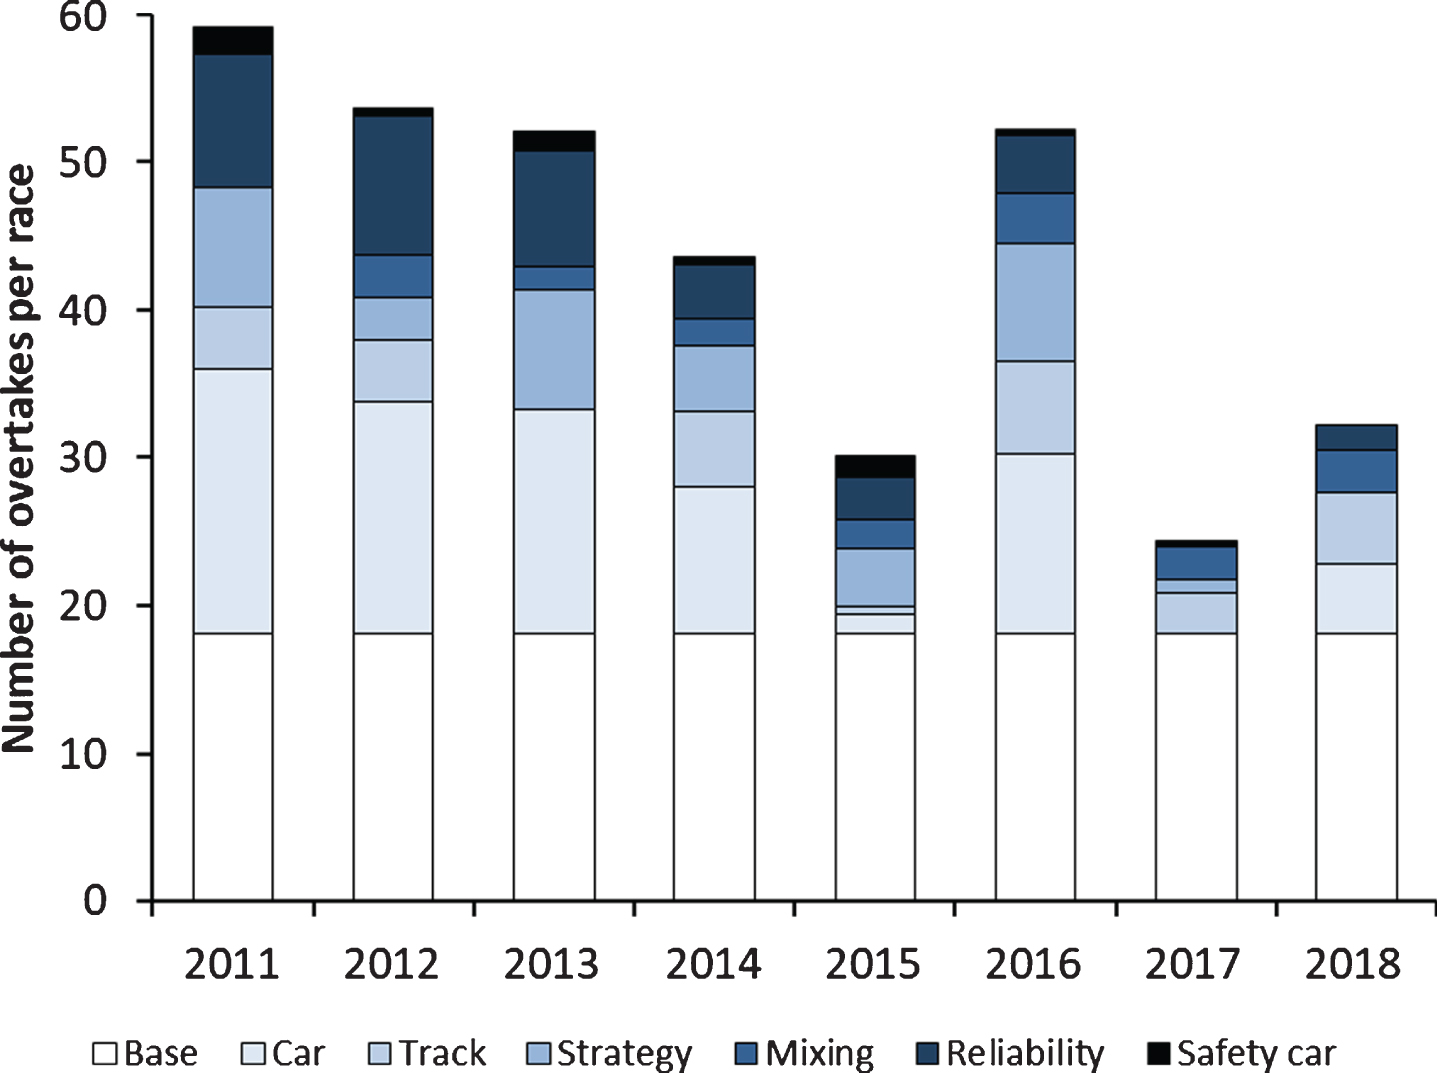
When comparing the best to the worst season (2011 to 2017), more than half the difference (18 of 35 overtakes) is caused by differences between the cars. Differences in reliability and field size explain 9 overtakes and differences in strategy a further 7 overtakes. Table 10 shows the individual contribution of the groups of control variables on the overtaking deficit (the difference between the overtaking intensity of a given season compared to 2011).
Table 10
Overtaking deficit: individual contributions
| Season | Car | Track | Strategy | Mixing | Reliability | Safety car |
| 2012 | 40% | 2% | 94% | – 53% | – 5% | 22% |
| 2013 | 38% | 60% | – 1% | – 22% | 18% | 8% |
| 2014 | 51% | – 5% | 23% | – 11% | 35% | 8% |
| 2015 | 57% | 13% | 14% | – 7% | 22% | 1% |
| 2016 | 83% | – 30% | 2% | – 50% | 75% | 20% |
| 2017 | 51% | 5% | 21% | – 7% | 26% | 4% |
| 2018 | 49% | – 3% | 30% | – 10% | 27% | 6% |
According to the table, the cars generally explain 40 to 60 percent of the overtaking deficit, with the 2016 season a notable exception. The tracks explain the majority of the overtaking deficit of the 2013 season. Strategy generally explains around 20 percent of the deficit, except for 2013 and 2016, where it was close to zero, and 2012, when it explains almost the entire deficit. Mixing reduces the deficit in every season, especially in 2012 and 2016. Reliability and field size generally explain 20 to 30 percent of the deficit after 2012, while the safety car mostly affected the 2012 and 2016 seasons.
6Conclusion
Overtaking has decreased substantially during the Pirelli/DRS era. Due to the large number of rule changes, it is hard to pinpoint the main cause of this decline beforehand. In this analysis, a detailed overtaking dataset to disentangle these effects was used. By controlling for as many observable variables as possible, the impact of unobservable variables, the influence of the cars aerodynamics on overtaking and the overtaking-friendliness of the tracks, could be estimated.
It was found that aerodynamics of the cars played a significant role in the decline. The cars got increasingly worse at overtaking one another, especially after 2014. Overall, the cars alone explain about 50 percent of the observed decline in overtaking. The emergence of more uniform strategies reduced overtaking as well. Typically, 20 percent of the reduction of overtaking could be attributed to this. Furthermore, the reduction of the field size typically explained 20 to 30 percent of the decrease.
The overtaking-friendliness of the tracks do not explain much of the season-to-season changes in overtaking frequencies, as roughly the same tracks are used every season. The individual differences are fairly large though, and at the best-performing track (Istanbul Park) overtaking is nearly eight times more likely than at the worst-performing track (Monaco). The importance of a good track layout on overtaking is highlighted by the fact that the best tracks for overtaking were all designed by Hermann Tilke. However, he also designed some of the weaker tracks for overtaking, such as Yeongam (Korea), Sochi and Buddh (India), which suggests that the concept of long straights and long braking zones does not guarantee overtaking.
7Discussion
The analysis is likely of interest to Formula 1 policymakers, who naturally aim to produce exciting races. Interestingly, the results suggest that the negative impact of wake turbulence created by cars on overtaking has likely increased over time, especially after the introduction of turbo engines in 2014. A potential explanation for this downward trend is the gradual reduction of the ground effect, a trend that started in 2012 with the stepped noses. In 2014, the height of the nose was further reduced, and the process was finalized in 2015, when all the teams were running early-1990s-like low noses. This led to a loss of downforce generated by the floor of the car, exactly the type of downforce that is least affected by wake turbulence. Therefore, increasing the height of the nose may be a good step to increase overtaking.
The analysis further implies that the 2016 cars were much more suitable for overtaking than the 2015 cars. This effect might be spurious, given that the cars were largely the same in both seasons. The main difference was the introduction of a third tire compound, which vastly increased the strategic options. This changed in 2017, when the tires got more durable, which made the softer tire compounds the much better option even in the race. As the hardest tire compound was barely used, the advantage of a third tire compound was mostly negated. Therefore, the tire situation of the 2016 season was unique.
As strategic variation in the analysis is only determined by the number of pit-stops, and not the tire compounds used, this may imply that the role of strategy on overtaking was especially underestimated for the 2016 season. This implies that some part of the increase in overtaking in 2016 compared to 2015 was misattributed to the cars, while in fact this was due to an unobserved increase in strategic variation. All in all, the findings suggest that, when tire wear is sufficiently high, the third tire compound may increase overtaking.
The relatively high overtaking count of the 2016 season may also imply that overtaking in Formula 1 very much depends on the teams’ and drivers’ understanding of the tires. For example, at the start of the Pirelli era the drivers were not very good at preserving their tires, which created a lot of on-track action as the tires dropped off at different rates. Later on, as the teams gained more experience, tire degradation became more similar, resulting in more processional racing. The 2016 tire rules then broke this sequence, as the different tire compounds dropped off at different rates. Again, the short-term impact of the rule changes was larger than the long-term impact, as overtaking was most abundant in the first part of the 2016 season.
The combination of wider cars and the more durable tires then halved overtaking in 2017 compared to 2016. Interestingly, overtaking improved again in 2018, despite a lack of rule changes. This again may be down to the slightly less durable tires. However, this did not lead to more pit-stops, which implied the drivers just were preserving the tires more. Possibly different levels of tire preservation between drivers created the necessary speed differentials for overtaking; thereby boosting the season’s overtaking count.
This is the first paper to statistically model overtaking in Formula 1 on a driver level. Since the analysis leaves a few unanswered questions, this may warrant future research. The model used in the paper can be extended in several ways. First of all, information about the actual number and length of the DRS zones can be added to more accurately estimate the impact of additional DRS zones on overtaking. Secondly, including the exact tire compounds used by the drivers in the race more accurately controls for strategic variation, which has a strong impact on overtaking. A third interesting extension may be to look at the role of differences in engine power (for example, the difference between the Mercedes and Honda engine) on overtaking, especially during the turbo era. Did these differences in engine power contribute to overtaking or did they only make it more difficult?
Acknowledgments
I thank Clip the Apex and Ergast Developer API for the providing me with the data to conduct this research. I would also like to thank Claudia Sulsters for her helpful comments and suggestions.
References
1 | Clip the Apex (n.d.). Formula One Overtaking Database. Retrieved from: https://cliptheapex.com/overtaking. |
2 | Cooper, A. ((2012) , April). How F1’s nose job got so out shape. Motor Sport Magazine. Retrieved from: https://www.motorsportmagazine.com/archive/article/april-2012/14/formula-1-how-f1s-nose-job-got-so-out-shape |
3 | Fédération Internationale de l’Automobile (2012). 2012 Formula One Technical Regulations. |
4 | Fédération Internationale de l’Automobile (2014). 2014 Formula One Technical Regulations. |
5 | Fédération Internationale de l’Automobile (2015). 2015 Formula One Technical Regulations. |
6 | Fédération Internationale de l’Automobile (2016). 2016 Formula One Technical Regulations. |
7 | Fédération Internationale de l’Automobile (2017). 2017 Formula One Technical Regulations. |
8 | Halo protection system to be introduced for 2018. (2017, July 19). Retrieved October 2, 2020, from: https://www.formula1.com/en/latest/headlines/2017/7/halo-protection-system-to-be-introduced-for-2018.html |
9 | Kelsall, H. ((2018) , March 18). Why a third DRS zone is not the answer F1 needs. Retrieved from: https://www.motorlat.com/notas/f1/4399/why-a-third-drs-zone-is-not-the-answer-f1-needs. |
10 | Mafi, M. ((2007) ). Investigation of Turbulence Created by Formula One™ Cars with the Aid of Numerical Fluid Dynamics and Optimization of Overtaking Potential. In ANSYS Conference & 25th CADFEM Users’ Meeting 2007 (Vol. 25, pp. 21-23). |
11 | Mercedes Brazilian GP feature - 2011 Season overtaking analysis. (2011, November 22), Retrieved from https://www.motorsport.com/f1/news/f1-mercedes-brazilian-gp-feature-2011-season-overtaking-analysis/415054/. |
12 | Merlino, M. ((2007) , December 19) Passing Thoughts: F1 Overtaking Analysis. Retrieved from: https://www.autosport.com/motorsport/feature/1404/passing-thoughts-f1-overtaking-analysis. |
13 | Newbon, J. , Sims-Williams, D. , and Dominy, R. , (2016) . Analysis of the Impacts of Formula 1 Car Wakes on the Aerodynamic Performance of a Following Vehicle. Göteborg, Sweden, June 2016. |
14 | Newbon, J. , Sims-Williams, D. , and Dominy, R. (2017) . Aerodynamic Analysis of Grand Prix Cars Operating in Wake Flows, SAE International journal of passenger cars. Mechanical systems. 10: (1), 318–329. |
15 | Newell, C. (2009) . Ergast Motor Racing Developer API. Retrieved from: http://ergast.com/mrd |
16 | Petrić, D. ((2017) , February 2). FIA increases 2017 minimum car weight. Retrieved from: https://maxf1.net/en/fia-increases-2017-minimum-car-weight/ |
17 | Pirelli tyres, adjustable rear wings among 2011 changes. (2010, June 23). Retrieved from http://www.formula1.com. |
18 | Strang, S. , ((2011) , June 29). FIA rubber-stamps new 1.6-litre V6 engine plans to be introduced in 2014. Retrieved from https://www.autosport.com/f1/news/92727/fia-ratifies-16litre-v6-engine-plan |
Appendices
Appendix
Table A1
Baseline model: Track fixed effects
| Circuit | (1) | (2) | (3) | |||
| Hungaroring | 1.736 | (0.267) | 1.622 | (0.251) | 1.637 | (0.253) |
| Singapore | 2.491 | (0.357) | 2.333 | (0.336) | 2.359 | (0.339) |
| Albert Park | 2.791 | (0.409) | 2.744 | (0.405) | 2.755 | (0.406) |
| Yeongam | 2.838 | (0.407) | 2.676 | (0.393) | 2.746 | (0.402) |
| Nürburgring | 2.942 | (0.472) | 3.008 | (0.506) | 3.084 | (0.514) |
| Autódromo Hermanos Rodriguez | 3.091 | (0.468) | 2.789 | (0.425) | 2.848 | (0.430) |
| Sochi | 3.157 | (0.489) | 3.092 | (0.477) | 3.220 | (0.499) |
| Buddh | 3.303 | (0.532) | 2.972 | (0.489) | 2.918 | (0.478) |
| Circuit Gilles Villeneuve | 3.544 | (0.500) | 3.429 | (0.483) | 3.378 | (0.478) |
| Suzuka | 3.599 | (0.510) | 3.480 | (0.492) | 3.475 | (0.491) |
| Valencia | 3.706 | (0.576) | 3.646 | (0.571) | 3.725 | (0.586) |
| Red Bull Ring | 3.745 | (0.544) | 3.443 | (0.512) | 3.358 | (0.494) |
| Catalunya | 4.003 | (0.581) | 3.630 | (0.518) | 3.647 | (0.520) |
| Silverstone | 4.007 | (0.562) | 3.937 | (0.559) | 3.915 | (0.558) |
| Spa-Francorchamps | 4.041 | (0.545) | 3.835 | (0.518) | 3.877 | (0.523) |
| Yas Marina | 4.055 | (0.546) | 3.789 | (0.511) | 3.730 | (0.505) |
| Interlagos | 4.282 | (0.616) | 4.134 | (0.593) | 4.116 | (0.589) |
| Monza | 4.402 | (0.587) | 4.342 | (0.596) | 4.243 | (0.580) |
| Sepang | 4.419 | (0.648) | 3.725 | (0.565) | 3.771 | (0.562) |
| Circuit of the Americas | 4.533 | (0.646) | 4.382 | (0.621) | 4.337 | (0.615) |
| Hockenheimring | 4.821 | (0.776) | 4.294 | (0.684) | 4.330 | (0.688) |
| Baku | 4.945 | (0.755) | 4.611 | (0.721) | 4.640 | (0.730) |
| Sakhir | 5.461 | (0.767) | 4.705 | (0.669) | 4.780 | (0.673) |
| Paul Ricard | 5.859 | (1.065) | 5.514 | (1.049) | 5.789 | (1.120) |
| Shanghai | 6.024 | (0.821) | 5.647 | (0.762) | 5.664 | (0.764) |
| Istanbul Park | 8.412 | (1.473) | 7.621 | (1.336) | 7.677 | (1.349) |
Note: Displayed are the incidence-rate ratios. Monaco is the reference track.
Table A2a
Sensitivity analysis: Track fixed effects
| Circuit | (1) | (2) | ||
| Singapore | 2.256 | (0.970) | 2.678 | (1.271) |
| Albert Park | 2.864 | (1.116) | 3.458 | (1.669) |
| Buddh | 2.886 | (1.320) | 3.606 | (1.493) |
| Hungaroring | 3.208 | (1.390) | 4.025 | (1.684) |
| Red Bull Ring | 3.654 | (1.470) | 4.782 | (2.037) |
| Yeongam | 4.033 | (1.862) | 5.248 | (2.051) |
| Autódromo Hermanos Rodriguez | 4.256 | (1.679) | 5.150 | (2.992) |
| Shanghai | 4.548 | (1.712) | 5.793 | (2.203) |
| Catalunya | 4.888 | (1.814) | 6.028 | (2.613) |
| Sochi | 5.219 | (2.715) | 5.763 | (2.279) |
| Paul Ricard | 5.312 | (2.822) | 9.391 | (3.781) |
| Silverstone | 5.494 | (2.152) | 7.347 | (3.383) |
| Circuit Gilles Villeneuve | 5.578 | (2.163) | 6.994 | (2.887) |
| Sepang | 6.096 | (2.370) | 7.807 | (3.338) |
| Monza | 6.274 | (2.327) | 7.793 | (3.131) |
| Yas Marina | 6.444 | (2.400) | 8.030 | (3.503) |
| Spa-Francorchamps | 6.856 | (2.616) | 9.150 | (3.622) |
| Circuit of the Americas | 7.043 | (2.695) | 9.209 | (4.257) |
| Nürburgring | 7.114 | (3.578) | 8.103 | (3.978) |
| Suzuka | 7.417 | (2.853) | 10.282 | (4.106) |
| Baku | 7.425 | (2.831) | 9.129 | (3.353) |
| Sakhir | 7.646 | (2.930) | 10.304 | (4.300) |
| Valencia | 8.703 | (3.951) | 11.051 | (5.609) |
| Hockenheimring | 10.861 | (5.741) | 15.932 | (9.180) |
| Interlagos | 11.689 | (4.401) | 14.916 | (5.927) |
| Istanbul Park | 13.169 | (7.591) | 14.462 | (5.692) |
Note: Displayed are the incidence-rate ratios. Monaco is the reference track.
Table A2b
Sensitivity analysis: Track×number of pit-stops
| Circuit | (1) | (2) | ||
| Monaco | 1.434 | (0.316) | 1.520 | (0.269) |
| Singapore | 1.295 | (0.166) | 1.305 | (0.168) |
| Albert Park | 1.293 | (0.135) | 1.299 | (0.184) |
| Buddh | 1.383 | (0.254) | 1.361 | (0.178) |
| Hungaroring | 0.936 | (0.122) | 0.914 | (0.119) |
| Red Bull Ring | 1.314 | (0.191) | 1.313 | (0.243) |
| Yeongam | 1.076 | (0.178) | 1.042 | (0.123) |
| Autódromo Hermanos Rodriguez | 1.068 | (0.141) | 1.066 | (0.252) |
| Shanghai | 1.380 | (0.123) | 1.368 | (0.101) |
| Catalunya | 1.105 | (0.080) | 1.099 | (0.100) |
| Sochi | 1.006 | (0.372) | 1.045 | (0.226) |
| Paul Ricard | 1.704 | (0.603) | 1.416 | (0.278) |
| Silverstone | 1.117 | (0.136) | 1.102 | (0.146) |
| Circuit Gilles Villeneuve | 1.006 | (0.137) | 1.009 | (0.130) |
| Sepang | 1.033 | (0.094) | 1.047 | (0.115) |
| Monza | 1.107 | (0.128) | 1.097 | (0.151) |
| Yas Marina | 0.984 | (0.108) | 0.991 | (0.142) |
| Spa-Francorchamps | 0.987 | (0.103) | 0.996 | (0.100) |
| Circuit of the Americas | 1.022 | (0.135) | 1.008 | (0.153) |
| Nürburgring | 0.899 | (0.137) | 0.903 | (0.114) |
| Suzuka | 0.885 | (0.096) | 0.853 | (0.091) |
| Baku | 1.047 | (0.117) | 1.096 | (0.126) |
| Sakhir | 1.032 | (0.092) | 1.014 | (0.109) |
| Valencia | 0.867 | (0.120) | 0.860 | (0.170) |
| Hockenheimring | 0.854 | (0.149) | 0.828 | (0.179) |
| Interlagos | 0.781 | (0.076) | 0.768 | (0.085) |
| Istanbul Park | 1.010 | (0.148) | 1.043 | (0.072) |
Note: Displayed are the incidence-rate ratios.
Table A2c
Sensitivity analysis: Track×position deviation after first lap (second specification)
| Circuit | Better than expected | Worse than expected | ||
| Monaco | 49.303 | (60.252) | 76.560 | (60.908) |
| Singapore | 17.792 | (16.281) | 8.058 | (6.473) |
| Albert Park | 5.647 | (3.296) | 11.949 | (5.049) |
| Buddh | 12.864 | (18.922) | 10.604 | (12.874) |
| Hungaroring | 2.809 | (2.018) | 28.432 | (17.376) |
| Red Bull Ring | 1.360 | (0.391) | 4.662 | (2.079) |
| Yeongam | 7.383 | (1.123) | 7.950 | (2.812) |
| Autódromo Hermanos Rodriguez | 18.107 | (7.615) | 9.889 | (3.342) |
| Shanghai | 3.834 | (1.578) | 8.547 | (1.001) |
| Catalunya | 7.809 | (4.546) | 9.550 | (2.886) |
| Sochi | 17.307 | (9.457) | 21.189 | (12.098) |
| Paul Ricard | 3.951 | (0.362) | 5.403 | (0.554) |
| Silverstone | 2.544 | (1.800) | 7.959 | (2.284) |
| Circuit Gilles Villeneuve | 2.542 | (1.044) | 5.440 | (1.212) |
| Sepang | 2.609 | (0.308) | 5.860 | (1.769) |
| Monza | 7.151 | (3.955) | 14.514 | (2.915) |
| Yas Marina | 3.754 | (2.110) | 9.355 | (2.032) |
| Spa-Francorchamps | 3.459 | (1.042) | 4.060 | (0.575) |
| Circuit of the Americas | 2.610 | (1.215) | 6.669 | (2.553) |
| Nürburgring | 6.694 | (6.507) | 47.388 | (15.951) |
| Suzuka | 4.742 | (4.242) | 5.661 | (0.964) |
| Baku | 5.550 | (2.499) | 3.886 | (1.837) |
| Sakhir | 1.815 | (0.349) | 3.842 | (1.218) |
| Valencia | 0.240 | (0.048) | 2.128 | (1.559) |
| Hockenheimring | 2.048 | (0.529) | 5.224 | (1.445) |
| Interlagos | 5.111 | (2.971) | 12.368 | (5.998) |
| Istanbul Park | 54.060 | (10.620) | 12.634 | (1.446) |
Note: Displayed are the incidence-rate ratios.
Table A3
Sensitivity analysis: Track fixed effects
| Circuit | (1) | (2) | (3) | |||
| Hungaroring | 1.623 | (0.252) | 1.653 | (0.257) | 1.629 | (0.245) |
| Singapore | 2.314 | (0.333) | 2.307 | (0.332) | 2.374 | (0.329) |
| Albert Park | 2.734 | (0.402) | 2.556 | (0.377) | 2.615 | (0.371) |
| Yeongam | 2.717 | (0.397) | 2.940 | (0.433) | 2.645 | (0.373) |
| Autódromo Hermanos Rodriguez | 2.866 | (0.433) | 2.839 | (0.438) | 3.050 | (0.441) |
| Buddh | 2.911 | (0.477) | 2.896 | (0.478) | 2.930 | (0.460) |
| Nürburgring | 3.062 | (0.519) | 3.330 | (0.557) | 3.250 | (0.526) |
| Sochi | 3.194 | (0.494) | 3.265 | (0.507) | 3.243 | (0.487) |
| Red Bull Ring | 3.310 | (0.487) | 3.389 | (0.500) | 3.345 | (0.475) |
| Suzuka | 3.399 | (0.480) | 3.545 | (0.505) | 3.553 | (0.482) |
| Catalunya | 3.554 | (0.507) | 3.569 | (0.514) | 3.492 | (0.482) |
| Circuit Gilles Villeneuve | 3.364 | (0.479) | 3.539 | (0.501) | 3.418 | (0.467) |
| Valencia | 3.685 | (0.576) | 3.977 | (0.633) | 3.914 | (0.588) |
| Yas Marina | 3.693 | (0.502) | 3.653 | (0.4950 | 3.766 | (0.491) |
| Sepang | 3.745 | (0.553) | 3.926 | (0.588) | 4.018 | (0.581) |
| Spa-Francorchamps | 3.914 | (0.530) | 4.159 | (0.566) | 4.154 | (0.547) |
| Silverstone | 3.978 | (0.570) | 3.756 | (0.545) | 3.945 | (0.545) |
| Interlagos | 4.056 | (0.580) | 3.939 | (0.565) | 4.011 | (0.556) |
| Monza | 4.240 | (0.581) | 4.561 | (0.635) | 4.316 | (0.576) |
| Hockenheimring | 4.262 | (0.679) | 4.066 | (0.656) | 4.376 | (0.666) |
| Circuit of the Americas | 4.354 | (0.615) | 4.348 | (0.615) | 4.268 | (0.589) |
| Sakhir | 4.664 | (0.656) | 4.609 | (0.651) | 4.744 | (0.648) |
| Baku | 4.696 | (0.721) | 4.624 | (0.737) | 4.688 | (0.683) |
| Shanghai | 5.602 | (0.757) | 5.556 | (0.753) | 5.665 | (0.738) |
| Paul Ricard | 6.140 | (1.150) | 5.962 | (1.150) | 6.248 | (1.063) |
| Istanbul Park | 7.389 | (1.271) | 6.938 | (1.360) | 7.760 | (1.301) |
Note: Displayed are the incidence-rate ratios. Monaco is the reference track.
Notes
1 DRS zones are typically on the longest straights, the places where passing is most likely. DRS likely increases the likelihood of overtaking on these straights, but it may also indirectly increase overtaking in subsequent sections by allowing the following car to close in on the leading car. Therefore, the fraction of passes inside the DRS zones does not provide much information about the degree to which DRS boosts overtaking.
2 See: “Pirelli tyres, adjustable rear wings among 2011 changes” (2010).
4 See: Cooper (2012).
5 See: Strang (2011).
10 See: Petrić (2017)
12 The difference between unscheduled and scheduled pit-stops is that with an unscheduled stop the team has no option to play around with the timing of the stop to minimize thee time lost in traffic. On the other hand, an unscheduled stop is less likely to give a driver much of a tire-performance advantage over the opposition, thereby reducing their overtaking potential compared to scheduled stops.
13 The fastest driver of the weekend has a standardized rank ρijt of 1, whereas the slowest driver has a standardized rank of 0. In the same way the standardized positionψijt is 1 for the leader and 0 for the driver running last at the end of the first lap. However, the standardized position πijt ranges from – 1 to +1 and are in ascending order, that is, the leader has the lowest number. These different definitions are used as ψijt is later directly compared to ρijt, whereas πijt is later interacted with pit-stop timing, for which it is more helpful to have a variable with a mean of zero.
14 The incidence-rate ratios are the exponents of the regression coefficients. Incidence-rate ratios indicate the ratio at which the number of overtakes is affected by a unit increase of a control variable. In case of dummy variables, the incidence-rate ratios depict the rate at which overtaking increases if the dummy variable goes up from 0 to 1. Some continuous variables are log-transformed, so the estimated coefficients can be interpreted as elasticities.
15 For simplicity sake, only one coefficient for overtaking and being overtaken is estimated, rather than two separate coefficients as in the other specifications.
16 Due to nonlinearity of the model, averaging the control variables tends to underestimate the overtaking probabilities. Therefore, the dataset averages are adjusted in every step to match the original dataset average (43.0 overtakes per race).
17 As wet races are excluded from the analysis, these season-to-season differences are partly caused by wet races affecting “good” or “bad” circuits for overtaking. For example, the 2016 season had a wet Monaco Grand Prix. Also, the introduction of the Baku Street Circuit (Azerbaijan) to the calendar likely improved overtaking. Conversely, the Buddh International Circuit (India) and the Korea International Circuit or Yeongam Circuit (Korea) which were used up until 2013 were below-average circuits for overtaking. Also the Autódromo Hermanos Rodriguez (Mexico), which was added to the calendar in 2015, turned out to be a not very overtaking-friendly track.


