
Home advantage and away goals rule: An analysis from Brazil Cup
Abstract
In football, many people argue that in knock-out competitions the team that plays the second game in its stadium would have an advantage, a greater probability of victory in the final outcome of a two leg knock-out match. The purpose of this study is to verify the veracity of this statement using data from the Brazil Cup. We find evidence that the ability spread between the teams participating in a match is the main factor that explains the qualification of one of the teams for the next round. Until 2018, there were three criteria for break the tie in the Brazil Cup, they were used in the respectively order: goal difference, away goals rule, penalty shootout (there is no extra-time in any play-off of the championship). It is estimated that 36% of the matches end tied and need a criterion to determine the winner. Of these, 51% use the goal difference decision, 29% use the away goals rule and 20% penalty shoot-out. When considering the championship in general there is evidence that the home team wins the match in approximately 63% of the matches, a significant advantage. However, in the confrontations that were decided by the away goals rule or the penalty shoot-out, the home team wins percentage is 20% lower, indicating that these criteria level the odds of both teams.
Abbreviations
FLHT | First leg home team |
SLHT | Second leg home team |
AB | Ability spread |
GD | Goals difference |
AGR | Away goals rule |
PN | Penalties shoot-out |
1Introduction
Widely studied, the home advantage has appeared as a consistent and sturdy effect in a large number of research articles in a lot of different sports, see for instance (Pollard 2006; Page and Page 2007), and references therein.
Many of these studies show that this advantage exists also for football, on several tournaments around the world. The phenomenon has a historical origin, occurring for more than 100 years in England (Pollard 1986). However, there has been a decline in this advantage, possibly due to changes in the rules, such as the increase in the number of points gained per win, among others that minimise the defensive positioning of the visiting team (Sánchez et al. 2009). The main factors considered to cause the home advantage effects are: crowd, travel fatigue, familiarity with the pitch, referee bias, territoriality, special tactics, rules and psychological factors (Pollard 2008). It is estimated that the average advantage is 61.5% in the world and 64% in South America, being measured as a percentage of points earned at home on the total points earned (Pollard 2006). However, for local derbies, it is concluded that the advantage of playing in their stadium is significantly lower (Pollard 1986; Seckin and Pollard 2008). In some countries, such as Turkey and Spain, it turns out that there is no significant difference between the advantage of playing in their domains for the first and second division championships (Seckin and Pollard 2008; Sánchez et al. 2009). However, in Brazil, in (Almeida, Oliveira, and Silva 2011), Almeida et al. showed that average percentages of approximately 65% in Series A and 69% in Series B of the Brazilian Championship are observed (significantly at p-value 0.05). The authors cite some factors like condition of the stadiums and bigger traveling distances to explain this difference of the home advantage in Series B and A of Brazilian Championship, the study analyses both championship from 2003 and 2009.
Analysing the existence of regional discrepancies in the home advantage among the countries of Europe and South America, where the main leagues are close to the world average, it is reported that this variation is mainly due to geographical locations (Pollard 2006), it is concluded that the advantage is greatest in remote and ethnically distinct places (Seckin and Pollard 2008).
The size and weather diversity of Brazil make the effect of travelling possibly more important than in other countries. Significant results for first division of the Brazilian Championship were obtained indicating that 0.115 more goals are expected for the home team every 1000 km travelled by the visiting team (Pollard, Da Silva, and Nísio 2008). Besides, the second division, as well the Brazil Cup, includes less expressive clubs, that usually play in small stadiums, which can give the feeling of a greater presence of the fans, consequently increasing the pressure on the players, especially on the visitors. Another relevant point is the field conditions, which are often worse, making familiarity with the venue an even more decisive factor in the advantage of playing at home.
There are several studies on the advantage of playing at home, but few have as objective to identify the existence of advantage in confrontations of simple knock-out; in particular, to the best of our knowledge there are no articles in the literature that address the effects of the away goals rule. In two-stages knock-out competitions, it has been reported an advantage for the team that plays the second leg at home (Page and Page 2007). A significant advantage is identified: the classification percentage is 54.98% for the team playing the second game at home, in the average of three championships analysed, namely Champions League, UEFA Cup and Cup Winner Cup; controlling the analysis for the ability of the teams, the advantage is 54.33%. It is estimated, from a logistic regression fit to the data, that the probability of this team to win the match, adjusted for ability, is 53.77%, significantly favourable to it. In addition, it is concluded that the advantage remained over time, but has a significant downward trend, as was identified in the leagues of running points (Page and Page 2007).
When single elimination matches are tied in number of points, a criterion is necessary to define the winner; the three most used are:
• Goals difference, GD: the team that scores the most goals wins;
• Away goals rule, AGR: the team that scores the most goals when playing away from home wins;
• Penalties shoot-out, PN: the team that scores more goals in the alternating penalty shoot-out wins.
The AGR is currently used in the major championships worldwide. Considering that at the end of the first game the outcome of that match is fixed (i.e. the team that played as a visitor can no longer change the number of goals scored away from home), it turns out that in the second game only one team can modify that criterion. That is, in the second game, both teams can try to improve/change the first two criteria of classification (score and GD), but only the visitor has the chance to change the third. For this reason, the AGR may manifest as an advantage (or at least an equalisation) for the visiting team of the second game, in two ways: minimising the home team offensive posture, and by the possibility of changing this criterion when the other team can not do it any more.
Thus, the present study aims to investigate whether having the field command in the second match of a knock-out match represents an advantage; in particular, to see how certain characteristics (such as the ability of the teams participating and the use of the away goal, for example) influence this supposed advantage.
2Hypotheses
The hypotheses that will be analyzed in this work, based on the literature review and personal knowledge, through popular beliefs, are:
• The main determining factor for a team’s classification is the difference in quality between the participants of the confrontation.
• The SLHT probability of classification is greater than 0.5, representing the advantage of playing the second match of a Knock-out in their stadium.
• When using the away goals rule or penalties shoot-out the SLHT probability of classification is approximately 0.5, regardless of the quality difference.
3Methodology
3.1Database
The main objective of this study is to analyse the advantage of deciding football play-offs (consisting in two matches) at home, especially to measure the influence, if any, of the away goals rule on this advantage. Our database consisted of 1662 knock-out rounds of Brazil Cup (Copa do Brasil) from 1994 to 20171.
For the analysis we considered 1093 play-offs (2186 individual matches). From the original 1662, we excluded:2
• 288 observations in which the confrontation was decided in only one game, since it was not the scope of this study.
• 203 observations from qualifying rounds because they also do not have the characteristics in focus in the research (generally there are great ability discrepancies among the teams, in addition to approximately 44% of them being defined in only one game).
• 11 observations that were defined by punishments, that is, legal decisions that have no relation to the practice of sports.
• 5 observations where the away goals rule could not be applied. The rules of the competition provide that in the situation where the venue is considered neutral, the away goals rule can not be applied, these happened twice. In 2015, 2016 and 2017 it was also determined that in the finals the rule would not applied. Since it is considered that the simple possibility of using the rule modifies the characteristics of the confrontation, it was chosen to exclude these 5 knock-outs from the analysis.
3.2Data collection and model
The database was collected and organized by the authors. Data are widely disclosed, and can be consulted on the CBF website and also in specialized websites such as http://www.bolanaarea.com/. Throughout the paper, we will call the team playing at home the second game as second leg home team, SLHT, and the team playing at home the first game as the first leg home team, FLHT. Differently of most of the consulted papers, the home advantage is not measured as a percentage of points earned at home on the total points earned, as knock-out matches are being analysed in these study: instead, we will be interested in analysing a binary response variable y which represents the outcome, after both games, of the second leg home team (1 if it qualifies and 0 otherwise); this is similar to the approach adopted in (Page and Page 2007). Besides, we believe that this methodology could also be used to measure the home advantage in one leg championships, not only in knock-out competitions, considering as home advantage only the cases that the home team wins the match.
One of our hypotheses is that the main component explaining the outcome of a play-off is the ability spread3 between the teams participating in the match. Therefore, based on the 2016’s criterion of the Brazilian Football Confederation (CBF 2014) we created a proxy variable that measures the overall ability of each team in the sample, on a yearly basis.
In some years, at the first stages, the seeding system allocates the “better” teams as the SLHT. The fact the draw is not totally random means we should expect the SLHT qualifies with a higher percentage in the play-offs. However, as did (Page and Page 2007), we can accurately assess the real effect of the second leg home advantage controlling for the differences in teams’ ability.
The proxy variable ability was constructed as follows. Each team receives a score according to its final classification in the Brazilian Championship and the Brazil Cup. In addition, they receive a bonus score as compensation if they have been prevented from competing in the Brazilian Cup due to conflict of dates with their participation in the South American and Libertadores Cups. The score is calculated at the end of each year as a weighted average of the last five years’ points. It should be emphasised that the score of a team in any given year does not depend on his result on that year, only on the previous ones – this prevents endogeneity of the variable ability.
A simple points in the standings or a prior year finish in a championship has not been used because the teams that play the Brazilian Cup change from year to year. Also, since Brazil is a continental country, it is needed to travel long distances sometimes to play, for this reason it is common that a team prioritizes one championship over the other. Therefore a ranking that looks to just one championship may not reflect the reality of a team that decided to not prioritize that competition. Overall looking to a bigger period of time permit us to look not only to the “moment” of a team but also how well he is being administered, how much competitive he is over the previous years. Off course, the fact that the proxy gives more weight on the achievements of the year just before it is computed means that last results obtained are the most important element in the ability, however it is not the only one.
In the adjusted models, we used a standardisation of the difference between the teams’ scores, as a proxy for their ability spread, similar to the idea of (Page and Page 2007). It is noticed that this variable, besides representing the ability spread, also captures the variation between the phases of the competition, since the spread in abilities decreases as one advances from 32th to 16th to 8th and so on. Likewise, the variation between the years is mainly due to changes in the ability of each team. Another reason to use this variable is to analyze the hypotheses cited above.
The unstandardised ability spread,
The standardised ability spread (hereafter simply ability spread) is then defined by
In order to estimate the probability of classification of the SHLT in the Brazil Cup, relating to the ability spread and criteria used to decide the winner, we adjusted a logistic regression model. For this, the response variable is the classification of SLHT and the explanatory components considered in the model are the ability spread (AB) and the type of decision, which is a polytomic categorical variable. Therefore, three dummies were introduced, for goal difference, away goals rule and penalties shoot-out (respectively GD, AGR and PN), maintaining the classification by points as a reference category. In addition, we included the interactions between the ability spread and each dummy in the adjustment.
In preliminary studies, we also adjusted two additional models. The first, a logistic regression with the reduced database, containing only the confrontations of the final stages – round of 16, quarter-finals, semi-finals and final. However, the results were similar to those obtained by the regression that will be described next, and thus we chose to use all data to avoid discarding information. In the second model, the dependence between the same response and covariates as above was estimated through a non-parametric fit to the data, yielding once again results that were ‘close’ to those obtained through the logistic regression approach,indicating that the parametric adjustment is suitable; results are presented in the Appendix A.1, more details about this methodology in (Hayfield and Racine 2008) and (Barbosa and Brandão 2017). Since both preliminary fits yielded results similar to the logistic regression adjustment described below, we refrain from providing the detailed analysis.
Therefore, the final adjusted model is
i = 1, ... n, where π(x) is the probability of the SLHT winning the two-leg knock-out match given the value of the covariate vector x, that is π (x) = Pr(y = 1|x). This model is useful to understand the phenomenon of the advantage of playing at home the second match of a play-off, as well as some features that may have an influence on this advantage.
3.3The independence assumption: A discussion
Independence between observations is an important feature because it ensures good statistical properties for the maximum likelihood estimators of the model parameters. In the case of the Brazil Cup, the participating teams might be repeated over the years and, more specifically, some are repeated along different phases during the same year, as they advance in the competition. For example, the information that a certain team has already won a play-off as FLHT certainly alters the likelihood that the same team will win a new showdown at a later stage in which they play as FLHT: there are indications that this team has competence to qualify when he does not play the second game at home. Therefore, it is reasonable to assume that there is some correlation between certain characteristics of the sample units. However, in each phase, new play-offs are formed, defined by a previous draw, so that the home teams at the second leg are largely randomised. In addition, the ability of each team is maintained, but the ability spreads between the participants are different, so the characteristics of the new observation, at worst, have weak dependence on the characteristics of the previous observation, not enough to violate the hypotheses that legitimise the estimation procedures adopted herein. Moreover, in the present study the observational units are the two-leg matches, not the particular participants of each confrontation and the response variable considered here is the classification, or not, of the SLHT.
We argue that the characteristics that are correlated between the confrontations, as the participating teams, do not cause problems since they are not used in the adjusted models. Even when a team repeats itself in two different play-offs of the same year, the ability spread of that confrontation (which is likely the main factor influencing the classification probabilities) is bound to change, as said team will necessarily face a different opponent. Thus, even supposing there is prior information on whom the participants in the confrontation are, it is not known who the FLHT will be (because of randomised assignment), so there is no indication as to the likelihood of the response6.
Finally, we chose to use logistic regression, despite the knowledge that there are insurmountable limitations to this approach because of the possible existence of a correlation between the observational units, even though the responses are independent. A possible alternative is the use of mixed models, which would add a random-effects term for the year of the clashes, so that the correlation between clashes of the same team would be controlled by the year of the competition. However, in a preliminary study we found it has led to results similar to those obtained by the fixed-effects-only logistic regression that we adopt herein; additional results are presented in the Appendix A.2. Comparing the AIC of the two regressions the difference is 1.65, being 1255.32 for the mixed model and 1253.67 for the fixed-effects-only logistic regression. In the same way, the difference between the estimated coefficients is not relevant and both give the same conclusions about significances. Therefore, for convenience of the reader, we chose to adopt the more parsimonious model.
4Results
4.1Descriptive
In the tournament, 44.19% of the play-offs have the direct qualification of the SLHT, that is without tie in the aggregated result. However, when looking only the observation of the final stages, this percentage decreases to 37.25%. On the other hand, the percentage of tied play-offs (which will be defined by some of the criteria) remains around 36% when considering the whole tournament or only the final stages, divided into about 19% of SLHT qualified and 17% of the FLHT.
The SLHT has qualified in 63,31% of the play-offs, significantly more than half (p-value <0.0001), with CI = 0.6331±0.0286. On the other hand, considering only the play-offs from the sixteenth rounds, this percentage decreases to 56.96%, and it is also significantly more than half the clashes (p-value = 0.0004), with CI = 0.5696±0.0385. Although both are larger than 0.5, it can be noted that the estimates of the intervals are quite different. This is because, in the final stages, the disparity in the ability of the teams is smaller, so that the visitor can win more often, even though the SLHT persists with the advantage.
Table 1 presents the percentages of aggregate results and classification. The Fig. 1 presents the percentages of the aggregated results (Chart (a)) and the percentages of classification (Chart (b)) over the years, in order to analyse if there are also differences between the years.
Table 1
Aggregate Result and qualification
| Tournament | Final rounds | |||
| Result | Frequency | % | Frequency | % |
| Victory of SLHT | 483 | 44.19 | 238 | 37.25 |
| Tie – SLHT Qualification | 209 | 19.12 | 126 | 19.72 |
| Tie – FLHT Qualification | 179 | 16.38 | 110 | 17.21 |
| Defeat of SLHT | 222 | 20.31 | 165 | 25.82 |
| Qualification | ||||
| SLHT | 692 | 63.31 | 364 | 56.96 |
| FLHT | 401 | 36.69 | 275 | 43.04 |
| Total | 1093 | 100 | 639 | 100 |
Fig. 1
Aggregate results and qualification of SLHT by year.
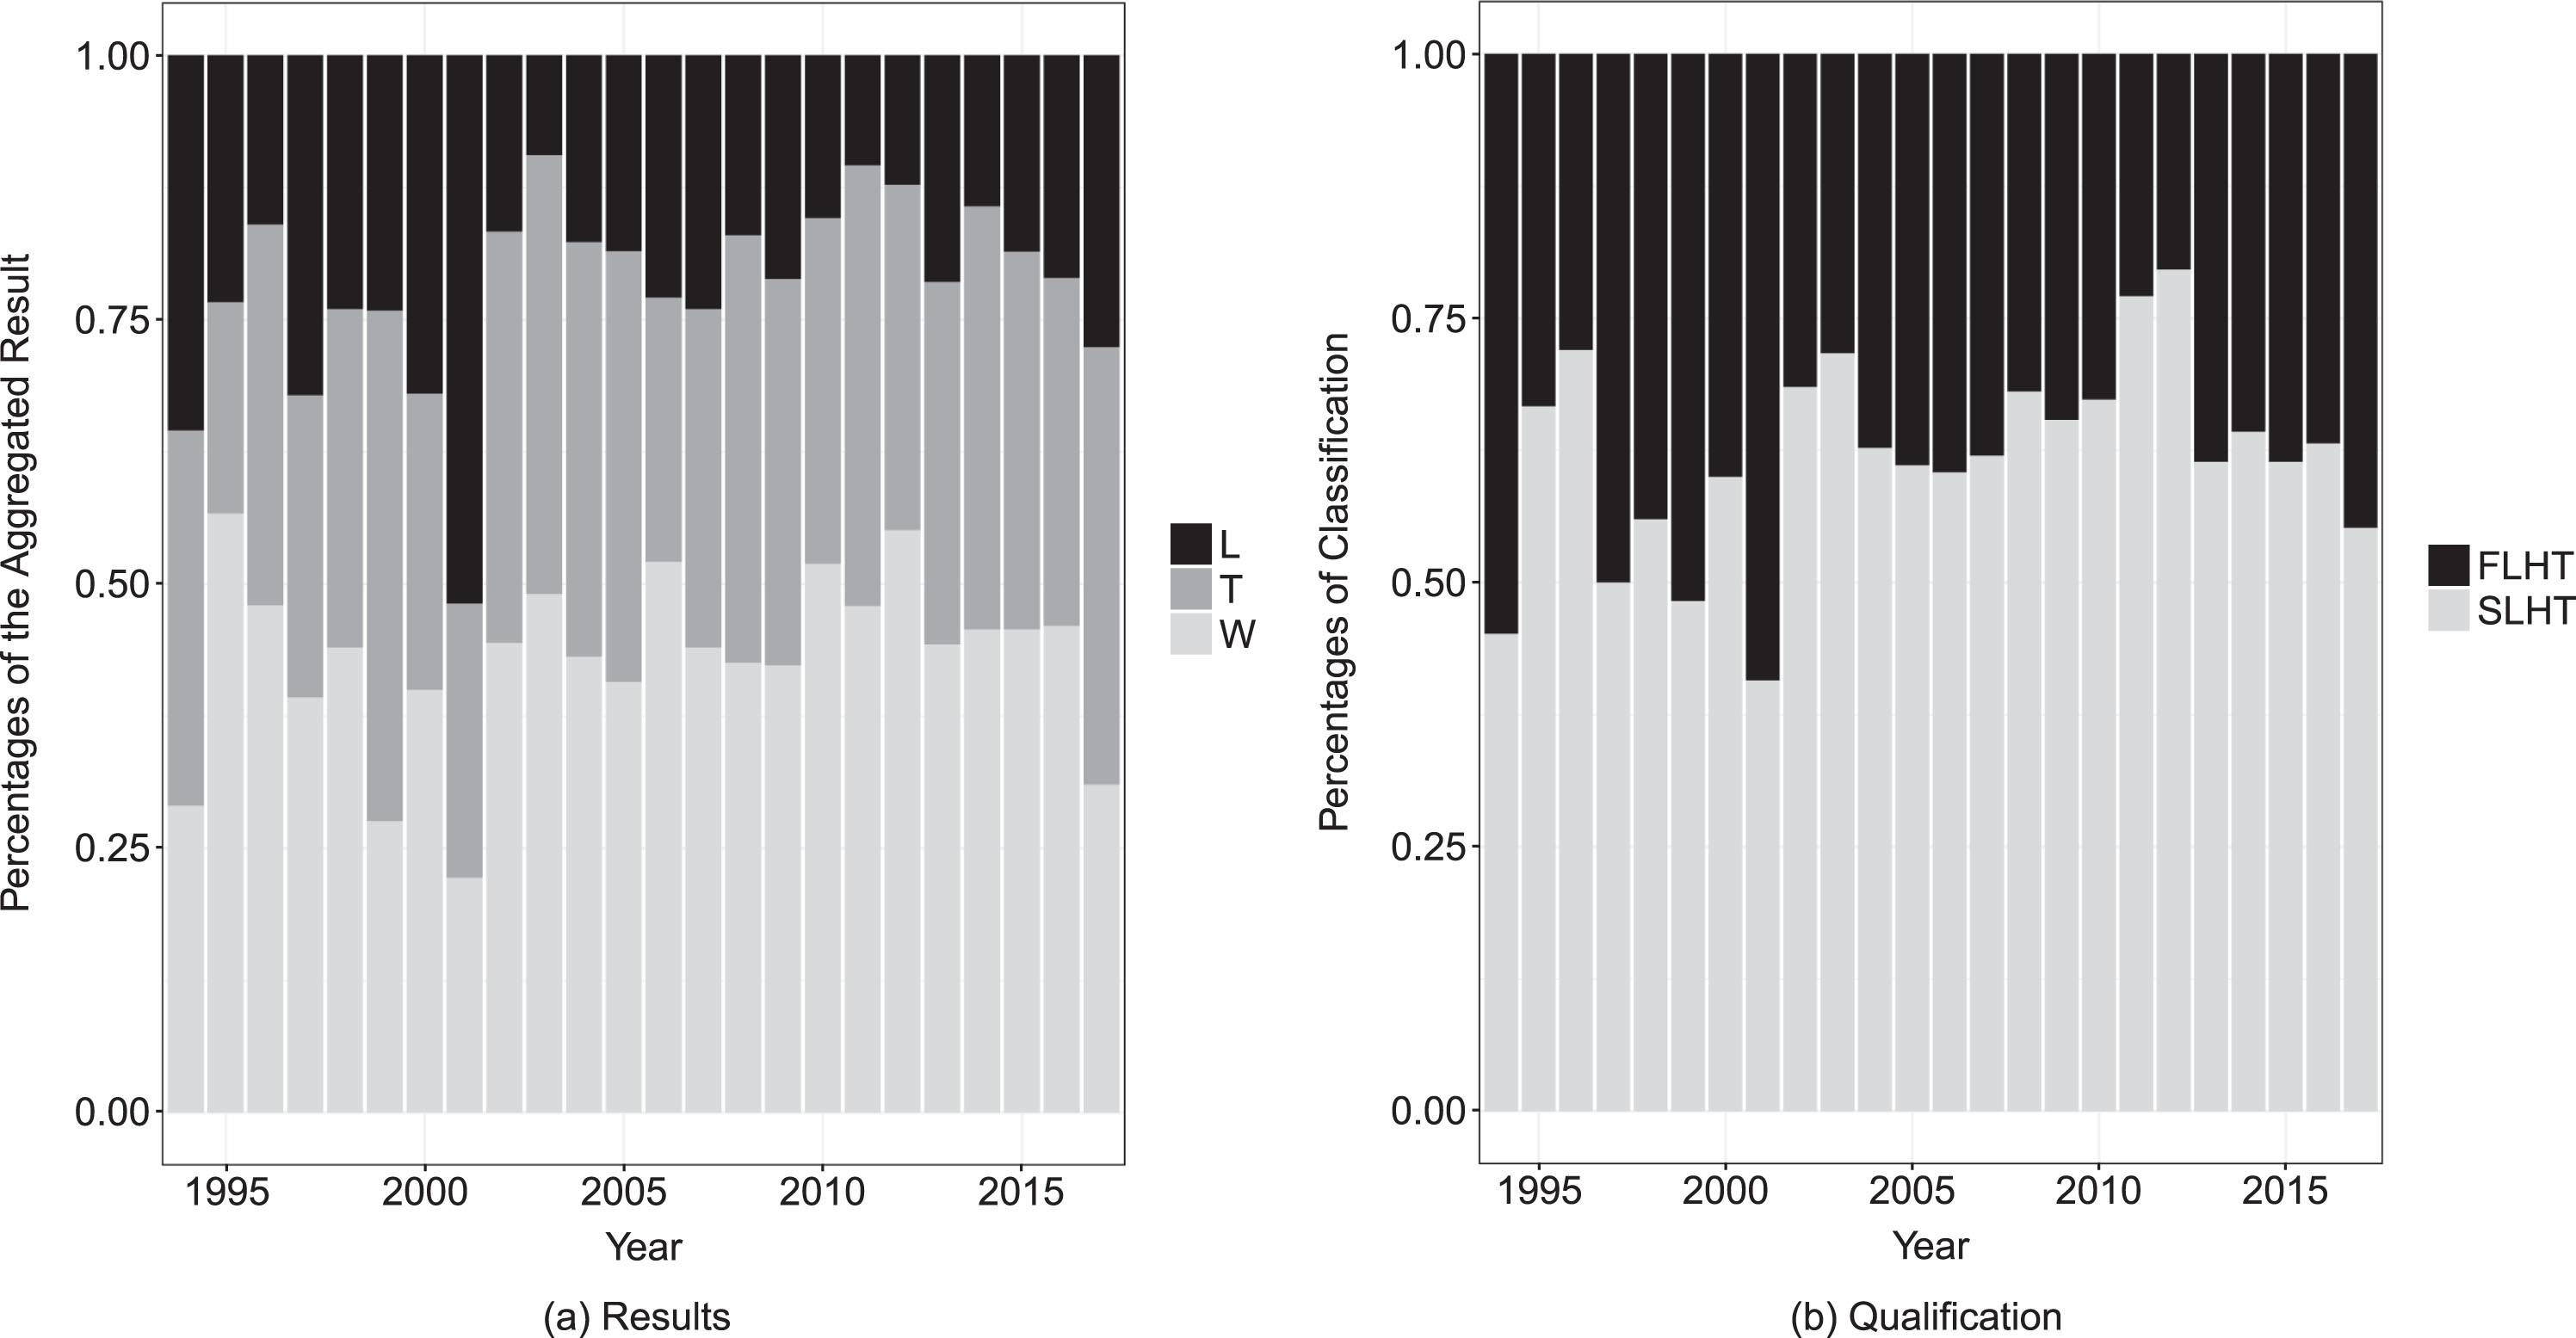
In the two graphs, it is identified that there is a variation between the years, but mainly in the proportions of the results. This is due to the phases that were disputed. In the years in which the championship had more stages, there were more observations in the initial phases, in which there was no draw to decide the SLHT, often it was the one with better ability, consequently, happened more victories of the SLHT. In the classification chart, the behaviour seems to be more constant, especially after 2002, when it started the phase thirty-second round. This indicates that, although the points in the play-offs is considerably variable, the final outcome, the qualification, is relatively constant over the years.
Figure 2 presents the percentages of qualification in each round of Brazil Cup. It is possible to identify that in the two initial rounds, the SLHT wins approximately 72% of the play-offs, with CI = 0.7225±0.0414, significantly more than half (p-value<0.0001). In addition, this percentage in the early stages is also significantly higher than in the final stages (p-value <0.0001), whose percentage is 56.96%, which is also significantly higher than 0.5 (p-value = 0.0004), with CI = 0.5696±0.0385. This again evidences that the ability spreads between the teams of final stages play-offs is smaller than in the beginning. So, even if the SLHT team has an advantage, the FLHT manages to win more than in the early stages. However, if only post eighth rounds are considered, then the percentage is 51.99%, matching the SLHT and FLHT rating percentages (p-value = 0.4563), CI = 0.5199±0.0525.
Fig. 2
Percentage of qualification by round.
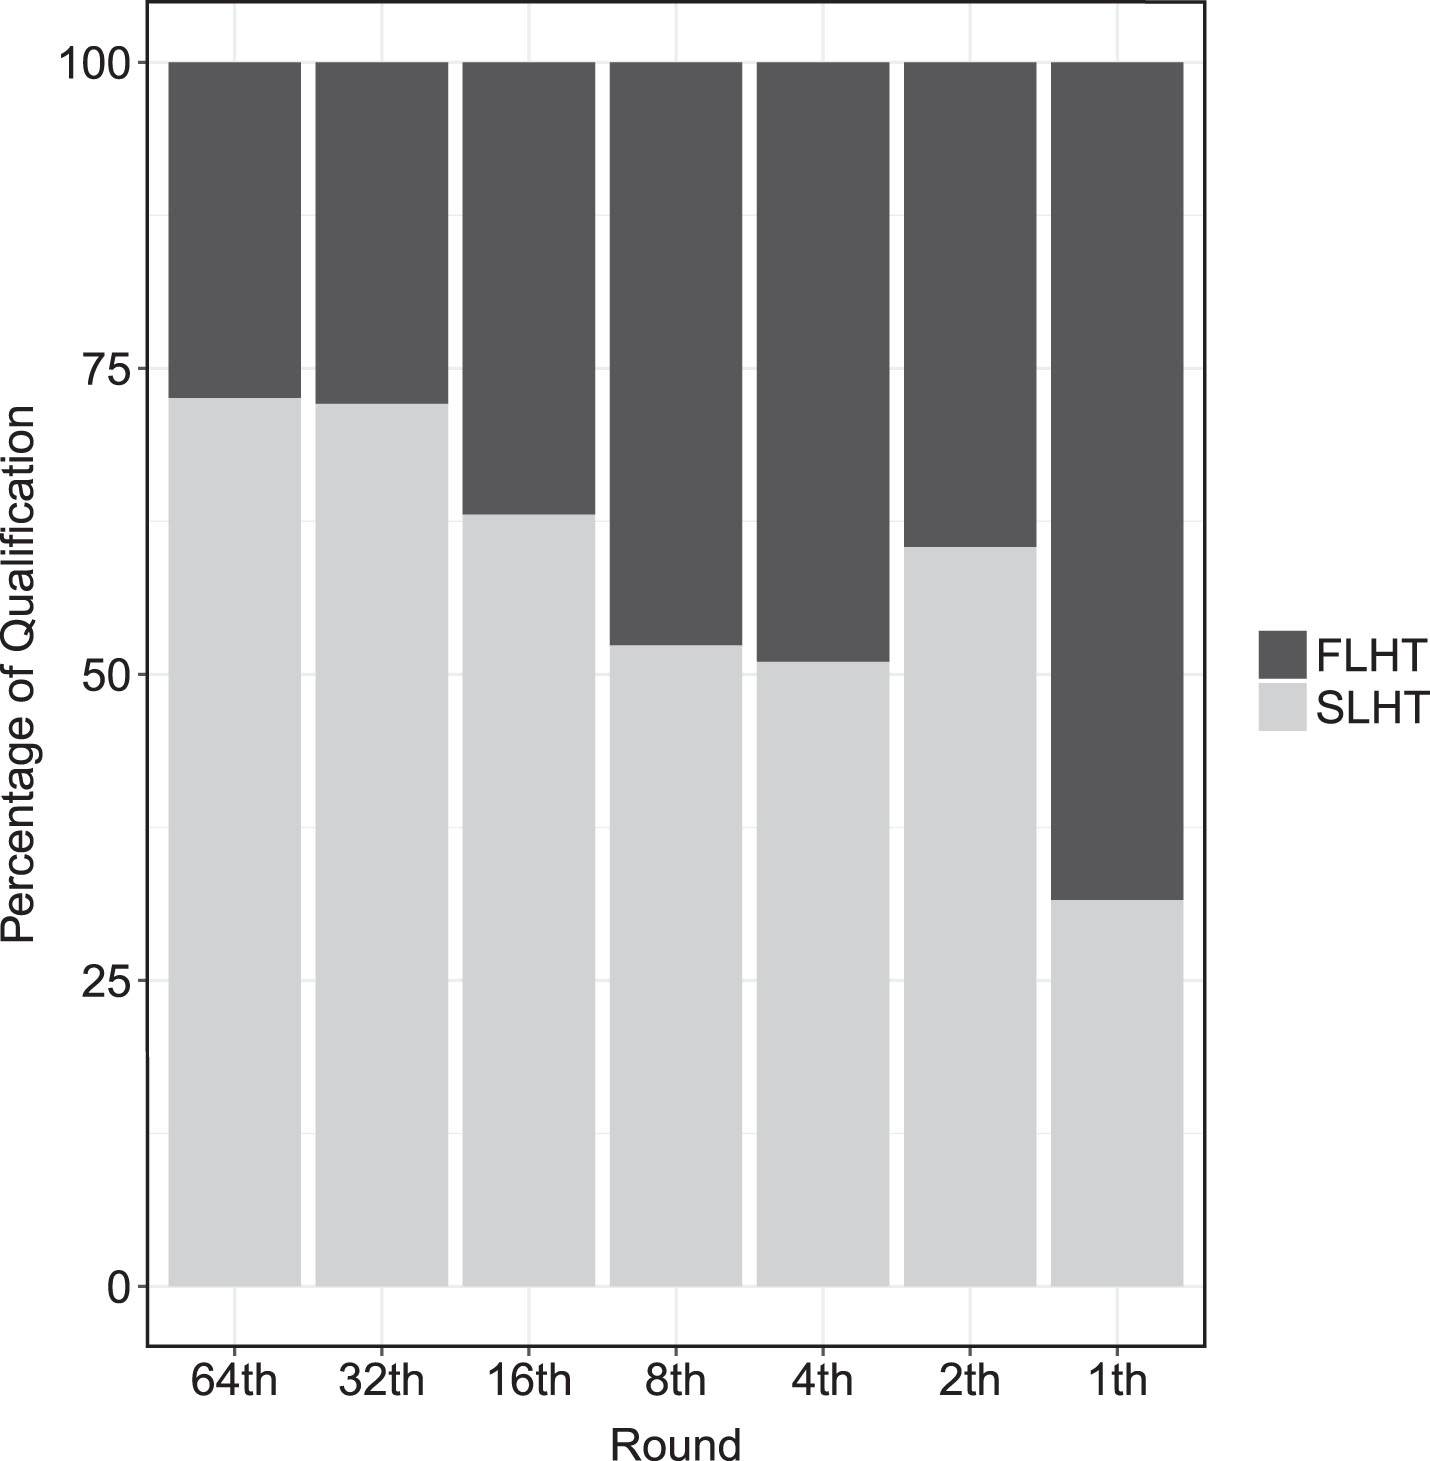
In the cup finals, the percentage of victory of the SLHT is 31.58%, much lower than in the other phases. It is the only one that shows an advantage for the FLHT, but it is important to note that this figure is calculated with only 19 observations.
4.1.1Tied play-offs
Considering our data, 388 play-offs were tied in points after the two games. Among them, 60.82%, with CI = 0.6082±0.0485, occurred in the final stages, significantly more than half (p-value <0.0001). Although the early rounds have more observations, there are more ties in the final stages, since the qualities of teams are more balanced. Table 2 shows the frequencies of qualification of the SLHT and also the frequencies of use of the criteria, comparing the whole championship with only the final rounds.
Table 2
Qualification and criterion use in play-offs that finished tied
| Tournament | Final Rounds | |||
| Qualification | Frequency | % | Frequency | % |
| SLHT | 209 | 53.87 | 126 | 53.39 |
| FLHT | 179 | 46.13 | 110 | 46.61 |
| Criterion | ||||
| GD | 196 | 50.52 | 117 | 49.58 |
| AGR | 113 | 29.12 | 73 | 30.93 |
| PN | 79 | 20.36 | 46 | 19.49 |
| Total | 388 | 100 | 236 | 100 |
It can be noticed that, considering only the confrontations of the final stages and in the championship as a whole, the percentages are maintained for each team qualified and for criterion. It is identified that the SLHT qualifies in about 53% of the play-offs. Considering the whole tournament or the final stages, there is no evidence that this value is significantly different from 50% (p-values 0.1279 and 0.2986), indicating that, in tied play-offs, there is no advantage for any of the two teams. In addition, the main criterion of tiebreaker is the goal difference, used in about half of the observations, followed by away goals rule and penalties.
Table 3 shows the percentage of qualification of SLHT and FLHT in each criterion of breaking the tie. It is observed that the SLHT has a significant advantage (p-value = 0.0006) only when the play-off is decided in the goal difference, whose confidence interval is 0.6224±0.0678. The use of the other criterion does not result in a significant advantage, however, they equate the probability of the two teams – p-values respectively 0.2214 and 0.5737 for away goals rule, which has CI = 0.5575±0.2066, and penalties, with CI = 0.5316±0.1743.
Table 3
Percentage of qualification by criterion
| Criterion | SLHT | FLHT |
| GD | 62.24 | 37.76 |
| AGR | 44.25 | 55.75 |
| PN | 46.84 | 53.16 |
Table 4 shows the percentages of qualification for SLHT and FLHT in each type of tie-breaking criterion, considering separately each tie possible combination of results (after both games of the play-off): loss of both teams playing at home (LL), both games end with a tie (TT) and victory of the teams playing at its stadium (WW).
Table 4
Percentage of qualification by criterion and by points
| Criterion | Qualification | LL | TT | WW |
| GD | SLHT | 23.08 | – | 65.03 |
| FLHT | 76.92 | – | 34.97 | |
| AGR | SLHT | 45.45 | 46.00 | 42.31 |
| FLHT | 54.55 | 54.00 | 57.69 | |
| PN | SLHT | 28.57 | 63.33 | 38.10 |
| FLHT | 71.43 | 36.67 | 61.90 |
4.1.2Qualification proportion
In order to ascertain – globally and in each of the four possible criteria for qualification – whether the probability of victory of the SLHT in play-offs of the Brazil Cup is equal to 0.5, that is, if the two teams have equal probabilities of qualification, we estimated the respective proportions and confidence intervals. The results are presented in Table 5.
Table 5
Estimates and Confident Intervals
| Estimate | Lower CI | Upper CI | |
| General | 0.6331 | 0.6045 | 0.6617 |
| PT | 0.6851 | 0.6507 | 0.7195 |
| GD | 0.6224 | 0.5540 | 0.6909 |
| AGR | 0.4425 | 0.3495 | 0.5355 |
| PN | 0.4684 | 0.3559 | 0.5808 |
Considering all the play-offs, the SLHT qualification ratio is 63.31%, significantly higher than 50%, CI = 0.6331±0.0286, indicating that it obtains the classification in more than half of the play-offs. This confirms the SLHT has an advantage. The same happens in the play-offs that were decided by points and goal difference, with estimates of 68.51%, CI = 0.6851±0.0344, and 62.24%, CI = 0.6224±0.0684, respectively. However, when considering observations that were decided by the away goals rule or penalty shoot-out, the proportions are 44.25% and 46.84%, respectively. Therefore, in these cases, there is no evidence that any team has a qualifying advantage: both confidence intervals include the value 0.5.
When the play-off ends tied and it is necessary to use away goals rule or penalties as the criterion of definition, the two teams have equal probabilities of qualifying. However, knowing that the decision was through points or goal difference, then it is more likely that the SLHT will win.
4.2Regression parameters
The estimated coefficients and their respective significance, obtained by the Wald’s test, after the estimation of the logistic model, are described in the Table 6. It is found that only the spread in ability is individually significant. However, the interactions of the ability spread with each type of classification are significant. Thus, there is evidence that the probability of victory of the SLHT, given each type of qualification, changes according to the ability spread between the teams of the play-off. Therefore, these results demonstrate that all the variables of the model are important to explain the probability of qualification of the SLHT in the Brazil Cup.
Table 6
Coefficients of the regression by Wald’s test
| Estimate | SD | z | p-value | |
| Intercept | 0.1362 | 0.1045 | 1.303 | 0.1926 |
| AB | 1.0985 | 0.1054 | 10.426 | <0.0001 |
| GD | 0.0343 | 0.2000 | 0.172 | 0.8637 |
| AGR | – 0.4168 | 0.2381 | – 1.751 | 0.0800 |
| PN | – 0.2649 | 0.2636 | – 1.005 | 0.3149 |
| AB*GD | – 0.4023 | 0.2032 | – 1.980 | 0.0477 |
| AB*AGR | – 0.9923 | 0.2347 | – 4.227 | <0.0001 |
| AB*PN | – 1.0935 | 0.2427 | – 4.506 | <0.0001 |
Although in the significance tests the classification types are not significant according to Table 6, we see in Table 7 that the model with these variables, even without the interactions, presents a gain with respect to the ROC curve considering the model that uses only the ability spread. In order to check this, two tests were done comparing the deviance’s of the models. For that, three models were adjusted: the first one is the complete one, previously described; in the second, all variables were maintained, but the interactions were withdrawn; the third model considers as co-variate only the ability spread.
Table 7
Areas under the ROC curve (AUC)
| Model | AUC |
| Complete (1) | 0.7426 |
| Without interactions (2) | 0.7339 |
| Only AB (3) | 0.7082 |
| Only type of qualification (4) | 0.5841 |
The result of this analysis is that the model 1 is significantly more informative than model 2, which is significantly more informative than model 3. Therefore, removing the interactions reduces the likelihood of the model, and removing the indicators causes it to decreases further. Therefore, the variable qualification type, when considered globally, is in fact significant to explain the probability of classification of the SLHT. The comparison between models 1 and 3 informs that, together, the type of qualification and the interaction with the ability spread significantly improves the explanation of the model.
In addition, in order to ascertain that ability spread is the most important variable for classification, we have done tests comparing the values of the areas under the ROC curve, the DeLong test. The values are described in Table 7. It is observed that for the first three models, which include the ability spread, the predictive capacity is above 70%. However, by removing this variable from the model, the predictive capacity has a large reduction, decreasing to 58.41%.
The results of the tests, which allow us to identify the significance of the decrease in predictive capacity of the model, are presented in Table 8. It is verified that the interactions, the type of qualification and the ability spread are important variables, since the withdrawal causes a significant decrease in the area below the curve. However, ability spread is the variable whose inclusion that results in greater predictive capacity increase, corroborating the hypothesis that this is the most important variable for the model.
Table 8
Tests of AUC
| Models | z | p-value |
| 1×2 | 1.8338 | 0.0667 |
| 2×3 | 3.4481 | 0.0006 |
| 2×4 | 8.4913 | <0.0001 |
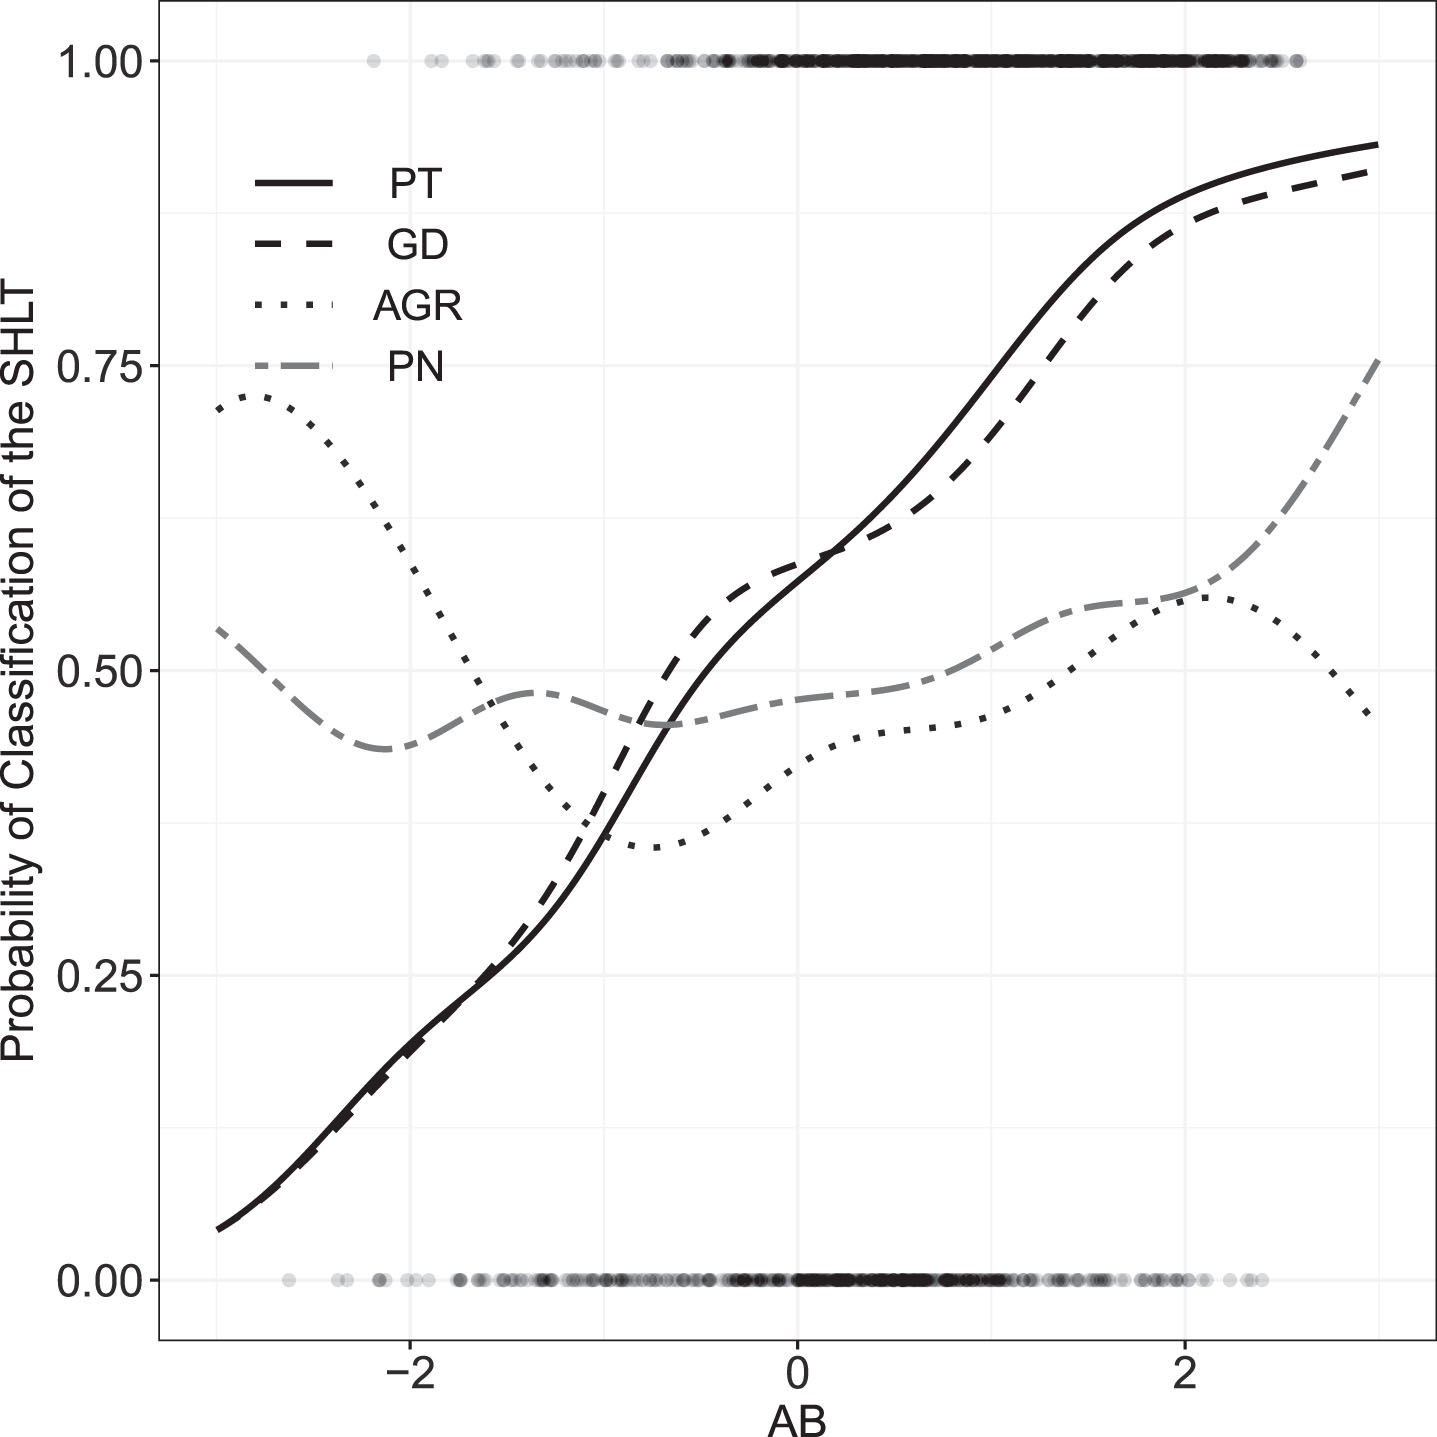
The estimated probabilities are represented in Fig. 3. Each point in the graph represents an observation: the cases where the SLHT qualified are arranged in row 1, whereas in the 0 line are those whose result was defeat of the SLHT. The horizontal position of each point represents the ability spread of the teams of this play-off, so the closer to 0 a value is, the greater the equivalence in the qualities of the teams.
Fig. 3
Estimated probability of classification of the SLHT.
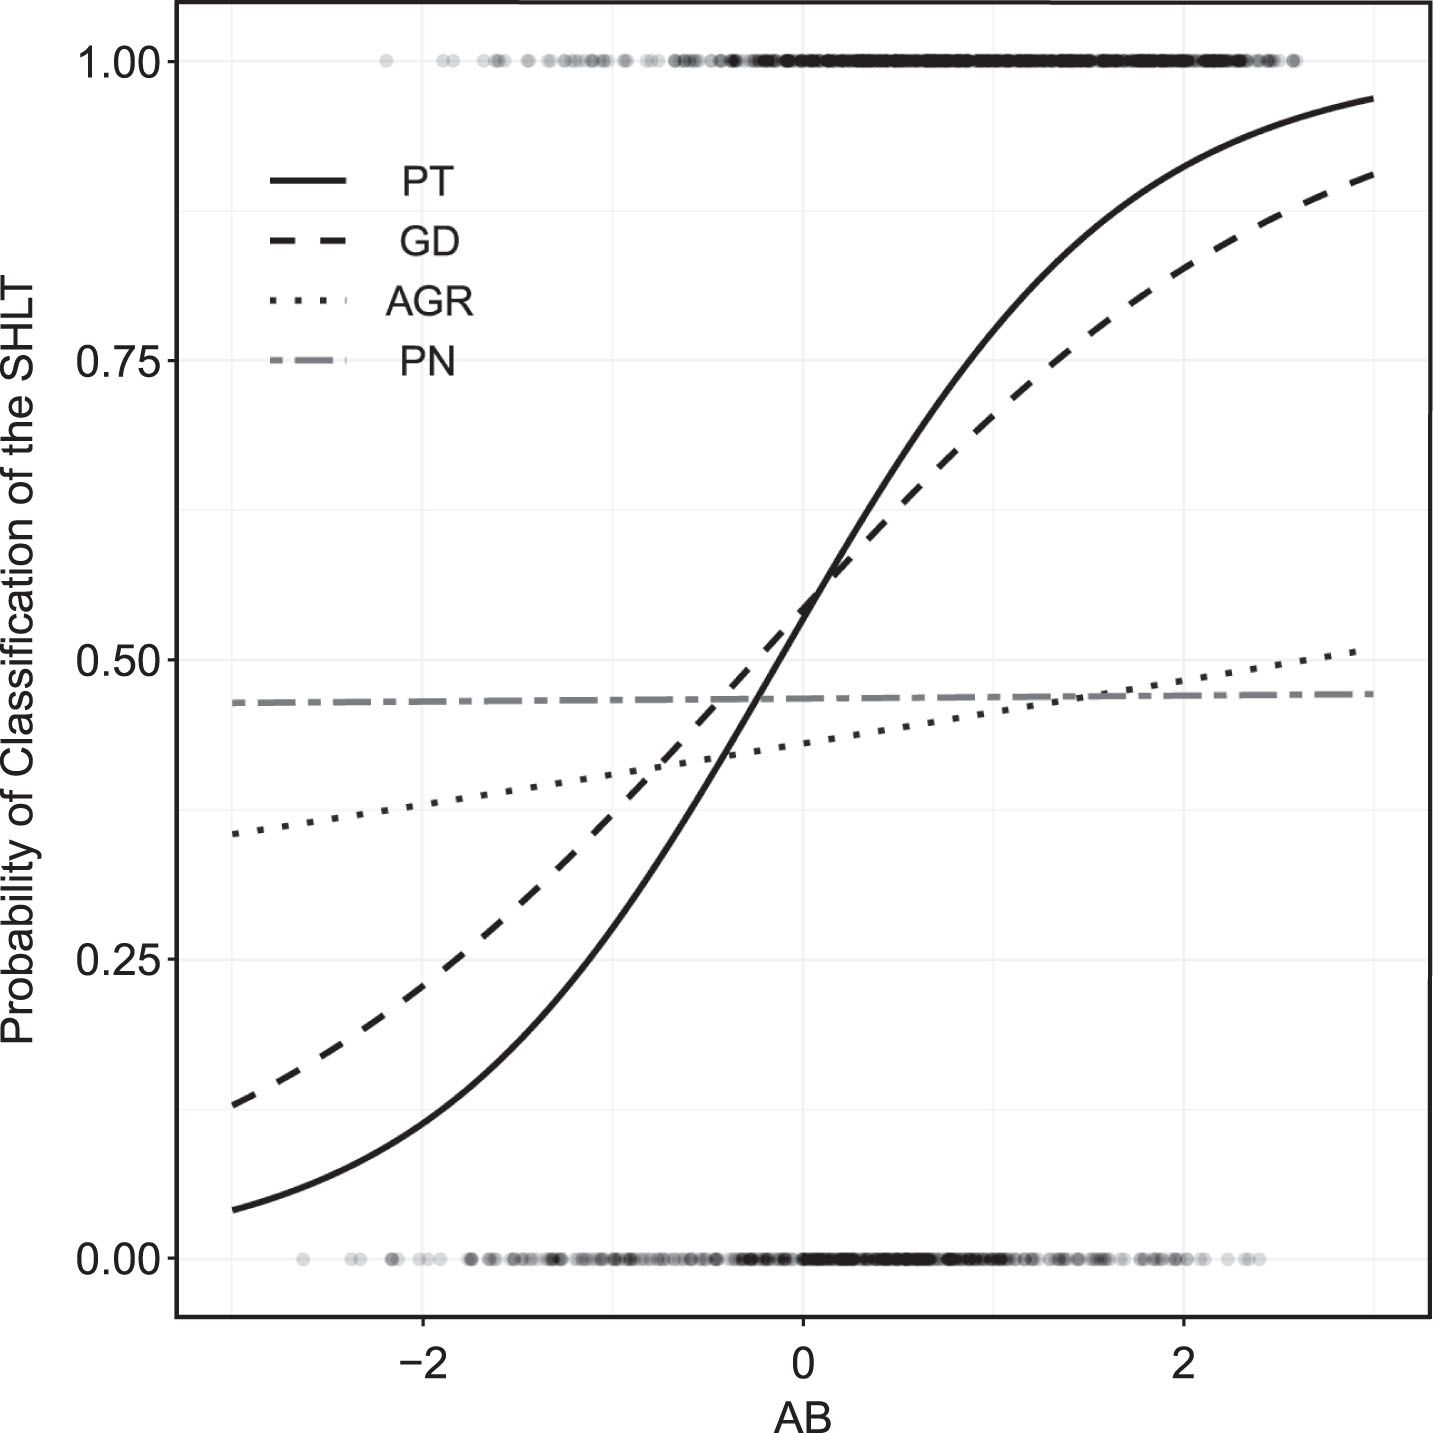
Analysing the probabilities as AB becomes more positive, that is, the more ability the SLHT has over the FLHT, it turns out that, for the SLHT, the criterion that leads to the highest probabilities of classification is the penalty shoot-out until the difference is – 0.43 standard deviation. Then the highest probability is for the goal difference, until the SLHT is 0.09 standard deviation the better. Above this value the most likely criterion is points.
For the FLHT, the highest probability happens when the decision is by points while this team is much better than the principal. When the difference is – 0.42 standard deviations, the best criterion for the FLHT is the away goals rule, this is maintained until the ability spread is 1.50 standard deviations, after that the penalty shoot-out becomes the criterion in which the qualification of the FLHT is more likely.
The away goals rule is never the best criterion for the SLHT because the probabilities are always lower. It should be noted that this does not mean that these teams can not use these criterion, only that there is always another one that provides a higher qualification probability. Although the teams do not choose the criterion used, at most it can set up a strategy that aims at a certain type of decision, but it does not depend only on the team.
To complement the analysis, the Fig. 4 presents a chart with four graphs, one for each curve exposed in the previous figure, estimated by the complete model. The curves were separated into four graphs only for easy visualisation. In each graph, the centreline represents the estimation of the pointed of probability, while the dotted lines represent the corresponding confidence intervals. According to Table 2, the goal difference was used in 196 play-offs, the away goals rule in 113 and the penalty shoot-out in 79, which influences the precision of the confidence intervals. The other 705 observations were decided by the points and therefore did not use any tie-breaker criterion.
Fig. 4
Estimated probability of classification of the SLHT and confidence intervals.
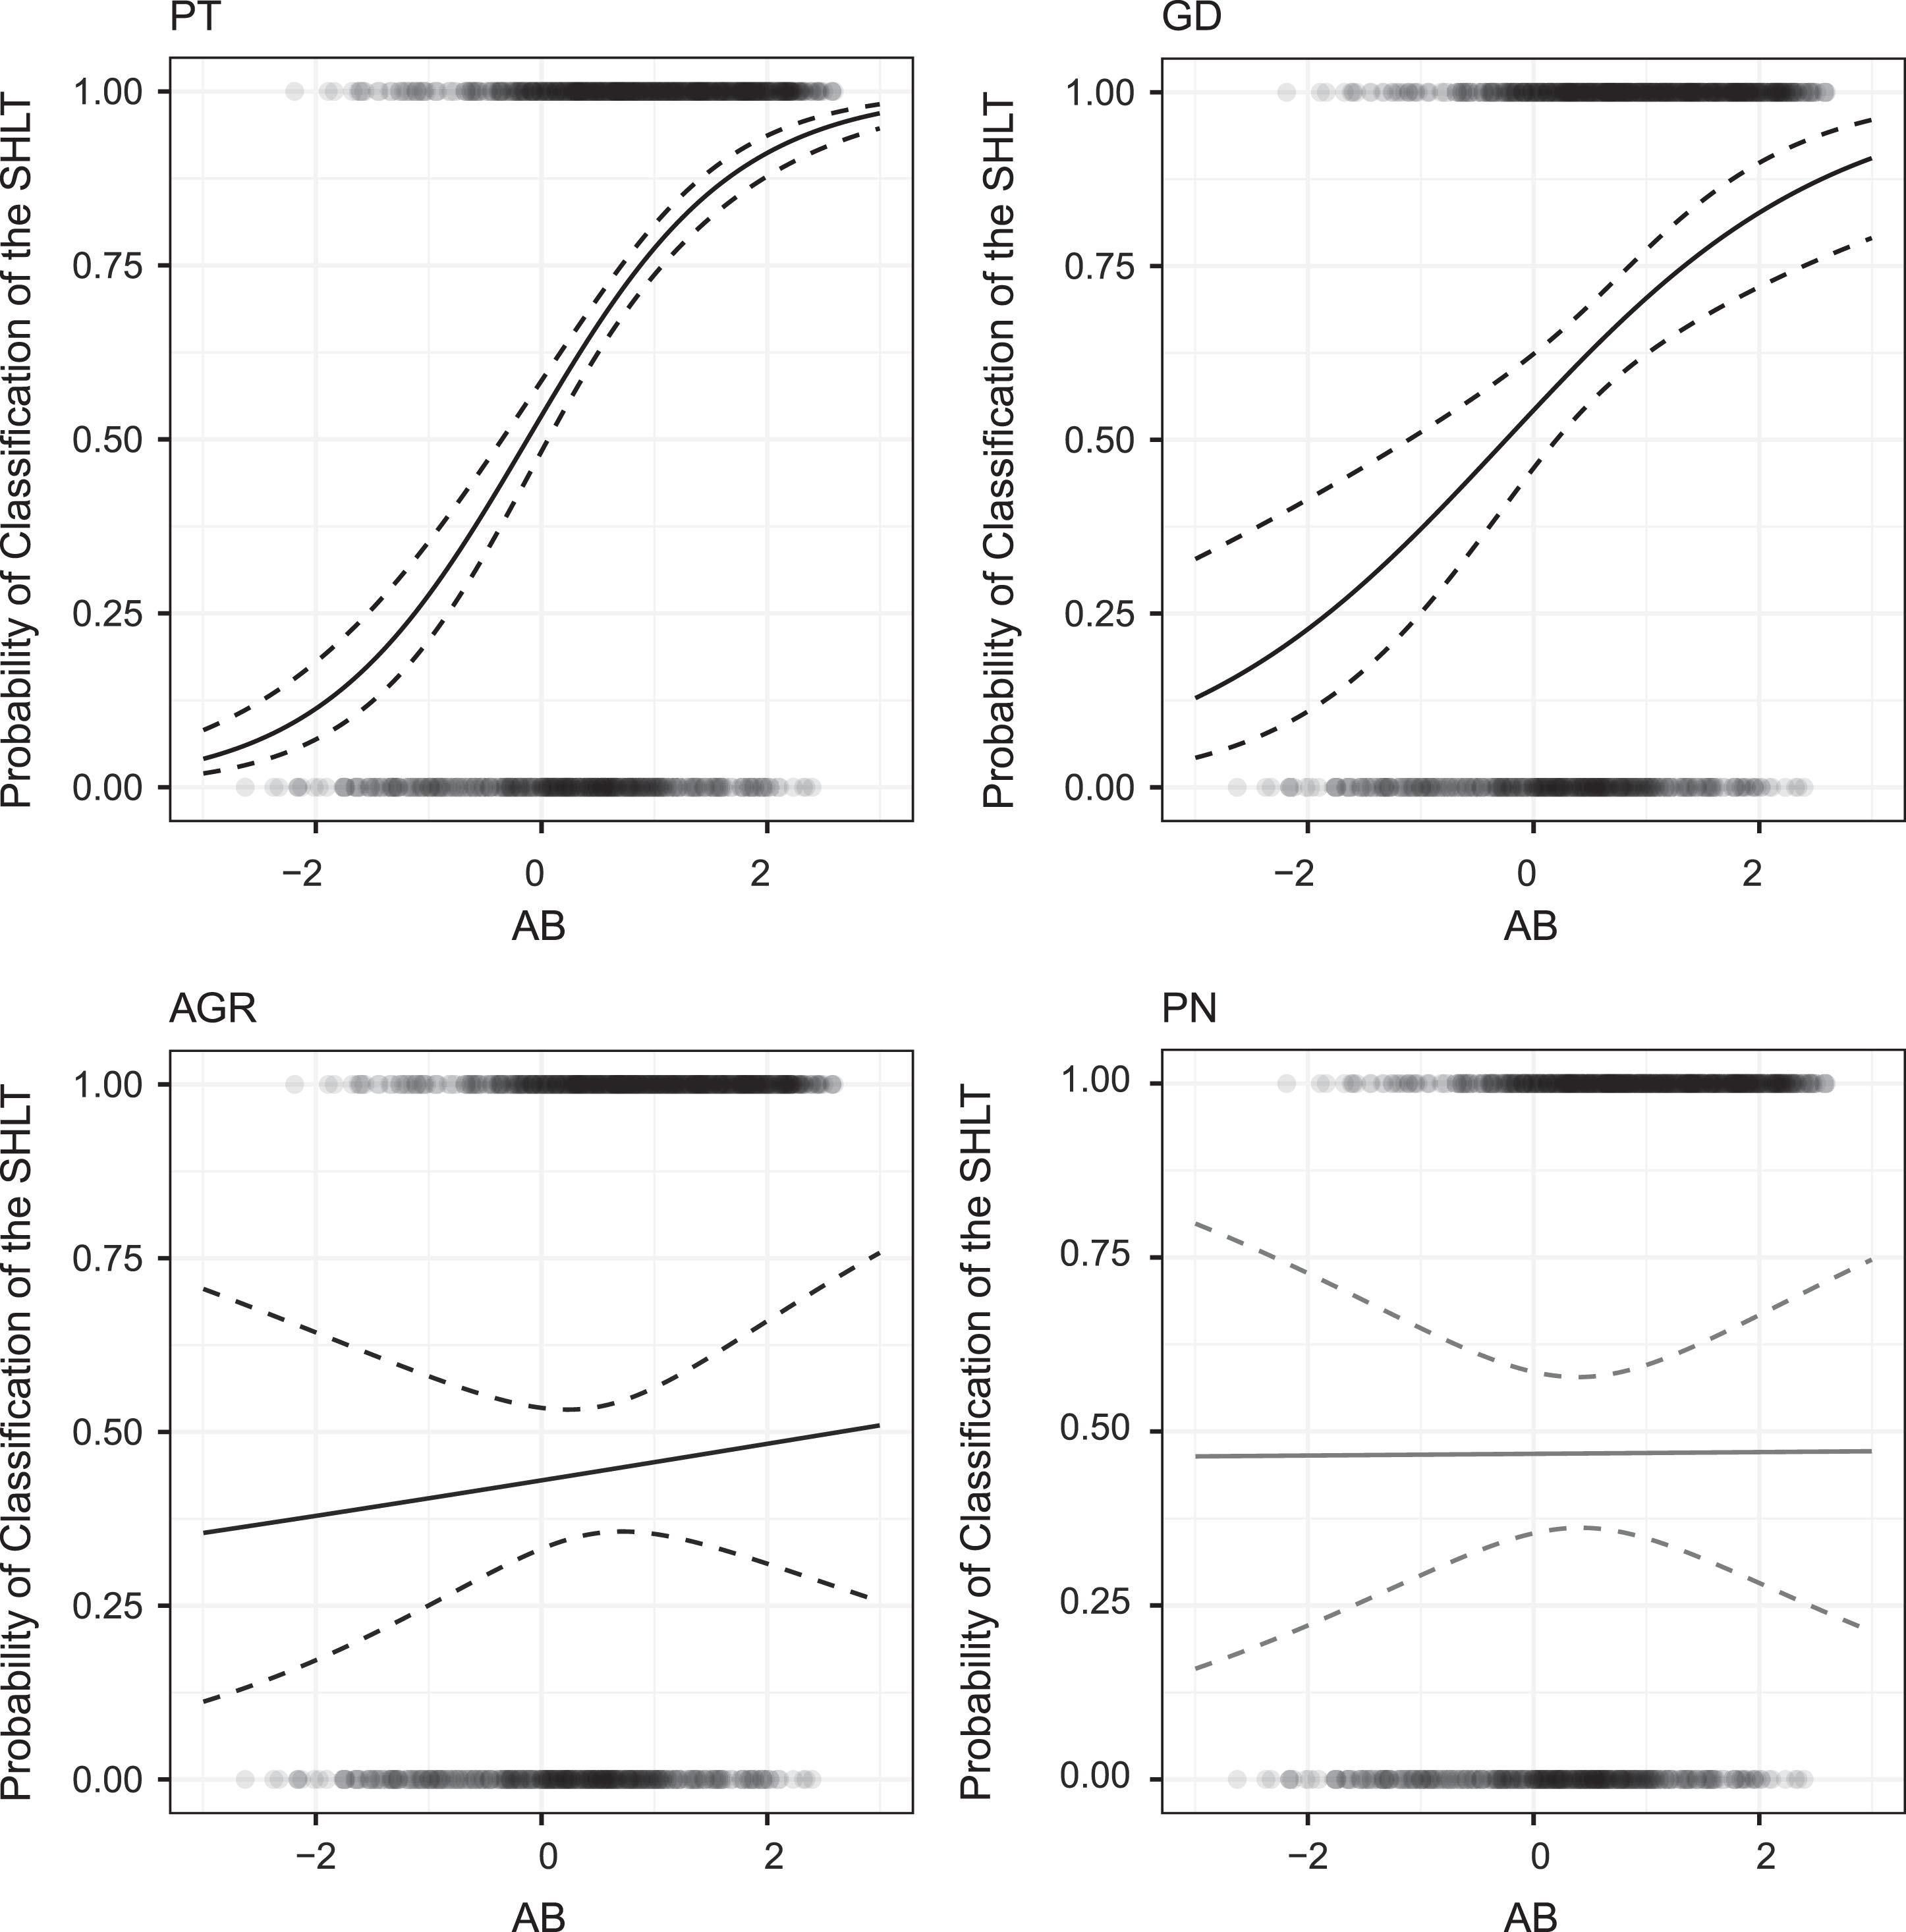
In the matches defined by away goals rule or penalty shootings, the estimates are less accurate because of the small number of observations. It can be noticed that the confidence intervals are wide for all ability spreads. However, for values of the ability spread close to 0, the confidence intervals have the smallest amplitudes. This is because most of the observations that used these criterion had small ability spreads, that is, when teams have similar qualities. Despite the large amplitude, these estimates bring relevant information. Since the range contains the value equal to 0.5, for all ability spreads, then for the two criteria, teams have the same qualification probabilities, regardless of the ability spread.
5Discussion
Throughout this work, we found evidence that, on the aggregate, there exists home advantage on play-offs of Brazil Cup: the SLHT qualifies in approximately 63% of disputes (significantly higher than 0.5, p-value <0.0001). This is in agreement with the literature that has proven a similar advantage for others play-offs championships. However, when the play-off is decided by away goals rule or penalties the percentage of classification is about 20% lower than the general percentage. These criteria significantly benefit the FLHT, if not giving the advantage, at least equating the probabilities of the two teams (p-values respectively 0.2229 and 0.5770).
The use of the away goals rule or penalties as a tiebreaker criterion decreases the probability of classification of the SLHT, considering the effects alone or interacting with the spread in ability between teams. On the other hand, the increase in the ability spread has the inverse effect, because the more positive the spread, the better the SLHT is, the more likely it is to be the winner of the match for all decision criteria.
When the two teams of the play-off have equal qualities, the probability of classification is equal to 0.5 for both teams, regardless of how the play-off was decided. That is, regardless of the criterion used, the two participants have the same classification probabilities when their qualities are equivalent as described in Section 4.2.
A factor that can be considered in a future study is the distance travelled by the teams to play the games. Other works, such as (Pollard 2006) and (Pollard, Da Silva, and Nísio 2008), have concluded that this is a variable related to the advantage of playing a single game in their domain. According to the discussion in Section 1, in the Brazil Cup this effect, on one match, may be even greater, due to the inclusion of teams from all regions, resulting in great distances and climatic variation. However, this effect is counterbalanced by the fact that, in this tournament, the matches are played in two games, so both teams must travel the same distance and face similar climatic variation.
In agreement with others tournaments, the team that plays the second game at home also has an advantage in the Brazil Cup. Moreover, the away goals rule minimizes this advantage and thus makes the play-off more unpredictable and exciting for the fans. The rule is important as a criterion that equals the probably of the classification of the teams in the play-off.
Appendices
Appendix A. Others models
A.1. Non-parametric model
Fig. A1
Estimated probability of classification of the SLHT and confidence intervals.
A.2. Mixed model
Table A1
Coefficients of the mixed regression by Wald’s test
| Estimate | SD | z | p-value | |
| Intercept | 0.1342 | 0.1097 | 1.223 | 0.2213 |
| AB | 1.1043 | 0.1063 | 10.392 | <0.0001 |
| GD | 0.0276 | 0.2012 | 0.137 | 0.8910 |
| AGR | – 0.4236 | 0.2394 | –1.770 | 0.0767 |
| PN | – 0.2536 | 0.2654 | –0.955 | 0.3394 |
| AB*GD | – 0.4052 | 0.2039 | –1.987 | 0.0469 |
| AB*AGR | – 1.0009 | 0.2363 | –4.235 | <0.0001 |
| AB*PN | – 1.1196 | 0.2479 | –4.517 | <0.0001 |
Table A2
Models comparison
| Mixed model | Logistic regression | |
| AIC | 1255.32 | 1253.67 |
| BIC | 1300.29 | 1293.64 |
| LogLikelihood | – 618.66 | – 618.83 |
| Deviance | 1237.3 | 1237.67 |
| DF | 1084 | 1085 |
Appendix B. 2018 Brazil Cup
As an illustration we apply our model to forecast the outcome of 30 confrontations occurring in the 2018 Brazil Cup. The model that considers as a regressor the ability spread alone correctly predicts which team qualifies 70% of the time, a value that is close to the predictive capacity estimated by the area under the ROC curve. We have considered as a correct prediction those confrontations in which the winning team had an estimated probability of qualifying higher than 0.5.
On the other hand, the model that also takes into account the types of decision correctly predicts the outcome 63% of the time. In practice this 7% difference correspond to only 2 matches and is possibly explained by the small number of predictions, as it is very likely that the complete model has a higher predictive ability.
In the 2018 Brazil Cup, the away goal rule is no longer valid. Interestingly, if it were valid, 4 of the 6 confrontations that were decided by penalty shoot-outs would have been defined by the away goal rule. The predicted outcome was the same in both criteria, but in 2 confrontations the qualified team would be the other one, the FLHT in both cases. In the other 2 confrontations the team that won the penalty shoot-outs would have won by the away goal rule, one was the SLHT e the other was the FLHT.
References
1 | Almeida,L.G. de , Lopes de Oliveira,M. and Diniz da Silva,C. , (2011) , Uma análise Da Vantagem de Jogar Em Casa Nas Duas Principais Divisões Do Futebol Profissional Brasileiro, Revista Brasileira de Educação Fısica E Esporte, 25: (1), 49–54. |
2 | Barbosa,C. and Brandão,T. , (2017) , Regressão Não Paramétrica. http://www.leg.ufpr.br/lib/exe/fetch.php/disciplinas:ppgea2012:regressaonaoparametrica.pdf. |
3 | CBF. 2014, Convenção de Pontos Do Ranking Nacional de Clubes. https://cdn.cbf.com.br/content/201612/20161212191347 0.pdf. |
4 | Hayfield,T. and Racine,J.S. , (2008) , Nonparametric Econometrics: The Np Package, Journal of Statistical Software 27: (5), (2008) . |
5 | Page,L. and Page,K. , (2007) , The Second Leg Home Advantage: Evidence from European Football Cup Competitions, Journal of Sports Sciences 25: (14), 1547–1556. |
6 | Pollard,R. , (1986) , Home Advantage in Soccer: A Retrospective Analysis, Journal of Sports Sciences 4: (3), 237–248. |
7 | Pollard,R. , (2006) , Worldwide Regional Variations in Home Advantage in Association Football, Journal of Sports Sciences 24: (3), 231–240. |
8 | Pollard,R. , (2008) , Home Advantage in Football: A Current Review of an Unsolved Puzzle, The Open Sports Sciences Journal 1: (1), 12–14. |
9 | Pollard,R. , Da Silva,C.D. and Nısio,C.M , (2008) , Home Advantage in Football in Brazil: Differences Between Teams and the Effects of Distance Traveled, The Brazilian Journal of Soccer Science 1: (1), 3–10. |
10 | Sánchez,P.A. , Garcıa-Calvo,T. , Leo,F.M. , Pollard,R. and Gómez,M.A. , (2009) , An Analysis of Home Advantage in the Top Two Spanish Professional Football Leagues, Perceptual and Motor Skills 108: (3), 789–797. |
11 | Seckin,A. and Pollard,R. , (2008) , Home Advantage in Turkish Professional Soccer, Perceptual and Motor Skills 107: (1), 51–54. |
Notes
1 The years from 1989 to 1993 were not used because it was not possible to determine adequately the ability of the teams, which will be discussed below.
2 Some confrontations are in more than one situation, for example a confrontation that were from a qualifying round and had just one game.
3 Defined as the difference between the abilities of SLHT and FLHT. See the discussion below.
4 The sample mean of the ability spread is equal to 0.65, a positive value, indicating that there is a slight imbalance in the sense that better teams tend to have the field command. This fact is an indication that, at least in a part of the confrontations that compose our sample, there is no randomisation in the assignment of field command.
5 See the online supplementary material for examples of matches with nearly this value of ability spread.
6 For most of the confrontations in our sample, the FLHT was decided randomly; however, we couldn’t obtain the information of how it was decided in the years from 1994 to 2002.


