
Flow motifs in soccer: What can passing behavior tell us?
Abstract
Passing is an important and crucial aspect of winning a soccer match. It plays a big role in important decisions made by managers and owners when buying/selling players, picking offensive/defensive strategies and defining a style of play. In this article we show how to support these decisions by analyzing the unique passing behaviors (motifs) of players and teams from the patterns in their passing-possession data. We analyze individual players as well as teams based on the diversity and frequency of their involvement in different motifs. We gather passing and possession data from 4 seasons (2012–15) of 6 big European leagues with 8219 matches, 3532 unique players and 155 unique teams and apply the network motif concept to study the patterns. By introducing an expected goals model we build on the motif concept to measure the effectiveness of styles of play. We also make use of a novel way to represent the motif data (the radar graph) to make comparisons between players and teams across multiple seasons. We show how this analysis can support scouting for players and managers, identifying unique players/teams, finding relationships between position and style and in finding a suitable replacement for La Computadora.
1Introduction
In today’s world we see an increasing trend in the availability of data. This is particularly true for sports, and football is no exception. Firms such as OptaSports gather all sorts of data on matches played all over the planet. Gone are the old days of searching for statistics in the Sunday newspaper. Now a quick search on FourFourTwo.com or Squawka.com can provide you with in-depth information on any player – ranging from minutes played on the field to passes made, conversion rates, percentage of total possession held, fouls committed, and goals attempted and scored. Managers and fans have been using this data for many years to make strategies and comparisons between players. However, we are now also able to extract a second by second description of play from these websites. This opens doors to extract a lot of hidden information on player and team behaviour by devising new metrics and studying the data using models from network theory. We use the network motif concept shown in Milo et al. (2002) to study patterns in the data and illustrate its use in sports analytics.
There are two approaches to studying passing behaviour and team style. One is a static approach where analysis is done on aggregated data, while the other approach involves real time tracking of both players and the ball during play. Both approaches have their advantages and challenges and are more, or less, suitable for a specific sport. Spatio-temporal analysis has been studied extensively for the NBA. We refer the reader to the works of Goldsberry (2012), Shortridge et al. (2014). In Bialkowski et al. (2014) the authors apply this methodology for soccer and demonstrate how to accurately detect and visualize formations, as well as analyze individual player behavior. Earlier, Grunz et al. (2012) introduced a hierarchical architecture consisting of artificial neural networks capable of classifying different patterns and variations in those tactical patterns in soccer matches and Clemente et al. (2013) used the spatio-temporal data of a U13-soccer match to measure the tactical responses of two opposing teams both with and without possession of the ball.
Our focus is on the static analysis, where the players are not tracked unless they are involved in a ball event. The ball is also not tracked per se, but its position can be interpolated with the available data. A few articles have investigated this passing-possession network that the data allows us to construct. In Gyarmati and Hefeeda (2015), the authors estimate the maximal speed of soccer players by knowing their position on the field between two ball events (such as receiving a pass and then making a pass). In Clemente et al. (2015a,b) the authors create an adjacency matrix with the passes made between the players. They study network metrics like centrality to characterize the team, importance of players such as midfielders and study the style differences between two halves of the game. In Pena and Touchette (2012) they analyze the motifs for passing behavior of countries in the 2010 FIFA World Cup. In Pena (2014), they use the possession data and show that a finite state Markov process is very accurate in approximating the distribution of passing sequences and chances of taking shots for English Premier League teams for the 2012/13 season. To study team passing behaviour, Gyarmati et al. (2014) use the motif analysis from Milo et al. (2002) to obtain passing styles during the 2012/13 season for a few European leagues and find that FC Barcelona’s tiki taka style is unique. A similar work by Pena and Navarro (2015) analyzes individual players on their styles in the English Premier League and the Spanish La Liga and show that Xavi has a unique style.
In this research we will utilize the idea of flow motifs to find unique styles in both regular passing and the final attacking passes prior to a goal attempt of both teams and players. This is done by differentiating between possession and goal attempt flow motifs. Subsequently, these results are combined with multiple other techniques such as a coordinate based expected goals models adapted from Macdonald (2012), and clustering techniques such as the mean shift algorithm from Comaniciu and Meer (2002) and the Euclidean distance. We analyze different events in six of the biggest European soccer leagues and illustrate that their implementation yields useful insight that might help teams and managers in buying or selling players, analyzing opponents or defining styles of play. We also analyze the departure of Frank de Boer from Ajax to Inter Milan, the difference in flow motifs used between home and away games, who Jean Seri is and why he must be an elite midfielder and the difference in attacking style between Lionel Messi and Cristiano Ronaldo. We try to answer the question posed by Lopez Peña “Who can replace Xavi?” Pena and Navarro (2015) and ultimately we show that with the use of flow motifs it is possible to identify potential replacement players and managers.
2Data and methodology
2.1Data
The data used was obtained from www.squawka.com using a python web-crawler. It covers four seasons (2012/2013 to 2015/2016), six different leagues (Dutch Eredivisie, English Premier League, Spanish Primera Division, Italian Serie A, French Ligue 1 and German Bundesliga) and 8219 matches. This ultimately yields a vast data set containing 7412 players (of which 3532 are unique players) and 466 teams (of which 155 are unique) and their total time played per season. No data was available for the Eredivisie in ’12/13.
The data set consists of chronological vectors with the parameters: league, season, play type (pass, goal attempt, cross, tackle, clearance or interception), result of the play type (failed, completed, foul), team name, player name, total seconds expired since the start of the match, and the coordinates at which the play occurred on a (0,100) by (0,100) two-dimensional plain.
Due to time stamp structuring in the 2012/13 and 2013/14 season data points recorded during injury time show up as either 45:00 or 90:00 thus making it impossible to arrange them chronologically. Therefore these data points, 1.5% and 5% of first half and second half data respectively, have been removed for these two seasons. Furthermore, failed tackles have been removed from the data set since they have no apparent influence on the flow of the game.
In order to reduce outliers when comparing individual players, those who played less than 900 minutes (the equivalent of approximately 10 matches) in a given season were omitted. While analyzing team motifs, no data treatment is made, all players are considered irrespective of how much time they played in the season.
2.2Flow motifs
Flow motifs, as shown in Milo et al. (2002), are building blocks of the passing behaviour of teams. We differentiate between two flow motif types for both players (P) and teams (T):
1 Possession Motifs (PMs): a sequence of at least 3 passes a team/player creates that does not lead to a goal attempt.
2 Expected Goal Motifs (xGMs): a sequence of at least one pass that leads to a goal scoring opportunity with a certain expectation of being converted.
We consider up to 3 passes as part of a motif as long as they were made within 5 seconds individually. Any transition with an interval time greater than this upper bound is not considered to be a part of any motif. Furthermore, a passing sequence is terminated when a game ends at either half, a foul is committed, the ball goes out of play, or when an opposing team’s player disrupts the flow by tackling, intercepting, passing or clearing away the ball. Sensitivity analysis on the choice of using a 5 second interval is shown in Section 6. Using 3 passes in the motif is easier to visualize and analyze. Including a 4th pass is also possible, but this creates 48 more combinations for players making the problem too large.
The difference between the two motif types is illustrated in Figs. 1 and 2. For the expected goal motifs, the goal attempt is the definitive end point, the start is up to 3 passes before the attempt. In Fig. 1 we show the ABACG motif. The motif would have been counted as BACG if the first pass was longer than 5 seconds. The possession motifs are obtained by looking at passes during the whole game. Here we consider 3 passes to make a motif. From Fig. 2, we can see the ABAB, BABC and ABCD motifs occur in the pass sequence.
Fig.1
The ABACG Expected Goal Motif.
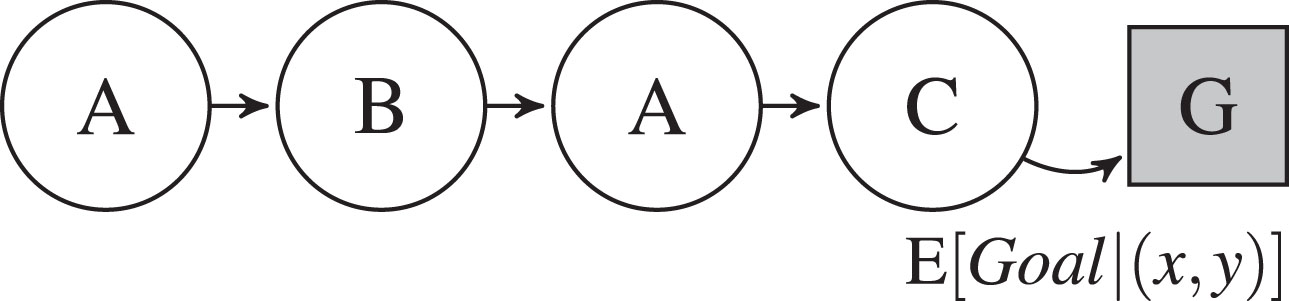
Fig.2
The ABAB, BABC and ABCD Possession Motifs.

When looking at either Possession Motifs (PM) or Expected Goal Motifs (xGM), A is the player under consideration while B, C and D are other players on the same team that are involved in the motif. In Expected Goal Motifs (xGMs), a goal attempt (with a given expected value) is denoted by G.
2.3Expected goals
Each xGM is valued by means of an expected goal (xG) model solely based of the coordinates of the final attempt. Based on the coordinates of where the goal shot was made from, we divide our set of 204984 goal attempts in to a grid of 12 by 20 tiles (creating tiles of approximately 5.3 by 5.7 meters given a median pitch of 105 by 68 meters, (UEFA, 2016)). Then we establish the expected value of a passing sequence by weighing each motif by the percentage of converted goal opportunities from within that tile.
2.4Radar graph
To be able to compare players or teams visually, we devised a novel way of representing their involvement in motifs, i.e. their style, by means of a radar graph. Players and teams’ involvement in a particular motif is compared against the maximum value for that motif from the whole data set. This makes it possible to compare players and teams across different seasons and leagues. This maximum value can also be specific to the season and league, however for the purpose of this article, we have used the maximum value from the entire data set.
Fig.3
Dybala’s (A) Expected Goal Motifs in ’15/16.
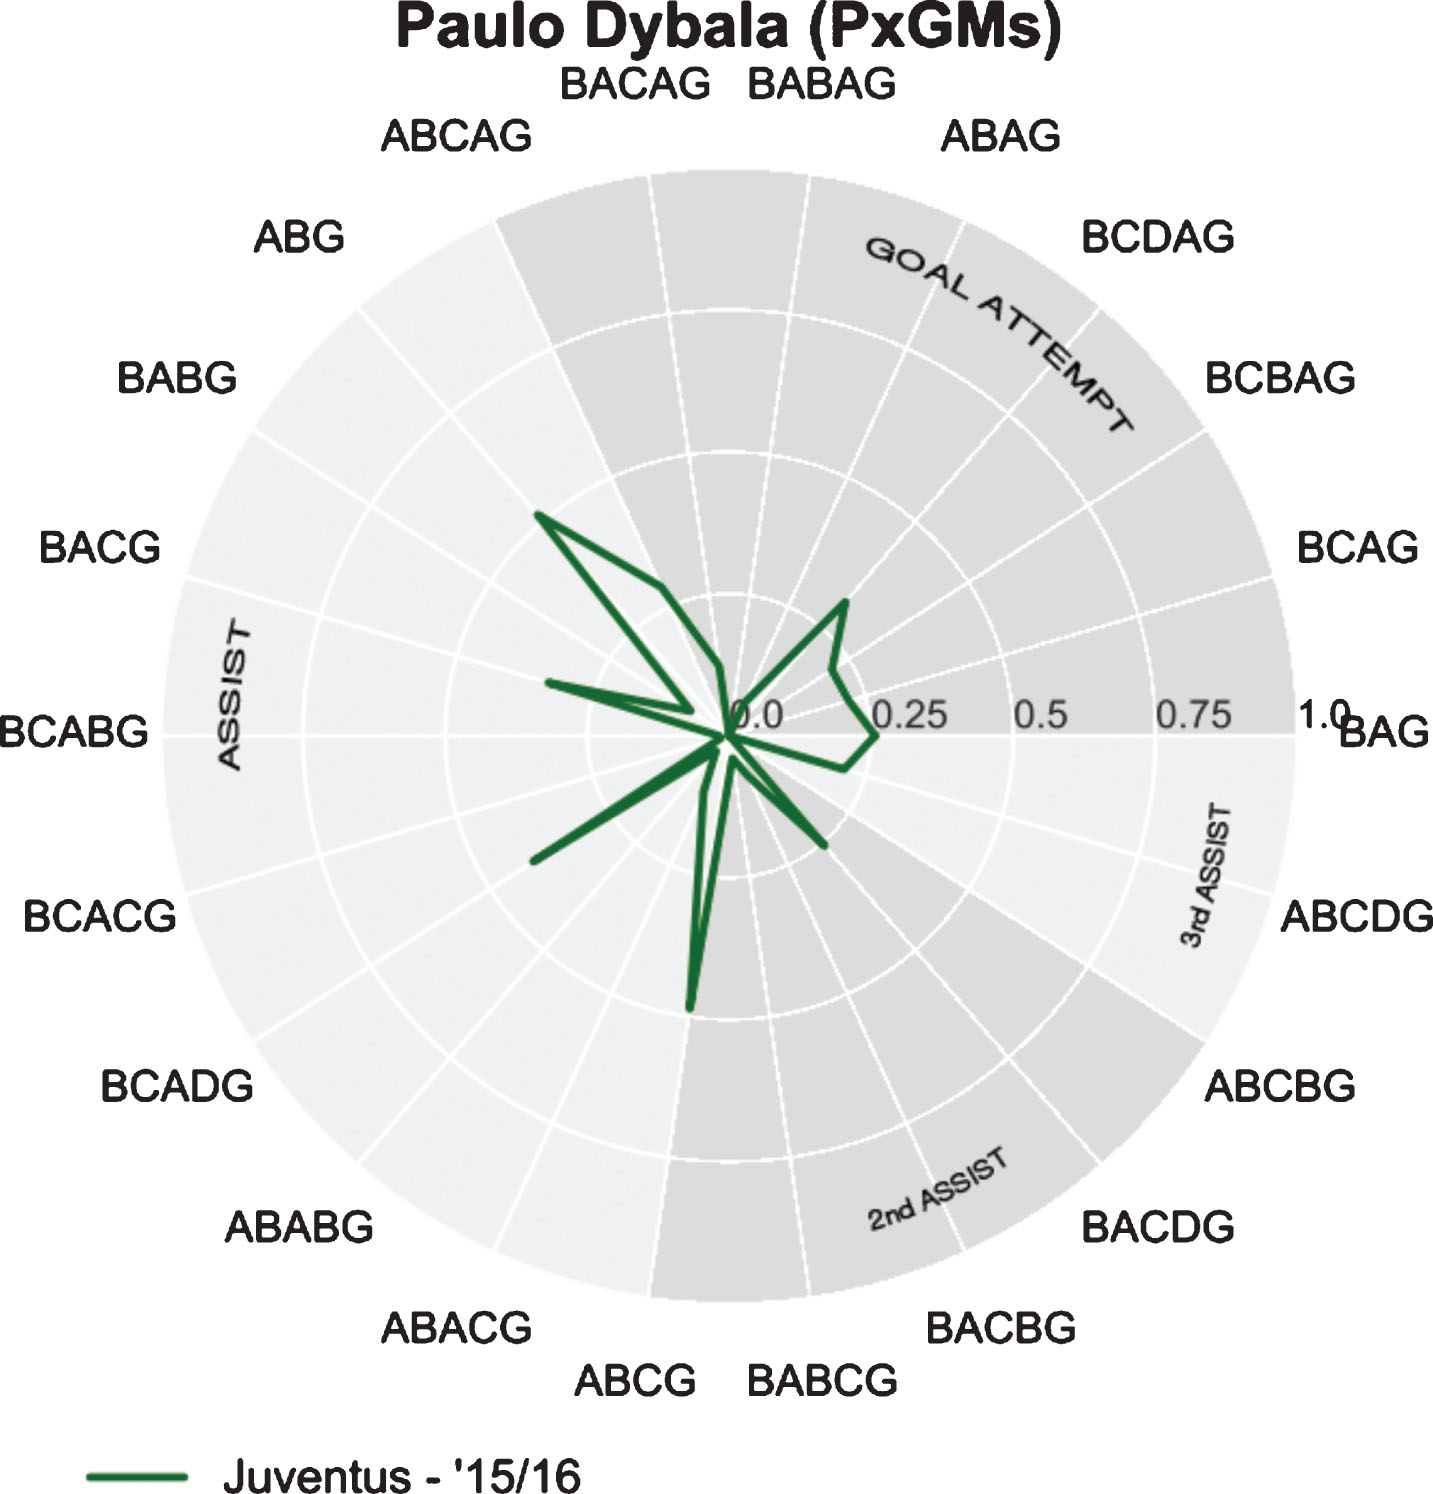
An example of a radar graph is shown in Fig. 3. Each radius shown in the figure represents a motif. The extent of a players’ or teams’ use of this motif is a percentage of the maximum value from the data set. In this specific figure we show Paulo Dybala’s expected goal motif performance in the ’15/16 season at Juventus. The figure is constructed as follows: in the top right quadrant we indicate all motifs ending with -AG indicating that Dybala was the final shot taker. Continuing counterclockwise, we have three motifs (ABAG, BABAG, and BACAG) that indicate a one-two combination with Dybala as the main protagonist. As we keep going counterclockwise, we have the assist motifs (-AXG) where Paulo Dybala was not the final shot taker, but played an assisting role. Again we can identify the one-two combinations BABG, BCACG, ABABG, and ABACG. In the latter two Dybala is the person with two touches in the motif. After the assist motifs the second assist motifs are shown (-AXYG), followed by the third assist motifs (ABCBG, and ABCDG). As it is seen in the graph, Dybala uses the ABG motif just more than half as many times as the player with the maximum use of that motif. We can see at a glance that Dybala was hardly involved in motifs with one-two combinations when creating goal attempts, but is well rounded in the use of most other motifs.
2.5Clustering
To find unique players or teams we make use of the unsupervised machine learning algorithm mean shift. This hierarchical clustering method is a centroid based algorithm which works by updating candidates for centroids to be the mean of the points within a certain radius (bandwidth) around the centroid, see Fukunaga and Hostetler (1975). Every data point (vj) is considered a centroid, until the mean of the data points within the bandwidth is stationary. The k-means clustering algorithm does not automatically compute the optimal number of clusters given a certain bandwidth, and is biased towards equally sized clusters (making unique playing styles less apparent) given it’s adherence to Euclidean distances, see Georgescu et al. (2003). However, we do use the Euclidean distance to find the k-nearest neighbours with the most similar motif tendencies to a given node within our vast data set.
3Team motifs
In Table 1 we identify 5 different team passing motifs (TPM) and 8 different team expected goal motifs (TxGM). Team motifs are obtained from the sum of the motifs per 90 minutes of all players that belong to this team during a given season. Since substitutes are an integral part of a team, players who played less than 900 minutes will not be excluded from this analysis.
Table 1
All possible motifs by category
| Passes | TxGMs | TPMs |
| 1 | ABG | |
| 2 | ABAG, ABCG | |
| 3 | ABCDG, ABABG, ABACG | ABCD, ABAB, ABAC |
| ABCAG, ABCBG | ACBA, ABCB |
3.1Uniqueness in passing (TPM)
To search for unique teams, we analyze their style by looking at how they use the five different motifs by employing a simple scatter plot. One of these five plots is shown in Fig. 4. It represents the plot for the ABAC motif for all teams showing their intensity of use (per match) versus the popularity of use within the team (the percentage of time it is used). We find that some teams are consistent outliers in all five plots at either end of the spectrum, implying the presence of unique styles. To find these unique team motif tendencies, we can cluster the teams together with the mean shift clustering algorithm using the vector of motif intensities per team as input to form these clusters. In Table 2 the results of the mean shift clustering are shown, indicating four unique clusters.
Fig.4
Use of possession motif ABAC as a percentage of all motifs used by a team, against number of times it is used per 90 minutes. This figure includes 155 unique teams.
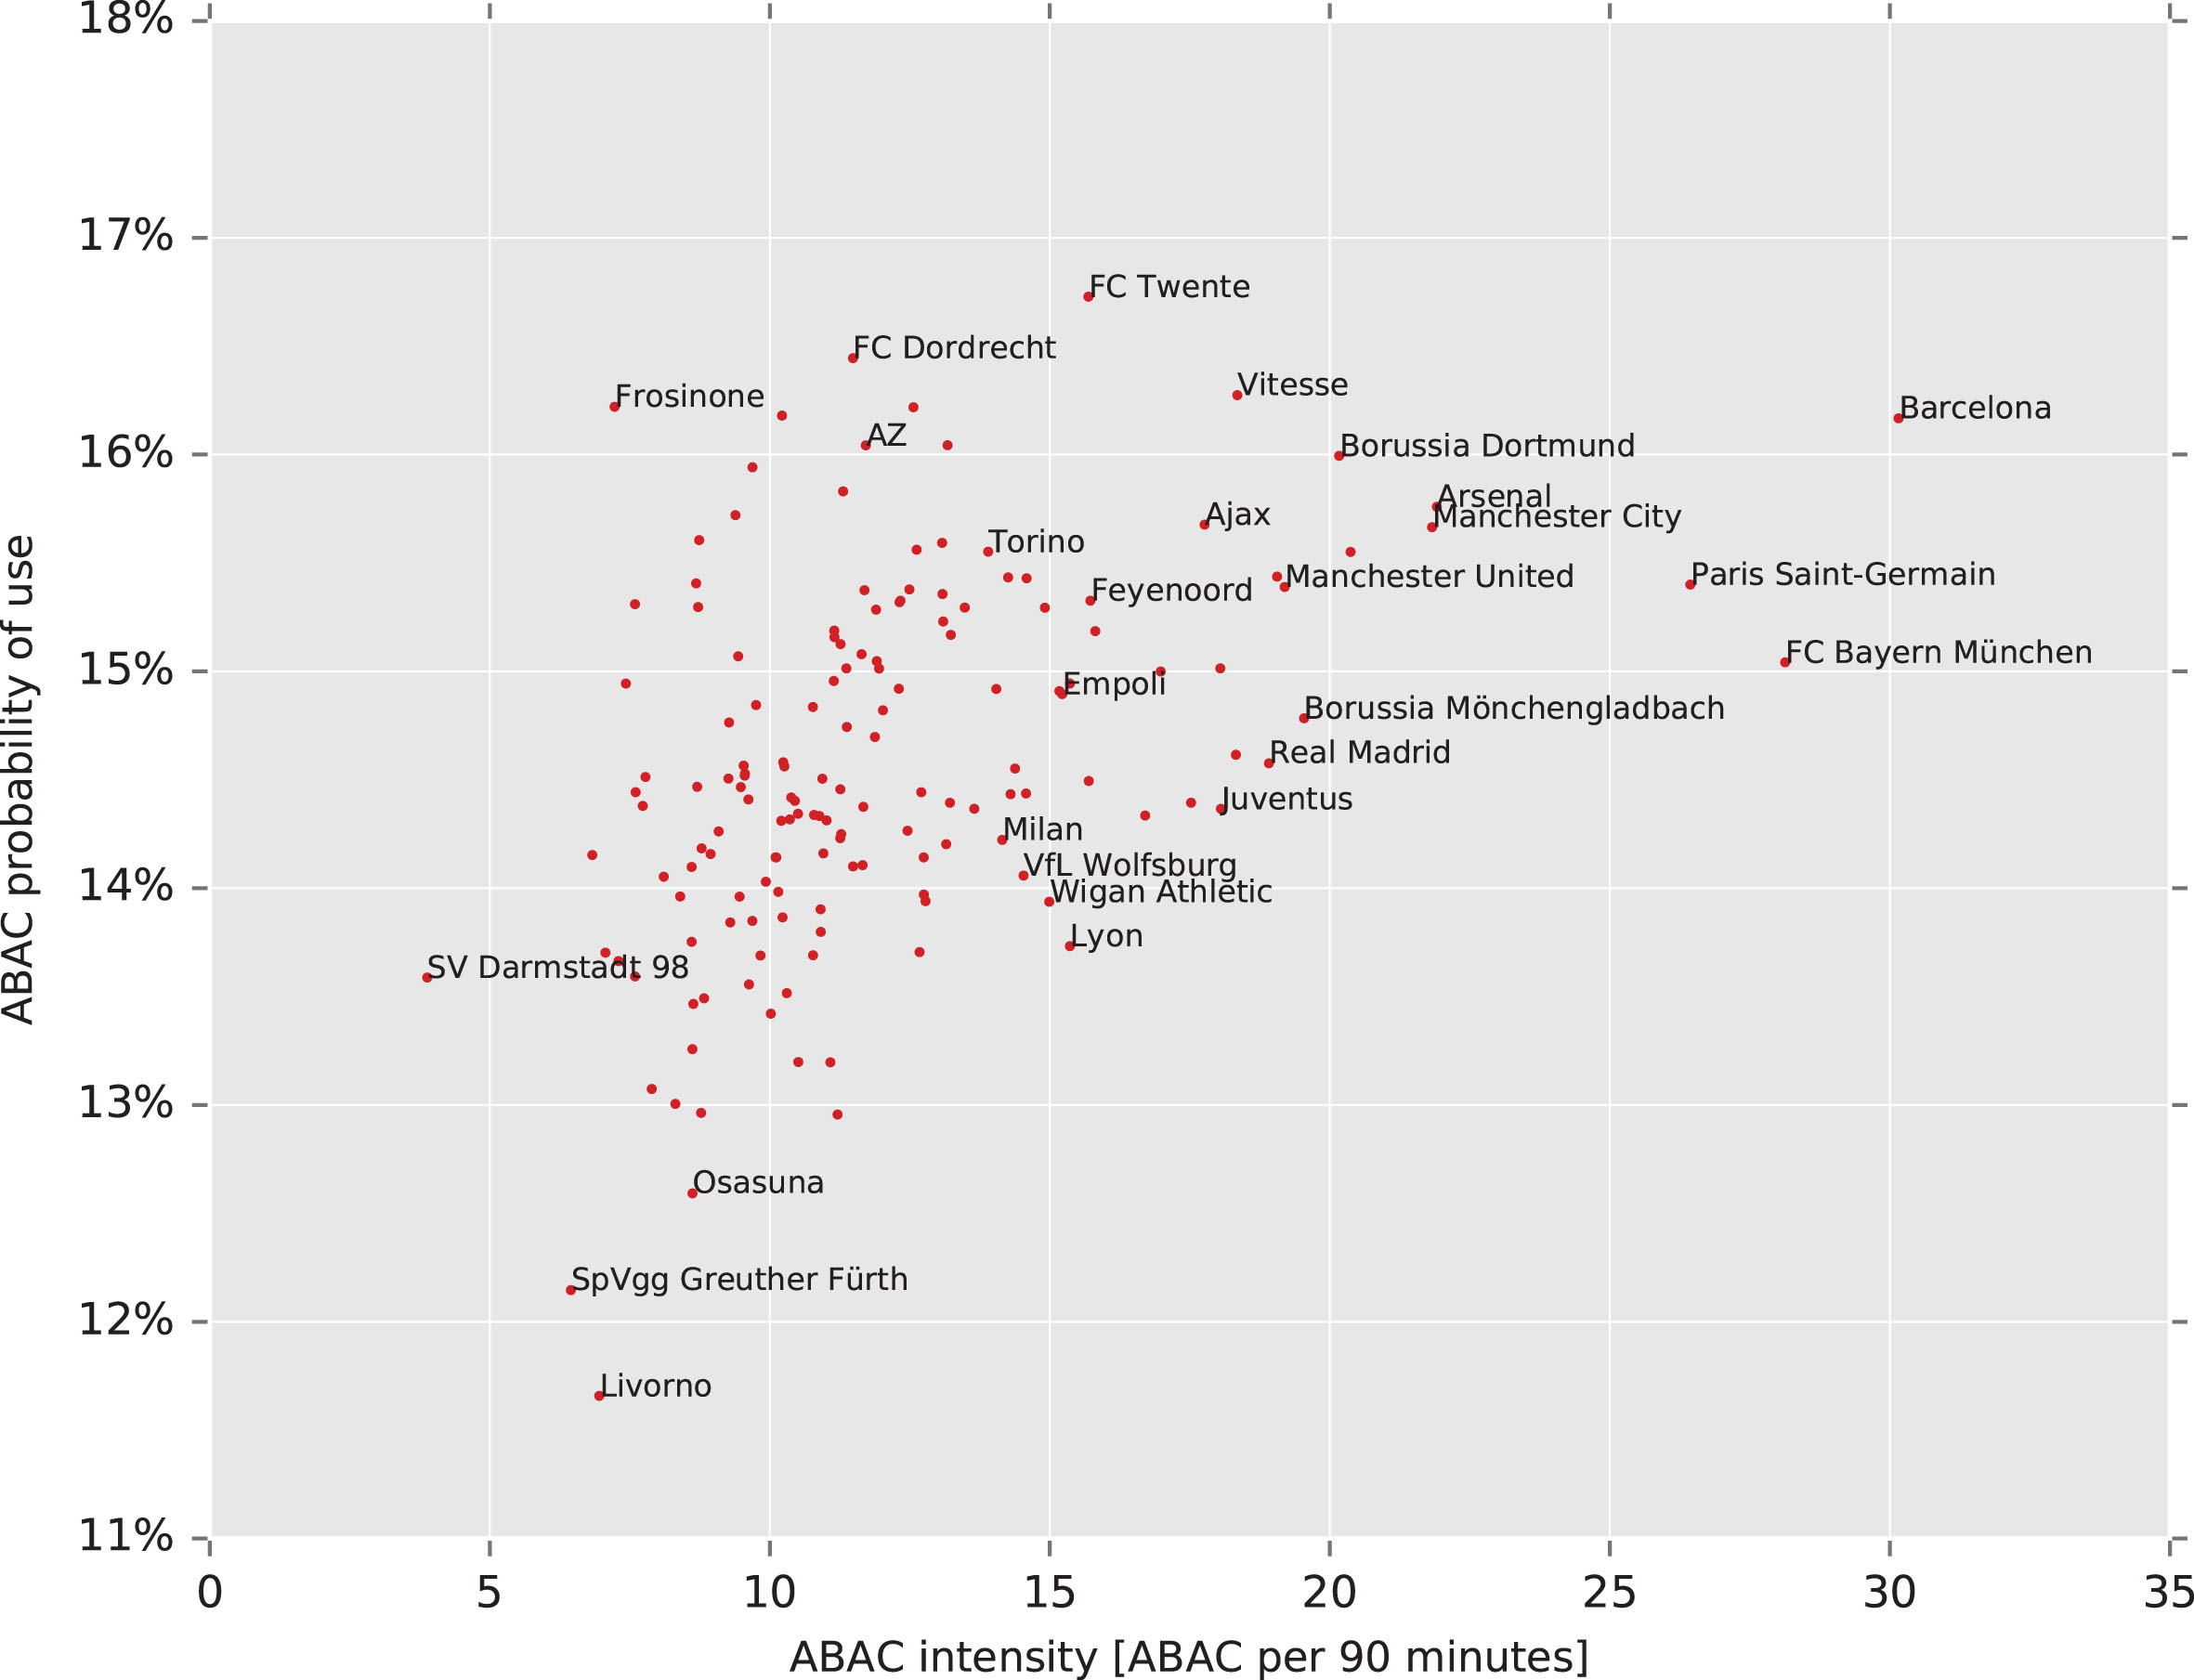
Table 2
Clusters by TPMs (mean shift, estimated bandwidth)
| Size | Cluster Member(s) |
| 1 | Paris Saint-Germain |
| 2 | FC Barcelona, Bayern Munich |
| 29 | Ajax, Arsenal, Borussian Dortmund, Borussia M’gladbach, Celta de Vigo, Chelsea, Empoli, Everton, Feyenoord, Fiorentina, Internazionale, Juventus, Las Palmas, Lille, Liverpool, Lyon, Man. City, Man. United Milan, Napoli, Nice, Real Madrid, AS Roma, Southampton, Swansea City, Tottenham Hotspur, VfL Wolfsburg, Vitesse, Wigan Athletic |
| 123 | All other teams |
From these clusters we derive that Paris Saint-Germain has a unique passing style whereas the passing styles at FC Barcelona and Bayern Munich are closely related. The latter is not surprising considering Pep Guardiola integrated his specific style into the Barcelona when he coached them between 2008 and 2012 (still largely used today), and then at Bayern Munich after he joined there as a coach in 2013. In the third cluster with 29 teams we see teams that utilize intelligent possession based football. Even the more suspect teams seem to fit in rather well. Empoli managed by Maurizio Sarri in 2014/15, who is now head coach at Napoli; Nice managed by Claude Puel during the past four seasons, and Southampton where he has been the head coach from the 2016/17 season; Vitesse coached by Peter Bosz during 2013-2016 and head coach at Ajax in the 2016/17 season; Wigan Athletic, Swansea City and Everton all coached by Roberto Martinez. Las Palmas, coached by Quique Setién, who finished 11th in their first year back in the Spanish top tier since 2002, also shows up in this cluster. This indicates that Quique Setién might be a suitable coach for other teams looking to play possession based football.
The main difference between the first three clusters and the remaining 121 teams seems their lower probability of executing ABCD and ABCA motifs, and thus higher probabilities of utilizing ABAB, ABCB, and ABAC. This trend gradually decreases per cluster, meaning that this trend is strongest for the Paris Saint-Germain cluster and weaker for the subsequent Guardiola cluster and the cluster with 29 teams respectively. Furthermore, the first three clusters have a overall higher average motif intensity per match.
3.2Uniqueness in expected goal motifs (TxGM)
A similar analysis can be made for the team expected goal motifs (TxGMs). Applying the mean shift clustering algorithm on the team intensity vectors gives us three clusters (shown in Table 3). The first two unique cluster groups are mainly differentiated by their expected goal attempts from the ABG, and ABCG motifs. The fact that teams in the first two clusters create on average significantly more xGs than “all other teams” sets them both apart from the third cluster.
Table 3
Clusters by TxGMs (mean shift, estimated bandwidth)
| Size | Cluster Member(s) |
| 9 | Arsenal, Barcelona, Chelsea, Juventus, Manchester United, Napoli, AS Roma, Southampton, VfL Wolfsburg |
| 12 | Ajax, Bayer Leverkusen, Borussia Dortmund, Bayern Munich, Schalke 04, Feyenoord, Liverpool, Manchester City, Real Madrid, PSV, Paris Saint-Germain, Vitesse |
| 134 | All other teams |
At the end of the 2015/2016 season Frank de Boer left Ajax after 5.5 seasons to become head coach at Inter Milan. Ajax subsequently replaced him with former Vitesse manager Peter Bosz. Both these trainer changes can be explained by means of the TPMs and TxGMs employed by these three teams during the past four seasons. Ajax is the 5th nearest neighbour to Inter Milan on TPMs by Euclidean distance. Despite this, Inter Milan is not placed in the first two clusters based on TxGMs; but Ajax is (see Tables 2 and 3). This indicates that Inter Milan is lacking high potential goal attempts, and they appointed Frank de Boer to fix this. The fact that Peter Bosz replaced Frank de Boer is not surprising considering their styles are rather similar. Vitesse’s TPMs and TxGMs are 2nd and 5th closest to Ajax respectively by Euclidean distance. At the end of the 2016/17 season Peter Bosz signed for Borussia Dortmund, a team with a similar style to his previously managed teams.
3.3A comparison between home and away games
Home advantage is a big part of soccer, with teams winning about 64% of their points in home games, Pollard (1986). In our data set, an average team wins 45%, loses 30% and draws 25% of their home games. This difference between home and away wins suggests that there must be something more than just home field advantage that plays a role. We conjecture that the teams either employ different motifs or increase motif intensity, i.e. play a more possessive home game compared to away games.
Separating the team possession motifs into home and away games for all teams and leagues shows that on average a team creates 7.6% more possession motifs, and 31.2% more expected goal motifs during home games. Pescara (+106.9%), Ajaccio (+101.9%) and Sporting de Gijon (+92.9%) have the biggest positive difference when comparing home versus away games on TxGMs. Exceptions to the rule include FC Twente (–9.0%), Borussia Monchengladbach (–7.8%) and Rayo Vallecano (–5.1%), who consistently preform less possession motifs (TPM’s) during their home games vs away games in three of the last four seasons recorded. SV Darmstad (–15.1%) and Siena (–12.1%) create significantly less expected goal motifs (TxGM’s) when playing at home as compared to away.
Three time consecutive UEFA League winner Sevilla stands out when comparing home and away TPMs. In 2012/13 they created 22.5% more possession motifs during their home games. After Unai Emery took over the role as head coach in January 2013 he increased this number to absolutely extraordinary heights and consistency in the following three seasons. Sevilla respectively created 60.4%, 42.4%, and 49.3% more possession motifs during their home games when compared to their away games. Table 4 shows the teams closest to Sevilla when playing at home or away using Euclidean distance. The fact that Sevilla has a similar away style to bottom-of-the-league teams like Sunderland, Chievo and Cordoba suggests that Sevilla is using completely different passing strategies during games away from their own stadium.
Table 4
Four nearest neighbours to Sevilla
| Home | Away |
| Sevilla | Sevilla |
| Athletic Bilbao | Sunderland |
| Rennes | Chievo |
| Bordeaux | AZ |
| Valencia | Cordoba |
3.4The ABABG motif
It seems that almost every week a long range screamer is scored, and subsequently named to be a contender for goal of the season. Other goals such as Jack Wilshere’s 1-0 against Norwich City in 2013 and Messi’s 3-0 against Real Sociedad in 2010 are also considered some of the most beautiful goals ever scored. Both these goals utilize the ABAB motif (between Giroud and Wilshere, and Dani Alves and Messi respectively) to create the final shot on goal. Why are these goals considered to be so beautiful and why do they not dominate the goal of the season lists?
In Table 5 we see that among all the goal attempts in the data set, only 0.90% are created from an ABAB motif. We also see that it is more difficult to create a valuable goal attempt from the ABAB motif; every goal attempt from this motif results in only 0.064 expected goals, almost half the value of an AB goal attempt. So, in the case of the ABAB-goals the beauty lies in the rarity of the event, and the inherent difficulty of turning the motif into an actual goal. Due to this they hardly ever appear in the goal of the season lists, but when they are scored they are surely considered.
Table 5
Goal Motif Frequency and Conversion Ratio
| Motif | Frequency | Average goal attempt value |
| ABG | 39.2% | 0.123 xG |
| ABCDG | 25.2% | 0.101 xG |
| ABCG | 18.5% | 0.109 xG |
| ABACG | 6.0% | 0.109 xG |
| ABCBG | 4.6% | 0.084 xG |
| ABCAG | 3.4% | 0.098 xG |
| ABAG | 2.3% | 0.081 xG |
| ABABG | 0.9% | 0.064 xG |
4Player motifs
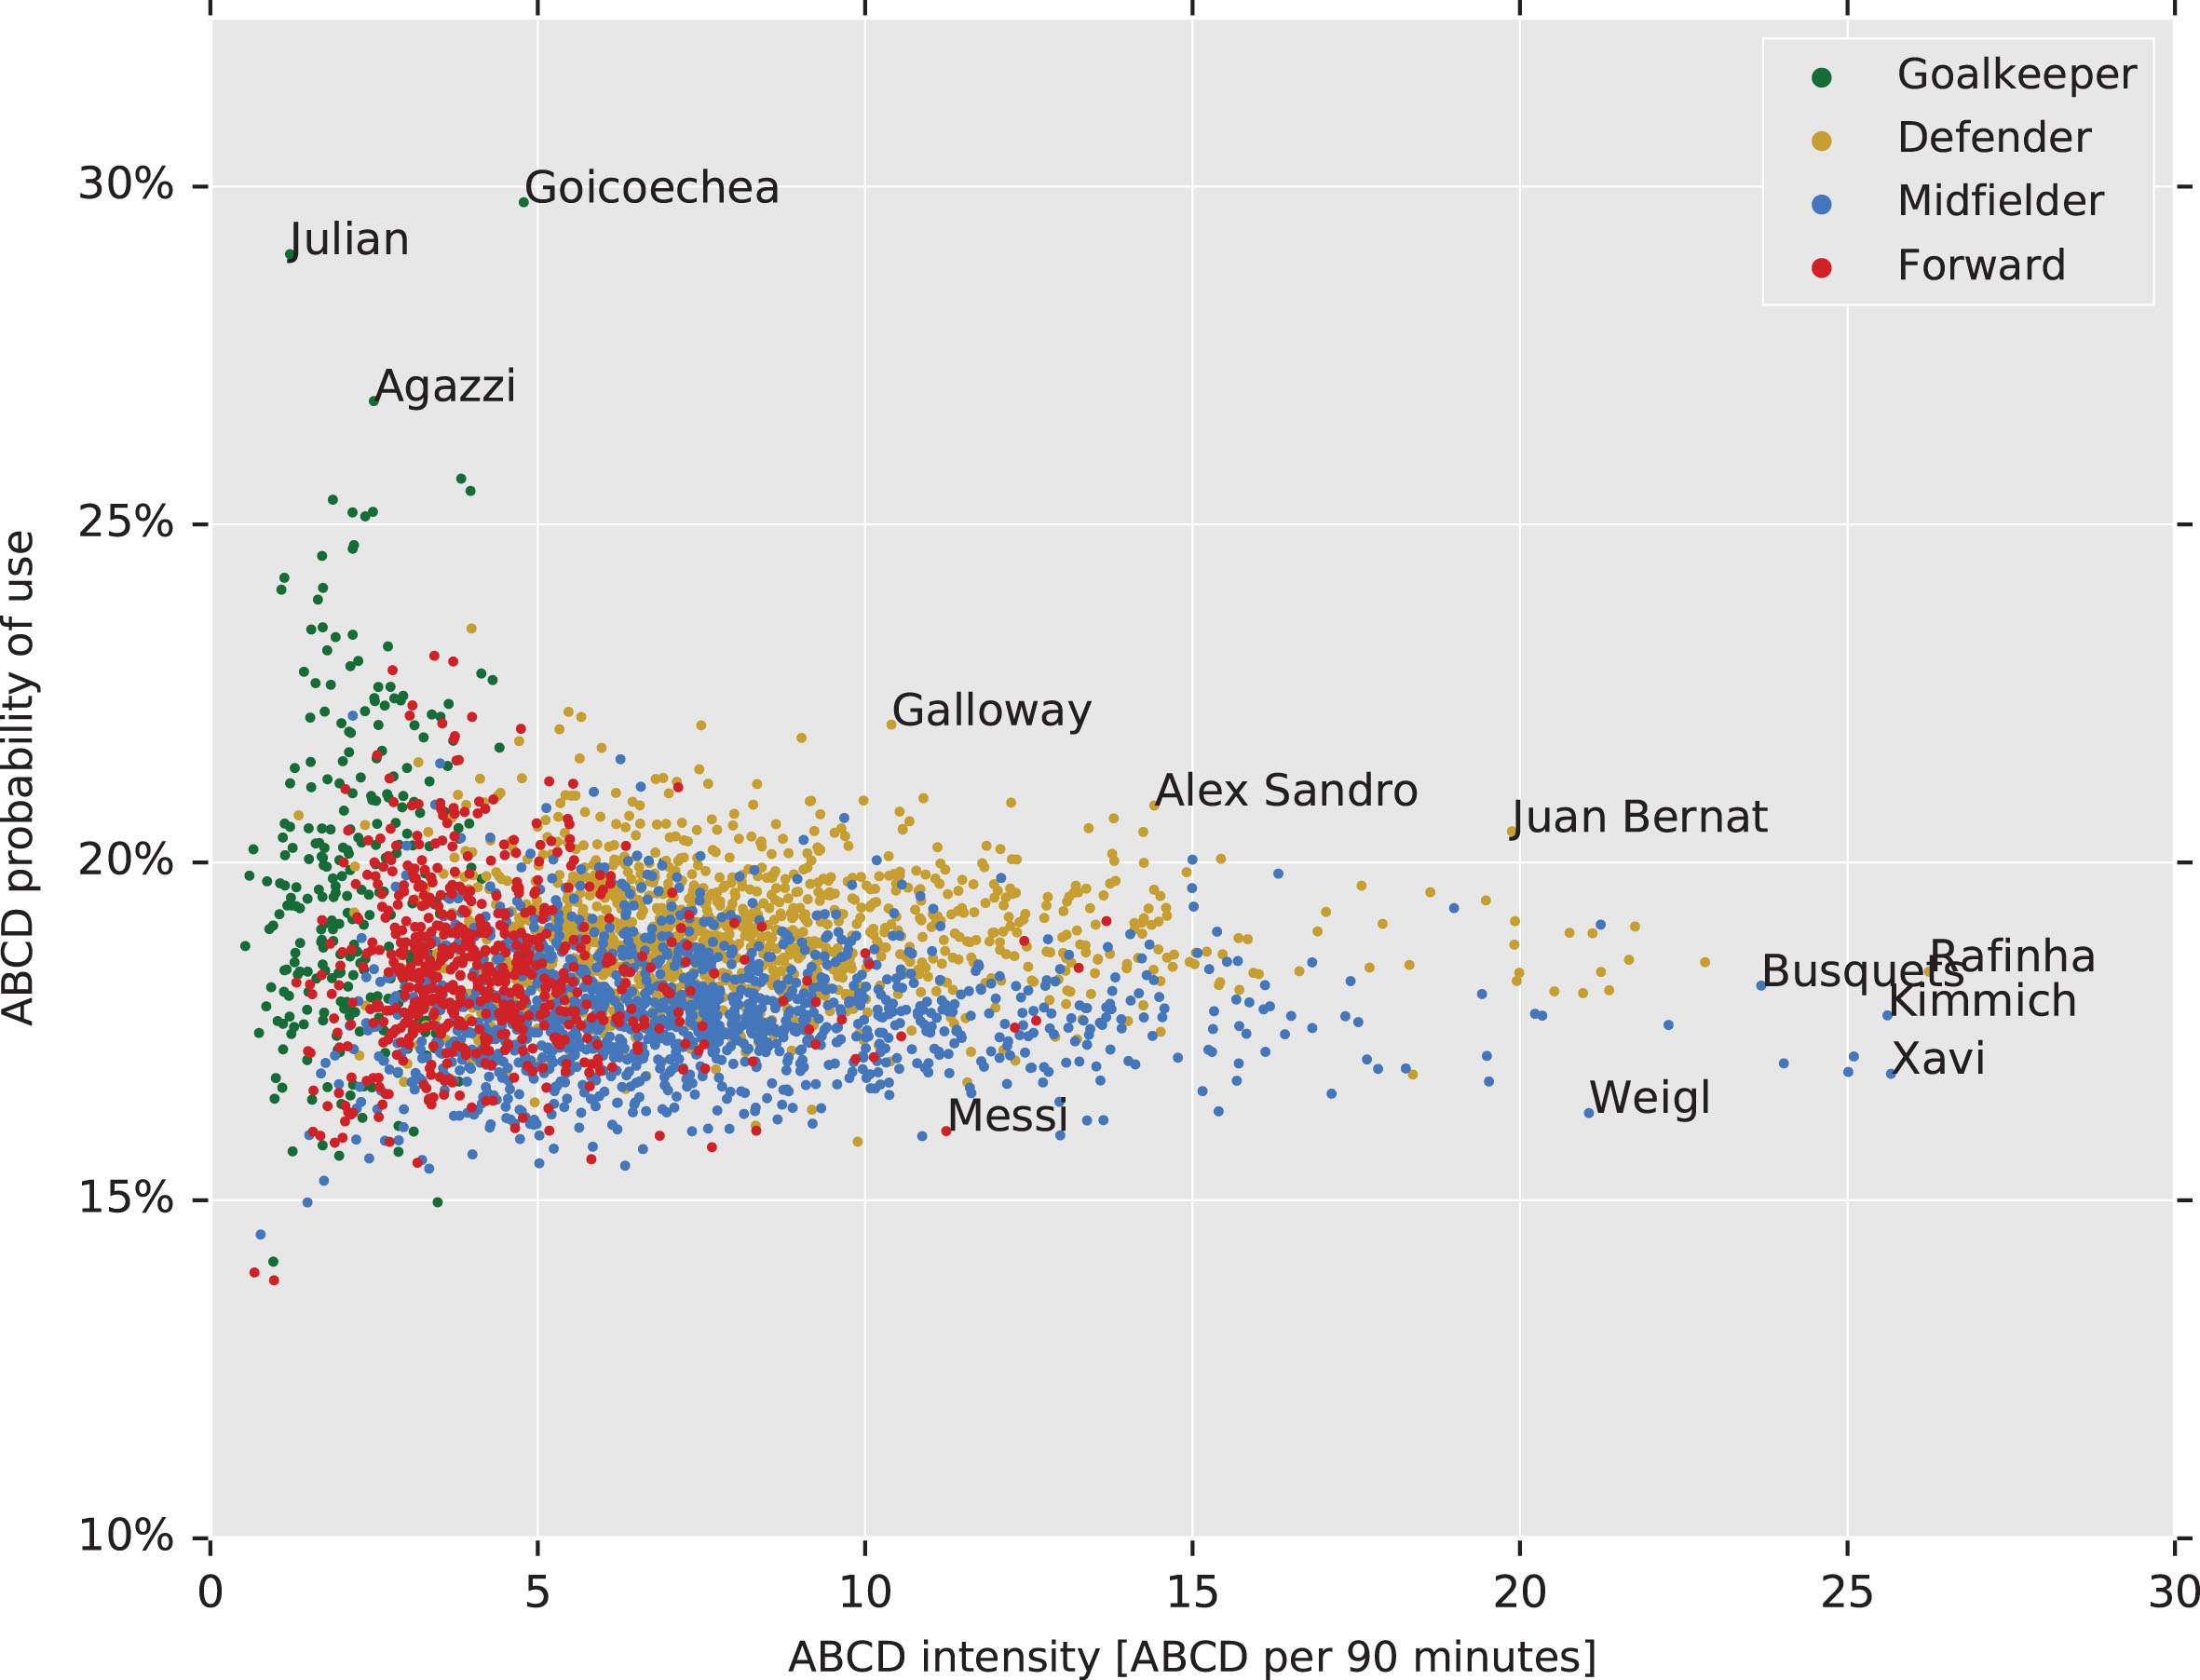
Like teams, we can also differentiate between players by analyzing their style. In Table 6 all possible player possession motifs (PPMs) and player expected goal motifs (PxGMs) are shown. We can construct a scatter plot similar to what we saw in the previous section; Fig. 5 shows all the 3532 unique players in our data set with respect to their involvement in the ABCD motif. We differentiate the players by their positions (Goalkeeper, Defender, Midfielder or Forward) and observe a clear link between player position and how they use a motif. The player possession motifs (PPMs) can be used to cluster similar players, compare players to one-another and scout potential replacements that employ a similar style.
Table 6
All possible player motifs by category
| Passes | PxGMs | PPMs |
| 1 | ABG, BAG | |
| 2 | ABAG, ABCG, BABG, BACG, BCAG | |
| 3 | ABCDG, ABABG, ABACG, ABCAG, ABCBG, BABCG, BACDG, BACAG, BABAG, BACBG, BCADG, BCACG, BCDAG, BCBAG, BCABG | ABCD, ABAB, ABAC, ABCA, ABCB, BABC, BACD, BACA, BABA, BACB, BCAD, BCAC, BCDA, BCBA, BCAB |
Fig. 5
Involvement in possession motif ABCD as a percentage of all possible motifs, against the average number of times it was used per match (90 minutes). This figure includes 3532 unique players.
4.1Unique PPM tendencies
Applying mean shift clustering algorithm with an estimated bandwidth identifies eight clusters. Clusters with less than 100 nodes are shown in Table 7 accompanied by a cluster classification for the multiple node clusters.
Table 7
Clusters by PPMs (mean shift, estimated bandwidth)
| Size | Cluster Member(s) | Classification |
| 1 | Iniesta | |
| 1 | Rafinha (Bayern) | |
| 1 | Denswil | |
| 3 | Benatia, Busquets, Xabi Alonso | Central/Defensive |
| 6 | Kimmich, Weigl, Verratti, Thiago Alcantara, Thiago Motta, Xavi | Central Midfielders |
We also ran the mean shift clustering algorithm to give us 25 unique clusters. Table 8 shows all the small clusters (the next biggest cluster has 18 nodes) with the defining trait of the cluster. These classifications demonstrate the accuracy with which the mean shift algorithm is able to cluster players playing in similar positions.
Table 8
25 clusters by PPMs (showing clusters smaller than 10)
| Size | Cluster Member(s) | Classification |
| 1 | Xavi, Iniesta, Rafinha (Bayern), Kimmich, Verratti, Thiago Alcantara, Denswil, Thiago Motta, Ribery, Puyol, Seri, Dani Alves, Weigl | Individual Nodes |
| 2 | Ramsey, Pastore | Central Attacking Midfielders |
| 2 | Busquets, Xabi Alonso | Central Defensive Midfielders |
| 4 | Adriano, Alaba, Alba, Lahm | Full-Backs |
| 4 | Schweinsteiger, Matuidi, Fabregas, Y. Toure | Central Midfielders |
| 5 | van Buyten, Dante, Boateng, Arteta, Kroos | Central/(Defence) |
| 5 | Vidal, Badstuber, Gundogan, Joringho, Strootman, Rabiot, Pjanic, Taddei | Central Midfielders (excl. Badstuber) |
Inspecting the players in Table 8, we see mostly (former) players from elite European teams such as FC Barcelona, Bayern Munich, Paris Saint-Germain, Real Madrid and Borussia Dortmund. An interesting player within this exclusive list of players with his own single node cluster is OGC Nice and Ivory Coast central midfielder Jean Seri. To see whether Seri is an outlier at the bottom or top end of the player spectrum we can find the nodes closest to him by Euclidean distance. The players closest to Seri are: Toni Kroos, Jérôme Boateng, Cesc Fàbregas and Bastian Schweinsteiger. This implies that Jean Seri must be a prolific central midfielder.
4.2Unique PxGM tendencies
Player Expected Goals Motifs (PxGMs) can be used to shed light on the mind of the individual, the way they personally shape their opportunities, create opportunities for their team mates and show how effective they are at finding the right spot for a goal attempt. Applying the mean shift clustering algorithm with an estimated bandwidth, we identify thirteen different PxGM clusters. Clusters with less than 20 nodes are shown in Table 9 accompanied by a cluster classification.
Table 9
Clusters by PxGMs (mean shift, estimated bandwidth)
| Size | Cluster Member(s) | Classification |
| 2 | Lewis Baker, Nicky Shorey, | Central Attack |
| 2 | Jacob Mulenga, Sloan Privat | Center Forwards |
| 4 | Imbula, Weigl, Lanzini, Ibe | Defensive Midfielders (excl. Ibe) |
| 9 | C. Ronaldo, Adrian Ramos, Mitrovic, Diafra Sakho, Dzeko, Uche, Coda, Lewandowski, Necid | Center Forwards |
| 16 | Messi, Robben, Morata, Tevez, Sturridge, Lampard, Bale, Hernandez, Higuain, Luis Suarez, Benzema, Ibrahimovic, Depay, Vucinic, Muller | Wingers &Center Forwards |
From Table 9 we derive that Messi and Ronaldo, the two best players in the world since 2008, have different goal scoring styles. In Figs. 6 and 7 the differences in expected goal scoring style between Messi and Ronaldo are easily seen. Messi is involved more in the build-up of his own chances utilizing BACAG, ABAG, ABCAG and BABAG to create most of his expected goals. Ronaldo is significantly less involved in his own chances prior to taking the final shot (BCBAG and BAG).
Fig.6
Messi’s PxGM.
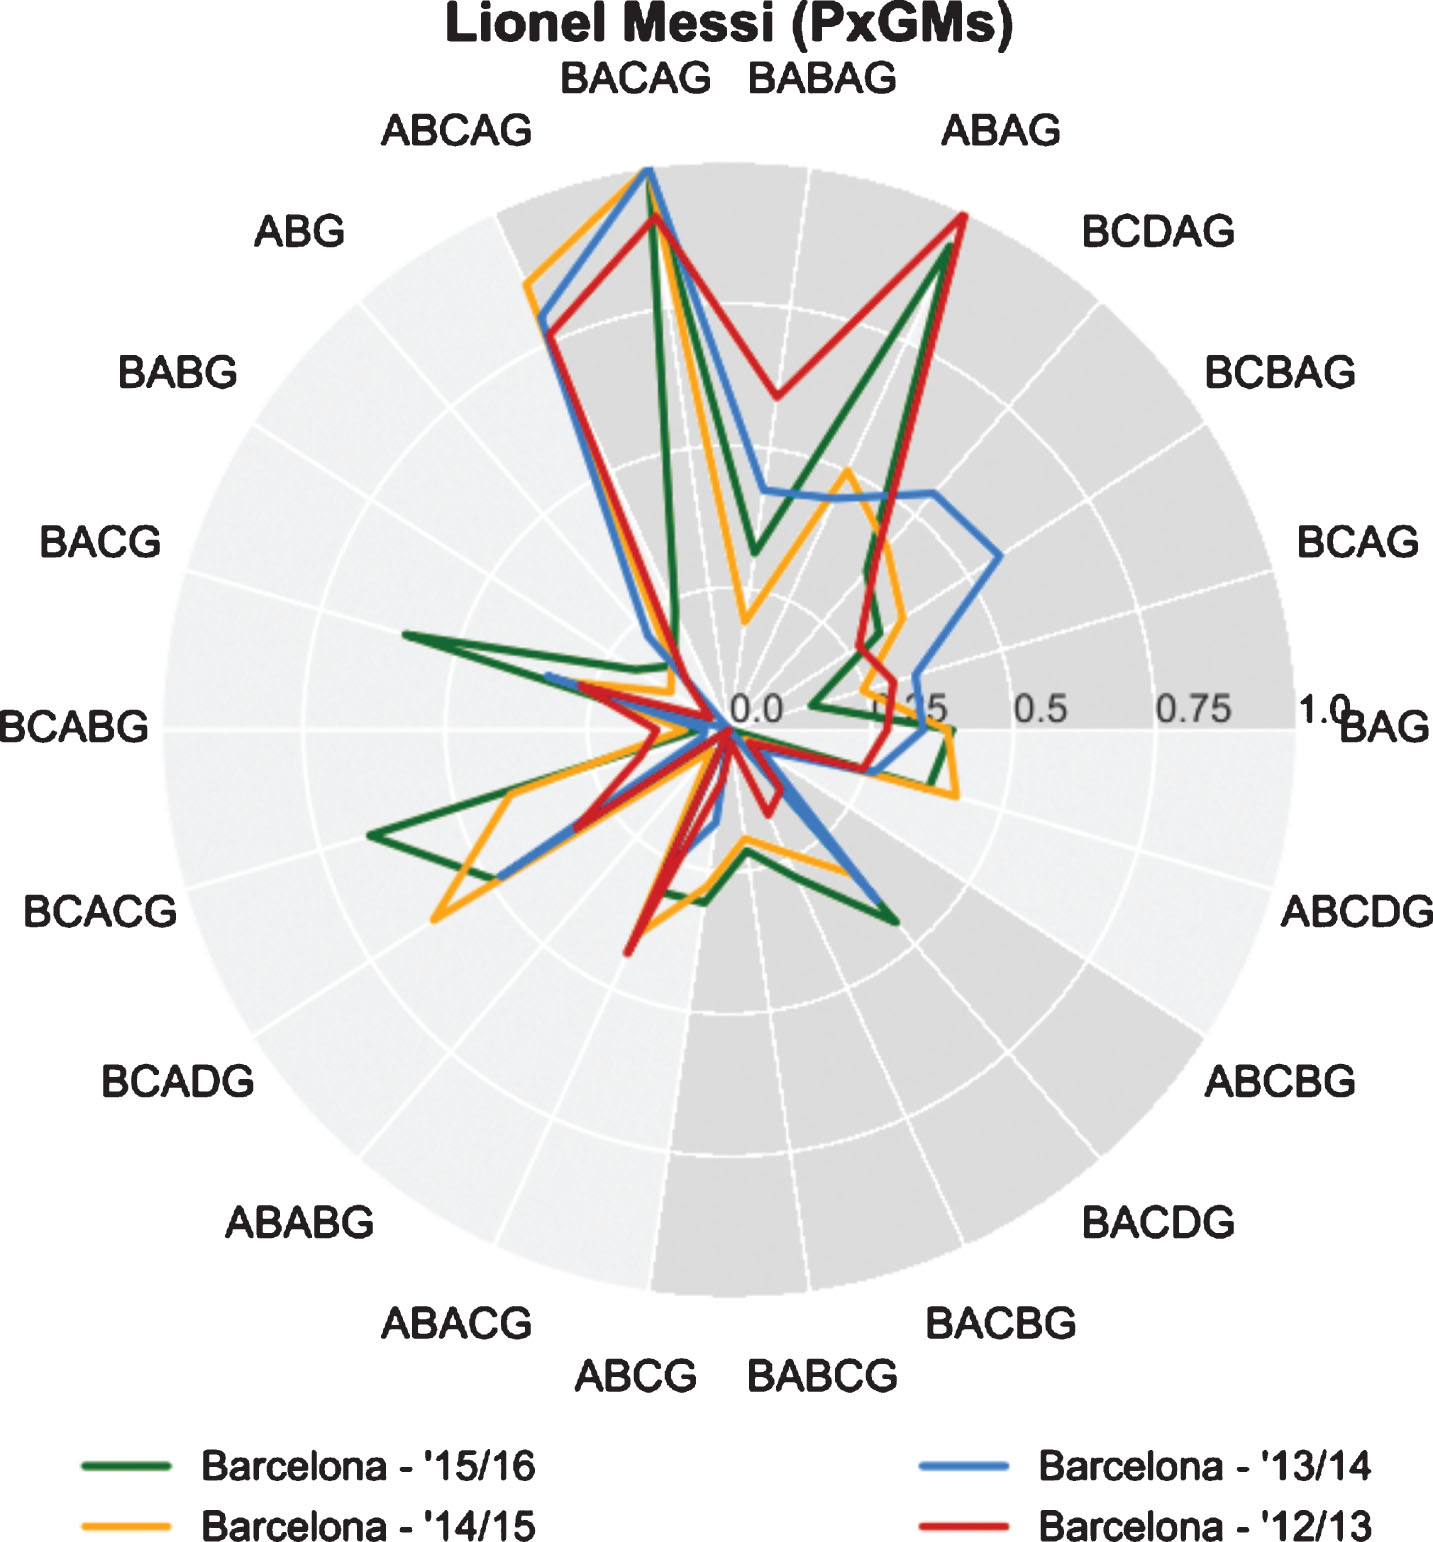
Fig.7
C. Ronaldo’s PxGM.
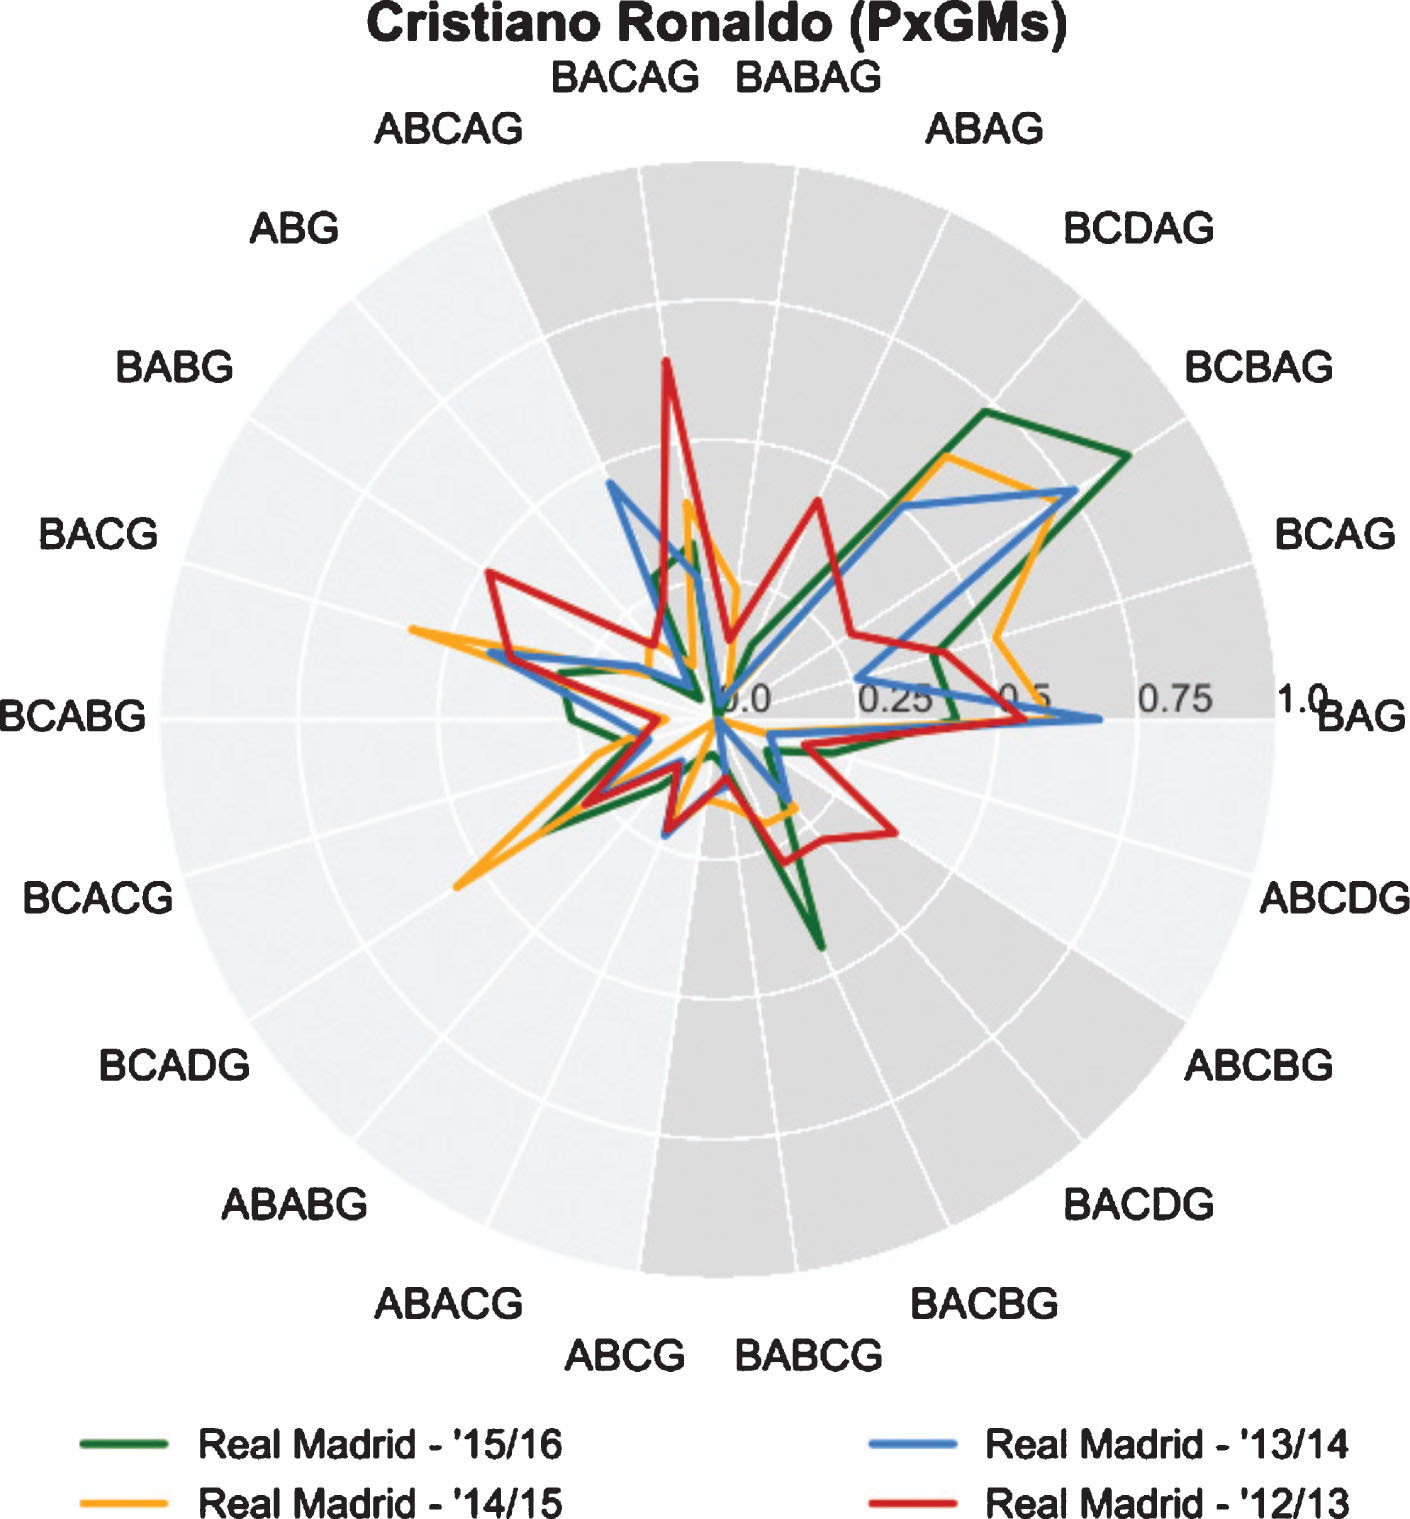
We also see that Messi gave assists that had a higher probability of being converted into goals in the 2014/15 and 2015/16 seasons (BCACG, BCADG and BACG). This is most likely the result of Barcelona acquiring Luiz Suarez in the summer of 2014. Suarez managed to outscore Messi during the 2015/16 season by 14 goals (40 against 26). On the other hand we notice that Ronaldo and Real Madrid have evolved from a team that would simply pass the ball to Ronaldo and let him shoot on goal (BAG), to a team that attempts a build-up before passing to Ronaldo seeing how the use of BCDAG and BCBAG motifs clearly increased.
4.3Who can replace Xavi?
In the research appropriately titled “Who can replace Xavi?”, the authors contemplate on the possible replacement for Xavi after he departs from FC Barcelona, (Pena and Navarro, 2015). La Computadora, who moved to play for Al Sadd in 2015, is widely regarded as the puppet master pulling the strings in arguably the best football team the world has ever seen. In their analysis, Peña and Navarro show that Xavi is a clear outlier when it comes to his extraordinary passing ability, raising the question of whether anyone could possibly follow in his footsteps. In Fig. 8 Xavi’s radar graph is depicted for the season 2012/13 (by far his best season in this data set) with 228.6 PPMs/90 minutes.
Fig.8
Xavi’s PPMs (in ’12/13).
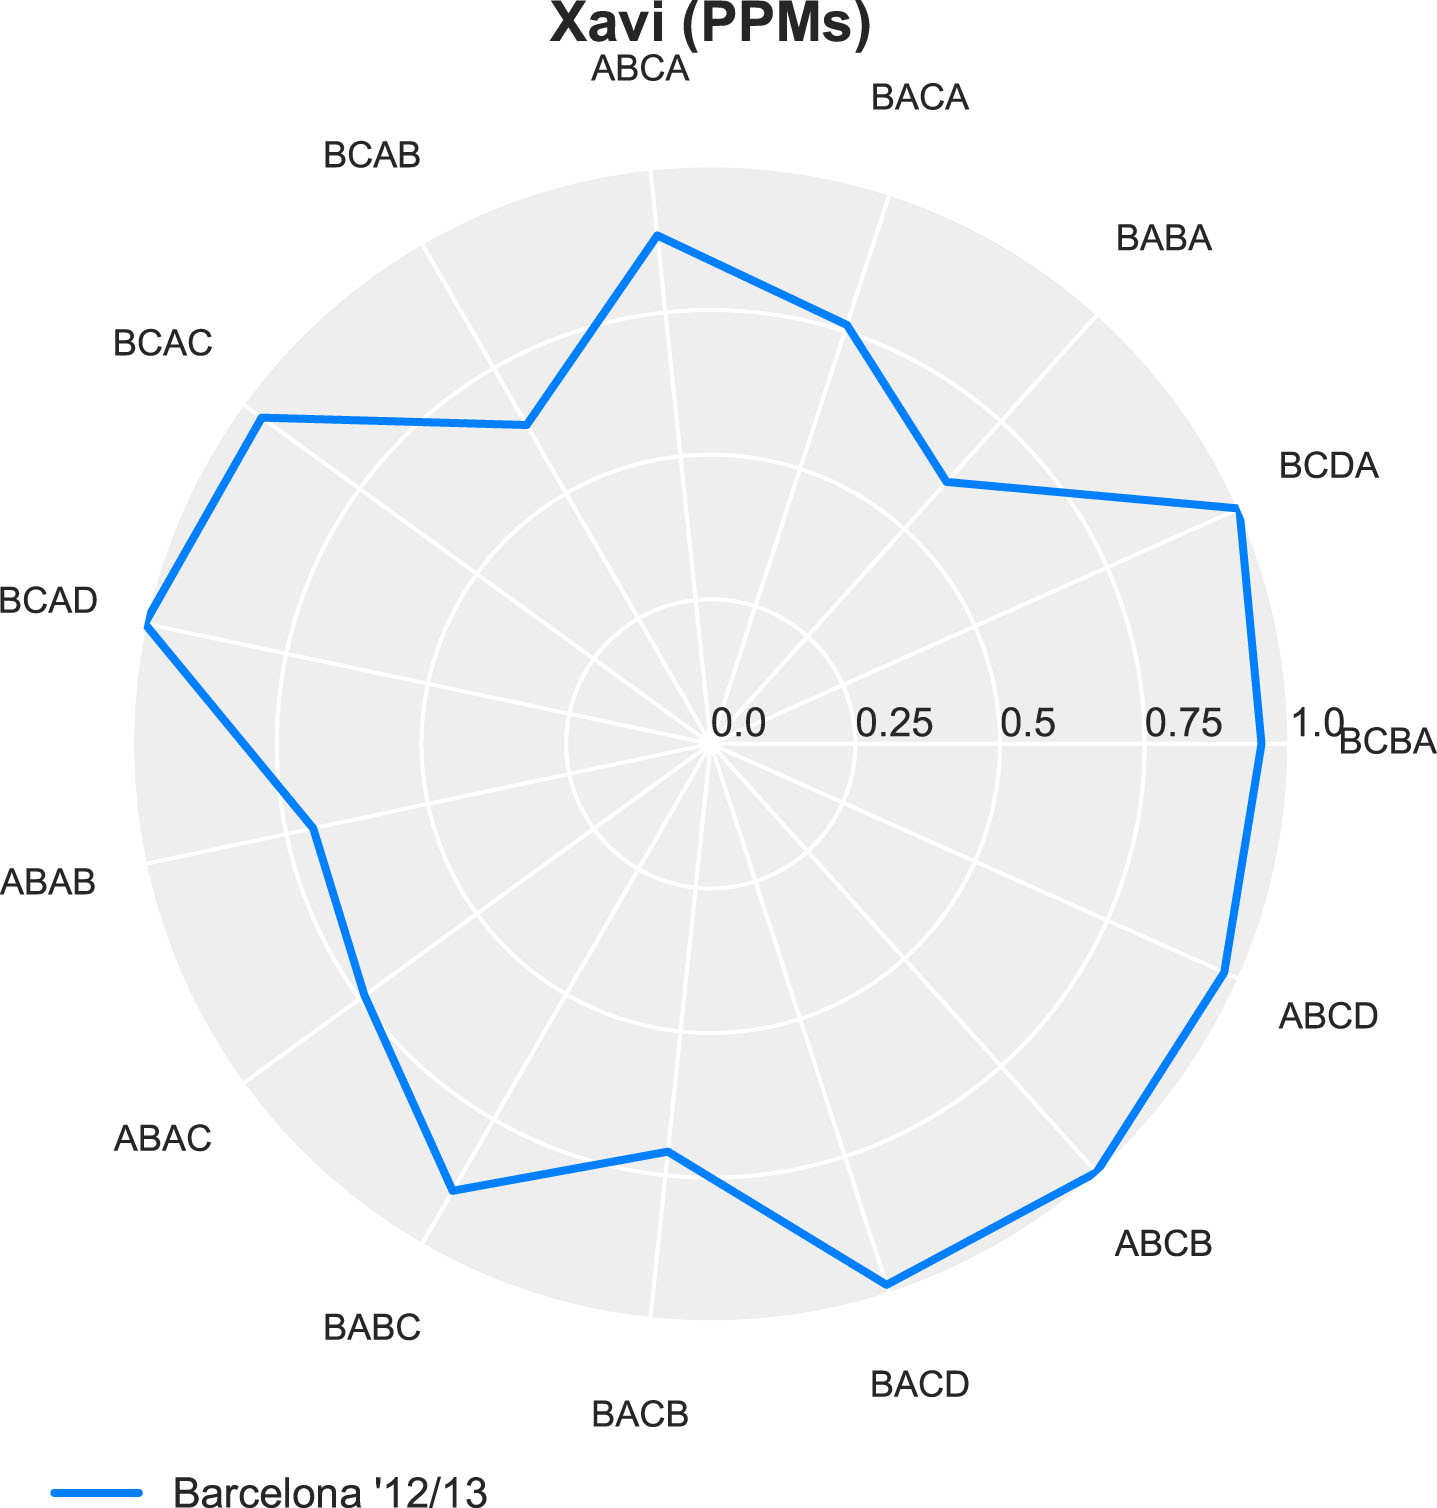
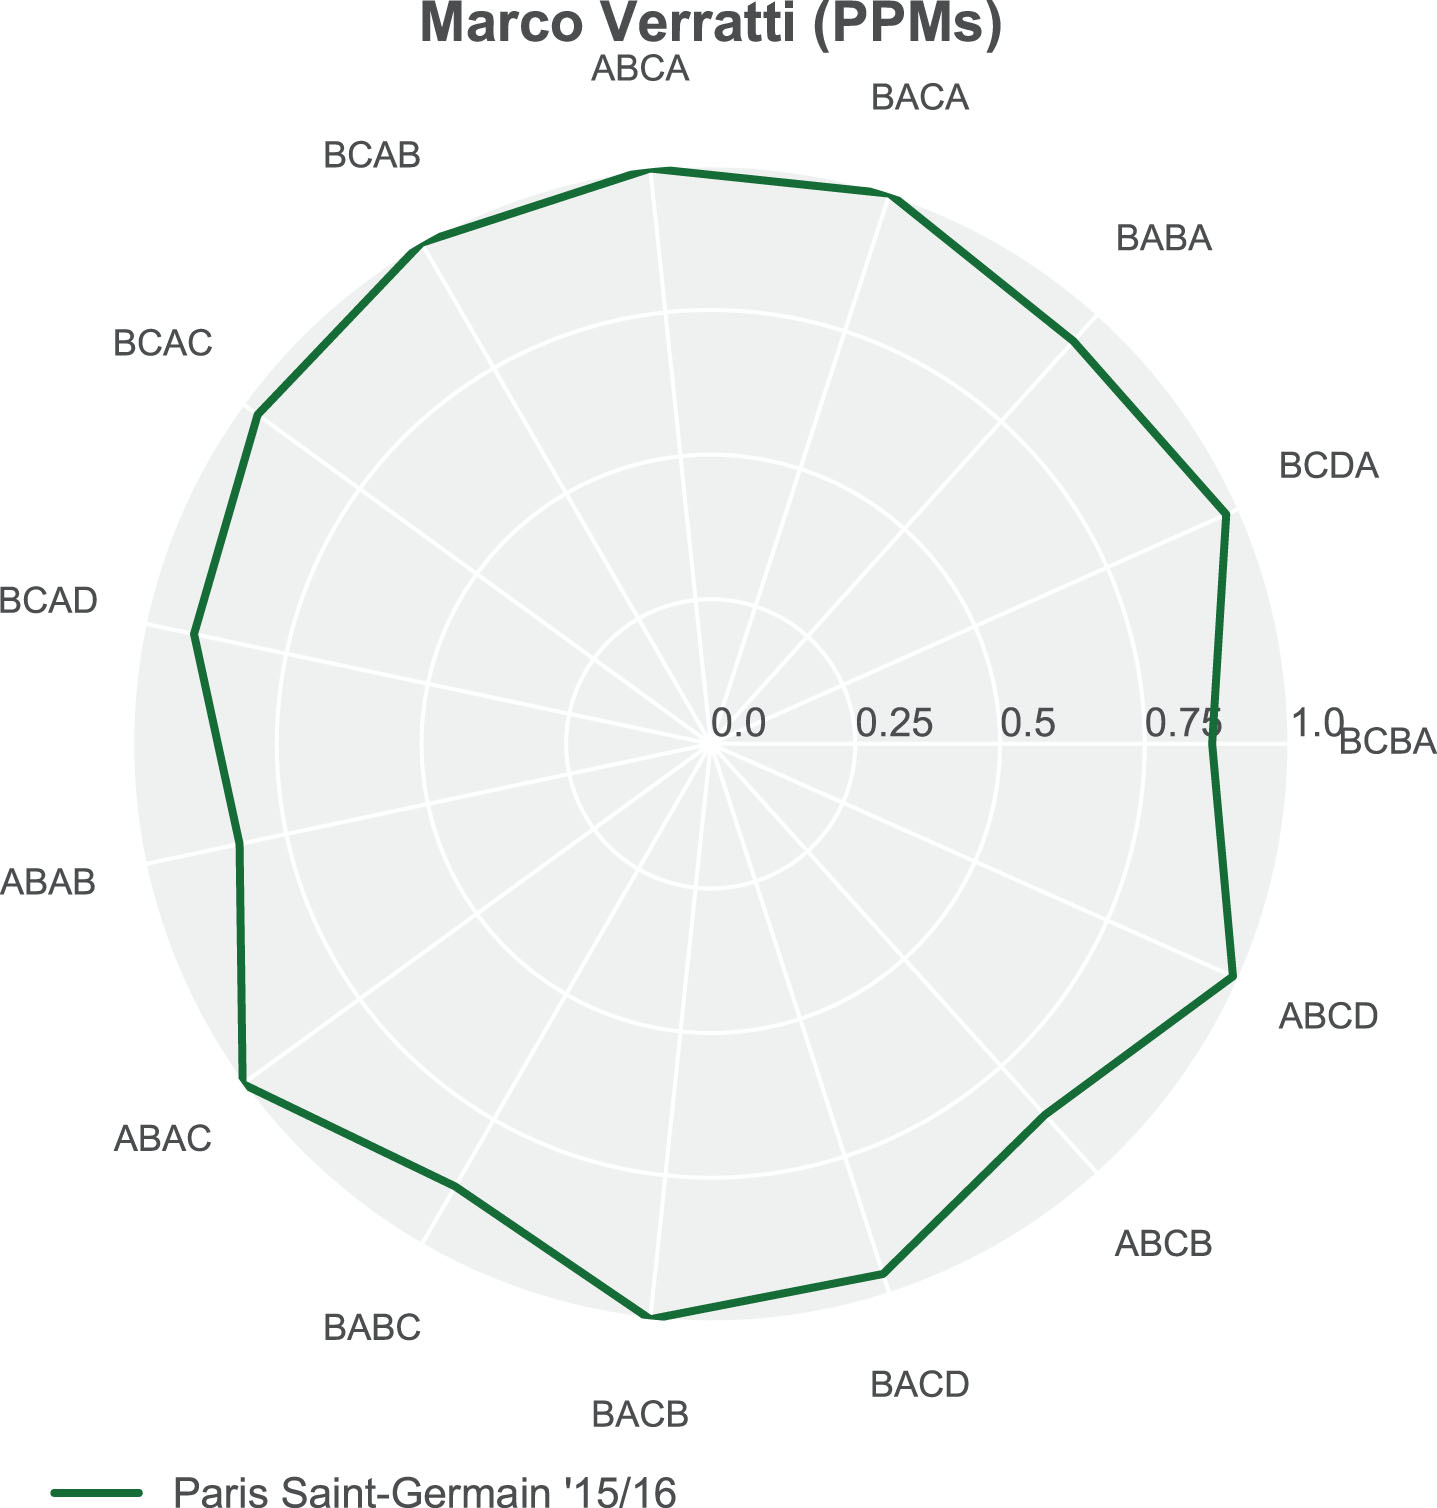
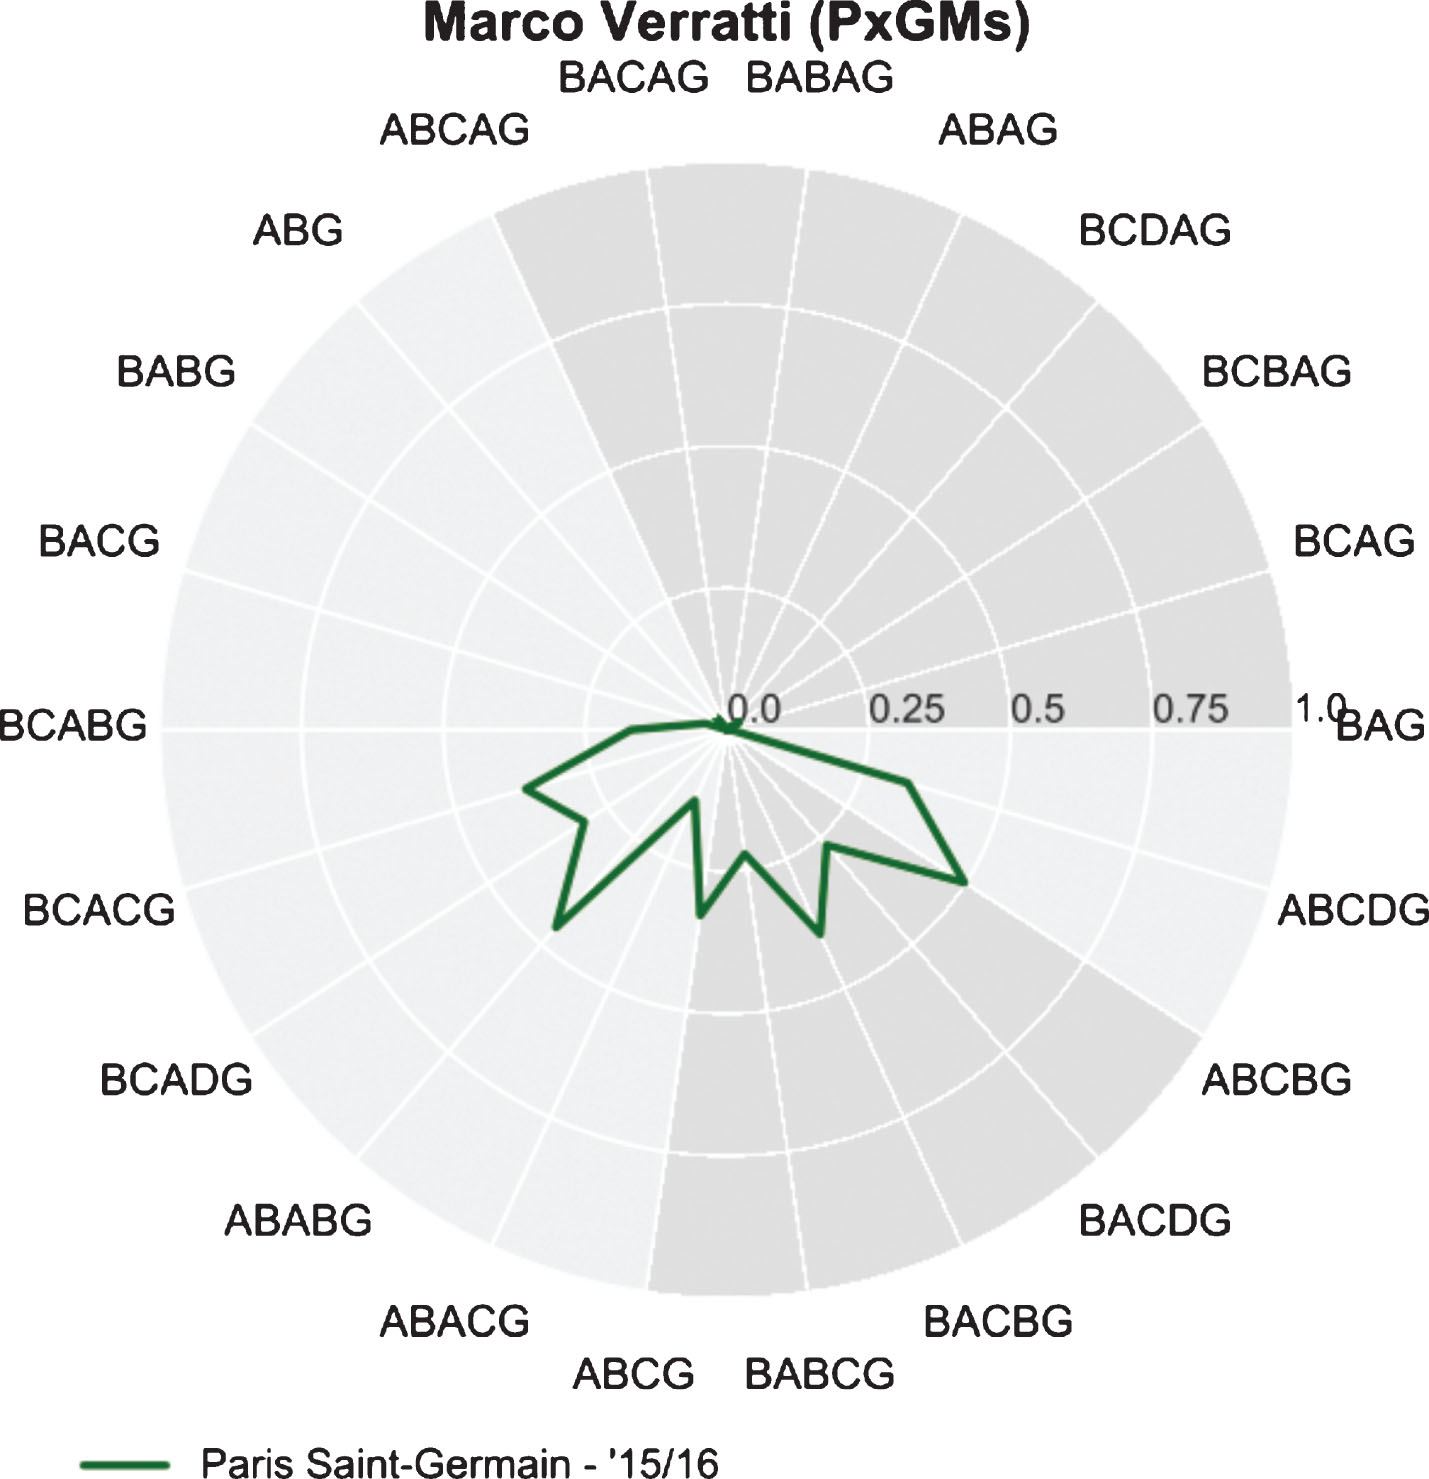
Xavi’s successor by PPMs can be found by investigating the players closest to Xavi on Euclidean distance. Not surprisingly, the five players closest to Xavi are Thiago Alcantara, Verratti, Thiago Motta, Kimmich and Weigl respectively over all their seasons in the data set (see Table 7). Taking a closer look into the data shows that Marco Verratti is an interesting prospect (see Fig. 9) because in the 2015/2016 season he produced 237.8 PPMs/90 minutes.
Fig.9
Verratti’s PPMs (in ’15/16).
Subsequently we look at the players closest to Xavi by PxGMs. We find that Verratti is quite far from Xavi by Euclidean distance, however looking at their PxGM radar graphs (Figs. 10 and 11) we see that Verratti is involved in more expected goal motifs than Xavi. They also show a similar style with most of their xGs coming from playing as the second and third assist.
Fig.10
Xavi’s PxGM (in ’12/13).
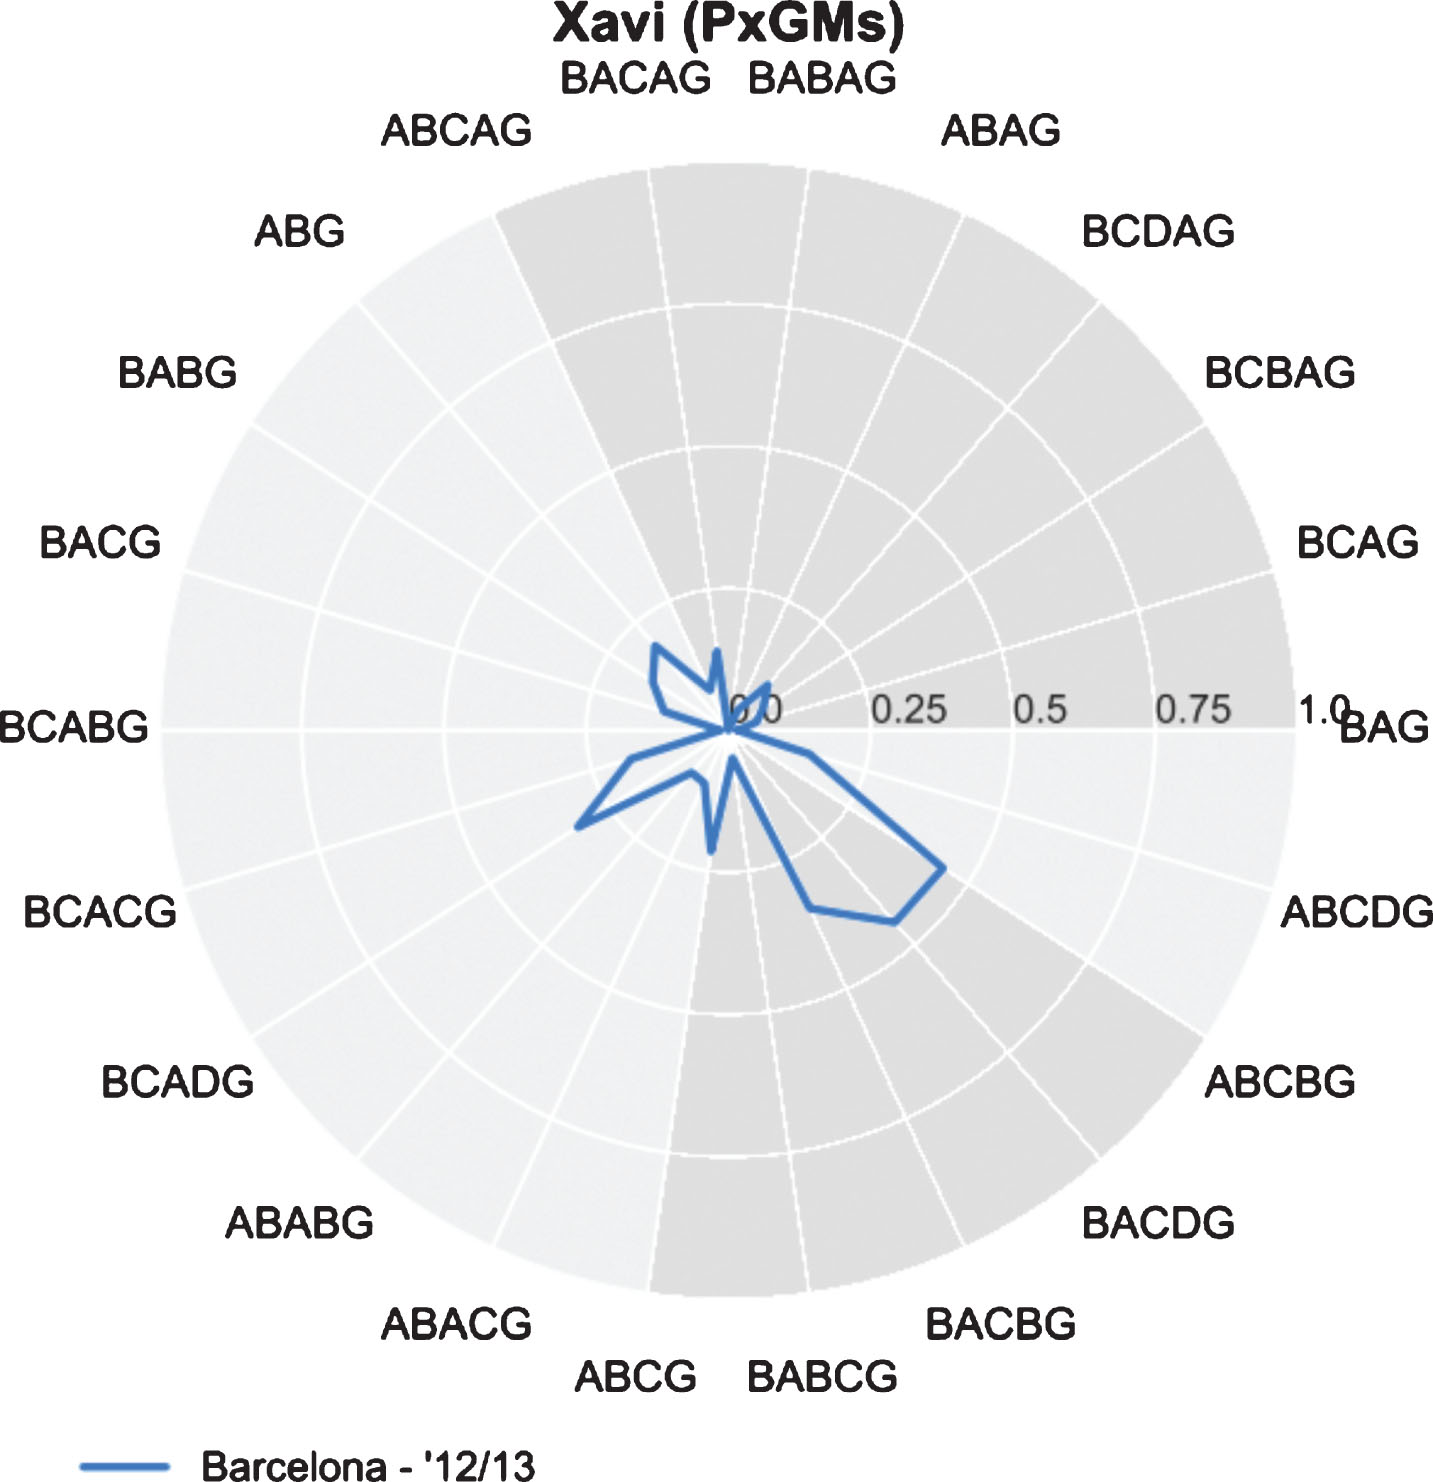
Fig.11
Veratti’s PxGM (in ’15/16).
Does this make Marco Verratti the perfect replacement for Xavi? Possibly. Marco Verratti played the equivalent of 10.19 matches in the 2015/16 season, due to seven different minor injuries, whereas Xavi played the equivalent of 35.24 matches. However, in the 2014/15 season Verratti played the equivalent of 28.3 matches where he reached a total average of 183.9 motifs per 90 minutes, and was ranked at first place by motif use that season.
5Scouting and tactical analysis
In addition to analyzing past events, the PMs and xGMs can also be used to select possible replacements for departing players and coaches in the near future and finding more optimal strategies than those currently utilized by a team.
5.1(Hypothetical) player replacements
Arsenal’s Mesut Özil and left-back Nacho Monreal are both players who were frequently involved in passing motifs with Alexis Sánchez in 2015/16. In this section we will look at possible replacements for these players in the hypothetical case that either of them leaves Arsenal during the summer of 2016 (Note: Sánchez left Arsenal after the 2017–18 season). In this case it is possible to execute a nearest neighbour search for the departing player to look for a replacement with a similar PPM and PxGM style, and similar position. This search will be conducted on the aggregate last two seasons of both players – the seasons in which they played with Sánchez. These possible replacements, identified with the help of the Euclidean distance nearest neighbours for PxGMs and PPMs, are shown in Table 10 for Mesut Özil, and Table 11 for Nacho Monreal.
Table 10
Central Midfielders closest to Özil by PPM and PxGM
| Player | Team | Season(s) |
| Mesut Özil | Arsenal | |
| David Silva | Man. City | ’15/16 |
| Isco | Real Madrid | ’15/16 |
| James Rodriguez | Real Madrid | ’14/15 |
| Mathieu Valbuena | O. Lyon | ’15/16 |
Table 11
Left-Backs closest to Monreal by PPM and PxGM
| Player | Team | Season(s) |
| Nacho Monreal | Arsenal | |
| C. Azpilicueta | Chelsea | ’14/15, ’15/16 |
| Miquel Nelom | Feyenoord | ’15/16 |
| Jonny Castro | C. de Vigo | ’15/16 |
| Jeremy Morel | O. Lyon | ’15/16 |
5.2(Hypothetical) manager replacement
A similar analysis can be done for team style analysis. 2016 marked the 20th anniversary of Arsène Wenger as Arsenal’s head coach. Judging from the void left by Alex Ferguson at Manchester United when he retired in 2013 after a 26 year reign, it would be very difficult to replace a manager that shaped a team for such a long period of time. To be able to make a smooth transition whenever Wenger leaves Arsenal, finding a manager that coached a team with a similar play style to that of Arsène might help smooth this eventual transition.
To find such managers we conduct a search for coaches that managed teams with a similar style in one season, when compared to the aggregate style of Arsenal over 4 seasons. In Table 12 the coaches that are close to Arsenal on both TPMs and TxGMs are depicted.
Table 12
Coaches/Teams closest to Arsène Wenger by TPMs and TxGMs
| Coach | Team | Season(s) |
| Arsene Wenger | Arsenal | All |
| Lucien Favre | Borussia M’gladbach | ’14/15 |
| Rudi Garcia | AS Roma | ’13/14 |
| Massimiliano Allegri | Juventus | ’15/16 |
| Antonio Conte | Juventus | ’14/15 |
| Luciano Spaletti | AS Roma | ’15/16 |
5.3Strategic improvements
In Section 4.4 we show that some goal attempt motifs occur more frequently then others and that the average value of a goal attempt differs significantly depending on the type of motif executed. When looking at these two aspects for Arsenal it is possible to find xG-motifs that are less effective and might hinder Arsenal in creating even more valuable opportunities.
Table 13 shows that ABAG, ABABG, ABCBG are executed 11.3% of the time. These motifs, ending in a one-two combination, are 3 of the 4 motifs with the lowest average goal attempt value. By introducing a new player after the one-two combination ABAG becomes ABACG, ABABG becomes BABCG (=ABACG), and ABCBG becomes BCBAG (=ABACG). Extending the motif by one player (within five seconds) to make the final attempt can create a great amount of extra value, because ABACG generates an average goal attempt value of 0.124 xG as opposed to 0.110, 0.098 and 0.094. For instance a reduction of just 1% for both ABAG, ABABG and ABCBG, and thus an increase of 3% in ABACG would help Arsenal from a weighted average of 0.110 xG per goal attempt motif to 0.120 xG per goal attempt motif – an increase of 9%.
Table 13
Statistics on Arsenal’s xGM’s
| Motif | Frequency | Average goal attempt value |
| ABCDG | 30.2% | 0.117 xG |
| ABG | 29.5% | 0.131 xG |
| ABCG | 14.9% | 0.122 xG |
| ABACG | 8.7% | 0.124 xG |
| ABCBG | 8.0% | 0.094 xG |
| ABCAG | 5.3% | 0.091 xG |
| ABAG | 2.2% | 0.110 xG |
| ABABG | 1.1% | 0.098 xG |
6Threshold sensitivity
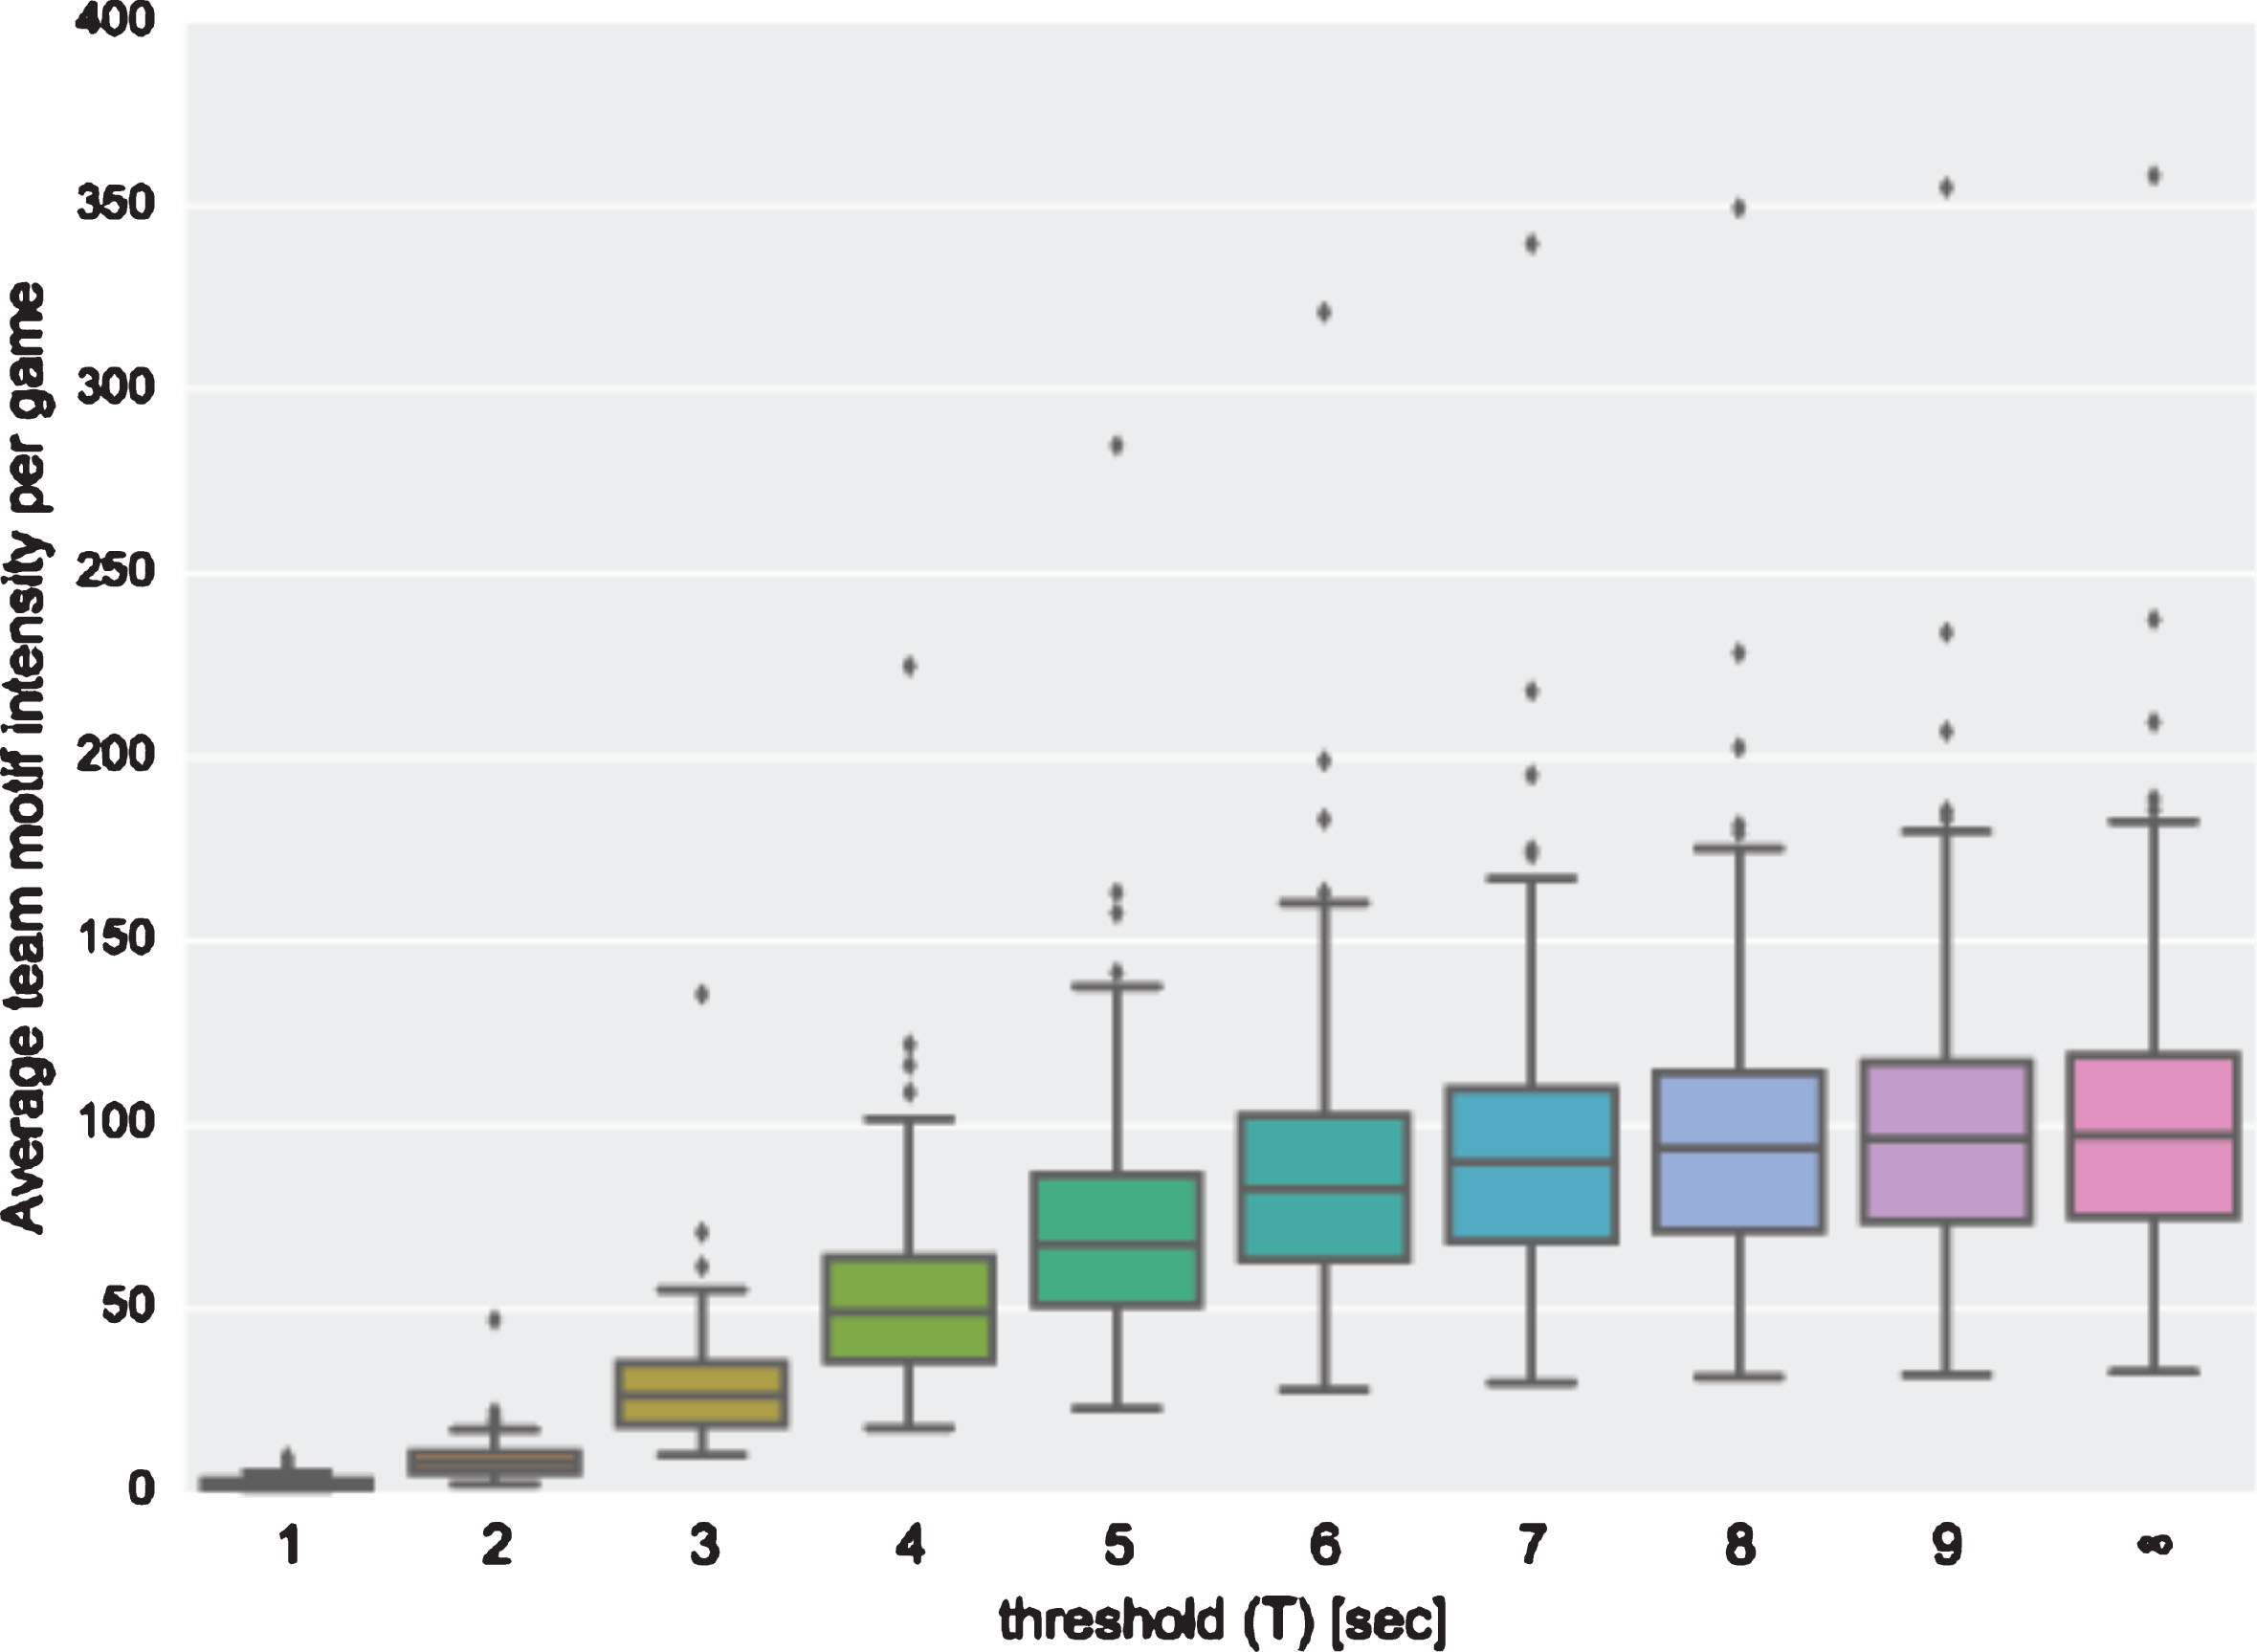
In Gyarmati et al. (2014), in Pena and Navarro (2015) and in this article, the maximum time between passes (the threshold) was set at 5 seconds. In Fig. 12 we depict the impact of varying the threshold on the number of passing motifs per team per game in the first season of every league in the data set. We see that using 6 seconds through infinity, leads to the inclusion of almost every motif imaginable, and every pass made in the game with the exception of pass sequences shorter than 3 passes. We find that using 1 or 2 seconds also seems insensible with on average just 2.65 and 9.1 motifs per team per game respectively, rendering player play style analysis impossible.
Fig.12
Threshold sensitivity on team motifs.
Another important aspect to look at is the distance travelled by the player with the ball between passes. This metric, along with the time spent on the ball (time between passes), seems to be an intuitively appealing parameter to discern what should, and should not, be included in a passing motif. A scenario in which a player covers half the pitch after receiving a pass, and subsequently passing the ball to a team mate could be perceived as not all being part of the same passing motif.
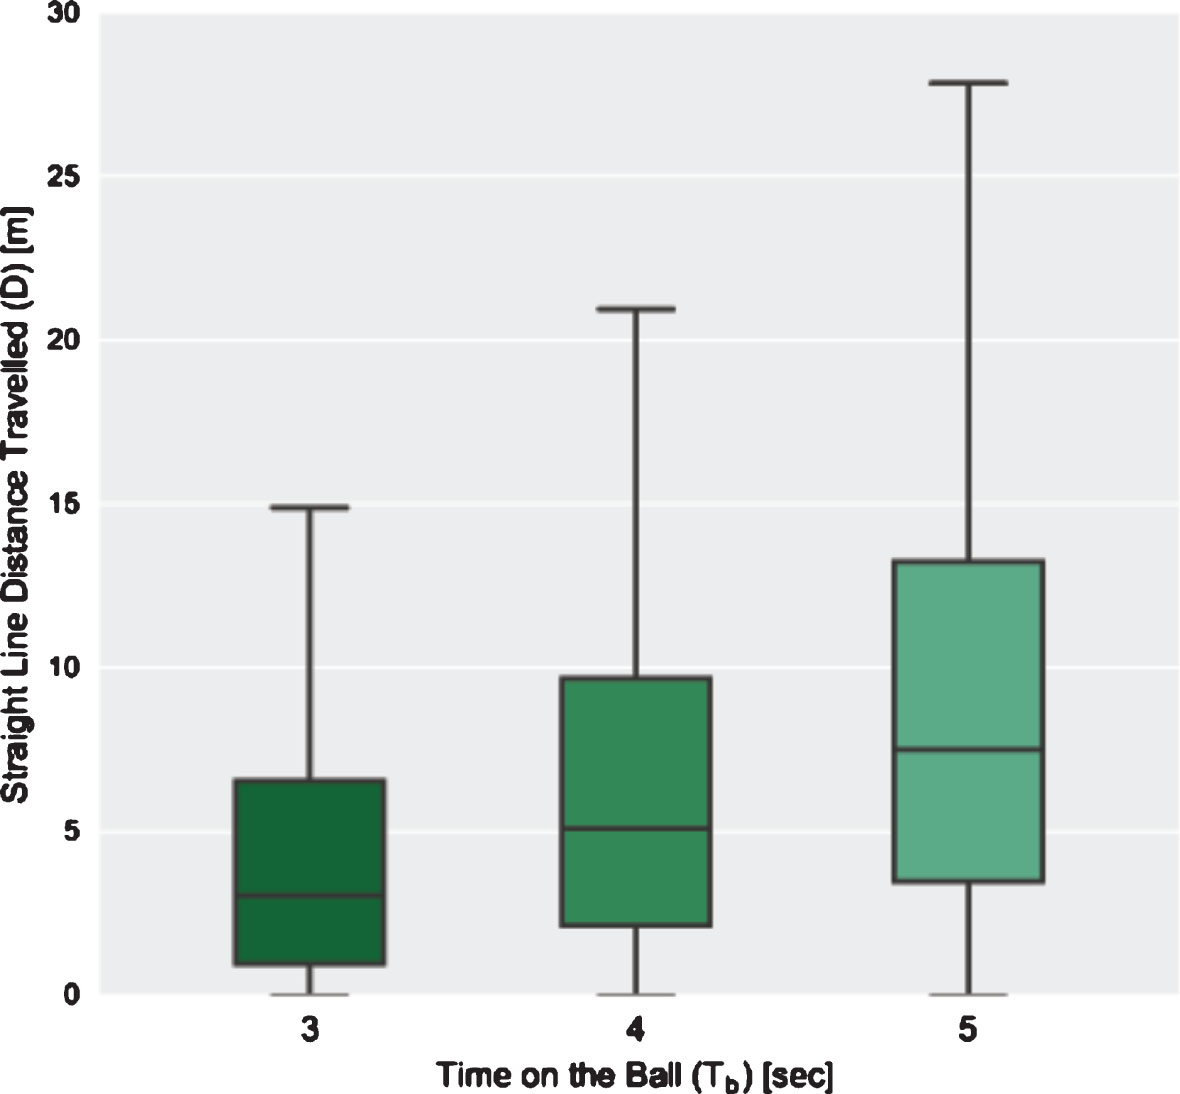
Distance travelled while on the ball is calculated by converting all pass coordinates to meters, using the appropriate pitch dimensions of all home team stadiums and subsequently calculating the straight line distance travelled using the end coordinates of the previous pass and the start coordinates of the current pass. In Fig. 13 we show the distribution of straight line distance travelled (D) for 3, 4 and 5 seconds on the ball (Tb) excluding outliers. We see that for 3 seconds the maximum lies at 15 meters and the first 75% of the data includes passes up to 6.5 meters. For 4 seconds the maximum lies at 21 meters, with 75% of data below 9.6 meters and for 5 seconds most passes are below 28 meters with 75% of passes shorter than 13 meters. We conclude that using 5 seconds is reasonable, considering most passes do not cover a length of more than 12.5% of the length of the pitch. Furthermore, we suggest that both these parameters (threshold and distance travelled) should be taken in to consideration while doing analyses of this kind in the future.
Fig.13
Travel distance between passes.
7Conclusion
In this article, we show how to utilize the flow motif methodology to analyze passing behavior in soccer. We use a large data set comprising 4 seasons of 6 major soccer leagues with over 8000 matches, over 3500 unique players and 155 unique teams. This methodology was applied to both teams and individual players to analyze their possession game as well as their goal attempts. We also show how to interpret the results and draw insights from them. Our contribution also helps representing the motifs in a novel way – by using the radar graphs which are very useful to compare players or teams across various seasons.
Unique styles for both teams and players can be found by clustering them based on their motif use. We find that Paris Saint-Germain is in a cluster by itself indicating its unique style, and FC Barcelona and Bayern Munich are in their own cluster, being heavily influenced by Pep Guardiola. We identify three players with unique styles; Iniesta, Rafinha and Denswil. We find that players with similar styles can be scouted easily by searching for those with similar motif use. This aided us in the search for the heir to Xavi’s throne, the identification of possible replacements for Özil and Monreal, and the hypothetical replacement for Wenger at Arsenal.
These analyses can be extended to identify differences in styles between the two halves of the game, whether a change in the style of a team follows a certain trend and even analyze two players simultaneously by studying their joint passing behaviour and impact on team performance. Powered by the availability of data and this analysis, it is now possible to explore many more questions about the sport providing us with valuable insight that has strategic implications on the game.
References
[1] | Bialkowski,A. , Lucey,P. , Carr,P. , Yue,Y. , Sridharan,S. and Matthews,I. (2014) , Largescale analysis of soccer matches using spatiotemporal tracking data, In 2014 IEEE International Conference on Data Mining, IEEE, pp. 725–730. |
[2] | Clemente,F.M. , Couceiro,M.S. , Martins,F.M. , Mendes,R. and Figueiredo,A.J. (2013) , Measuring tactical behaviour using technological metrics: Case study of a football game, International Journal of Sports Science & Coaching, 8: (4), 723–739. |
[3] | Clemente,F.M. , Couceiro,M.S. , Martins,F.M.L. and Mendes,R.S. (2015) a, Using network metrics in soccer: A macro-analysis, Journal of Human Kinetics, 45: (1), 123–134. |
[4] | Clemente, F.M. , Martins, F.M.L. , Wong, D.P. , Kalamaras, D. and Mendes, R.S. (2015) b, Midfielder as the prominent participant in the building attack: A network analysis of national teams in FIFAWorld Cup 2014, International Journal of Performance Analysis in Sport, 15: (2), 704–722. |
[5] | Comaniciu, D. and Meer, P. (2002) , Mean shift: A robust approach toward feature space analysis, IEEE Transactions on Pattern analysis and Machine Intelligence, 24: (5), 603–619. |
[6] | Fukunaga, K. and Hostetler, L. (1975) , The estimation of the gradient of a density function, with applications in pattern recognition, IEEE Transactions on Information Theory, 21: (1), 32–40. |
[7] | Georgescu, B. , Shimshoni, I. and Meer, P. (2003) , Mean shift based clustering in high dimensions: A texture classification example. In Computer Vision, 2003, Proceedings. Ninth IEEE International Conference on, IEEE., pp. 456–463. |
[8] | Goldsberry, K. (2012) , Courtvision: New Visual and Spatial analytics for the NBA, In 2012 MIT Sloan Sports Analytics Conference. |
[9] | Grunz, A. , Memmert, D. and Perl, J. (2012) , Tactical pattern recognition in soccer games by means of special self-organizing maps, Human Movement Science, 31: (2), 334–343. |
[10] | Gyarmati, L. and Hefeeda, M. (2015) , Estimating the maximal speed of soccer players on scale, In Proc Machine Learning and Data Mining for Sports Analytics Workshop. |
[11] | Gyarmati, L. , Kwak, H. and Rodriguez, P. (2014) , Searching for a unique style in soccer, arXiv preprint arXiv:1409.0308. |
[12] | Macdonald, B. (2012) , An Expected Goals Model for Evaluating NHL Teams and Players. http://www.sloansportsconference.com/wp-content/uploads/2012/02/NHLExpected-Goals-Brian-Macdonald.pdf. |
[13] | Milo, R , Shen-Orr, S , Itzkovitz, S , Kashtan, N , Chklovskii, D and Alon, U. (2002) , Network motifs: Simple building blocks of complex networks, Science, 298: (5594), 824–827. |
[14] | Pena, J.L. (2014) , A markovian model for association football possession and its outcomes, arXiv preprint arXiv:1403.7993. |
[15] | Pena, J.L. and Navarro, R.S. (2015) , Who can replace Xavi? A passing motif analysis of football players, arXiv preprint arXiv:1506.07768. |
[16] | Pena, J.L. and Touchette, H. (2012) , A network theory analysis of football strategies, arXiv preprint arXiv:1206.6904. |
[17] | Pollard, R. (1986) , Home advantage in soccer: A retrospective analysis, Journal of Sports Sciences, 4: (3), 237–248. |
[18] | Shortridge, A. , Goldsberry, K. and Adams, M. (2014) , Creating space to shoot: quantifying spatial relative field goal efficiency in basketball, Journal of Quantitative Analysis in Sports, 10: (3), 303–313. |
[19] | UEFA ((2016) ). UEFA Guide to Quality Stadiums. http://www.uefa.org/MultimediaFiles/Download/EuroExperience/competitions/General/01/74/38/69/1743869_DOWNLOAD.pdf. Accessed: 2016-11-03. |


