
Improving fairness in match play golf through enhanced handicap allocation
Abstract
In amateur golf, lower handicap players “give strokes” to higher handicap players based on their handicap differential to make head-to-head matches fairer. In match play, the standard way to allocate handicap strokes uses the “course-defined hole ranking”. Using a bootstrapped simulation of over 70,000 matches based on 392 rounds of golf, we first show that the standard stroke allocation method and course-defined hole ranking favor the better player in 53% of matches. Then, we investigate the impact of three potential changes to stroke allocation: modifying the hole ranking; giving both players their full handicaps instead of using handicap differential; awarding extra strokes to the weaker player. Our two primary findings are: 1) fair matches can be achieved by giving the weaker player 0.5 extra strokes, which corresponds to a tie-breaker on a single hole; 2) giving both players their full handicap makes the fairness results robust to different hole rankings. Together, these simple changes can improve fairness in match play golf and improve generalizability to other courses.
1Introduction
Golf competitions typically take one of two formats: stroke play and match play. In stroke play (also known as medal play), a player’s score is the sum of his/her scores on the individual holes. Stroke play, in which the player with the fewest strokes wins the match or tournament, is the basis for professional, high-level amateur golf and some club competition. On the other hand, most informal competitions between groups of friends and a few club tournaments take place under some variant of match play. In match play, the unit of competition is a hole; a player (or team) wins a hole by completing that hole in fewer strokes than their opponent. The winner of the match is the player (or team) who wins the most holes. If the match ends in a tie, extra holes may be played to determine a winner.
Since golfers have varying ability, national golf organizations including the United States Golf Association (USGA) and Golf Canada have developed methods for establishing handicaps so as to make competitions fairer (United States Golf Association, 2016, Golf Canada, 2016). The computation of individual handicaps has changed over time; compare Scheid (1972) and Pollock (1977) to Swartz (2009). As well, computation varies internationally; see McHale (2010) for a discussion of the United Kingdom and European handicap systems.
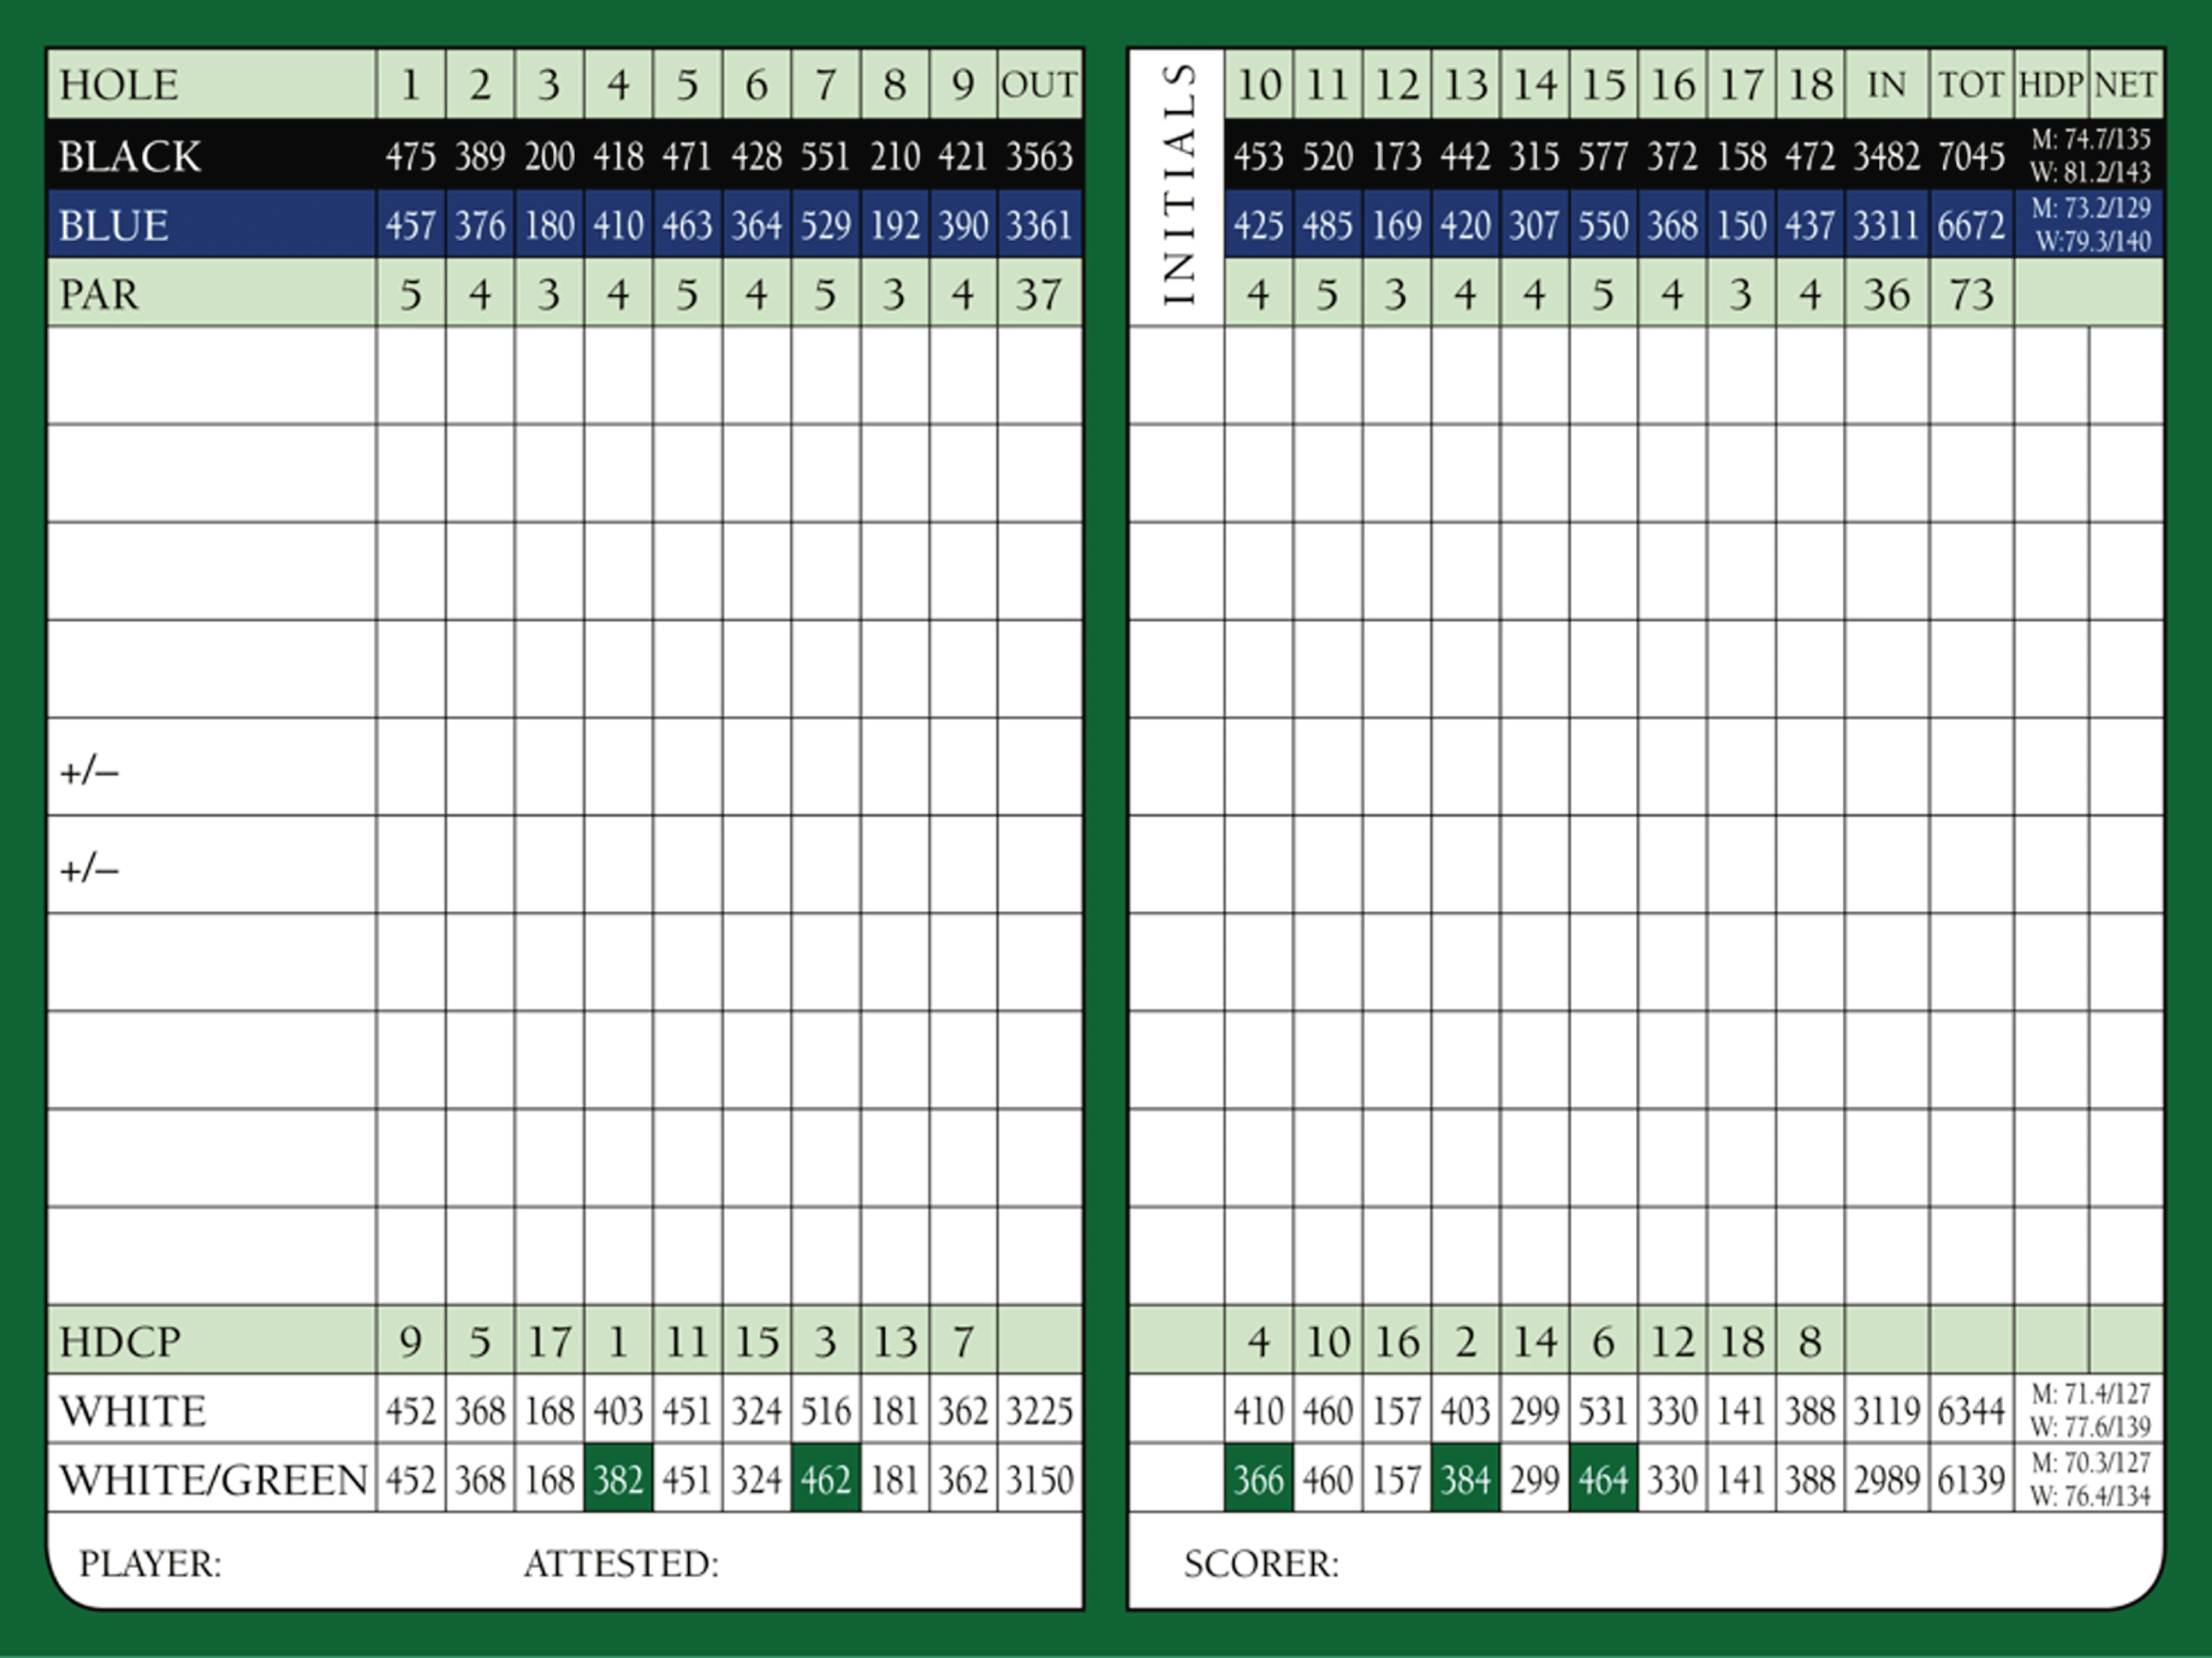
Roughly speaking, handicaps provide an indication of how a player scores relative to par when playing his or her best. Currently in both the US and Canada, a player’s handicap is based on his/her last 20 rounds of play and is computed as follows. “High” scores on each hole are truncated under Equitable Stroke Control (ESC) and an adjusted score is computed. What is meant by “high” is determined by a player’s handicap; for example “high” equals seven for handicaps between 10 and 19 regardless of the par of the hole. Using the course and tee specific “slope and rating” (see Fig. 1) each adjusted round score is converted to an “index” (Swartz (2009) provides a thorough discussion of this point). The 10 lowest indices are averaged and then multiplied by 0.96 and rounded downward to the nearest tenth to obtain the player’s index (United States Golf Association, 2016, Golf Canada, 2016). The multiplier of 0.96 is sometimes referred to as the “bonus for excellence” (Knuth, 2008). For competitions, the index is converted to a handicap by again adjusting for course difficulty. A large proportion of recreational golfers have handicaps between 10 and 20 (roughly 58% of golfers in our dataset; about 50% of golfers according to Golf Digest (2014)), while professionals and outstanding amateurs may have handicaps below zero. A player with a zero handicap is called a scratch golfer.
Fig.1
Scorecard from Shaughnessy Golf and Country Club in Vancouver, Canada, showing course-defined hole rankings (“HDCP”). From the white tees, the course has a rating of 71.4 and a “slope” of 127 for men (M).
In a competition involving handicaps, the stronger, or lower handicap player, “gives” strokes to the weaker or higher handicap player based on the difference in their handicaps. For example if Player A has a handicap of 12 and Player B has a handicap of 16, then in a match between them, Player A gives Player B four strokes. In stroke play, at the end of a round, each player’s handicap is subtracted from his or her gross score (when there are only two players, the net effect is that four stokes are subtracted from the score of Player B). After this adjustment, the player with the lower handicap-adjusted score wins the match. Such logic also applies to casual multi-player tournaments where each player’s handicap is subtracted from his/her score and the player with the lowest net score wins.
However, in match play, the allocation of handicap strokes is more complex. A golf course assigns a rating to each hole – see the row “HDCP” on the scorecard in Fig. 1. In a match between Player A with a handicap of 12 and Player B with a handicap of 16, Player A will give four strokes to Player B on the holes with HDCP ratings 1 to 4. In this hypothetical match, Fig. 1 shows that these are holes 4, 13, 7 and 10. On each of these four holes, Player B will subtract one from his/her score, after which the two players tie or the player with the lower score wins the hole (Knuth, 2011).
Note that the “hole handicap” (HDCP in Fig. 1) is a completely different construct than the player handicap. We refer to the ranking of holes according to the hole handicap as the course-defined hole ranking. Most golfers believe that the hole that is ranked 1 (hole 4 on the scorecard in Fig. 1) is the most difficult and the hole that is ranked 18 (hole 17 on the scorecard) is the easiest on the course. However, this is not the intent of such rankings. Their purpose is to enable two golfers with unequal skills to have a fair match. For example, one method to generate hole handicaps is to compare the average performance of low handicappers on each hole to the performance of mid to high handicappers on the same hole. Holes are then ranked in descending order of the difference in performance between these two groups (see Section 17 of United States Golf Association (2016) or pg. 106 of Golf Canada (2016)). It is also common practice in North America to assign odd rankings to the first nine holes and even rankings to the last nine holes so as to be useful for stroke allocation in nine-hole matches (United States Golf Association, 2016, Golf Canada, 2016).
The purpose of this paper is to investigate the following questions regarding the design of handicapped match play competition:
1. Does the customary allocation of strokes to holes result in fair matches?
2. Would it be fairer if both players in a match received their full handicap?
3. Are there other methods of allocating stokes to holes that would be fairer?
4. Can fairness be achieved through awarding extra stokes to a player or altering their handicap prior to allocating stokes?
Questions 1 and 4 have been examined to some extent in the literature, which we describe below. To our knowledge, this is the first paper to simultaneously investigate the impact of allocating golfers their full handicap in match play, compare the effect of hole rankings on match play fairness, and compare additive versus multiplicative approaches for giving extra handicap strokes to a golfer, all in one paper. In particular, modifying hole rankings and measuring their effect on fairness has not been previously studied.
We consider two notions of fairness in our analysis. By overall fairness we mean that the probability either player wins a match is 0.5, regardless of the handicap differential between the two players. By uniform fairness we mean that for each handicap differential, the probability either player wins the match is 0.5. For example, a handicap system where lower handicappers are advantaged for small handicap differentials while higher handicappers are advantaged for large handicap differentials may achieve overall fairness when the win probability is averaged over all handicap differentials, but would not satisfy uniform fairness. On the other hand, uniform fairness implies overall fairness by definition.
Our paper proceeds as follows. In Section 2, we review relevant literature. In Section 3, we describe our data and some preliminary observations derived from the data. Section 4 describes our approach to simulating matches and bootstrapping outcomes from the data so as to assess the fairness of the current approach to using handicaps in match play. In Section 5, we examine three potential changes to the handicapping system that have the potential to improve overall fairness. Then, in Section 6, we report the results of match simulations quantifying the effect of these changes on both overall and uniform fairness. The concluding section provides a summary, recommendations and some related research opportunities.
2Literature
The impact of handicapping on match outcomes has been studied since the 1970’s. Almost all research found some bias in favor of the low handicap player and focused primarily on stroke play. Most have sought to improve overall fairness through modifying the way in which a player’s handicap is calculated. In contrast, this paper takes the handicap as given and seeks ways to increase fairness by changing how handicap strokes are allocated throughout a match.
Research on golf handicapping has used empirical modeling, simulation, probability models or some combination of the above. Scheid (1972) used hole-by-hole scores for 20 rounds of 50 players as the basis of a simulation of match and stroke play. He compared outcomes on the number of strokes allocated to the weaker player and found that when the full handicap was given, the stronger player had a distinct advantage in both stroke and match play, and that adding additional strokes was required to achieve fairness. In the latter case, the number of strokes required to achieve fairness varied with the handicap difference.
Subsequently, Pollock (1977) developed a probabilistic model of a golf match to investigate the effects of handicaps and consistency on stroke and match play outcomes. Through numerical calculations based on normal approximations to hole-by-hole scores he showed that the weaker player is at a disadvantage in both stroke and match play, but that in most cases the weaker player will have a better chance in match play than in stroke play.
Subsequent papers focused on changing handicap computation to achieve fairness. Bingham and Swartz (2000) investigated the likelihood that the higher handicap player wins in medal play when both are playing well. Note that between the 1970’s papers cited above and this paper, the USGA introduced the index system and Equitable Stroke Control to increase the fairness of handicapped matches. This was the first paper to investigate fairness under the modern handicap system. Using an empirically driven probabilistic model, they concluded that the higher handicap (i.e., weaker) player has an advantage when both players are playing well. Consequently, they derive a complex adjustment to handicap calculations to achieve fairer results.
Kupper et al. (2001) used empirical data and some calculations based on the normal distribution to show that the handicap system ignores player consistency or variability and that a low handicap, consistent player has a distinct advantage over a higher handicap more variable player. They suggested that the handicap be based on an average or trimmed mean of the last 20 rounds, not just the best 10.
Swartz (2009) described a modification to the handicapping system that would improve interpretability and fairness, considering both casual and tournament play. For casual play, he proposed an index based on a weighted average of the best 16 out of 20 previous rounds in which the weights are derived so that the probability a player “shoots his handicap” is 0.5. For tournament play, he provided a more complex adjustment based on consistency. In addition, using data from 8,000 rounds for 178 golfers, he explored how changes to Equitable Stoke Control (ESC) impact the percentage of time a player shoots his/her handicap and overall performance in stroke play. He concluded that under both metrics some form of ESC is better than none. Swartz (2011) reported results of a study he carried out for the Royal Canadian Golf Association (RCGA), now known as Golf Canada, on Equitable Stroke Control. His analysis led to the RCGA adopting the same approach as the USGA to ESC.
McHale (2010) conducted a thorough analysis on the fairness of the handicap system in the United Kingdom (UK). In addition to providing an in depth description of the differences between the UK and North American handicap systems, he employed logistic, multinomial and generalized ordinal regression models to investigate fairness. Using hole-by-hole scores from 646 rounds of golf played on 26 “tournament” days, together with player handicaps, he concluded that lower handicap players have a significantly higher likelihood of winning a tournament after adjusting for handicap. Moreover, he investigated the effect of a wide range of covariates on the hole score (e.g., birdie, par, bogey) as represented by a discrete variable. Among other results, he showed that the hole score is correlated with the course-defined hole ranking; players tended to score higher on the holes ranked closer to one. Using his models, he simulated results of multi-player stroke play and match play tournaments and concluded that lower handicap players have an increased probability of winning the tournament. Finally, he developed a multiplicative handicap adjustment factor to increase the likelihood that all players have an equal probability of winning a tournament. Although it is customary for players not to be allocated their full handicap in informal tournaments, he showed that a factor of 1.2 achieves fairness in stroke play tournaments and 1.24 in match play tournaments. Under this allocation, in match play the stronger player will give the weaker a player an additional stroke above the handicap differential for each four unit increase in handicap differential. Thus if the handicap differential is 8, the stronger player will give the weaker player 10 strokes.
The impact of handicapping on match outcomes has also been explored in team matches. Hurley and Sauerbrei (2015) examined the fairness of net best-ball team matches and found that applying handicaps designed for individual competition do not necessarily result in fair competitions in team matches.
3Data
Investigating the impact of handicap stroke allocation on match play outcomes requires both reliable handicaps and hole-by-hole scores for a sufficient number of golfers with varying skill levels. We obtained our data from Shaughnessy Golf and Country Club (SGCC) in Vancouver, Canada, where the third author is a member. This dataset contains results from four casual stroke play tournaments held during the 2015 golf season, where all rounds were played from the white tees. For each tournament, hole-by-hole scores for each golfer were provided by SGCC by extracting them from the Impact Tournament Systems event-scoring database (www.impactts.ca) and player handicaps on the day of the tournament were downloaded from the Golf Canada handicap database. In total, data from 392 player-rounds were recorded, played by 266 players (some players competed in more than one event). A single record consists of a player handicap and scores on each of the 18 holes.
Although the data was obtained from stroke play events, we believe that the hole-by-hole scores are reliable for our intended analysis of match play outcomes. In fact, we believe that match play data, even if it was available, would not be as useful for our purposes because there may not be scores for some holes; holes are often conceded and players adopt different strategies in real-time based on the performance of the other player. This raises the interesting question of determining whether players’ strategies in match play affect outcomes, but this would require a very different data set to investigate.
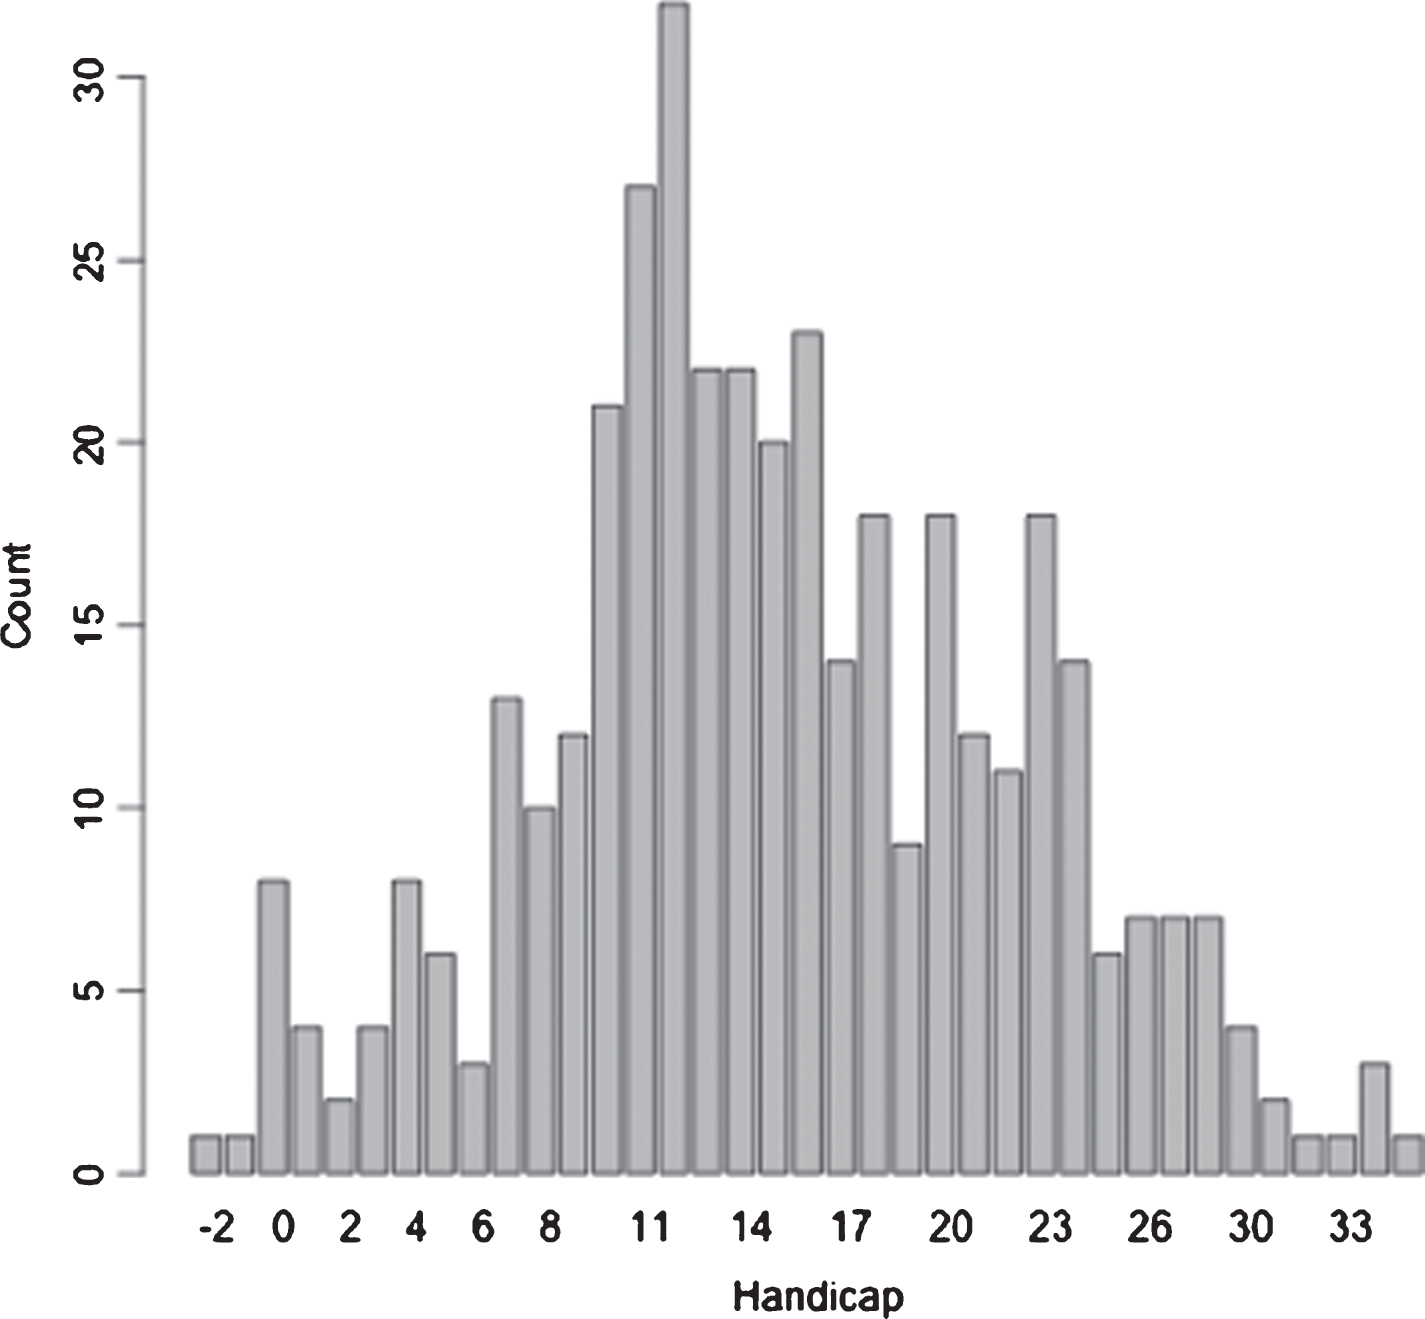
Figure 2 shows the distribution of handicaps in the dataset. They range from -2 (professional or elite amateur) to 35 (very poor player). The average handicap is 15.2 and the standard deviation is 7.2. Observe that Fig. 2 has a similar shape to the handicap distribution in Fig. 1 in Swartz (2009). Moreover, in the U.S., the average men’s handicap (adjusted for SGCC) was 16 (Golf Digest, 2014) suggesting that our dataset was representative of the broader population.
Fig.2
Distribution of handicaps of players in our dataset.
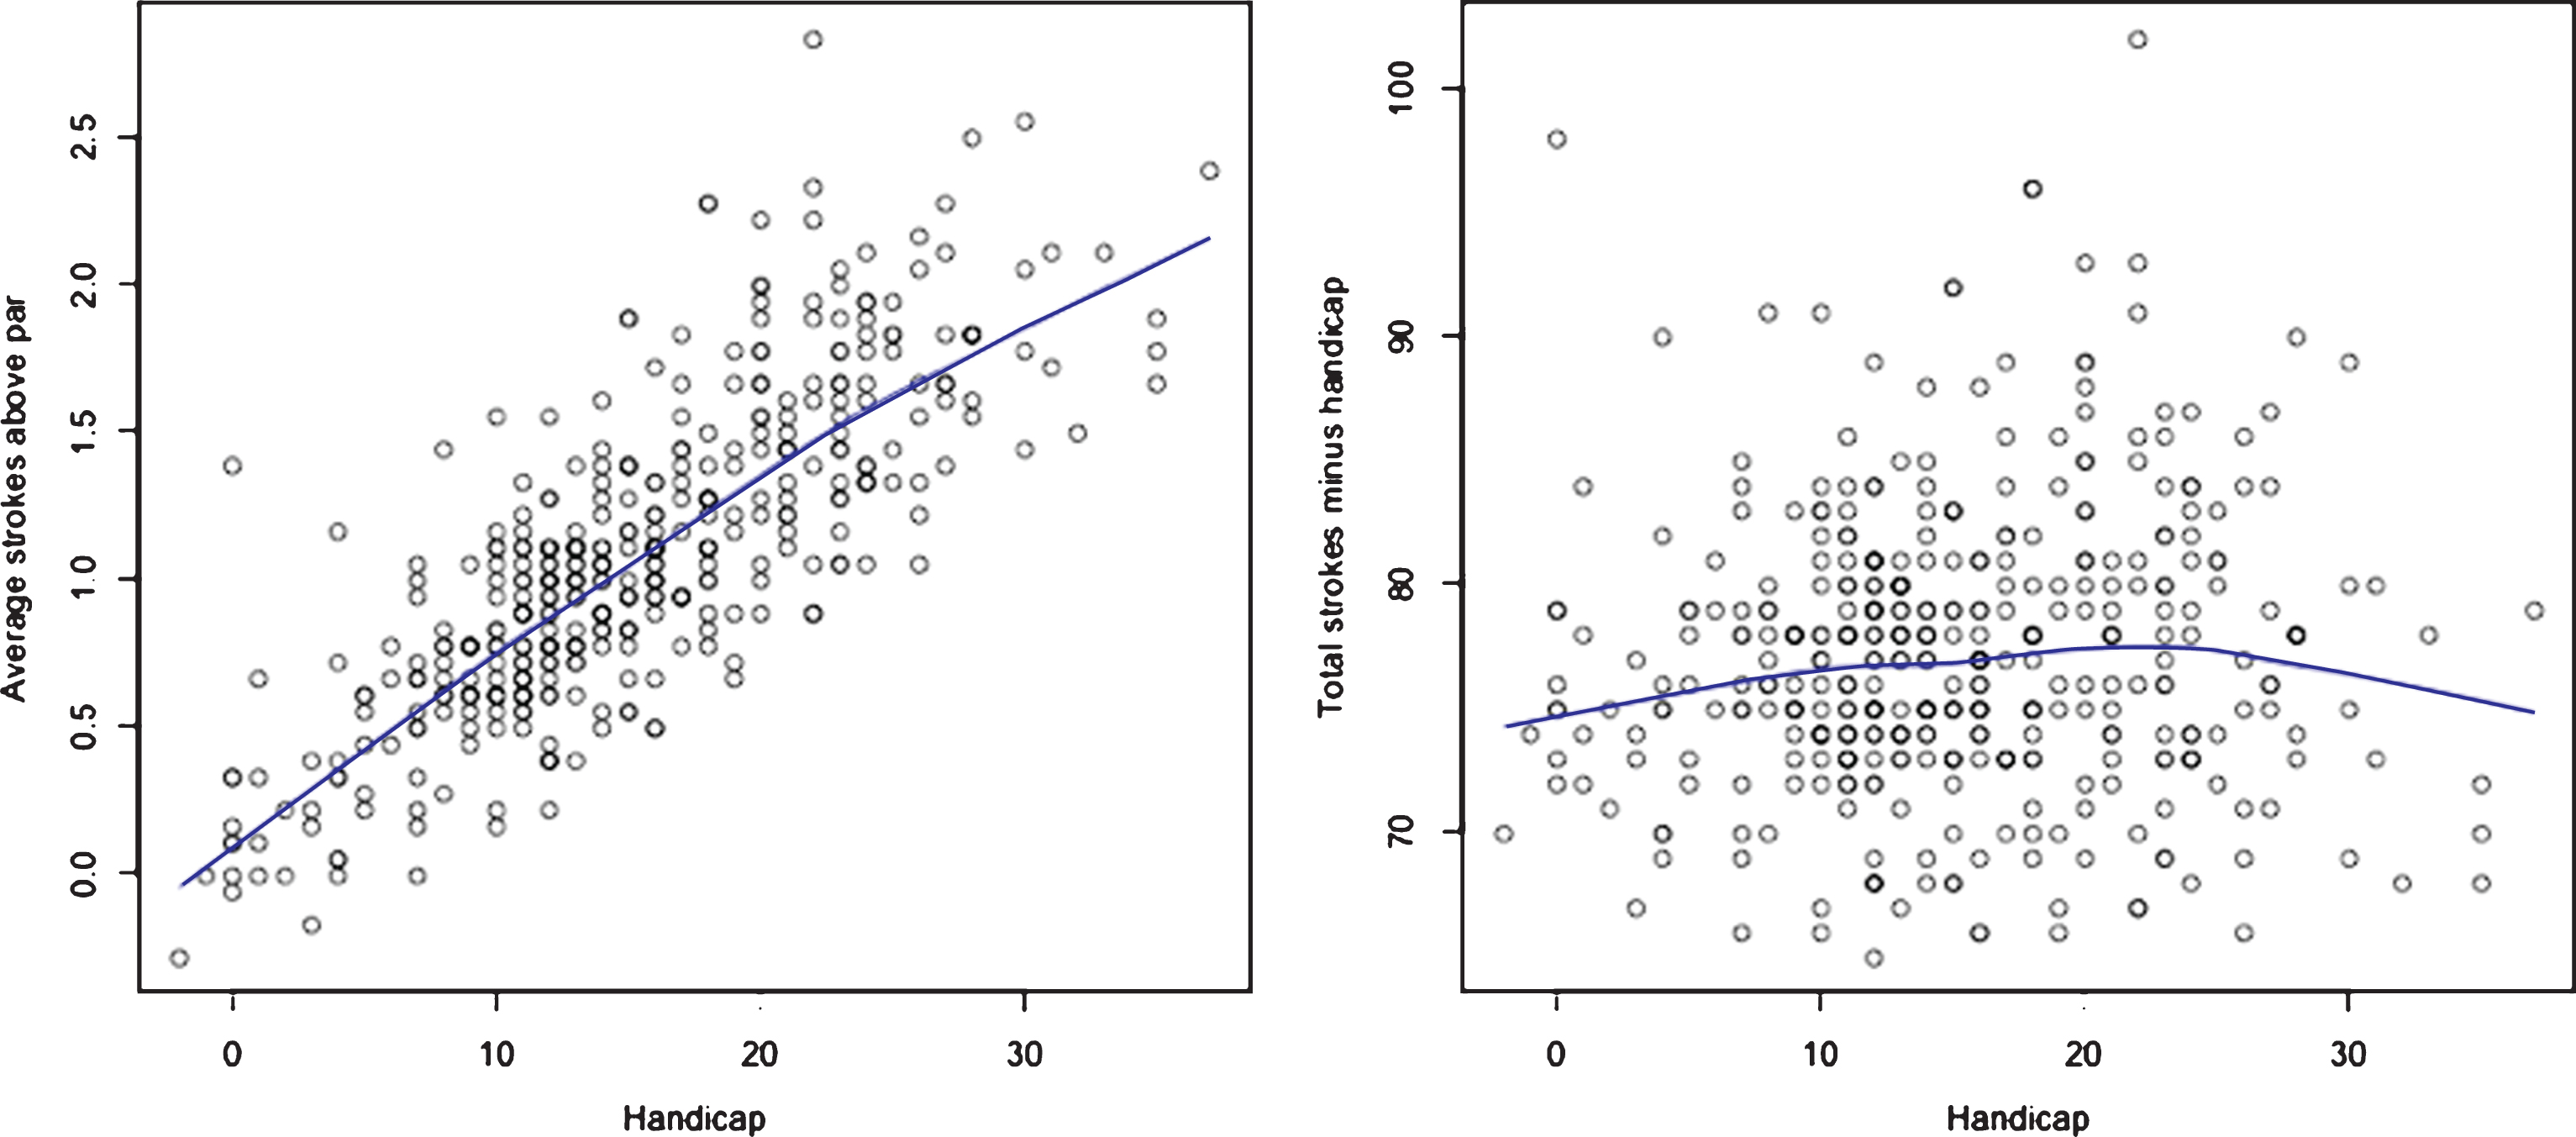
The left hand graph in Fig. 3 shows the average number of strokes above par per hole plotted against players’ handicaps. The positive trend shows that these players’ handicaps are fairly representative of their performance. The right hand plot in Fig. 3 provides an alternative representation of the same data where the net or handicap-adjusted round score (total strokes minus handicap) for each player is plotted against their handicap. It shows that net score tends to be higher and more variable for middle and high handicappers (>10) than for low handicappers (<10). This observation suggests that even after adjusting for handicaps, there might be a tendency for better players to outperform less skilled players. The observed decrease in net score after 22 handicap is a result of few data points and does not indicate a significant trend.
Fig.3
Scores as a function of handicap. The left hand graph shows the strokes above par averaged over holes within a round as function of handicap and the right hand graph shows the net round score. The solid lines represent Lowess smoothing of the data as computed by R (R Core Development Team, 2008).
4Simulating matches and determining fairness of the current handicap system
4.1Bootstrap simulation approach
We simulate match play by first identifying all pairs of player-rounds in our dataset, excluding those where the players had the same handicap since the match outcomes would not depend on the stroke allocation mechanism. In total, there were 73,512 such player-round pairs. To compute overall win percentages we sampled with replacement (i.e., bootstrapped) 73,512 matches from the set of all player-round pairs, 10,000 times. Bootstrapping (Efron, 1979) allows us to obtain a confidence interval for the win percentage estimate based on the empirical distribution of the 10,000 bootstrap samples. For uniform fairness, we computed a win percentage and confidence interval at each handicap differential. To do so, we sampled only from the matches at the specified handicap differential. The number of matches sampled at each handicap differential was equal to the total number of matches at that differential. We again repeated this process 10,000 times to generate means and confidence intervals.
For each match, we compared each players’ hole-by-hole score to determine the winner, after adjusting for any handicap strokes given on each hole. The player who won the most holes won the match. Similar to McHale (2010), if the match is tied after 18 holes, we use a tie-breaker to determine the winner. In the tie-breaker, the match is re-started from the first hole, and is played one hole at a time. The first player to win a hole wins the match. In the tiebreaker, handicapping rules continue to apply.
4.2Overall fairness of the current handicap system
Under a fair handicap system, the winning percentage of the lower handicap player should be approximately 50%. Our simulation showed that this winning percentage was 53.1% with a 95% confidence interval of [52.7%, 53.4% ]. This result indicates a bias towards the better player. For context, note that a 53.1% winning percentage in gambling translates to an edge of 6.2% for the better player, which exceeds the house edge of many popular casino games (e.g., Baccarat: ∼1%, Blackjack:<1%, Caribbean Stud: ∼5%, War: ∼3%, Roulette: ∼3–5%, Video Poker:<1%). Without a tiebreaker (ties occurred in 8.4% of the simulated matches) the lower handicapper player won 53.2% of non-tied matches.
We also computed outcomes under stroke play for validation with other studies. In this case, the lower handicap player won 53.3% of the non-tied matches with 5.4% of the matches being tied. Surprisingly, these results are almost identical to those for match play under the current rules. Our numerical results for match and stroke play are comparable with other results reported in the literature. For example, Swartz (2009) reported a win percentage of 52% for the lower handicap player in stroke play. McHale (2010) reported stroke play and match play tournament win percentages in the range 50–60% for handicap differentials representative of the majority of the matches in our simulation. However, we note that the results in McHale (2010) are based on the UK handicapping system, which is different from the Canadian system used in this paper.
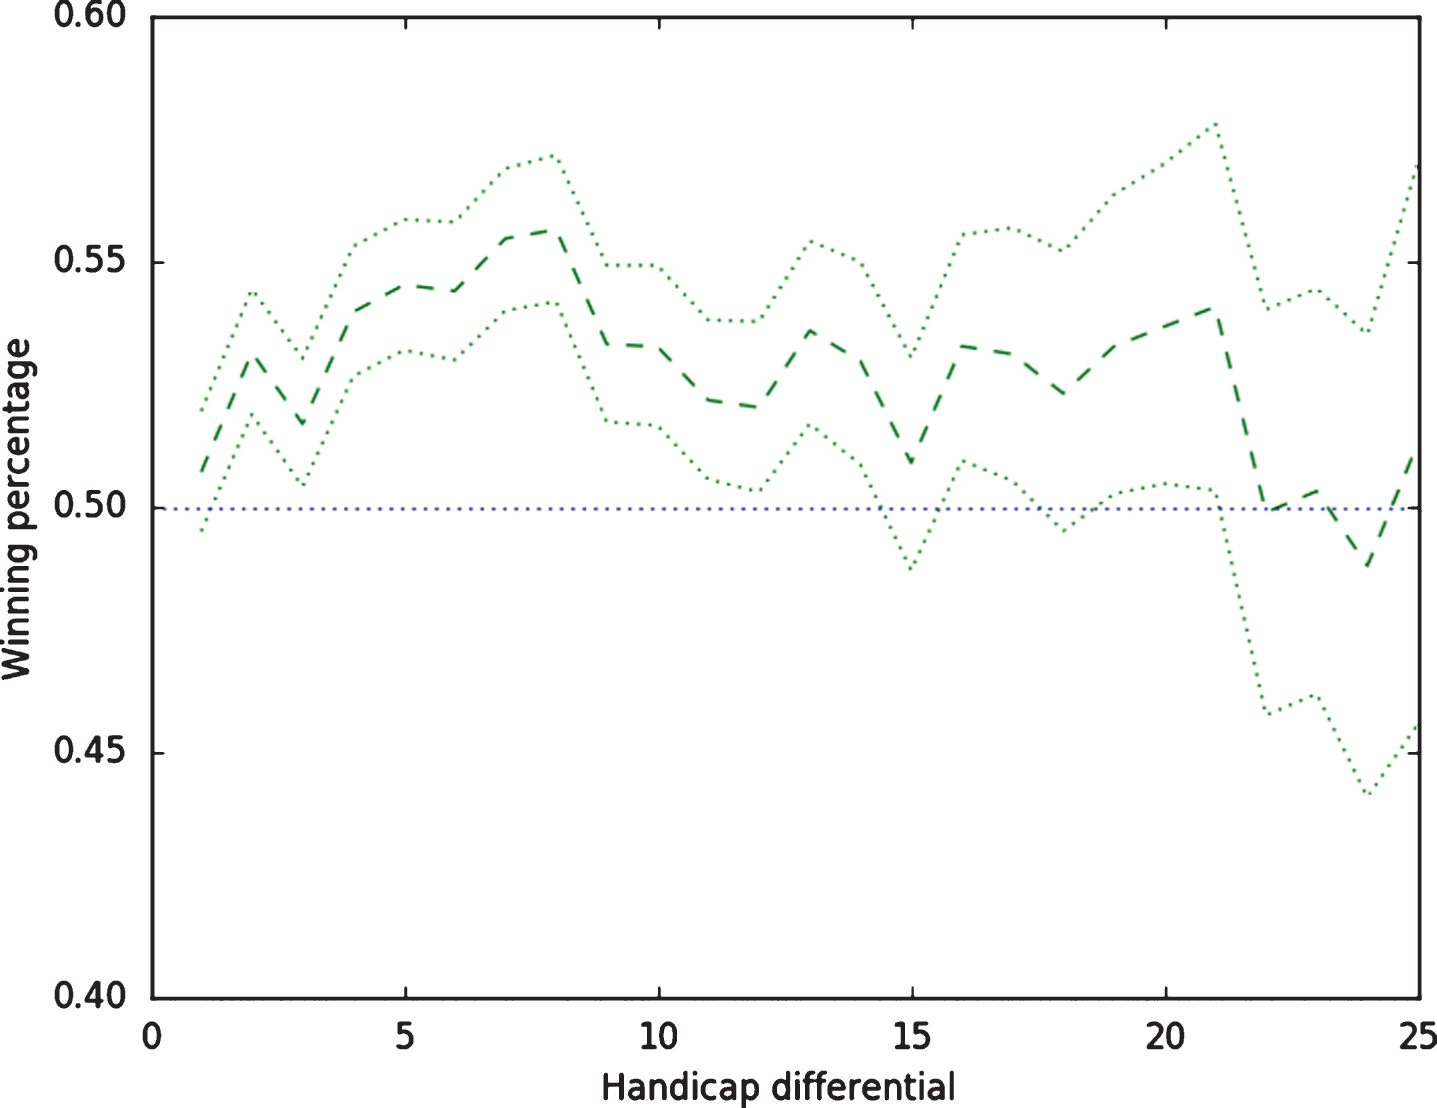
Figure 4 shows how the win percentage of the lower handicap player varies with the difference in handicap between the players. For almost all handicap differentials, the lower handicap player won more than 50% of the matches. The results at large handicap differentials may be less reliable because of smaller sample sizes, which results in the larger confidence intervals at those differentials. Overall, our results show that the current stroke allocation method biases match play in favor of the lower handicap player.
Fig.4
Winning percentage (in handicapped match play with a tie-breaker) and 95% bootstrap confidence intervals of the lower handicap golfer as a function of the difference in handicap between the two players. The number of matches per handicap differential decreased from 6,146 matches with a differential of one to 1 match with a differential of 39. There were 3,698 matches with a differential of 10 and 909 with a differential of 20.
5Levers to improve match play fairness
We next explore three changes (separately and combined) that might lead to fairer matches. In particular, we:
1. Develop three new hole rankings that systematically change the holes on which strokes are allocated;
2. Allocate each player his/her full handicap, thus changing the holes on which the handicap differential is applied;
3. Vary the number of extra strokes given to the higher handicap player by additively or multiplicatively adjusting handicaps.
5.1Changing hole rankings
As described previously, currently, the higher handicapper receives strokes based on the course-defined hole rankings. In this section, we propose three other hole rankings that alter the holes on which the higher handicapper receives strokes.
5.1.1Optimized hole ranking
We begin by determining whether there exists a hole ranking that makes it possible to achieve overall fairness. We do this by using a heuristic optimization procedure that changes hole rankings so as to minimize the win percentage for the lower handicap player. Consequently, if the minimum win percentage is less than 50%, then it is possible to achieve fairness with some hole ranking in theory. We note that since a heuristic is not guaranteed to find a globally optimal solution, it may be possible that fairness is achieved by some hole ranking even if the minimum win percentage found by the heuristic procedure is strictly greater than 50%. The optimization was carried out under two stroke allocation procedures, the current one (based on handicap differential) and a new cumulative one described in Section 5.2.
The optimization heuristic is as follows. First, we generate 100 random hole rankings and compute the win percentage for each by simulating matches. We identify the ranking with the lowest win percentage (all were greater than 50%). Using this ranking as the initial solution, we swap a pair of neighboring holes in the ranking and re-simulate matches. If the new ranking does not improve the win percentage, the original ranking remains the incumbent and the process is repeated with the next pair of holes in the ranking. If the new ranking improves the win percentage, it becomes the incumbent and the process is repeated with the previous pair of holes in the ranking. That is, if swapping holes j and j + 1 improves the win percentage, then the search continues by considering the swap of hole j-1 and (new) hole j. This approach essentially “bubbles up” holes to the top of the ranking if the swap improves the win percentage. The algorithm starts by considering the swap of holes 1 and 2 and terminates after evaluating the swap of holes 17 and 18 in the ranking.
5.1.2Empirical hole ranking
Since most golfers believe that the hole ranking reflects difficulty, we test this assumption by computing an empirical hole ranking that ranks holes on the basis of the average number of strokes above par, calculated from our data (see Fig. 5). In the left hand plot of Fig. 5, the holes are arranged from left to right using the course-defined hole rankings (HDCP row from scorecard in Fig. 1) and in the right hand plot, holes are ordered by average strokes above par.
Fig.5
Box plots and averages over all rounds of hole-by-hole scores. In the left hand plot holes are ordered on the horizontal axis using the course-defined handicap ranking. In the right hand plot the holes are ordered by empirical difficulty, defined as the mean strokes above par.
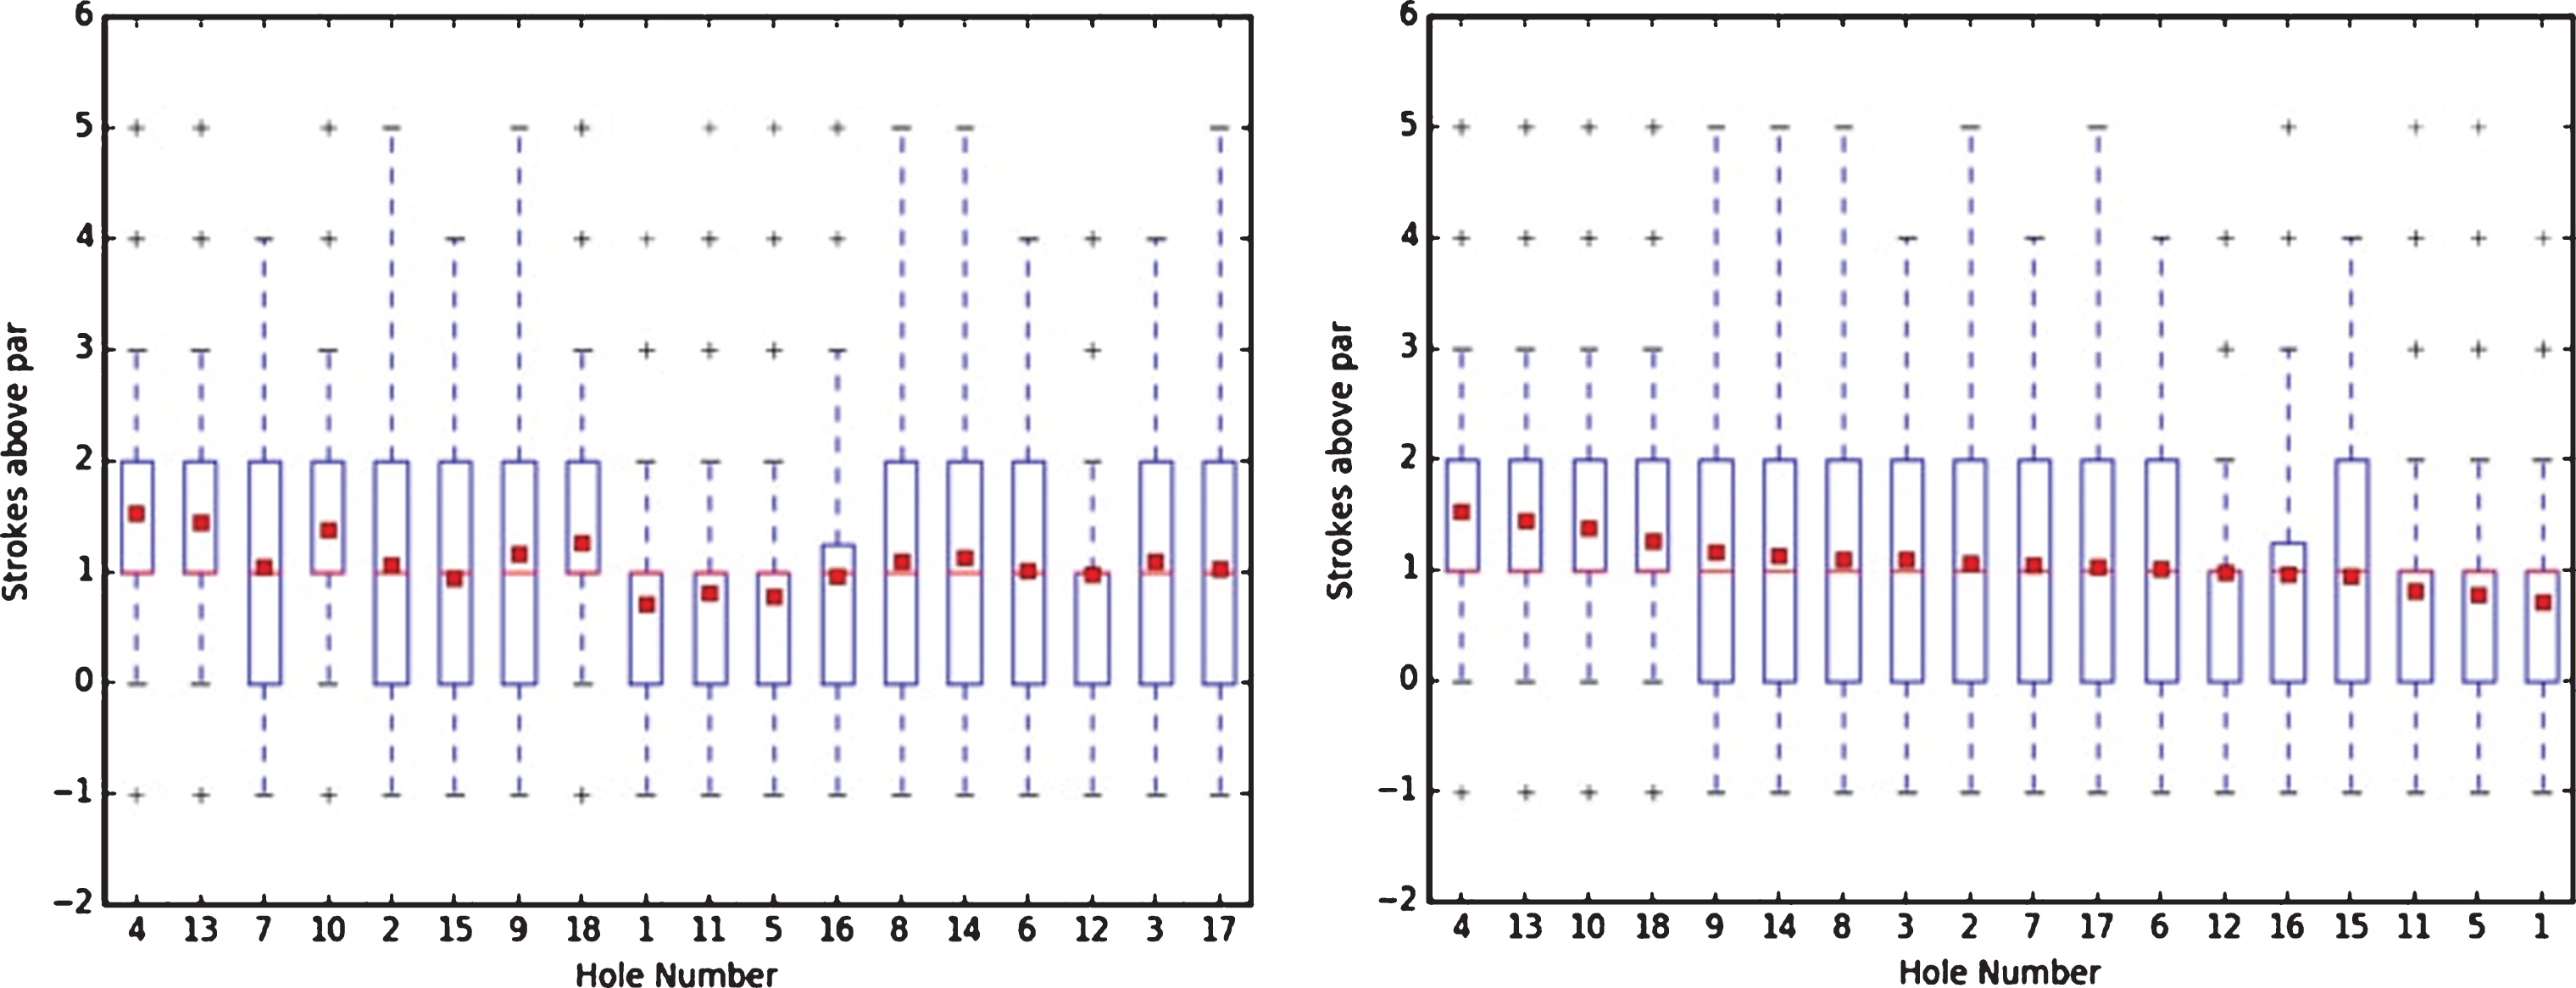
The plots show a clear difference in the rankings. Rankings agree on the two most difficult holes, 4 and 13, which at SGCC are long and challenging par 4 holes that averaged around 1.5 shots over par in our data. The biggest discrepancy between the course-defined ranking and the empirical ranking occurs on the par 3 holes (holes 3, 8, 12 and 17). The empirical data shows that these are indeed quite challenging, all averaging one or more strokes above par. The other major discrepancy is on the par 5 holes (holes 1, 5, 7, 12 and 15), which average one or fewer strokes above par. Thus, it appears that the par 4 holes are the most difficult, followed by the par 3’s and then the par 5’s. This empirical ranking is considerably different than the course-defined hole ranking, which is commonly believed to measure hole difficulty.1
5.1.3Gap hole ranking
The third ranking we consider is based on the difference (or “gap”) in performance between low handicap and high handicap players; such a ranking is in the spirit of that suggested by the Canadian and US Handicap Manuals (United States Golf Association, 2016, Golf Canada, 2016). The difference between the gap ranking and the course-defined ranking may provide insight into how hole rankings are determined at a course. This ranking is also motivated by the fact that the empirical difficulty ranking does not necessarily identify the holes where the difference in performance between lower and higher handicap players is most pronounced.
To derive this ranking, we segmented the players with handicap below 10 and above 20 into two groups and computed the difference in average strokes above par between these two groups of players for each hole. We then ranked holes in decreasing order of this difference. Figure 4 suggests that other handicap groupings may be applicable but we do not explore them here.
Table 1 shows the order of the holes under the gap hole ranking. Holes 5 and 11 rank first and second according to the gap ranking. This means that these holes are where the low and high handicappers differ most in terms of performance. Interestingly, these holes are par 5’s and are ranked as two of the easiest (17th and 16th, respectively) under the empirical ranking. Our hypothesis is that for longer holes, high handicappers have more chances of hitting a poor shot from which it is difficult to recover. On the other hand, low handicappers have more opportunity (and ability) to compensate for such errors. Thus, the “gap” between low and high handicappers is greater on these holes.
Table 1
Summary of hole rankings described in Section 5. The first column gives the (nominal) course hole number. Other columns provide the ranking of each hole under the different ranking schemes described in the header
| Hole | Course--defined | Empirical | Gap | Optimized (differential) | Optimized (cumulative) |
| 1 | 9 | 18 | 6 | 1 | 15 |
| 2 | 5 | 9 | 12 | 4 | 6 |
| 3 | 17 | 8 | 17 | 3 | 1 |
| 4 | 1 | 1 | 9 | 11 | 4 |
| 5 | 11 | 17 | 1 | 15 | 17 |
| 6 | 15 | 12 | 11 | 13 | 7 |
| 7 | 3 | 10 | 5 | 8 | 12 |
| 8 | 13 | 7 | 18 | 16 | 18 |
| 9 | 7 | 5 | 10 | 2 | 16 |
| 10 | 4 | 3 | 3 | 6 | 9 |
| 11 | 10 | 16 | 2 | 18 | 11 |
| 12 | 16 | 13 | 14 | 14 | 5 |
| 13 | 2 | 2 | 4 | 17 | 3 |
| 14 | 14 | 6 | 15 | 12 | 13 |
| 15 | 6 | 15 | 7 | 5 | 2 |
| 16 | 12 | 14 | 13 | 10 | 14 |
| 17 | 18 | 11 | 16 | 9 | 8 |
| 18 | 8 | 4 | 8 | 7 | 10 |
5.2Allocating both players their full handicap (cumulative stroke allocation)
The differential (current) method of stroke allocation in match play is based on the difference in handicaps. The match is played as if the stronger player has a handicap of zero and the weaker player has a handicap equal to the handicap differential. For example, if Player A’s handicap is 10 and Player B’s handicap is 14, Player B will receive strokes on holes ranked 1 through 4 under the course-defined hole ranking. We consider an alternative, which we refer to as the cumulative method, in which both players receive their full handicaps. The effect in match play is different than in stroke play because it changes the holes where the higher handicap player receives strokes. Continuing the above example, under the cumulative stroke allocation method, Player A will receive a stroke on course-defined holes ranked 1 through 10, while Player B will receive strokes on holes 1 through 14. The net effect is that Player A “gives” strokes to Player B on course-defined holes ranked 11 through 14. In contrast to the standard, differential method of giving player B a stroke on course-defined holes ranked 1 through 4, the proposed stroke allocation method aims to give a stroke to the higher handicap player on the holes where the difference in skill between the two players may be more pronounced. Note that in most individual and team stroke play tournaments, players receive their full handicaps but they are subtracted from their total score and therefore are not affected by hole rankings.
The optimized hole ranking described in Section 5.1.1 depends on the stroke allocation method. Consequently we optimized hole rankings based on both the differential and cumulative stroke allocation methods.
5.3Giving extra strokes to the higher handicap player
Last, we assess the impact of giving extra handicap strokes to the higher handicapper. We consider two different ways of doing this:
1. Additive: adding a constant number of strokes to the higher handicap player’s handicap, and
2. Multiplicative: multiplying both players’ handicaps by a constant factor (leading to the higher handicapper getting a bigger increase).
Previous authors consider related modifications. Scheid (1972) considered adding full strokes only and McHale (2010) considered a multiplicative increase in handicaps under the UK system.
For the additive case, we consider adding 0.5, 1, or 2 to the handicap of the higher handicapper. By giving 0.5 strokes to the higher handicapper, the half stroke serves as a tie-breaker. If the score is tied on the hole to which the half stroke is added, the higher handicap player wins the hole. It has no impact if either player wins the hole outright. Of course, the holes where any extra strokes are implemented will be dictated by the stroke allocation method and the hole ranking that is used. Note that we did not derive new optimized hole rankings when adding 0.5, 1 or 2 extra strokes; we used the ones previously derived for the corresponding stroke allocation method.
For the multiplicative case, we evaluated all multiplicative factors from 1.0 to 1.5 in increments of 0.01. After multiplying both handicaps by the factor, handicaps were rounded to the nearest integer. Note that since handicaps have already been adjusted by a “bonus for excellence”, that is, multiplying the differential by 0.96, multiplying by its reciprocal, 1.0417, essentially negates this adjustment.
For the additive case, we measure the impact of the extra strokes considering all hole rankings, and both the differential and cumulative stroke allocation methods. For the multiplicative case, we consider both stroke allocation methods but only the course-defined hole ranking.
6Results
6.1Overall fairness
Table 1 summarizes the hole rankings that we determined from the data and used in the simulated matches: course-defined, empirical, gap, optimized based on differential stroke allocation method, and optimized based on cumulative stroke allocation method. Note that no clear patterns emerge when comparing the rankings. Coupled with the freedom that golf courses have to determine their own hole rankings and general confusion about their purpose, we believe that a universally applicable and fair match play handicap allocation system must be robust to hole rankings; that is, it must ideally achieve fairness and produce consistent outcomes across a range of hole rankings.
Table 2 summarizes the results for overall fairness based on our bootstrap simulation of matches between all players with different handicaps under the different hole orderings (course-based, empirical, gap, and optimized), the two stroke allocation methods (differential and cumulative), and a range of extra strokes added (0, 0.5, 1, and 2).
Table 2
Win percentage (handicapped match play with tie-breaker) of the lower handicap golfer under the different hole rankings, stroke allocation methods, and extra strokes added. The differential- and cumulative-optimized hole rankings are used for the respective results in the “optimized” column. (95% confidence intervals have margins of error in the range of +/–0.035%.)
| Stroke allocation method | Extra strokes added | Hole Ranking Method | |||
| Course-defined (%) | Empirical (%) | Gap (%) | Optimized (%) | ||
| Differential | 0 | 53.1 | 54.2 | 52.5 | 49.6 |
| 0.5 | 50.5 | 51.6 | 49.9 | 47.1 | |
| 1 | 48.1 | 49.3 | 47.4 | 44.6 | |
| 2 | 43.1 | 44.4 | 42.3 | 39.7 | |
| Cumulative | 0 | 52.9 | 52.5 | 52.6 | 51.9 |
| 0.5 | 50.3 | 49.8 | 49.9 | 49.4 | |
| 1 | 48.0 | 47.3 | 47.6 | 47.1 | |
| 2 | 43.1 | 42.1 | 42.7 | 42.1 | |
Under the differential (current) stroke allocation method with no extra strokes added, the optimized ranking achieves a 49.6% (95% confidence interval [49.3%, 50.0% ]) win percentage for the lower handicap player, suggesting that it may be possible to achieve fairness under some hole ranking. However, comparing the ranking against the empirical or gap difficulty rankings in Table 1 suggests that the optimized ranking does not have an obvious relationship with them. Furthermore, neither the empirical nor gap rankings achieve overall fairness under the current system.
Under the cumulative stroke allocation method with no strokes added, it remains the case that no hole ranking is able to achieve overall fairness. However, perhaps more importantly, the differences between win percentages differ by at most 1%, which is much less than under the differential stroke allocation method where the range is 4.6%.
Adding 0.5 strokes to the high handicapper comes closest to achieving overall fairness under both stroke allocation methods across several hole rankings. Adding 1 or more strokes biases results in favor of the weaker player across all hole rankings and both stroke allocation methods. Perhaps the most important thing to notice about the cumulative stroke allocation method is the robustness of its win percentages with respect to the different hole rankings and extra strokes added. This suggests that the cumulative stroke allocation method may be less sensitive to idiosyncrasies in how course hole rankings are determined at different courses.
Table 3 reports the impact of multiplicative adjustments to handicaps. It shows that overall fairness can be achieved for both stroke allocation methods by multiplying both players’ handicaps by 1.08. Thus, achieving fairness requires compensating player handicaps by more than “the bonus for excellence”.
Table 3
Impact of multiplicative adjustments to handicaps on win percentage for lower handicap player under the course-defined hole ranking and both stroke allocation methods
| Stroke allocation method | Multiplicative factor | ||||
| 1.06 (%) | 1.07 (%) | 1.08 (%) | 1.09 (%) | 1.10 (%) | |
| Differential | 50.8 | 50.3 | 49.9 | 49.3 | 48.8 |
| Cumulative | 50.6 | 50.2 | 49.9 | 49.4 | 48.9 |
6.2Uniform fairness
The results in Section 6.1 showed that the cumulative stroke allocation method was robust to hole rankings and that overall fairness can generally be achieved by either giving the weaker player an extra half of stroke or multiplying handicaps by 1.08. Next, we investigate the impact of these changes across handicap differentials, that is, on uniform fairness.
Fig. 6 shows winning percentages and corresponding confidence intervals under cumulative stroke allocation with half a stroke given to the high handicapper. The left hand graph shows that the extra half a stroke allocation impacts different handicap differentials in a non-uniform way; it slightly favors the high handicap player when the differential is either very small (i.e., less than 3) or very large (i.e., greater than 21) and slightly favors the low handicap player when the differential is moderate (i.e., between 7 and 20). However, across most handicap differentials, the confidence interval includes a win percentage of 50%, suggesting that uniform fairness is close to being achieved with these modifications. In addition, if we instead computed a simultaneous 95% confidence interval across all handicap differentials, the confidence band would be even wider than shown and likely encompass a 50% win percentage across all handicap differentials.
Fig.6
Winning percentages for lower handicap player (cumulative stroke allocation, course-defined hole ordering) after adding a half stroke to the higher handicap player (left hand figure) and multiplying handicaps by 1.08 (right hand figure). The two dotted lines represent 95% bootstrap confidence intervals.
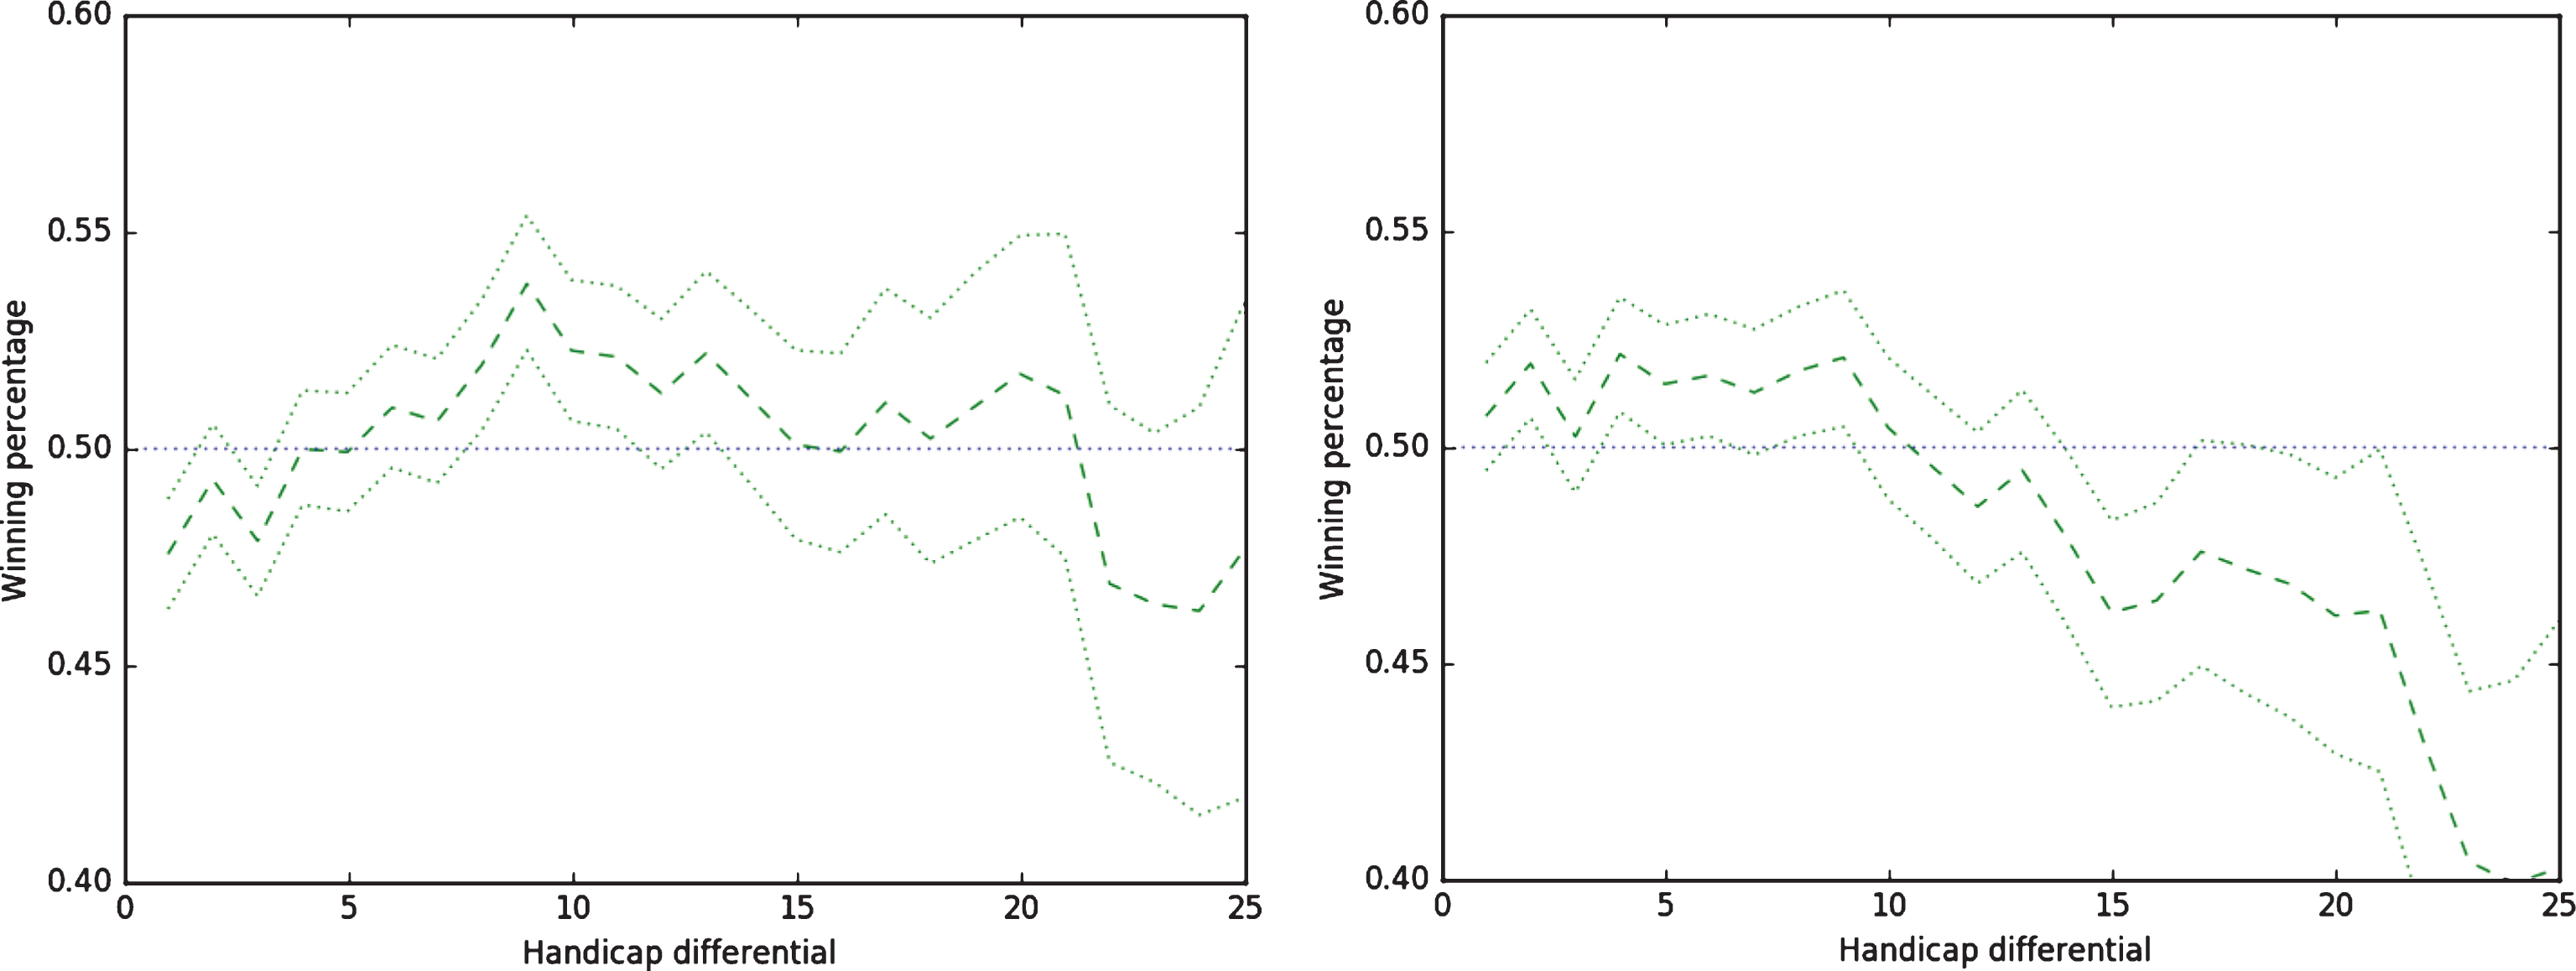
The multiplicative adjustment has a different effect; it favors the low handicap player for handicap differentials less than 10 and the high handicap player for differentials greater than 11. Moreover for large handicap differentials, the matches are strongly biased in favor of the high handicapper. Thus, it seems that the multiplicative adjustment is not capable of achieving uniform fairness, especially for higher differentials. We note that McHale (2010) achieved a comparable level of uniform fairness as our additive adjustment does but using multiplicative factors, which does not appear possible for our data.
Based on the results shown in Fig. 6, it appears that the additive adjustment of 0.5 strokes, except possibly for handicap differentials of 1–3, combined with our cumulative stroke allocation method, does well in achieving uniform fairness.
As a final check, we experiment with a piecewise constant additive adjustment, where the number of strokes added (either 0, 0.5, or 1) depends on the handicap differential, to examine the extent of possible improvement in uniform fairness. Note that Scheid (1972) also considers this modification, but focuses on whole strokes. As expected, uniform fairness is achievable (confidence intervals contain 50% win percentage at each differential). However, such a complicated adjustment may be regarded as over-fitting and is unlikely to be practical. These results are omitted for brevity.
7Conclusions and recommendations
In this paper, we extended the literature on golf analytics by exploring the impact of course hole ranking and handicap stroke allocation on fairness in match play. We showed that the widely used approach of assigning the handicap differential to the higher handicap player and awarding strokes based on the course-defined hole rankings biases outcomes in favor of the lower handicap player, who enjoys a 53% winning percentage overall. To address the observed lack of fairness of the current approach to allocating handicap strokes in match play, we used simulation to quantify the effect of three possible modifications: changing the hole ranking, giving both players their full handicap, and awarding extra strokes to the higher handicap player.
Based on our simulation results, we recommend two practical changes to the current method of handicap stroke allocation in order to improve match play fairness and generalizability:
1. Give the higher handicap player an extra half stroke (perhaps only when the handicap differential is 3 or greater).
2. Play the match with each player assigned his or her full handicap.
There are several benefits of the proposed changes. First, they are easy to implement. All that is required is that handicap strokes are allocated on different holes than currently allocated, and that a new tiebreaker is used on a single hole if necessary. This new tiebreaker is all that is needed to achieve overall fairness and significantly improve uniform fairness. Second, using full handicaps makes the proposed approach consistent with how handicapped stroke play tournaments are currently conducted. Third, fairness is likely generalizable to other courses since using the cumulative stroke allocation method desensitizes match play outcomes to the method used to determine the course-defined hole rankings.
Further empirical validation of our results is needed using other courses and data. Our paper provides a methodology for doing this. The ultimate test of our proposal would be to conduct match play under this new format and measure overall fairness and players’ assessment of the experience.
This paper addressed the allocation of handicaps in matches between two players over 18 holes. Often matches are played between two-player teams. The allocation of stokes in such matches remains to be investigated, as well as the question of whether it is fairer to play the match using all four scores or only the two best scores.
Notes
1 Coincidentally, in a Vancouver Sun article on July 12, 2016, golf writer Cam Cole noted that Royal Troon’s scorecard lists the challenging and devious Postage Stamp 8th hole “as the No. 18 handicap hole, the easiest on the course”. He concludes, “Who ever said the Scots have no sense of humour?”
Acknowledgments
We sincerely thank Matt Dunn and Branden Stewart, Assistant Professionals at Shaughnessy Golf and Country Club for providing us with the data, and Mark Broadie, Frank Engel, David Puterman and two anonymous referees for insightful comments on preliminary drafts of this paper.
References
1 | Bingham D.R. and Swartz T.B. , (2000) , Equitable handicapping in golf, Am Stat 54: , 170–177. |
2 | Efron B. , (1979) , Bootstrap methods: Another look at the jackknife, Annals of Statistics 7: , 1–26. |
3 | Golf Canada. 2016, Golf Canada handicap manual, accessed July 10, 2016, http://golfcanada.ca/app/uploads/2016/02/2016-Handicap-Manual-6x9-ENG-FA-web.pdf. |
4 | Golf Digest. 2014, How do you stack up? Golf Digest March 17, 2014, accessed July 10, 2016, http://www.golfdigest.com/story/comparing-your-handicap-index. |
5 | Hurley W.J. and Sauerbrei T. , (2015) , Handicapping Net Best-Ball Team Matches in Golf, Chance 28: , 26–30. |
6 | Knuth D. , (2008) , Handicaps, What does “bonus for excellence” mean? Golf Digest, Sept. 2008, accessed Sept. 22, 2016, http://www.popeofslope.com/magazine/bonus_for_excellence.html |
7 | Knuth D. , (2011) , Handicap Guru: How many strokes do you get in match play? Golf Digest, October 2011, p.38, accessed Sept. 22, 2016, http://www.popeofslope.com/magazine/2011-10-StrokesInMatchPlay-gd.htm |
8 | Kupper L.L. , Hearne L.B. , Martin S.L. and Griffin J.M. , (2001) , Is the USGA golf handicap system equitable? Chance 14: , 30–35. |
9 | McHale I.G. , (2010) , Assessing the fairness of the golf handicapping system in the UK, J Sport Sci 28: , 1033–1041. |
10 | Pollock S.M. , (1977) , A model for the evaluation of golf handicapping, Oper Res 22: , 1040–1050. |
11 | R Development Core Team. 2008, R: A language and environment for statistical computing, R Foundation for Statistical Computing, Vienna, Austria,http://www.R-project.org/. |
12 | Scheid F.J. , (1972) , A least squares family of cubic curves with an application to golf handicapping, SIAM J Appl Math 22: , 77–83. |
13 | Swartz T.B. , (2009) , A new handicapping system for golf, J Quant Anal Sports, 5: :Article 9. |
14 | United States Golf Association. 2016, USGA Handicap System Manual, accessed July 10, 2016. http://www.usga.org/Handicapping/handicap-manual.html. |


