
Fans’ responses to the National Basketball Association’s (NBA) pilot jersey sponsorship program: An experimental approach
Abstract
During the 2017–18 season, the National Basketball Association (NBA) began a three-year pilot program to allow corporate sponsors’ logo patches on game jerseys. Considering this, there is little evidence on how international and domestic NBA fans would respond to this new initiative. Accordingly, we conducted an online experiment to investigate the effects of market-, team-, manufacturer-, and individual-related factors on fans’ perceptions toward various potential NBA jersey sponsors. We developed 180 fictitious press releases that informed participants about their favorite team coming to terms on a sponsorship deal with a specific corporation. This resulted in the creation of 360 graphic renderings of sponsored NBA team jerseys as research stimuli. We utilized a crowdsourcing platform to collect the data (N = 621). Overall, our findings provide useful and actionable insights for managers to understand what may impact fans’ reactions to the NBA’s new pilot sponsorship program.
1Introduction
The sponsorship of athletes’ and teams’ jerseys is considered one of the prime branding assets that a corporation can attain (Smith, 2016). A sponsors’ logo on the team jersey can help firms to increase brand exposure and can also provide opportunities for these parties to use it as a platform for brand activations. Given the amount of exposure opportunity to massive audiences around the globe, jersey sponsorship comes with a high price tag. For instance, F.C. Barcelona, one of the most prominent La Liga clubs from Spain, signed a jersey sponsorship deal with Japanese e-commerce firm, Rakuten, worth $58 million a year (BBC, 2016). Likewise, Manchester United, an English Premier League club, signed a record seven-year deal with Chevrolet in 2014, which is worth $80 million a year (Smith, 2016).
While placing a corporation’s logo on jerseys is a common sponsorship inventory in soccer, professional sports leagues in North America have not yet capitalized on such monetary benefits, in the manner of clubs in Europe. Notwithstanding, in 2016, the National Basketball Association (NBA) Board of Governors approved the three-year pilot program to allow all NBA teams to sell jersey sponsorships, in which players would sport corporate logos on their uniforms beginning in the 2017–18 season (Garcia, 2016). The NBA’s decision to allow jersey sponsors is the first among the four major leagues (i.e., National Football League [NFL], Major League Baseball [MLB], National Hockey League [NHL], and NBA) in North American professional sports history.
Each team is responsible for selling the inventory and the logo will appear on the front right of the game jerseys, opposite the logo of the official manufacturer of NBA game apparel, Nike. The patches will measure 2½-by-2½ inches. To note, before Nike became the official manufacturer of the NBA, no manufacturer logo had previously appeared on NBA uniforms. It remains interesting to examine if the presence of the Nike “swoosh” on the uniform may also affect sponsor evaluations.
Having a brand logo on jerseys certainly brings additional revenue for each team. According to the NBA’s authorization of jersey advertising, teams will retain 50 percent of the revenue generated by their individual patches, with the other 50 percent being shared equally among the league’s 30 teams (Lefton & Lombardo, 2016). Such a revenue sharing program will help smaller market teams (e.g., the Milwaukee Bucks, New Orleans Pelicans, Utah Jazz) to gain more than the face value for their patch. Industry experts have estimated that the patch inventory may cost between $1 million and $10 million per year, depending on the team’s market size and popularity (Lefton & Lombardo, 2016). For instance, the Philadelphia 76ers became the first NBA team to sign a jersey sponsorship deal with StubHub, which is reported to be worth $15 million over three years (Rovell, 2016). The Golden State Warriors, who won their fifth NBA Championship in the 2016–17 season and most recently their second-straight and sixth title following the 2017–18 season, agreed to the league’s largest jersey sponsor deal with Japanese e-commerce company, Rakuten. This agreement is reported to be worth more than $20 million per year, surpassing previous projections (Brown, 2017).
While it seems apparent that teams will earn more money from this “pilot program,” it remains unknown what factors would affect how fans may respond to jersey sponsors, as this will be a novel instance for NBA fans. More notably, it is important for marketers to have empirical evidence directly from consumers to understand what influences the valuation of jersey sponsors. Given that there are still teams that do not have a jersey sponsor in the first year of its pilot program (see Table 1), findings of this study will provide practical insights from the consumer’s perspective. Therefore, the purpose of this study is to provide empirical evidence on how fans would respond to jersey sponsors by incorporating various market- (i.e., market size, brand prominence), manufacturer- (presence/absence of Nike logo), team- (i.e., team’s playoff status), and individual-related (i.e., domestic/international, team identification level) factors.
Table 1
List of NBA teams, their jersey sponsors, and location of sponsor’s headquarters
| Team | Sponsor | Sponsor’s Headquarters | Amount per year (if disclosed) |
| Atlanta Hawks | Sharecare | Atlanta, GA | – |
| Boston Celtics | General Electric | Boston, MA | $8M |
| Brooklyn Nets | Infor | New York City, NY | $8M |
| Charlotte Hornets | Lending Tree | Charlotte, NC | – |
| Cleveland Cavaliers | Goodyear | Akron, OH | $7–10M |
| Denver Nuggets | Western Union | Englewood, CO | – |
| Detroit Pistons | Flagstar Bank | Troy, MI | – |
| Golden State Warriors | Rakuten | Tokyo, Japan | $20M |
| Los Angeles Clippers | Bumble | Austin, TX | $7M |
| Los Angeles Lakers | Wish | San Francisco, CA | $12–14M |
| Miami Heat | Ultimate Software | Weston, FL | – |
| Milwaukee Bucks | Harley-Davidson | Milwaukee, WI | – |
| Orlando Magic | Disney | Orlando, FL | – |
| Minnesota Timberwolves | Fitbit | San Francisco, CA | – |
| New Orleans Pelicans | Zatarain’s | New Orleans, LA | – |
| New York Knicks | Squarespace | New York City, NY | – |
| Philadelphia 76ers | Stubhub | San Francisco, CA | $5M |
| Sacramento Kings | Blue Diamond Almonds | Sacramento, CA | $5M |
| Toronto Raptors | Sun Life | Toronto, Canada | – |
| Utah Jazz | Qualtrics | Provo, UT | $4M |
Note. As of May 23, 2018, ten teams still do not have jersey sponsors. Sources: Kutz (2017); Lombardo (2018).
1.1Hypothesis development
From a theoretical standpoint, Gwinner’s (1997) image transfer model provides a useful framework to understand how jersey sponsors might be perceived by fans. The basic premise of the model is that sponsors want to tap into positive images and loyalty associated with a sponsee (e.g., team) by pairing its brand with the property. Through sponsorship, sponsors expect positive emotions and attitudes affiliated with the team to carry over to them. Among different sponsorship inventories, jersey sponsorship offers more direct exposure opportunities than other inventories (e.g., LED billboards) that may well go beyond a game. For instance, brands can appear in highlight videos, promotional videos, player interviews, and photographs on both traditional and social media. Therefore, one could expect that positive image transfer will occur through repeated exposure among fans of the team.
1.1.1Performance
Extensive research in sponsorship has shown various antecedents and boundary conditions that either facilitate or impede transfer of images. From the image transfer perspective, we can speculate that teams with strong performance will help facilitate image transfer. Strong performance of a team will likely prompt fans to bask-in-reflected-glory (BIRG; Cialdini et al., 1976), which will likely heighten positive image transfer between the team and sponsor. Empirical study by Ngan and her colleagues (2011) also found a direct positive effect of a team’s success on the purchase intent of a sponsor. As such, it is reasonable to expect that the team’s success (e.g., measured via advancing into the playoffs) will have a positive impact on jersey sponsor evaluations.
1.1.2Team identification
Based on the literature, one individual factor that will have robust impact on sponsor evaluation is fans’ level of identification with the team (Gwinner & Swanson, 2003; Meenaghan, 2000). Fans who have a strong allegiance with the team might have more favorable evaluations toward the sponsor than fans who are less attached to the team (Gwinner & Swanson, 2003). Put simply, the closer fans identify themselves with the team, the more favorable evaluations they will have toward the sponsor (Meenaghan, 2000). In line with previous research, we also expect that fans’ level of identification with the team will augment positive evaluations toward the jersey sponsor.
1.1.3Market size
From a practical standpoint, it seems reasonable to expect that teams in large markets might be valued more positively than teams in small markets. This speculation is based on the sponsorship practice that a sponsors’ value is determined by its potential reach and exposure. Given that jersey sponsors will have more prominent exposure opportunities than other on-site sponsor inventories, the chances are high that the jersey sponsor will be exposed via highlight videos, interviews, and photos in local media. Thus, teams located in larger markets might have greater exposure opportunities than teams in smaller markets. However, it remains undetermined whether consumers’ perceptions toward their team’s sponsor will be a function of the team’s geographic market size. Thus, the current study seeks to extend extant literature by investigating the impact of market size on jersey sponsor evaluation.
1.1.4Sponsor brand prominence
In addition, the present study considers brand prominence as another relevant factor in the research model. At the time of writing, NBA jersey sponsors range from relatively lesser known brands (e.g., Qualtrics’ Cancer Charity) to more prominent brands like Fortune 500 companies (e.g., General Electric). While some researchers have examined “perceived” brand prominence as a positive predictor of sponsor evaluation (Han, Nunes, & Drèze, 2010; Wakefield & Bennett, 2010), little is known whether the sponsoring brand’s actual prominence will impact sponsor evaluation. That is, do prominent brands (e.g., Fortune 500 companies) receive more favorable responses than less prominent brands (e.g., non-Fortune 500 companies)? In order to provide an answer to this question, we manipulated sponsor prominence in this study by selecting brands from Fortune 500 and non-Fortune 500 corporations as research stimuli.
1.1.5Manufacturer logo
From the start of the 2017-18 season, the jersey sponsor’s logo will appear next to the apparel manufacturer logo (i.e., Nike’s “swoosh” logo). However, it remains unknown whether such a heuristic cue (i.e., the “swoosh” logo) can influence consumers’ perception of sponsors. In the licensed merchandise consumption context, scholars have found that heuristic cues, such as a brand or manufacturer logo, has a significant impact on increasing product evaluation and purchase intent (Kwak, Kwon, & Lim, 2015; Kwon, Kim, & Mondello, 2008). In particular, Kim et al. (2008) found that consumers had more positive attitudes toward licensed apparel when the product had a Nike logo compared to other products bearing different logos. As such, we propose that having a manufacturer’s logo (i.e., Nike) on the jersey will have a positive carryover effect such that consumers will view the sponsor in a more favorable way than when the manufacturer’s logo is absent. We expect that Nike’s swoosh logo will serve as a heuristic cue (Kwak et al., 2015) to signal high perceived value of the sponsoring brand.
1.1.6Fan origin
In addition, the present study considers fans origin – domestic versus international audiences. Considering the international reach of the NBA, it is worth exploring how fans from different origins respond to jersey sponsors. While no previous studies inform the direction of this hypothesis, we believe findings of this study will provide useful insights on how consumers from different markets respond to this pilot program. Therefore, we measured respondents’ origin (domestic and international) and included it in the research model.
1.2Contributions
The current study makes several contributions to the field. First, multiple factors are simultaneously considered in an effort to encompass various forces that might affect fans’ perceptions toward jersey sponsors. Thus, findings of our study will provide initial evidence on how NBA fans respond to jersey sponsors. Second, our study advances the marketing research methodology by producing an experiment that allows each participant to respond to a graphic rendering of their favorite team’s jersey. This customized procedure allows researchers to avoid alternative hypotheses, which can be derived from participants answering questions that are irrelevant to them (e.g., inquires unrelated to the fans’ favorite teams) or findings that are limited to one or simply a handful of specific fanbases (e.g., only fans of the Detroit Pistons). In addition, utilizing actual companies as sponsors in the research stimuli further enhances the external and ecological validity of our study. Therefore, our study aims to demonstrate how experimental research can aid in providing practitioners with data-driven, actionable evidence to inform their marketing operations.
2Methodology
2.1Subjects and design
The current study utilized a 2 (manufacturer logo: present, absent)×2 (sponsor prominence: high, low) between-subjects design. We determined the necessary sample size in order to achieve power conditions (1 – β= 0.80, α= 0.05, medium effect size) using G*Power, a program that enables researchers the ability to compute requisite statistical power for various analyses (Faul, Erdfelder, Buchner, & Lang, 2009). Thus, to satisfy these requirements, we needed approximately 270 participants. Data collection occurred prior to the 2017–18 NBA season. A total of 621 self-identified NBA fans (Mage = 32.03 years, SD = 10.06) participated in this study. Subjects were recruited from Amazon Mechanical Turk (MTurk) and were compensated $0.50 for their participation. Table 2 provides the demographic characteristics of our sample.
Table 2
Demographics of obtained sample
| Characteristic | Frequency | Percent |
| Origin | ||
| Domestic (U.S.) | 335 | 53.9% |
| International | 286 | 46.1% |
| Gender | ||
| Male | 441 | 71.0% |
| Female | 180 | 29.0% |
| Ethnicity | ||
| Caucasian or White | 312 | 50.2% |
| Asian or Pacific Islander | 211 | 34.0% |
| Hispanic or Latino | 38 | 6.1% |
| Black or African American | 32 | 5.2% |
| Two or more races | 13 | 2.1% |
| Native American or American Indian | 11 | 1.8% |
| Other | 4 | 0.6% |
| Age | ||
| <32 years | 355 | 57.2% |
| ≥32 years | 266 | 42.8% |
2.2Stimuli and procedure
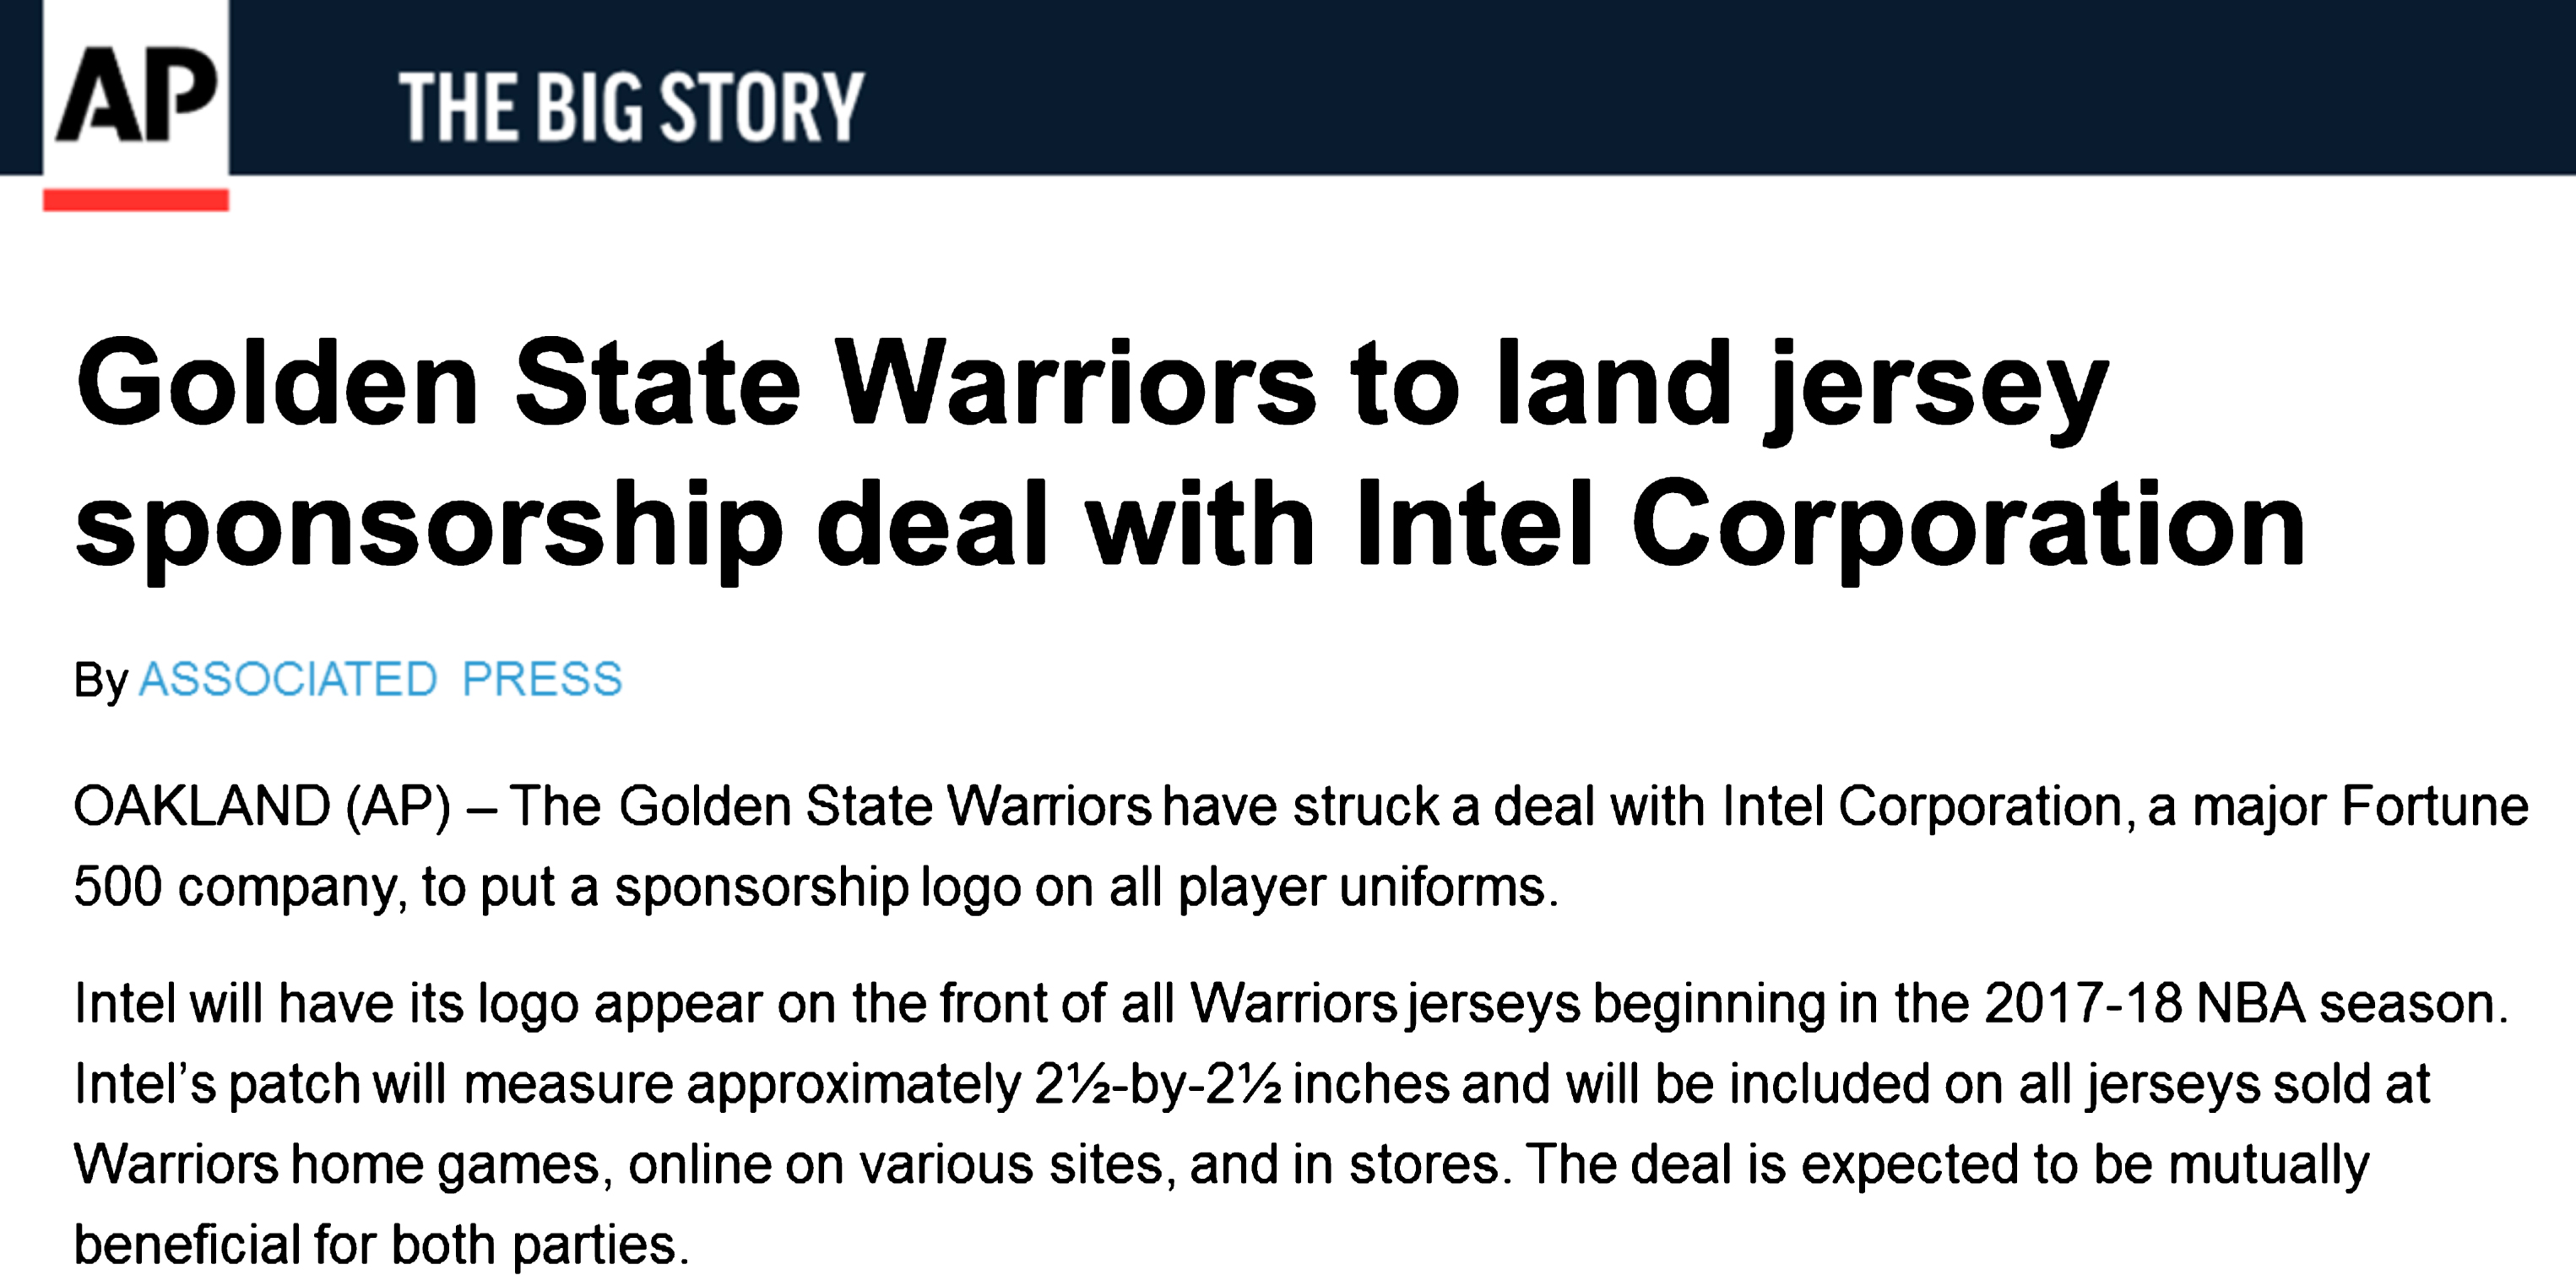
The present experiment was conducted online through Qualtrics Survey Software. Subjects were informed that they would be participating in a study about their favorite NBA team. Subjects first provided their informed consent and indicated if they were above the age of 18 and if they were fans of the NBA. Individuals who did not meet these criteria were unable to partake in our experiment. Subjects then designated their favorite NBA team and were randomly assigned to view an article about a corporation sponsoring their favorite team’s jerseys. Prior to viewing the article, subjects provided an assessment of perceived brand prominence and favorability toward the potential sponsor. To enhance the plausibility of the sponsorship deal, the researchers generated fictitious articles from a reputable news source (i.e., the Associated Press) reporting that the participants’ identified team had struck a deal with a specific corporation to place a sponsorship patch on team jerseys. The stimuli for the current study were developed using Adobe Photoshop Creative Cloud®. Potential sponsors for the jerseys were selected from a pool of Fortune 500 (high sponsor prominence) and non-Fortune 500 (low sponsor prominence) corporations. Two companies were chosen from the airline (Delta, Spirit), automotive (Ford, Panoz), and technology (Intel, Corsair) industries to reflect the varying levels of sponsorship prominence. Based on these categories, a total of 180 articles were created for the experiment.
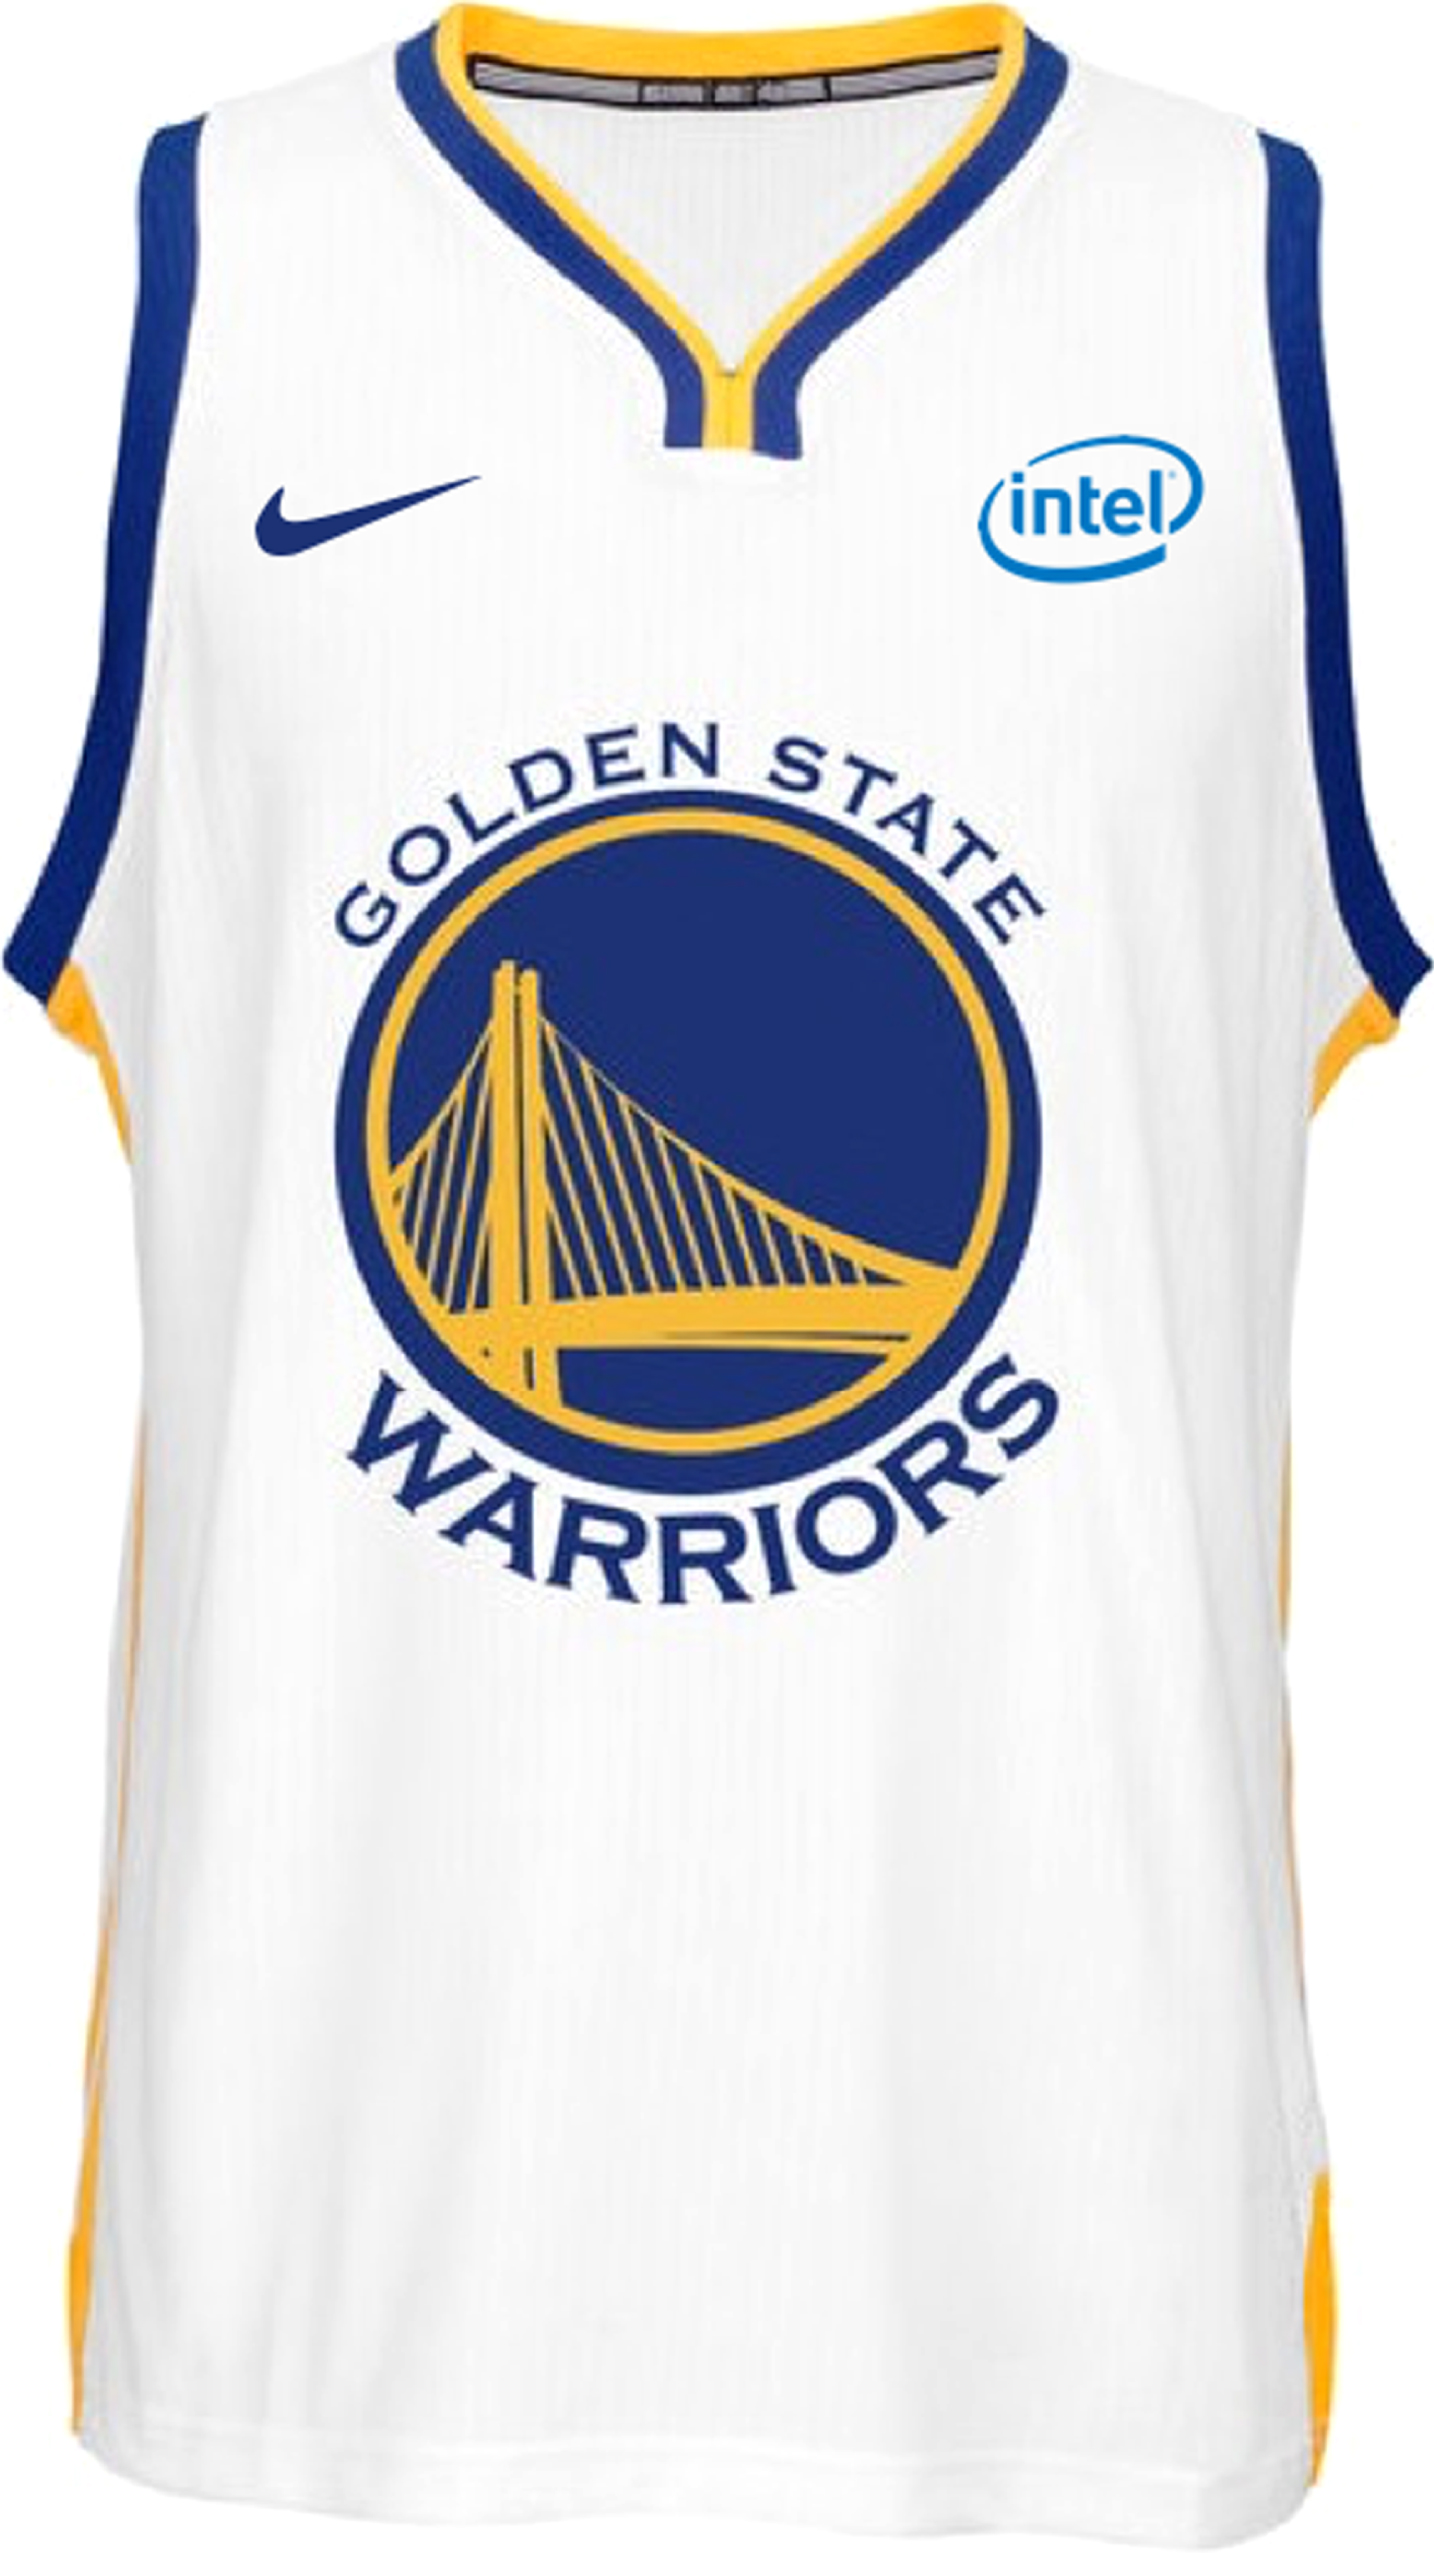
A graphic rendering of the jersey, with the manufacturer logo (Nike) randomly present or absent, was then displayed to subjects. A total of 360 possible graphic renderings of NBA team jerseys were created. All participants were exposed to the home jersey of their identified teams. Appendices A and B contain samples of the articles and jersey stimuli used in the current study. Following this, subjects were asked to complete a randomized battery of measures and were again asked about the perceived brand prominence and favorability regarding the manipulated sponsor. After responding to these questionnaires, subjects were debriefed and thanked for their contribution. Finally, they were then provided a code to receive compensation for their participation.
2.3Measures
The current study utilized a series of established measures from prior research, each responded to with a 7-point scale. These measures were modified to the subject’s favorite team and manipulated sponsor where appropriate, to gauge several principal variables, those being: team identification (TI; Wann & Branscombe, 1990), brand prominence (BP; Han, Nunes, & Drèze, 2010), brand favorability (BF; Spalding, Cole, & Fayer, 2009), brand attitude (Batt; Janssen, Fransen, Wulff, & Reijmersdal, 2016; van Noort & Willemsen, 2012), brand awareness (Bawr; Yoo & Donthu, 2001), brand credibility (BC; Newell & Goldsmith, 2001), and purchase intent of both the sponsoring brand and team jersey (PIbr and PIjsy; Dodds, Monroe, & Grewal, 1991; Moon, Chadee, & Tikoo, 2008; Sweeney, Soutar, & Johnson, 1999). These measures and their respective reliabilities are listed in Appendix C.
3Results
3.1Data analysis
We performed a series of analyses of covariance (ANCOVAs), using gender as a covariate, in order to examine the effects of our independent variables. We explored the impact of the subject’s origin, playoff status of the identified team, market size of the identified team, and the fans’ team identification levels. We conducted a median split on scores on the team identification measure (Mdn = 5.00) to categorize subjects as either avid (n = 313; M = 5.56, SD = 0.49) or casual fans (n = 308; M = 4.15, SD = 0.68). The two groups of fans were significantly different from each other based on the results of a Welch-corrected ANOVA on group means obtained from the team identification measure, F(1, 556.25) = 862.40, p < 0.001, d = 2.38.
3.2Main effects
3.2.1Brand measures
As reported in Table 3, the results from the ANCOVAs for the effects of the aforementioned variables on the brand measures revealed that international consumers provided significantly higher ratings of brand attitude, awareness, and credibility than domestic consumers. This was also the case for more avid fans of the team in comparison to more casual NBA fans, as well as subjects presented highly prominent brands compared to those exposed to less prominent ones. In addition, brand prominence scores significantly increased for subjects exposed to sponsors of higher prominence than those presented less prominent brands. Furthermore, subjects who viewed the manufacturer logo of Nike on their favorite team’s jersey experienced a higher change in brand prominence ratings compared to those who did not see the logo.
Table 3
Analysis of covariance (ANCOVA) results for brand indicators
| BPdiff | BFdiff | Batt | Bawr | BC | |||||||||||||||||||||
| Source | M1 | M2 | F | p | ηp2 | M1 | M2 | F | p | ηp2 | M1 | M2 | F | p | ηp2 | M1 | M2 | F | p | ηp2 | M1 | M2 | F | p | ηp2 |
| Origin | 0.42 | 0.35 | 0.29 | 0.59 | *** | 0.31 | 0.48 | 2.47 | 0.12 | *** | 4.81 | 5.42 | 52.03 | *** | 0.08 | 4.37 | 4.88 | 12.88 | *** | 0.02 | 4.87 | 5.40 | 43.71 | *** | 0.07 |
| Team market size | 0.42 | 0.35 | 0.30 | 0.59 | *** | 0.34 | 0.45 | 0.88 | 0.35 | *** | 5.07 | 5.15 | 0.77 | 0.38 | *** | 4.55 | 4.71 | 1.03 | 0.31 | *** | 5.10 | 5.17 | 0.68 | 0.41 | *** |
| Team playoff status | 0.40 | 0.37 | 0.04 | 0.83 | *** | 0.35 | 0.44 | 0.69 | 0.41 | *** | 5.04 | 5.18 | 2.29 | 0.13 | *** | 4.51 | 4.74 | 2.24 | 0.14 | *** | 5.07 | 5.20 | 2.29 | 0.13 | *** |
| TI | 0.32 | 0.45 | 0.96 | 0.33 | *** | 0.37 | 0.42 | 0.21 | 0.65 | *** | 5.39 | 4.83 | 45.94 | *** | 0.07 | 4.82 | 4.30 | 7.78 | 0.01 | 0.01 | 5.38 | 4.89 | 38.75 | *** | 0.06 |
| Brand prominence | 0.19 | 0.58 | 10.14 | *** | 0.02 | 0.30 | 0.49 | 3.44 | 0.06 | 0.01 | 5.38 | 4.84 | 40.91 | *** | 0.06 | 4.83 | 4.42 | 8.33 | *** | 0.01 | 5.43 | 4.83 | 56.76 | *** | 0.09 |
| Logo | 0.52 | 0.25 | 4.77 | 0.03 | 0.01 | 0.43 | 0.36 | 0.37 | 0.54 | *** | 5.16 | 5.07 | 1.12 | 0.29 | *** | 4.69 | 4.56 | 0.93 | 0.34 | *** | 5.16 | 5.11 | 0.49 | 0.49 | *** |
| Brand prominence×Logo | 1.41 | 0.24 | *** | 5.84 | 0.02 | 0.01 | 0.11 | 0.74 | *** | 2.18 | 0.14 | *** | 0.01 | 0.93 | *** | ||||||||||
| Covariate | |||||||||||||||||||||||||
| Gender | 0.40 | 0.37 | 0.03 | 0.85 | *** | 0.30 | 0.49 | 2.43 | 0.12 | *** | 5.12 | 5.10 | 0.08 | 0.78 | *** | 4.76 | 4.49 | 3.11 | 0.08 | 0.01 | 5.18 | 5.09 | 1.01 | 0.32 | *** |
| Model R2 | 0.03 | 0.02 | 0.19 | 0.06 | 0.20 | ||||||||||||||||||||
Note. *** = <0.001. Origin: 1 = domestic, 2 = international; Team market size: 1 = large market, 2 = small market; Team playoff status: 1 = playoff-team, 2 = non-playoff team; TI: 1 = avid fan, 2 = casual fan; Brand prominence: 1 = high, 2 = low; Logo: 1 = present, 2 = absent; Gender: 1 = male, 2 = female. BPdiff = Brand prominence difference; BFdiff = Brand favorability difference; Batt = Brand attitude; Bawr = Brand awareness; Bc = Brand credibility.
3.2.2Purchase intent
Our investigation of purchase intent, illustrated in Table 4, yielded significant differences between international and domestic consumers such that international consumers were more likely to purchase both a sponsoring brand’s products/services and the corresponding team jersey sponsored by the same entity. Additionally, avid fans also displayed these same differences when contrasted against casual fans. Our analyses also revealed significant differences in the purchase intention of a sponsoring brand’s products/services between subjects shown brands of high prominence compared to those presented less prominent brands. To note, team market size and playoff status did not play a significant role in any of the brand measures or purchase behaviors. Ultimately, inspection of the covariate gender differences yielded no significant variations between males and females on any of the outcomes.
Table 4
Analysis of covariance (ANCOVA) results for purchase behaviors
| PIbr | PIjsy | |||||||||
| Source | M1 | M2 | F | p | ηp2 | M1 | M2 | F | p | ηp2 |
| Origin | 4.29 | 5.08 | 51.29 | *** | 0.08 | 4.82 | 5.51 | 49.45 | *** | 0.08 |
| Team market size | 4.62 | 4.75 | 1.00 | 0.32 | *** | 5.16 | 5.16 | *** | 0.96 | *** |
| Team playoff status | 4.65 | 4.72 | 0.39 | 0.54 | *** | 5.13 | 5.19 | 0.32 | 0.57 | *** |
| TI | 5.08 | 4.28 | 54.48 | *** | 0.08 | 5.76 | 4.56 | 152.24 | *** | 0.20 |
| Brand prominence | 4.95 | 4.42 | 23.95 | *** | 0.04 | 5.17 | 5.16 | 0.01 | 0.93 | *** |
| Logo | 4.68 | 4.69 | 0.01 | 0.93 | *** | 5.16 | 5.17 | 0.01 | 0.94 | *** |
| Brand prominence×logo | 0.64 | 0.43 | *** | 0.26 | 0.61 | *** | ||||
| Covariate | ||||||||||
| Gender | 4.78 | 4.59 | 2.63 | 0.11 | *** | 5.14 | 5.19 | 0.18 | 0.67 | *** |
| Model R2 | 0.18 | 0.25 | ||||||||
Note. *** = <0.001. Origin: 1 = domestic, 2 = international; Team market size: 1 = large market, 2 = small market; Team playoff status: 1 = playoff-team, 2 = non-playoff team; TI: 1 = avid fan, 2 = casual fan; Brand prominence: 1 = high, 2 = low; Logo: 1 = present, 2 = absent; Gender: 1 = male, 2 = female.
3.3Interaction effect and group differences
3.3.1Brand prominence
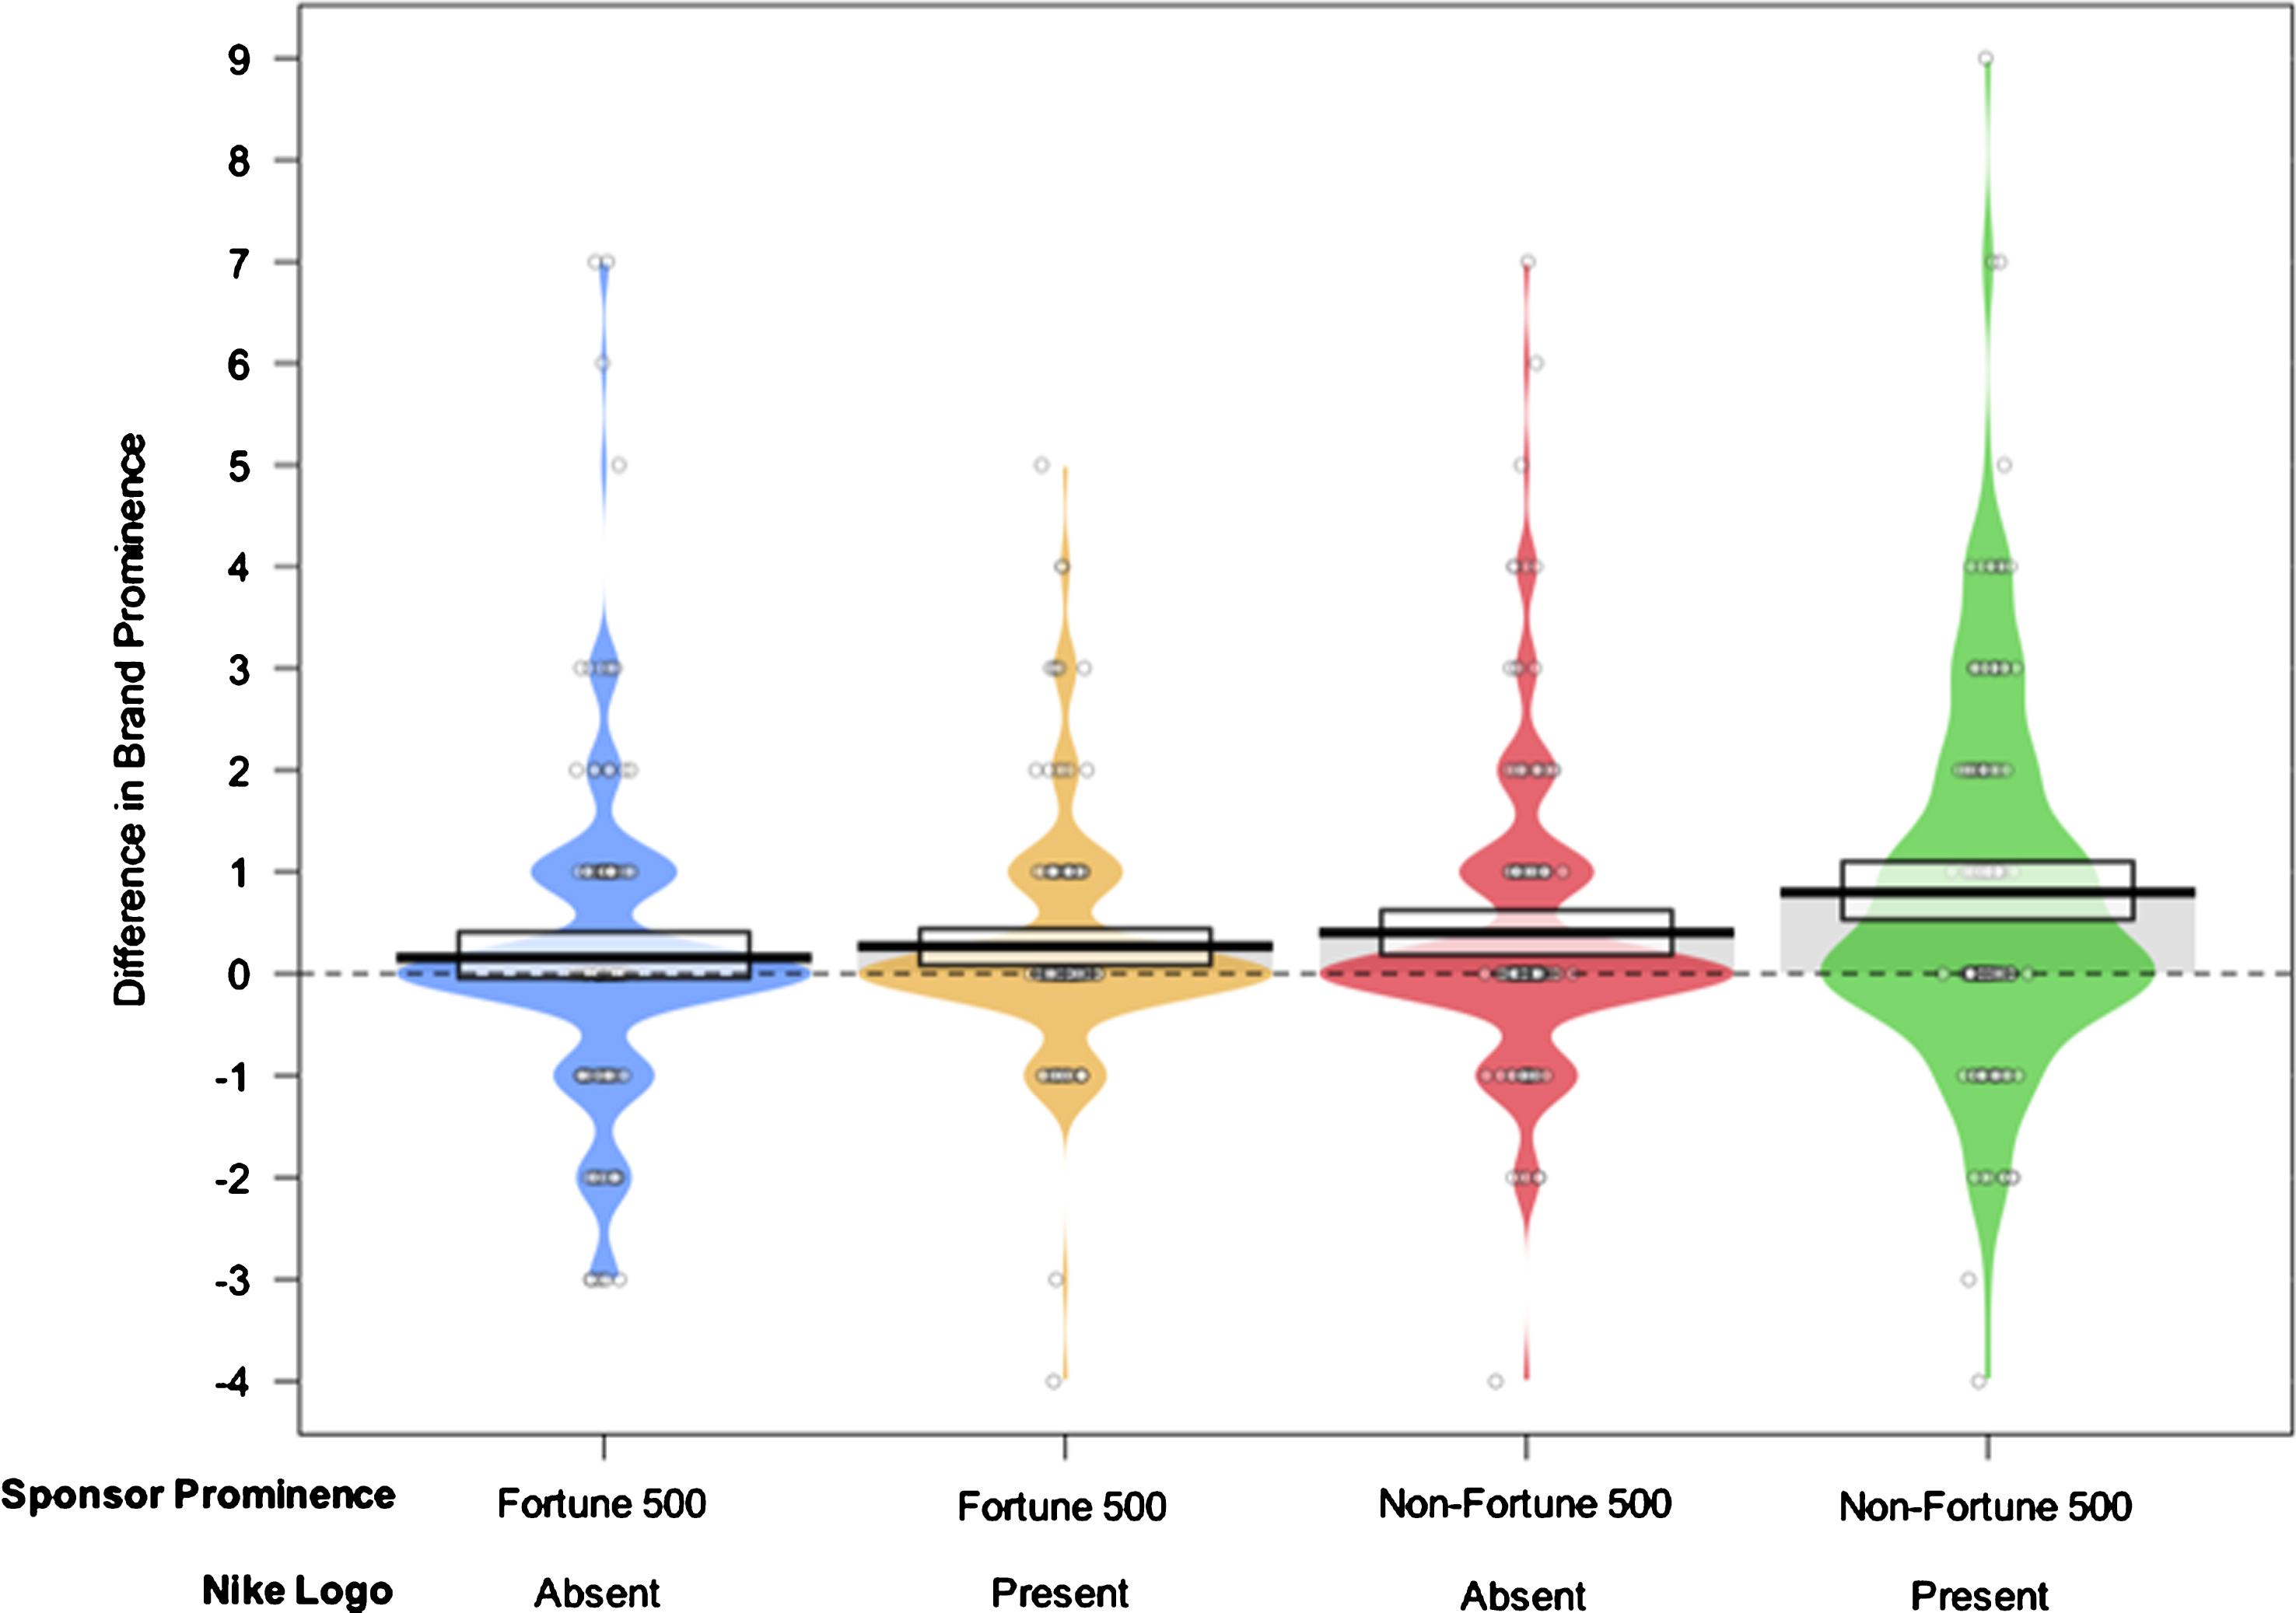
While the overall brand prominence×logo interaction term was only significant for brand favorability, review of the post-hoc tests using Tukey’s Honestly Significant Difference (HSD) test revealed additional differences per group for several outcomes. Specifically, fans presented sponsored jerseys of less prominent brands with the manufacturer logo exhibited a significantly higher change in brand prominence ratings than those shown jerseys including highly prominent brands both with (MD = 0.53, p = 0.01, 95% CI [0.09, 0.97]) and without (MD = 0.64, p = 0.001, 95% CI [0.21, 1.07]) the Nike manufacturer logo. Figure 1 depicts these results.
Fig. 1.
Pirateplot displaying group comparisons for differences in brand prominence. The black horizontal bars display the group means, the circular points symbolize the raw data, the colored beans represent smoothed density, and the grey rectangle provides 95% Bayesian Highest Density Intervals (HDIs; see Phillips, 2017 for a description of pirateplots).
3.3.2Brand favorability
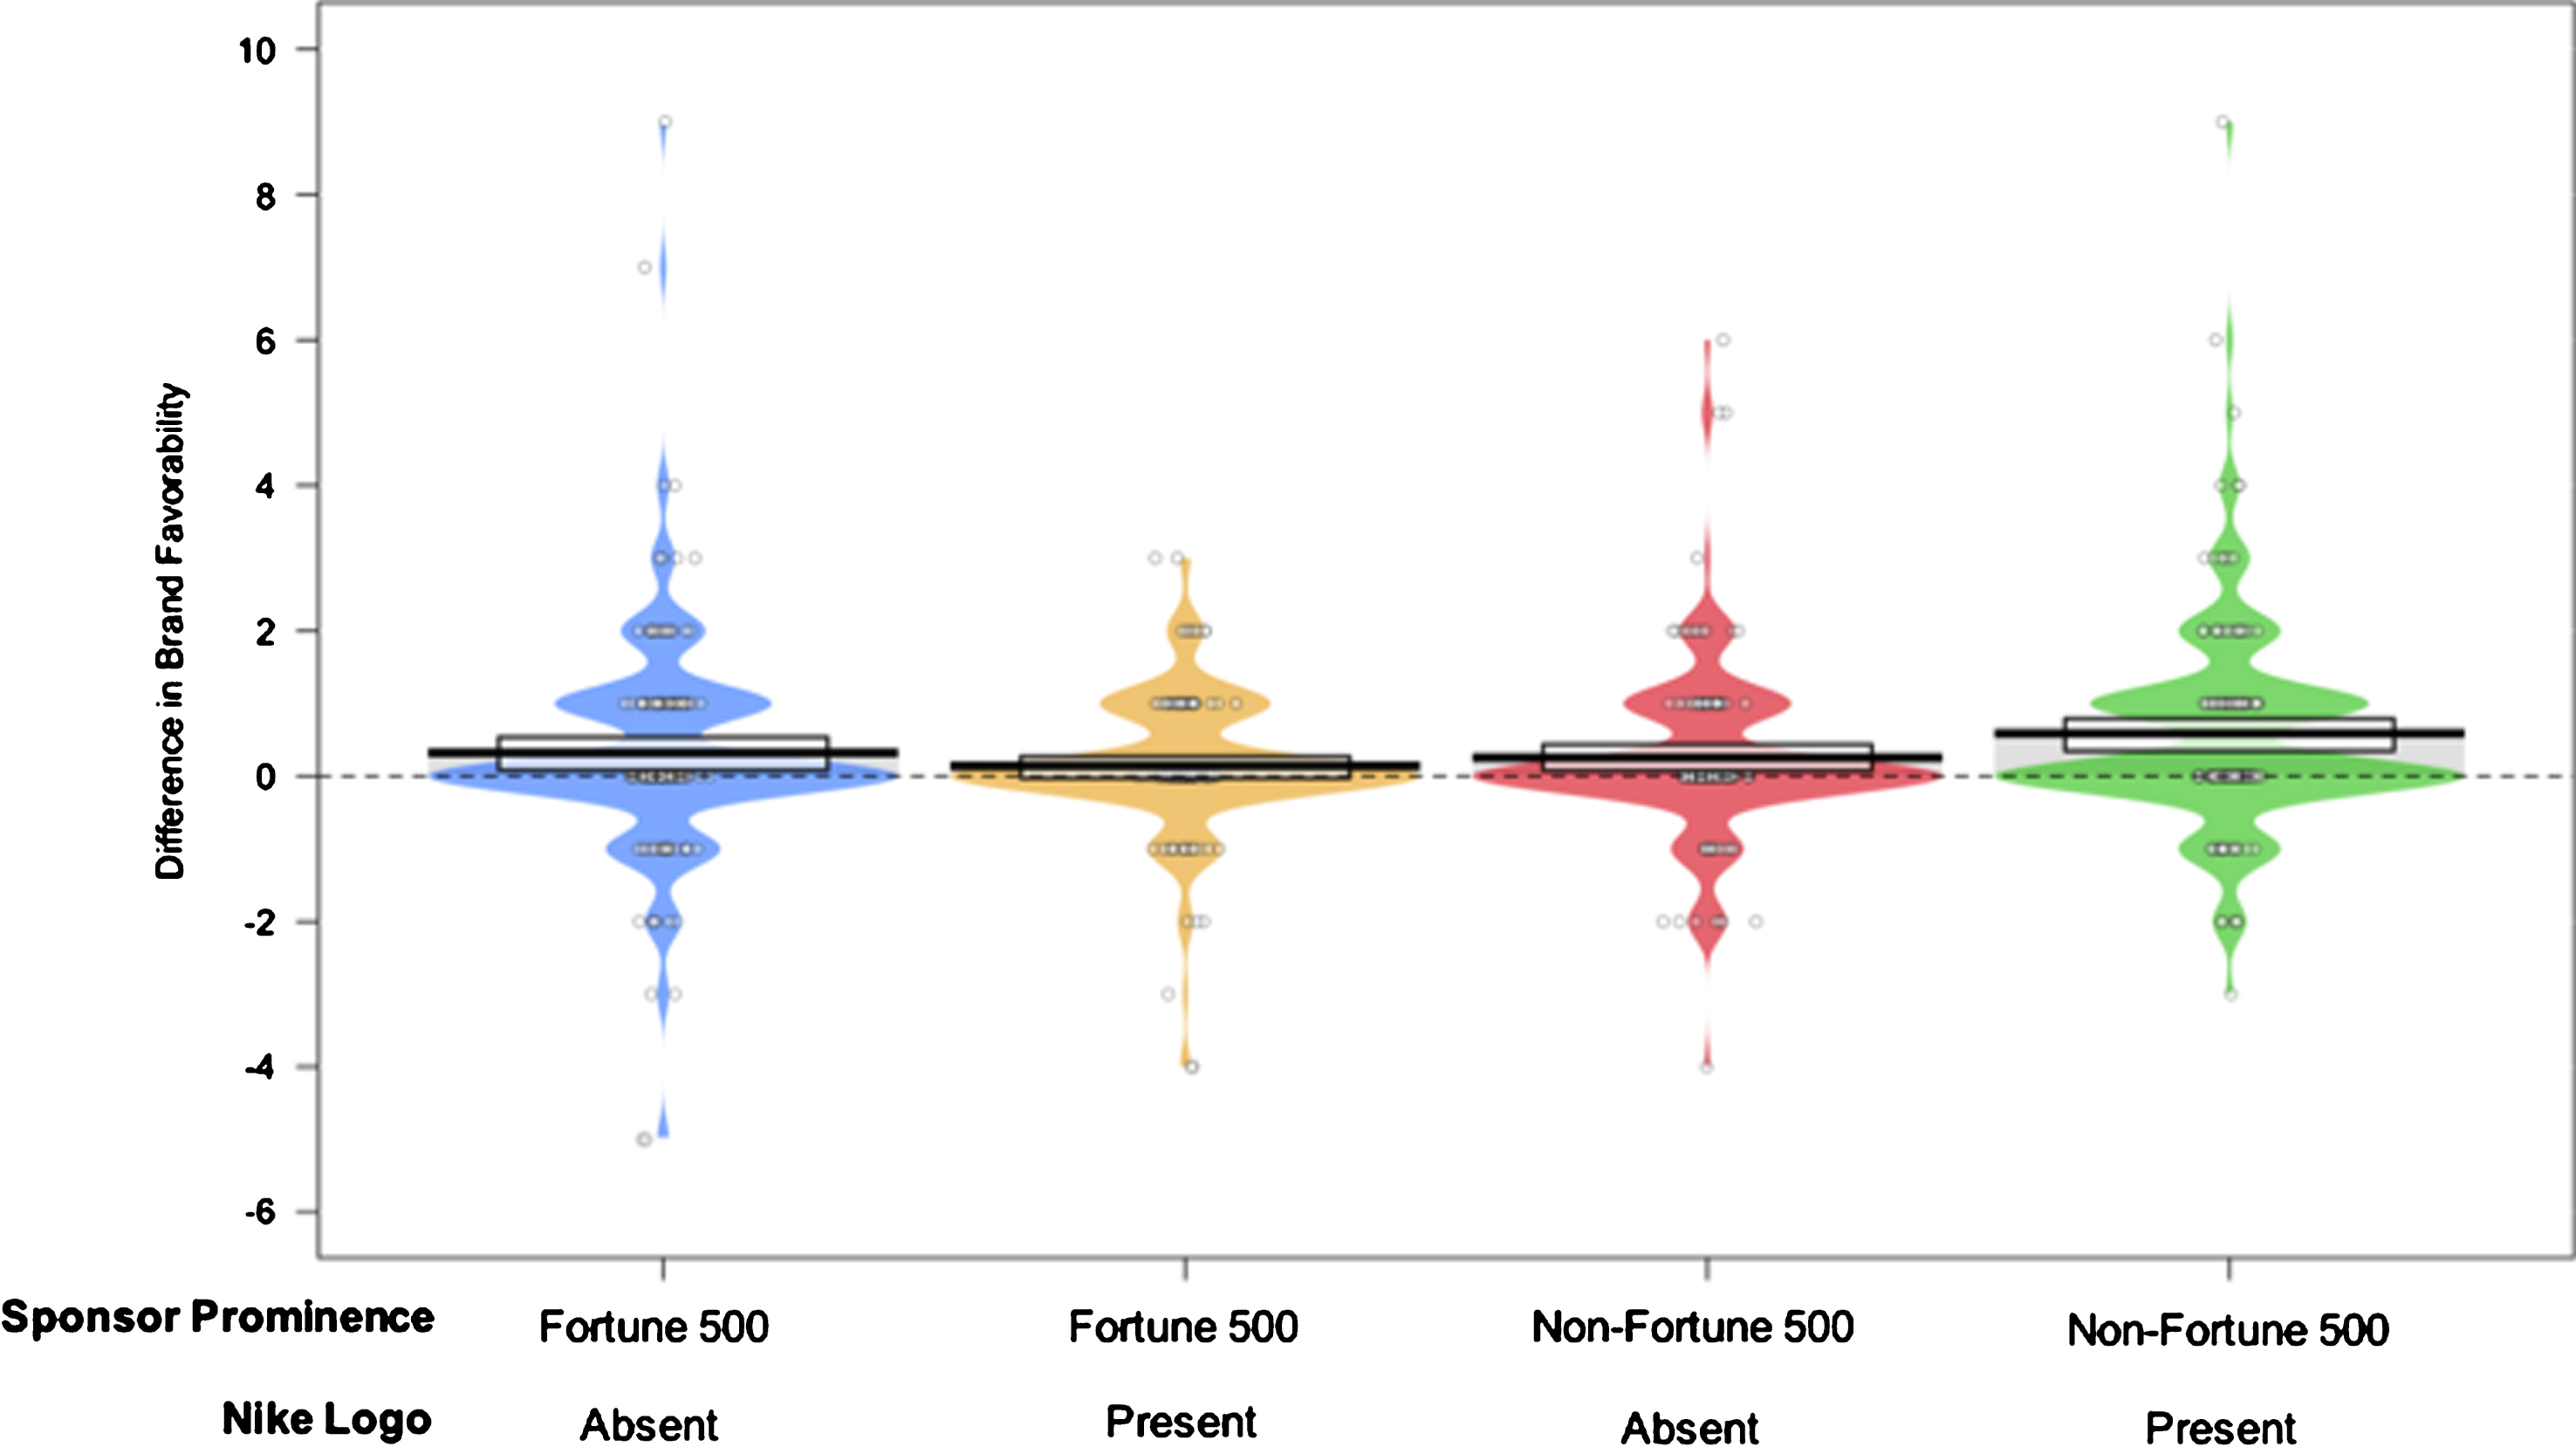
With respect to changes in brand favorability (see Fig. 2 for a summary), fans exposed to jerseys sponsored by brands of low prominence with the manufacturer logo experienced greater changes than those presented jerseys with highly prominent sponsoring brands with the manufacturer logo (MD = 0.45, p = 0.02, 95% CI [0.06, 0.84]).
Fig. 2.
Pirateplot displaying group comparisons for differences in brand favorability.
3.3.3Brand attitudes and credibility
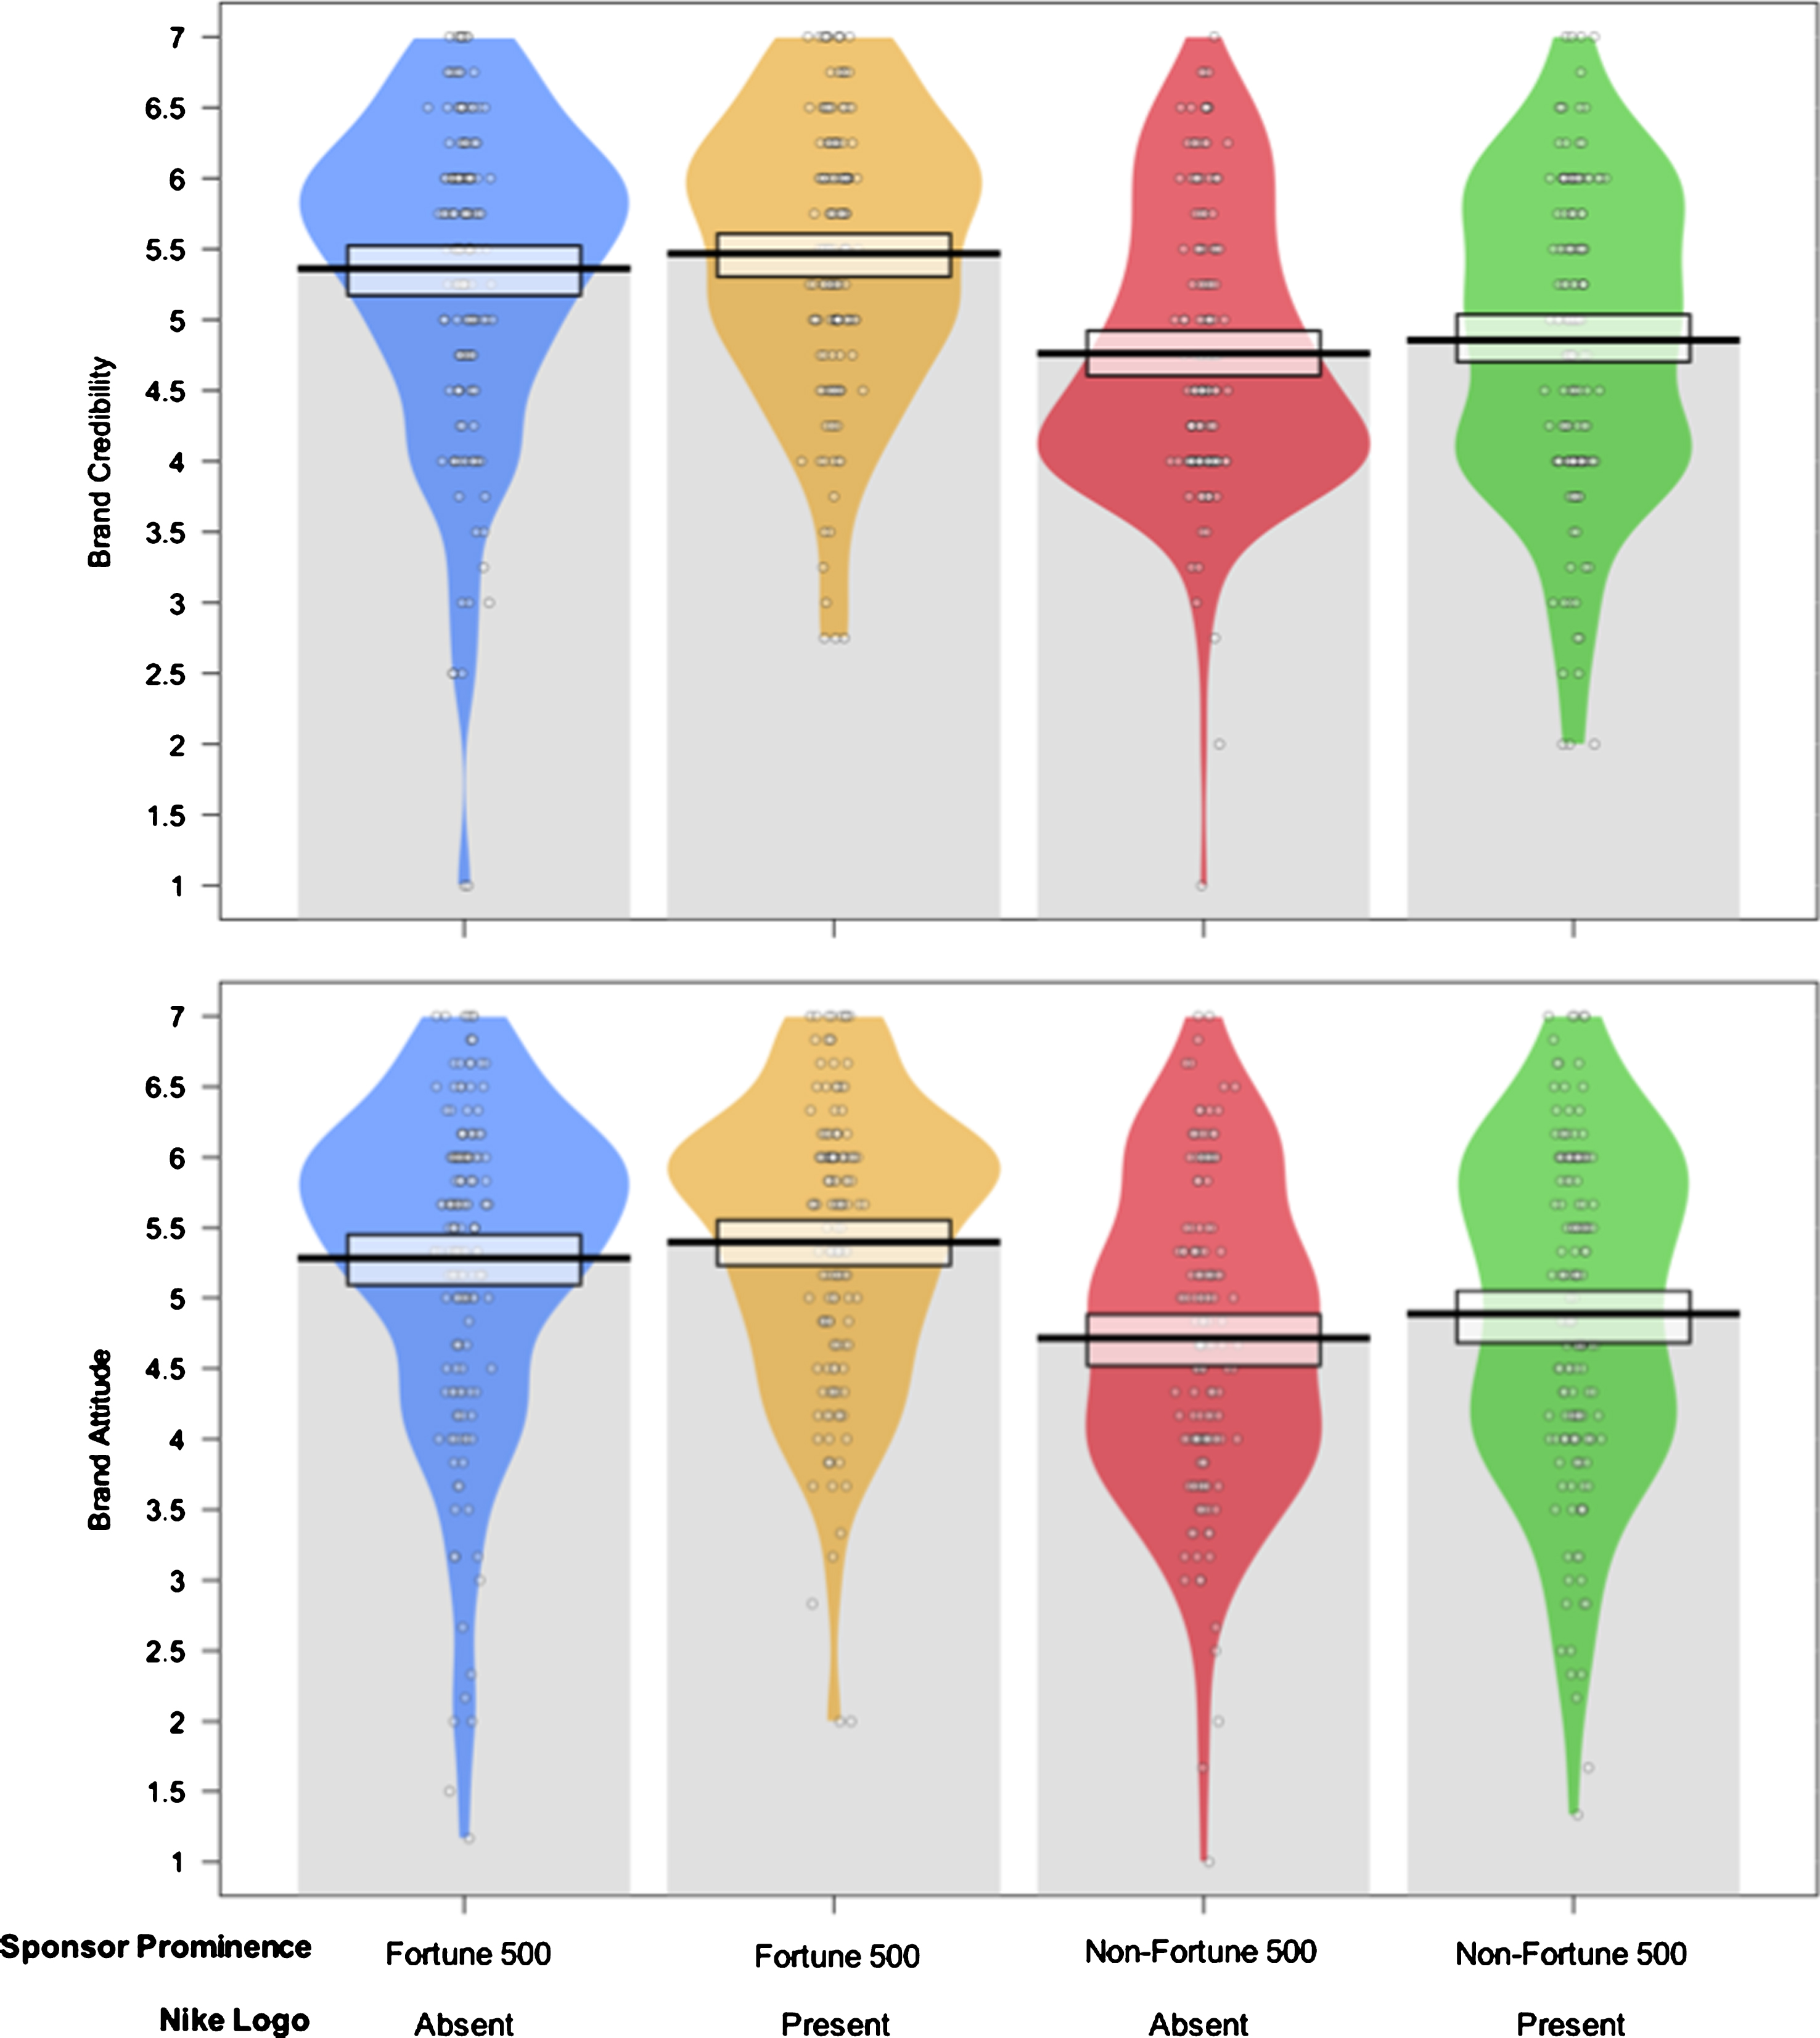
Subjects presented jerseys with sponsors of high prominence with the manufacturer logo offered significantly higher brand attitudes and ratings of credibility than those shown jerseys with brands of low prominence both with (MDBatt = 0.51, p < 0.001, 95% CI 0.18, 0.84]; MDBC = 0.51, p < 0.001, 95% CI [0.20, 0.81]) and without (MDBatt = 0.68, p < 0.001, 95% CI [0.35, 1.02]; MDBC = 0.71, p < 0.001, 95% CI [0.39, 1.02]) the Nike manufacturer logo. These differences between low prominent brands both with (MDBatt = 0.40, p = 0.01, 95% CI [0.08, 0.72]; MDBC = 0.51, p < 0.001, 95% CI [0.20, 0.81]) and without (MDBatt = 0.57, p < 0.001, 95% CI [0.25, 0.90]; MDBC = 0.60, p < 0.001, 95% CI [0.29, 0.91]) the manufacturer logo were also evident when compared to fans presented such highly prominent brand sponsored jerseys without the Nike logo. Figure 3 provides a graph of these results.
Fig. 3.
Pirateplot displaying group comparisons for brand attitude and credibility.
3.3.4Brand awareness
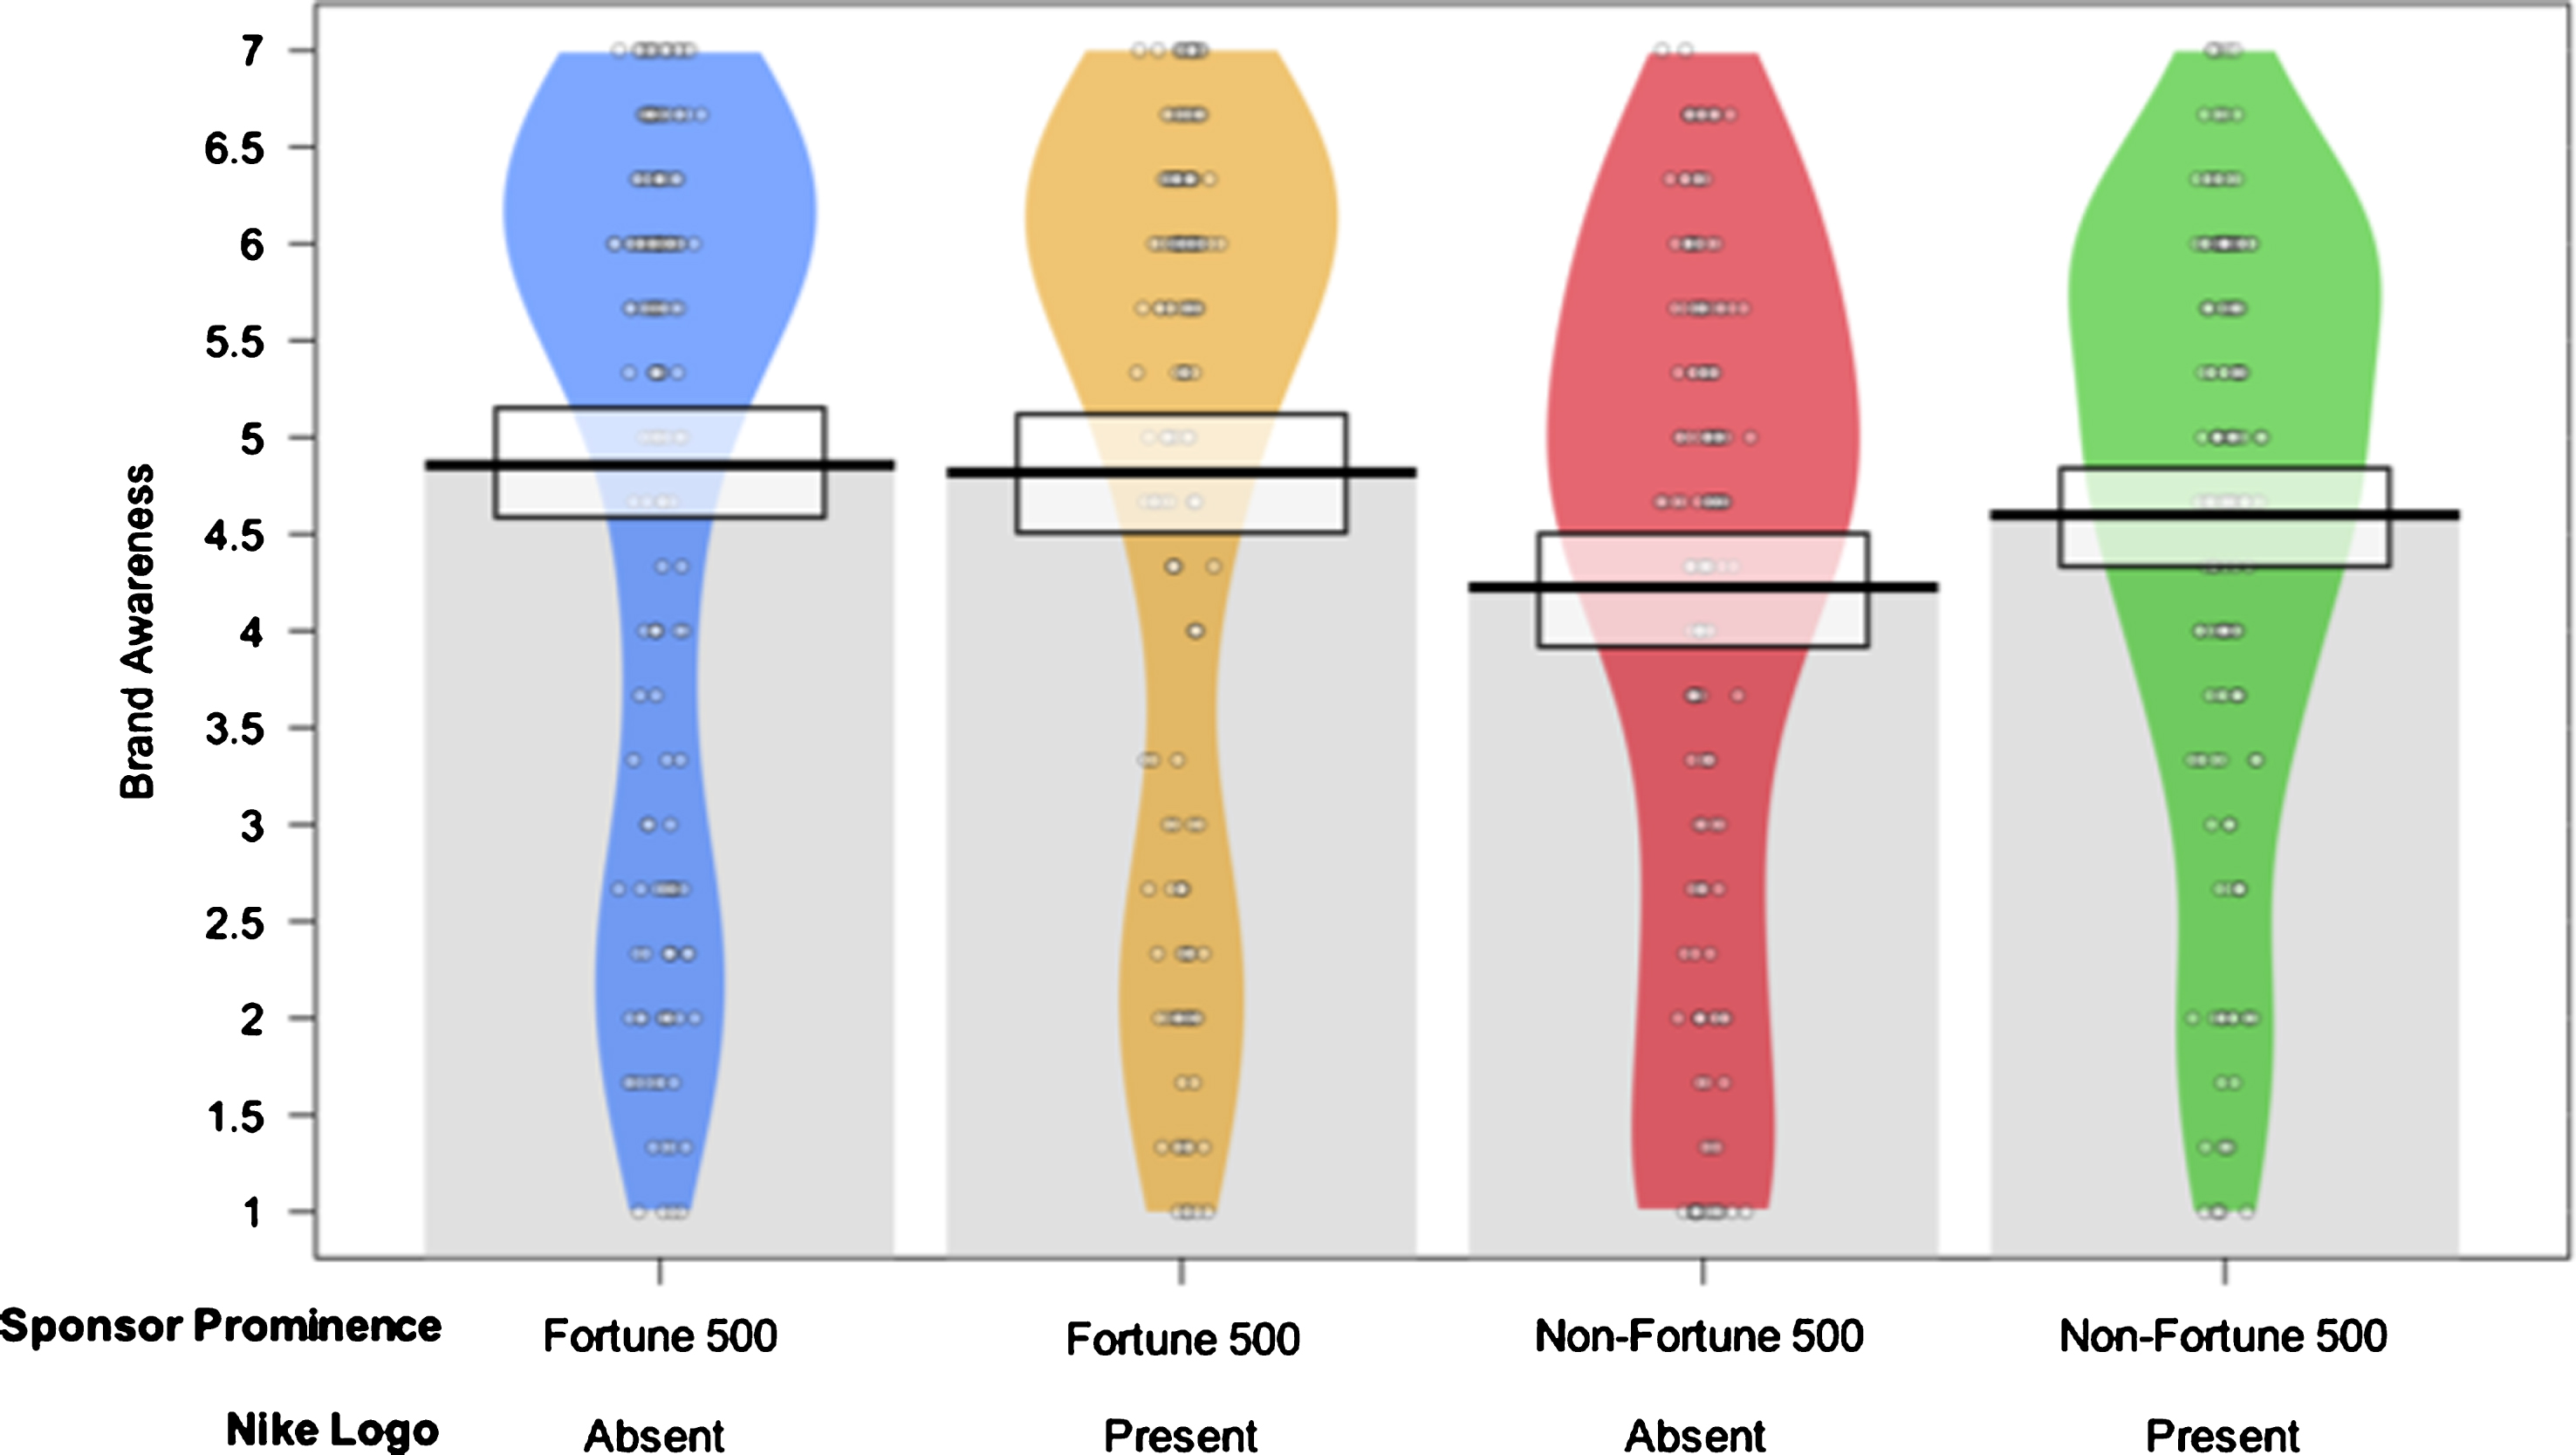
In addition, fans shown sponsored jerseys with brands of lower prominence without the Nike logo reported lower brand awareness than subjects who observed jerseys with highly prominent brand sponsors both with (MD = –0.59, p = 0.02, 95% CI [–1.12, –0.06]) and without (MD = –0.63, p = 0.01, 95% CI [–1.14, –0.11]) the manufacturer logo (see Fig. 4).
Fig. 4.
Pirateplot displaying group comparisons for brand awareness.
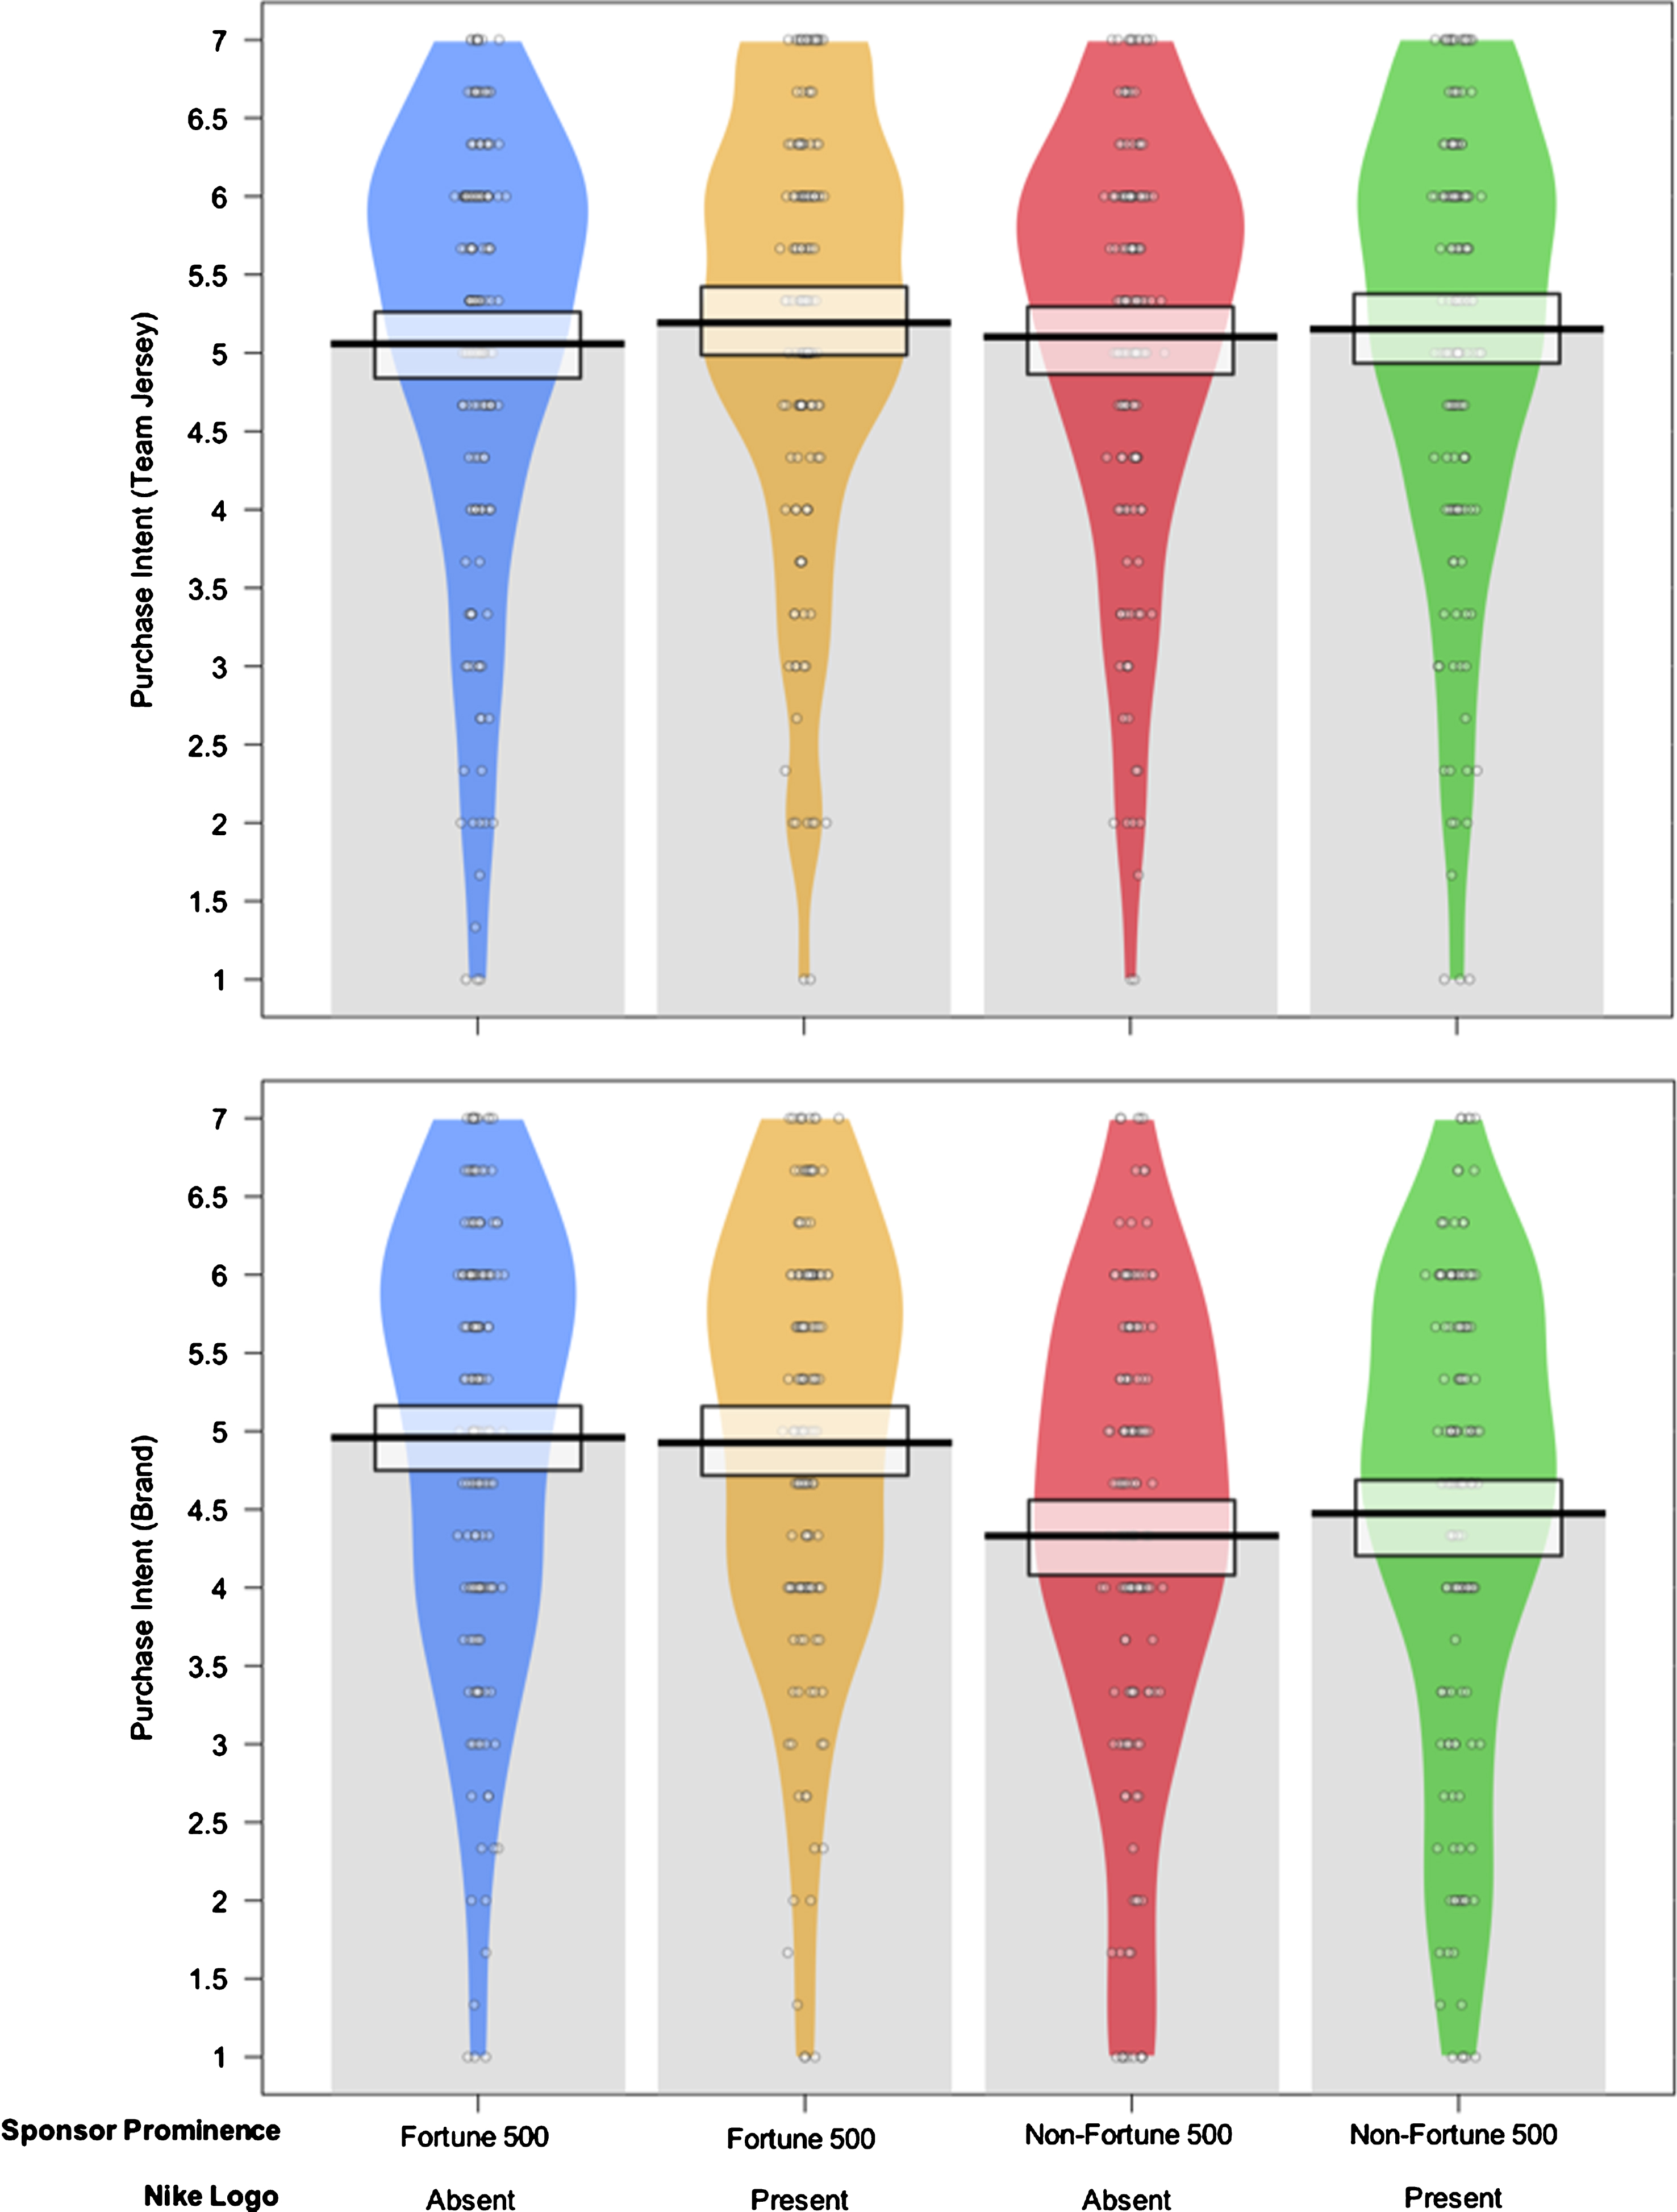
3.3.5Purchase intent
Lastly, fans who were shown jerseys with highly prominent sponsoring brands both including (MD = 0.45, p = 0.04, 95% CI [0.02, 0.88]) and excluding (MD = 0.48, p = 0.02, 95% CI [0.07, 0.90]) the Nike manufacturer logo expressed a greater willingness to purchase that brand’s products/services than individuals exposed to jerseys of less prominent sponsors with the Nike logo. These differences between subjects presented highly prominent sponsoring brands with (MD = 0.60, p = 0.003, 95% CI [0.16, 1.03]) and without (MD = 0.63, p = 0.001, 95% CI [0.20, 1.05]) the manufacturer logo were identical when juxtaposed against fans shown jerseys with brands of low prominence without the Nike logo. Figure 5 provides a visual illustration of these results.
Fig. 5.
Pirateplot displaying group comparisons for purchase intent of team jerseys and the manipulated sponsoring brand’s product/services.
4Discussion
The NBA has become the first of the “Big Four” professional leagues in the United States to adopt jersey sponsorship via their three-year pilot program. Twenty out of the 30 teams have secured a sponsor in the first year of its pilot program. While there is little doubt that the jersey sponsorship program will bring in additional revenue for teams, it is indefinite what factors will influence how fans respond to jersey sponsors. In order to provide empirical evidence from a consumer perspective, the current study utilized an online experiment to assess which market-, team-, manufacturer-, and individual-factors affect fans’ perceptions toward potential sponsors of their favorite teams. We developed 180 press releases and 360 graphic renderings of jerseys with hypothetical sponsors as research stimuli and collected data from NBA fans (N = 621) through a popular crowdsourcing panel (i.e., Amazon Mechanical Turk). Our findings provide useful evidence for decision makers to understand which aspects may meaningfully impact fans’ reactions to the NBA’s new sponsorship pilot program.
Consistent with our expectation and previous research, our results indicated that avid fans showed more favorable responses on all measures than casual fans. It is not surprising that fans who feel more attached to the team are more positive toward the jersey sponsor than the less attached fans. This is in line with previous sponsorship research that team identification is an important antecedent to key sponsorship outcomes (e.g., sponsor recognition, attitude toward the sponsor, sponsor patronage; Gwinner & Swanson, 2003; Meenaghan, 2000).
In terms of the origin of fans, international NBA fans showed more positive responses than domestic fans on brand attitude, brand awareness, brand credibility, and purchase intentions. It was interesting to see a significant difference in the origin of fans, given that international NBA fans showed greater acceptance towards the jersey sponsor than the domestic fans. While we speculate that cultural differences may exist on how sports fans perceive corporate sponsors on jerseys, future research should attempt to pinpoint other conditions regarding why such differences may occur (e.g., frequent exposure to sponsors through other global sports, such as soccer). Furthermore, more research should be conducted to identify if there is a difference among key international markets for the league.
Market-related factors showed mixed results. The teams’ market size had little effect on the perception toward the sponsor. However, a sponsoring brand’s prominence had a significant impact on all outcome measures. If the sponsoring brand was a Fortune 500 company (e.g., Intel), fans reported greater levels of brand awareness, attitude, and credibility. Fans also showed higher levels of purchase intention when the sponsoring brand is a Fortune 500 company. It was also interesting that when a non-Fortune 500 corporation (e.g., Panoz) was presented as a jersey sponsor, there were meaningful changes in self-reported brand prominence and brand credibility. This suggests that non-Fortune 500 companies can benefit from sponsoring an NBA team, as it can help increase the fans’ perception of the brand’s importance and credibility. We show that this boosting effect is more prevalent among non-Fortune 500 brands. Marketers may find this result noteworthy as a single exposure to the research stimuli had an immediate boosting impact among lesser known brands. By simply pairing its brand with an NBA team’s uniform, the sponsor was able to significantly increase their brand perception.
Another factor that we considered was whether the presence (or absence) of the manufacturer’s logo (Nike) had any impact on sponsor perceptions. As noted earlier, we manipulated this variable since the league’s pilot program allowed the manufacturer logo to appear on the front of jersey for the first time. We sought to explore if having a “swoosh” logo on the uniform affects fans’ responses to a sponsor. We found that the presence of Nike’s “swoosh” had a significant impact on increasing the reported brand prominence. However, this result was not evident among the other outcome measures. This specific finding shows that Nike’s logo on the jersey can have an uplifting effect for sponsors looking to increase their brand reputation. Therefore, the “swoosh” logo can be a leveraging point for corporate partnership managers from teams, with the evidence from our findings that co-branding with Nike’s logo enhances brand reputation. Our findings also have implications for apparel brands, as well as other sports leagues on assessing the value of such partnerships, as having a manufacturer logo printed on the uniform may add more value to sponsors.
Our findings also showed that a team’s success (i.e., quantified by advancing into the playoffs) in the previous season did not have any significant impact on our outcome measures. While fluctuating team performance is a unique aspect in sports marketing and analytics, our findings suggest that a team’s playoff status had no effect on sponsorship-related outcomes. Rather, team identification may play a more prominent role in this relationship. In fact, Ngan et al. (2011) found that a team’s win or loss had no effect on purchase intention of sponsors among highly identified fans. Likewise, future research might consider examining the interaction among team performance and team identification on sponsor evaluation. In addition, future research might operationalize a team’s success differently (e.g., cumulative winning percentage in recent seasons) to revisit the relationship between team performance and sponsor evaluation.
Overall, our study provides novel, empirical evidence on how NBA fans respond to jersey sponsors. By conducting an online experiment employing hypothetical scenarios and graphic renderings of jerseys bearing a sponsor patch as research stimuli, the findings of our study shed actionable insights that practitioners can use to determine precisely how fans may respond to specific market-, team-, manufacturer-, and individual-related factors. While the purpose of this study was to manipulate the sponsoring brand’s prominence, we also acknowledge that adding a condition with a jersey that did not bear a patch would provide additional information on whether sponsoring a team’s jersey adds value to the sponsor. Future studies might include stimuli that present jerseys without a sponsor’s patch as a control condition. Another interesting avenue for future research would be to examine the value of a corporation that sponsors multiple teams in different leagues and regions. For instance, Rakuten sponsors jerseys for both La Liga’s F.C. Barcelona and the NBA’s Golden State Warriors. It would be interesting to examine whether having multiple jersey sponsorships impacts consumers’ perceptions toward the sponsor. In doing so, future research may better inform the domain of professional sports, as well as existing literature on how prospective endeavors to implement pilot sponsorship programs in other sports leagues (e.g., the NFL, NHL, MLB) may affect fans. All things considered, we hope the present study stimulates further research efforts to expand our understanding of jersey sponsors from consumers’ perspectives.
Appendices
Appendix A. Sample associated press article
Appendix B. Sample graphic rendering of jersey stimuli
Appendix C. Measures used in the experiment
Team Identification (TI), α = 0.83 (adapted from Wann & Branscombe, 1990)
1. How important to you is it that the (identified team name) win?
2. How strongly do you see yourself as a fan of the (identified team name)?
3. How strongly do your friends see you as a fan of the (identified team name)?
4. During the season, how closely do you follow the (identified team name) via ANY of the following?
a) in person or on television
b) on the radio
c) television news
d) through applications on your smartphone, tablet, or computer
e) online sports site or blog
5. How important is being a fan of the (identified team name) to you?
6. How much do you dislike the greatest rivals of the (identified team name)?
7. How often do you display the name or logo of the (identified team name) at your place of work, where you live, in your car, on your cell phone, on your laptop, or on your clothing?
Brand Prominence (BP), α= 0.90 (reliability assessment includes subjects’ responses before and after exposure to stimuli; adapted from Han, Nunes, & Dreze, 2010)
1. How prominent is (manipulated sponsor name) as a brand?
Brand Favorability (BF), α= 0.88 (reliability assessment includes subjects’ responses before and after exposure to stimuli; adapted from Spalding, Cole, & Fayer, 2009)
1. How would you describe your overall opinion about (manipulated sponsor name)?
Brand Attitude (Batt), α= 0.94 (Janssen, Fransen, Wulff, & Reijmersdal, 2016; Van Noort & Willemsen, 2012)
1. I believe (manipulated sponsor name) is good.
2. I believe (manipulated sponsor name) is trustworthy.
3. I believe (manipulated sponsor name) is respectable.
4. I believe (manipulated sponsor name) is of high quality.
5. I believe (manipulated sponsor name) is interesting.
6. I believe (manipulated sponsor name) is relevant.
Brand Awareness (Bawr), α= 0.93 (Yoo & Donthu, 2001)
1. I am aware of (manipulated sponsor name).
2. I can recognize (manipulated sponsor name).
3. Some characteristics of (manipulated sponsor name) come to mind quickly.
Brand Credibility (BC), α= 0.89 (adapted from Newell & Goldsmith, 2001)
1. (Manipulated sponsor name) is sincere.
2. (Manipulated sponsor name) is an expert in their field.
3. (Manipulated sponsor name) is honest
4. (Manipulated sponsor name) is experienced.
Purchase Intent of Brand (PIbr), α= 0.89 (adapted from Dodds et al., 1991; Moon et al., 2008; Sweeney et al., 1999)
1. I will purchase (product/service) from (manipulated sponsor name).
2. I would recommend (manipulated sponsor name) to my friends, family, peers, and/or colleagues.
3. There is a strong likelihood that I would purchase (product) from (manipulated sponsor name).
Purchase Intent of Jersey (PIjsy), α= 0.93 (adapted from Dodds, Monroe, & Grewal, 1991; Moon, Chadee, & Tikoo, 2008; Sweeney, Soutar, & Johnson, 1999)
1. I will purchase a (identified team name) jersey.
2. I would recommend a (identified team name) jersey to my friends, family, and/or colleagues.
3. There is a strong likelihood that I would purchase a (identified team name) jersey.
References
1 | BBC, 2016, Barcelona signs sponsorship deal with Rakuten. [online] Available at: http://www.bbc.com/news/business-38003752 |
2 | Brown, M. , (2017) , Inside the Golden State Warriors' $60 million jersey patch deal with Rakuten. Forbes. [online] Available at: https://www.forbes.com/sites/maurybrown/2017/11/27/inside-the-golden-state-warriors-record-60-million-jersey-patch-deal-with-rakuten/ |
3 | Cialdini, R.B. , Borden, R.J. , Thorne, A. , Walker, M.R. , Freeman, S. & Sloan, L.R. , (1976) , Basking in reflected glory: Three (football) field studies, Journal of Personality and Social Psychology, 34: (3), 366–375. |
4 | Dodds, W.B. , Monroe, K.B. & Grewal, D. , (1991) , Effects of price, brand, and store information on buyers' product evaluations, Journal of Marketing Research, 28: (3), 307–319. |
5 | Faul, F. , Erdfelder, E. , Buchner, A. & Lang, A.G. , (2009) , Statistical power analyses using G* Power 3.1: Tests for correlation and regression analyses, Behavior Research Methods, 41: (4), 1149–1160. |
6 | Garcia, A. , (2016) , NBA becomes first major US sports league to allow ads on jerseys. [online] Available at: http://money.cnn.com/2016/04/15/news/nba-jerseys-corporate-sponsors/ |
7 | Gwinner, K. & Swanson, S.R. , (2003) , A model of fan identification: Antecedents and sponsorship outcomes, Journal of Services Marketing, 17: (3), 275–294. |
8 | Han, Y.J. , Nunes, J.C. & Drèze, X. , (2010) , Signaling status with luxury goods: The role of brand prominence, Journal of Marketing, 74: (4), 15–30. |
9 | Janssen, L. , Fransen, M.L. , Wulff, R. & Reijmersdal, E.A. , (2016) , Brand placement disclosure effects on persuasion: The moderating role of consumer self-control. Journal of Consumer Behaviour, 15: (6), 503–515. |
10 | Kutz, S. , (2017) , 19 NBA teams have now sold ad space on their jerseys. Available at: https://www.marketwatch.com/story/this-company-will-pay-the-golden-state-warriors-20-million-a-year-for-an-ad-on-its-jerseys-2017-09-12 |
11 | Kwak, D.H. , Kwon, Y. & Lim, C. , (2015) , Licensing a sports brand: Effects of team brand cue, identification, and performance priming on multidimensional values and purchase intentions, Journal of Product & Brand Management, 24: (3), 198–210. |
12 | Kwon, H.H. , Kim, H. & Mondello, M. , (2008) , Does a manufacturer matter in co-branding? The influence of a manufacturer brand on sport team licensed apparel, Sport Marketing Quarterly, 17: (3), 163–172. |
13 | Lefton, T. & Lombardo, J. , (2016) , Will jersey ads bring big bucks? [online] Available at: http://m.sportsbusinessdaily.com/Journal/Issues/2016/04/25/Leagues-and-Governing-Bodies/NBA-jersey-ads.aspx? |
14 | Lombardo, J. , (2018) , Dating app Bumble inks $20 million jersey sponsorship with NBA team. [online] Available at: https://www.bizjournals.com/austin/news/2018/03/06/bumble-20-million-nba-la-clippers-jersey-sponsor.html |
15 | Moon, J. , Chadee, D. & Tikoo, S. , (2008) , Culture, product type, and price influences on consumer purchase intention to buy personalized products online, Journal of Business Research, 61: (1), 31–39. |
16 | Newell, S.J. & Goldsmith, R.E. , (2001) , The development of a scale to measure perceived corporate credibility, Journal of Business Research, 52: (3), 235–247. |
17 | Ngan, H.M. , Prendergast, G.P. & Tsang, A.S. , (2011) , Linking sports sponsorship with purchase intentions: Team performance, stars, and the moderating role of team identification, European Journal of Marketing, 45: (4), 551–566. |
18 | Phillips, N. , (2017) , yarrr package guide [Computer software]. R package version 0.1.5. [online] Available at: https://cran.r-project.org/web/packages/yarrr/vignettes/guide.html |
19 | Rovell, D. , (2016) , 76ers sell first NBA jersey ad. [online] Available at: http://www.espn.com/nba/story/_/id/15559477/philadelphia-76ers-sell-first-nba-jersey-advertisement-stubhub |
20 | Smith, C. , (2016) , The most valuable sponsorship deals in soccer. [online] Available at: https://www.forbes.com/sites/chrissmith/2016/05/11/the-most-valuable-sponsorship-deals-in-soccer/#7308139c59e0 |
21 | Spalding, L. , Cole, S. & Fayer, A. , (2009) , How rich-media video technology boosts branding goals, Journal of Advertising Research, 49: (3), 285–292. |
22 | Sweeney, J.C. , Soutar, G.N. & Johnson, L.W. , (1999) , The role of perceived risk in the quality-value relationship: A study in a retail environment, Journal of Retailing, 75: (1), 77–105. |
23 | Van Noort, G. & Willemsen, L.M. , (2012) , Online damage control: The effects of proactive versus reactive webcare interventions in consumer-generated and brand-generated platforms. Journal ofInteractive Marketing, 26: (3), 131–140. |
24 | Wakefield, K.L. & Bennett, G. , (2010) , Affective intensity and sponsor identification, Journal of Advertising, 39: (3), 99–111. |
25 | Wann, D.L. & Branscombe, N.R. , (1990) , Die-hard and fair-weather fans: Effects of identification on BIRGing and CORFing tendencies, Journal of Sport and Social Issues, 14: (2), 103–117. |
26 | Yoo, B. & Donthu, N. , (2001) , Developing and validating a multidimensional consumer-based brand equity scale. Journal of Business Research, 52: (1), 1–14. |


