
Side-out success and ways that points are obtained in women’s college volleyball
Abstract
The purpose of this study was to assess side-out success and ways that points are obtained in relation to the result of the game in women’s college volleyball. A total of 2,435 rallies from 48 sets of the Missouri Valley Conference (NCAA Division I) were analyzed. The variables studied were: game phase, phase efficacy, reason for the success or error, number of times that the ball went over the net, result of the game, attack tempo, reception efficacy, and type of set. The findings provide reference values to guide the analysis of the volleyball team and understand the way winning teams score and build their side-out in the women’s college population. The results show the importance of side-out phase efficacy as a variable to monitor team performance in competition and the individual actions that correlate most with side-out phase success. The action that best differentiates winning and losing teams was the attack after reception. The results show the contribution of different ways to build the side-out. The actions with greater contribution were the ones that increased the setter’s possibilities to build the offense and accelerate the game, such as through the reception efficacy and the use of the jump set.
1Introduction
Performance in volleyball depends on multiple factors. In matches, the actions of players on both teams interact as complex systems (Glazier, 2010). This is an emergent area of study within sport performance (McGarry, O’Donoghue & Sampaio, 2013). Although studying the performance indicators that correlate with the match result is commonly done in volleyball by researchers and coaches (Palao & Hernández-Hernández 2014;Silva et al., 2016), more studies are needed to better understand the nature of the game and the different aspects that affect performance. Along these lines, it is common to study and analyze the aspects that affect performance by carrying out a molecular study of the variables (e.g. temporal, spatial, previous, contextual, etc. variables that affect the attack). This type of study risks not providing correct information about the role of the actions in the game. In volleyball, there are different ways to obtain points (Ahrabi-Fard & Hensley 1995; Zimmerman, 1999). The understanding of the game must start from the study of the weight of the different game phases on team success and at the different levels of competition. In this regard, most of the studies have been done in peak performance and in men’s volleyball (Mesquita et al., 2013; Silva et al., 2016). Less information has been found in formative stages, such as at the university level (U-23). Information is needed about the different levels of competition and categories in order to properly understand the game phases and the aspects that affect performance (García-Alcaraz, Ortega, & Palao 2015; Mesquita et al., 2013).
From a general perspective, there is an imbalance in success when teams are on side-out (team in reception) as compared to when teams are in serve and defense (serving team) (Palao, 2004; Silva, Lacerda, & Joao 2014). Researchers indicate that if a team has a side-out success of 70% in males and 63.5% in females, they will win the game (Fellingham, Collings, & McGown 1994; Palao, 2004, 2008). A closer analysis of success in side-out shows that it is composed of the opponent error in service, side-out success (first attack), counter-attack success (attack and block), and opponent errors. The success of the counter-attack phase is composed of the points in service, opponent error in side-out (first attack), success in counter-attack (attack and block), and opponent errors. However, previous studies have analyzed the actions that affect success from an isolated perspective or without considering the contribution to the collective efficacy. The number of studies that analyze collective efficacy is low, and they are done at the peak performance level: such as international competitions or Olympic Games (Palao, 2004; Zhang, 2000). Previous studies related to performance in volleyball have shown a correlation between the spike and winning actions, games, and matches (Mesquita et al., 2013; Silva et al., 2016). For males, also in teams of similar levels, it has been found that the block is a key aspect in determining final classification in competition. However, for females, this tendency has been not found, probably due to the strength of the offense being lower, what make the game has more continuity (Kountouris et al., 2015; Palao, Manzanares, & Ortega 2009; Stamm et al., 2016). Most of these studies have focused on terminal actions and not on preparatory actions such as way of executing the reception, the set, length of the rally, etc. Additionally, these data are based on international level teams and are not applicable to teams in the formative process. There is currently little information about developmental stages which can affect the objective information available about the long-term development of female volleyball players. The purpose of this study was to determine the ways that women’s college volleyball teams achieve success in side-out and the ways that point are obtained in relation to the result of the game.
2Method
The sample included 16 teams from the Missouri Valley Conference (Division I college league of the United States). A total of 2435 rallies from 48 games of women’s college volleyball were analyzed. The matches analyzed were from the conference and non-conference games of the 2008 season. A maximum of five matches per team was included in the sample.
A descriptive intra-group study was done using observational methodology (Anguera, 2003). The variables studied were: a) game phase: side-out (team that receives) or serve-and-defense (team that serves); b) efficacy of the phase: success or error; c) result of the rally: win or loss; d) reason for the success or error of the phase (error serve, attack point, counter-attack point, block point of opponent counter attack, opponent error, opponent serve ace, attack error, opponent block, opponent counter-attack point, counter-attack error, and error); e) number of times that the ball went over the net (i.e. number of possibilities for scoring); f) result of the game: win or loss; g) attack tempo of the first attack (Palao, Manzanares, & Ortega 2015): first tempo, second tempo, third tempo, the hitter had not started the approach when the set was done; attack on second contact; and out-of-system attack; h) reception efficacy (error, no attack options, limited attack options, and maximum team attack options); and i) type of set for the first attack. Whether or not the setter carried out their sets while jumping was recorded.
The attack tempo was categorized according to the following criteria (Palao et al., 2015): 1) first tempo or quick attack, the hitter jumped before or when the set was done; 2) second tempo, the hitter was taking the last step of the approach when the set was done; 3) third tempo or high attack, the hitter had not started the approach when the set was done; 4) attack on second contact; and 5) out-of-system attack. The efficacy of the reception was evaluated in relation to its success and the options that the actions gave the analyzed team and the opponent. Four levels to categorize the performance were differentiated (Coleman, Neville, & Gordon 1969; Palao et al., 2015): error (0), no attack options for the team in reception (1), limited attack options for the team in reception (2), and maximum team attack options for the team in reception (3).
The matches were recorded from a posterior view and at an approximate height of three meters by researchers and/or one of the conference teams. The recording included the entire volleyball court. The quality of the recording allowed for collecting the information regarding the study’s variables (HD 1080p 60 Hz). The observation and coding was done by one of the expert observer (more ten years of experience in volleyball statistics) who was trained following the criteria established by Anguera (2003). The coding was done in a spreadsheet. The quality of the data recorded by the observers was monitored through the elimination of incongruities, random review of the analysis, and spreadsheet cell blocking and/or protecting. Ten percent of the sample was re-analyzed to ensure quality of the data. After training and during the analysis, the inter-observer and intra-observer reliability percentages of the studied variables were calculated between the observer and one of the researchers (Anguera, 2003). The observer had an inter-observer reliability greater than 0.85 and an intra-observer reliability greater than 0.97 for all the studied variables (Cohen’s Kappa).
Descriptive and inferential analyses of the data were done using the SPSS 21.0 software (Chi-Square Test and likelihood ratio). The level of statistical significance was set at p < 0.05. The likelihood of the data to increase or decrease the occurrence between winning and losing a game was expressed using a plus and minus symbol. The plus symbol was used to show an increasing tendency of the occurrence and the minus symbol was used to show a decreasing tendency of the occurrence.
3Results
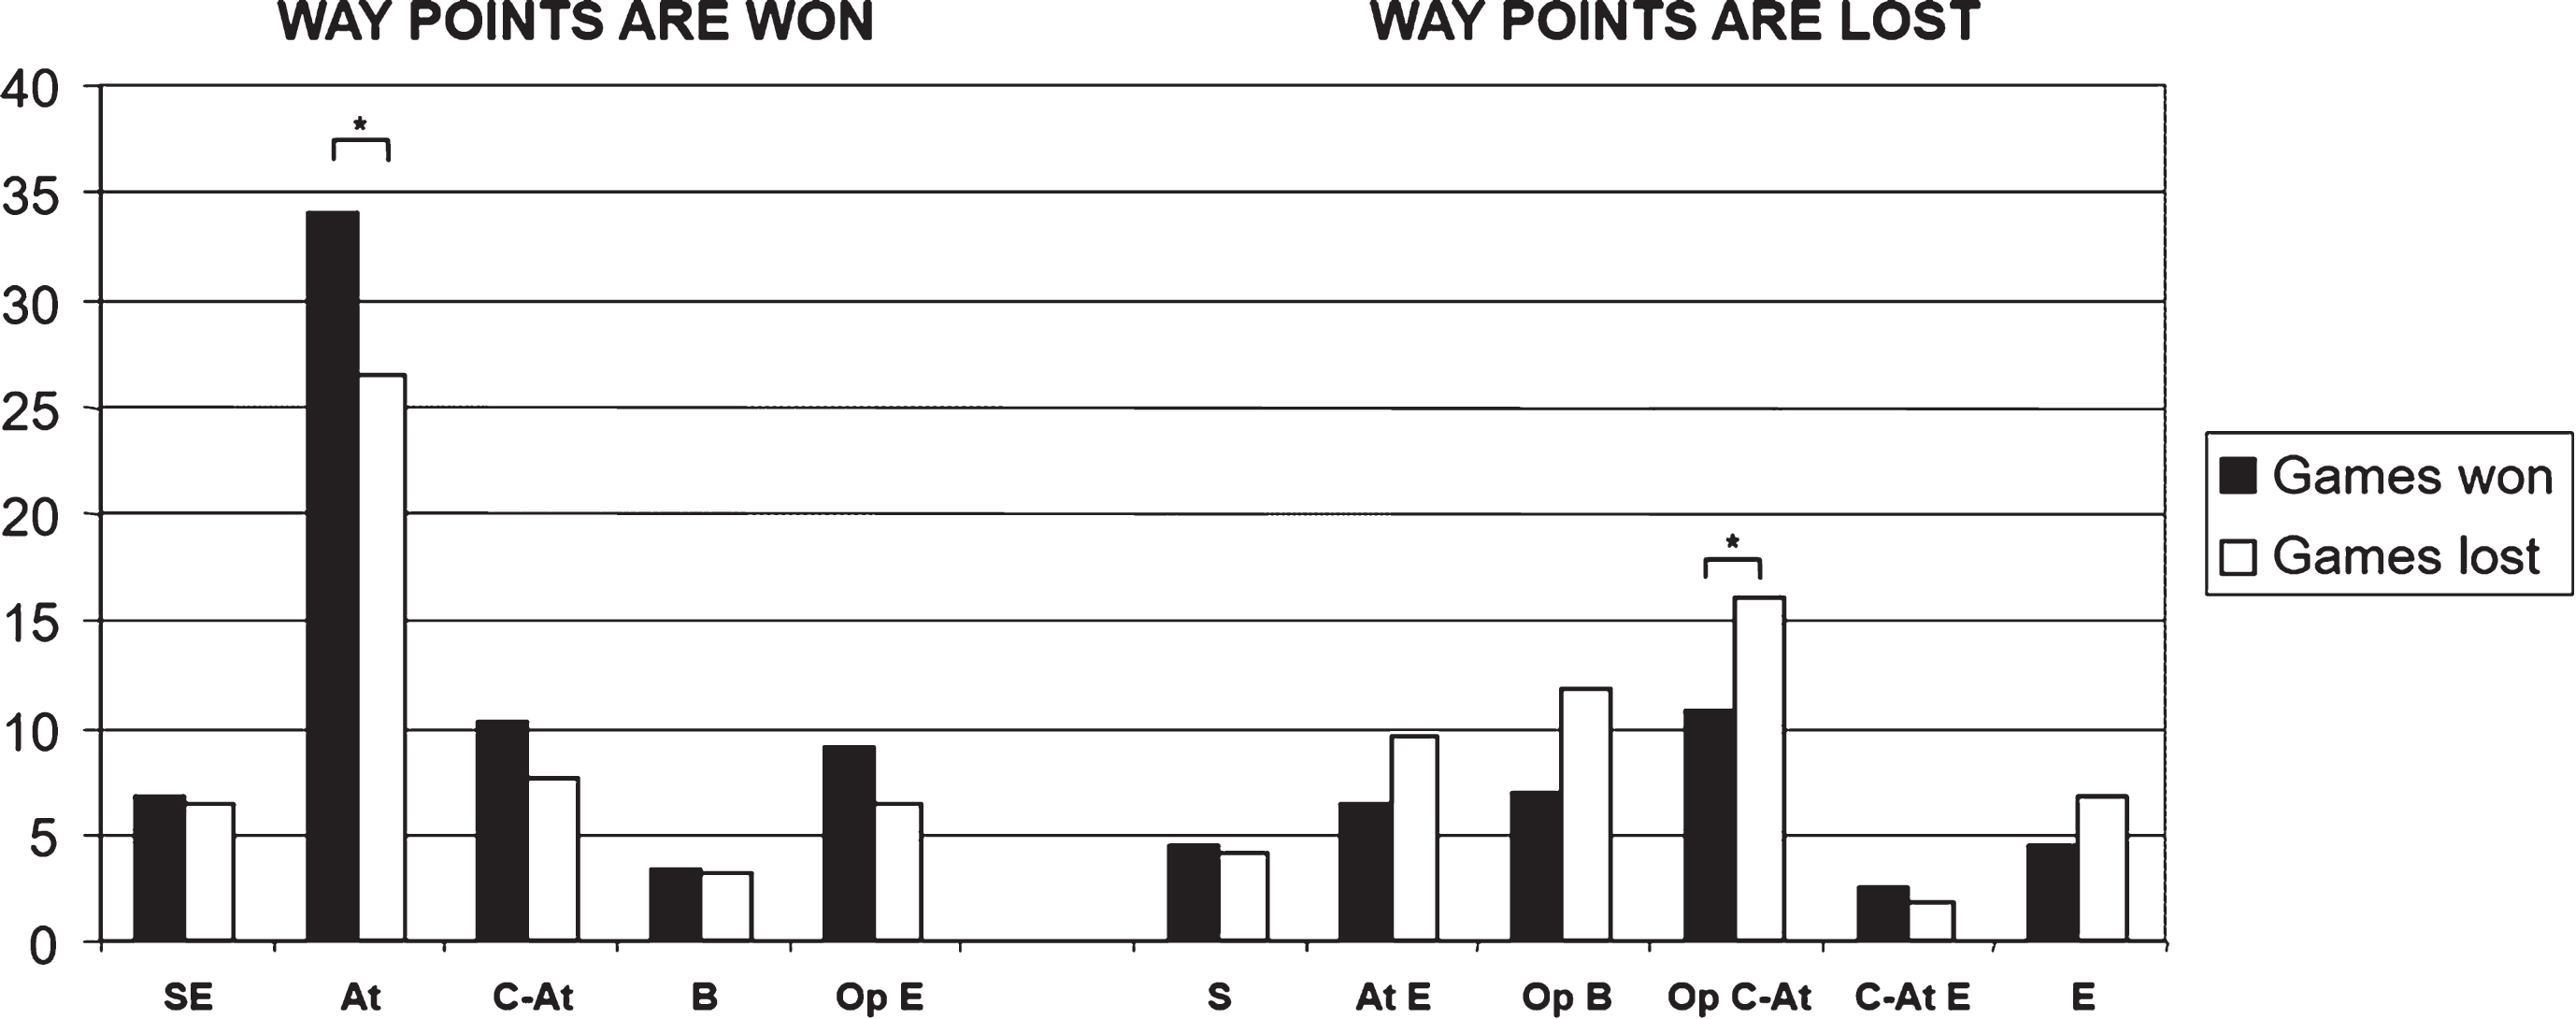
In relation to the side-out success (Fig. 1), a significantly higher percentage of side-out success was found among teams that won the game (63.5% vs. 49.9%). Significant differences were found in points achieved by attack. For the teams that lost the game, significant differences were found in opponent points from counter-attack.
Fig.1
Side-out success and way that it was obtained by women’s college volleyball teams (values are expressed in percentages). Legend: W SO: successful side-out; SE: serve error; At: attack points; C-At: counter-attack points; B: block point from opponent’s counter-attack; Op E: Opponent errors; L SO: unsuccessful side-out; S: Opponent serve aces; At E: attack errors; Op B: opponent blocks; Op C-At: Opponent counter-attack points; C-At E: counter-attack errors; E: Errors. *Statistically significant at a level of p < 0.001 (Chi-Square Test). + and –indicate the type of relation found (positive or negative).
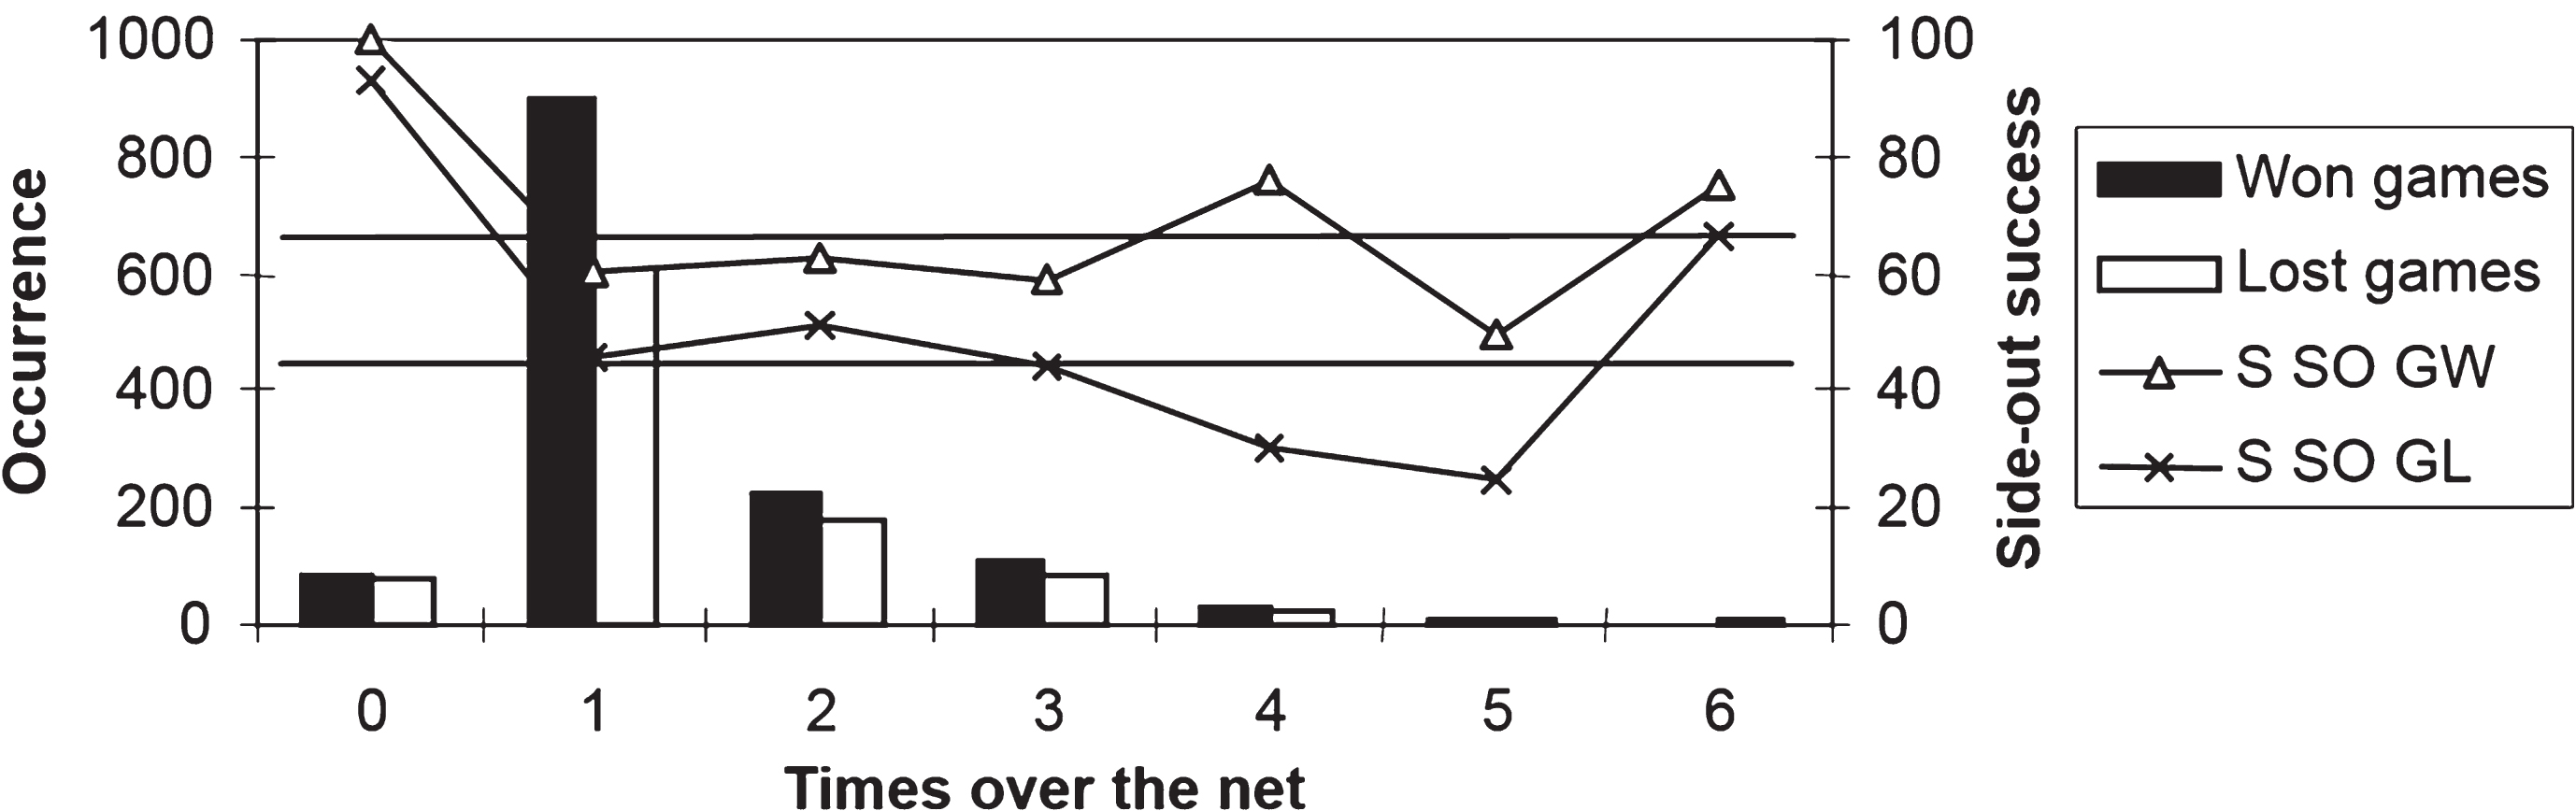
Regardless of how long the rallies went, winning teams always achieved better performance, and they had better success percentages than teams in defense (Table 1 and Fig. 2). These differences are significant for teams that won the game when the ball did not cross the net or when it crossed the net once in won and lost games, and for teams that lost the games when the ball crossed the net four times in games that were lost. In ninety-nine percent of the plays, the ball went over the net fewer than five times. The average number of times that the ball went over the net was 1.38 per winning team and 1.35 per losing teams.
Table 1
Side-out success in relation to opportunities to score (number of rallies) in women’s college volleyball teams (values are expressed in percentages)
| Times that the ball crossed the net (number of rallies) | |||||||||
| 0 | 1 | 2 | 3 | 4 | 5 | 6 | ≥7 | Total | |
| Won games | |||||||||
| W | 74+ | 433+ | 114 | 50 | 19 | 4 | 3 | 0 | 697 |
| L | 0– | 285– | 68 | 35 | 6 | 4 | 1 | 2 | 401 |
| % | 100 | 60.3 | 62.6 | 58.8 | 76.0 | 50.0 | 75.0 | 0.0 | 63.5 |
| Lost games | |||||||||
| W | 83+ | 415– | 113 | 47 | 9– | 1 | 2 | 1 | 671 |
| L | 6– | 485+ | 109 | 59 | 21+ | 3 | 1 | 1 | 685 |
| % | 93.3 | 46.1 | 50.9 | 44.3 | 30.0 | 25.0 | 66.7 | 50.0 | 49.5 |
Legend: % : percentage of occurrence of side-out success; +/– Statistically significant at a level of p < 0.001 (Chi-Square Test). + and –indicate the type of relation found (positive or negative). Note: The percentage of occurrences for this situation was: ball did not cross the net (6.6%), ball crossed the net once (65.9%), ball crossed the net twice (16.5%), ball crossed the net three times (7.8%), ball crossed the net four times (2.2%), ball crossed the net five times (0.5%), ball crossed the net six times (0.3%), ball crossed the net seven or more times (0.2%).
Fig.2
Side-out success in relation to opportunities to score (number of rallies) in female volleyball college teams (values are expressed in percentage). Legend: S SO GW: Successful side-out for games won; S SO LG: Successful side-out for games lost. The horizontal lines show the average side-out success and defense success (serving team) found in this study.
For both won and lost games, the relationship between reception and side-out was similar; when there was a better reception, there was a better side-out (Table 2). The difference was the efficacy of the side-out in this situation; winning teams achieve at least 60% of side-out success in 90% of the rallies (when they can attack).
Table 2
Side-out success in relation to reception efficacy in women’s college volleyball teams (values are expressed in percentages)
| Reception efficacy | Won games | Lost games | ||
| Occurrence (%) | Side-Out % | Occurrence (%) | Side-Out % | |
| Error | 4.61 | 0* | 4.5 | 0.0* |
| No attack options | 6.6 | 46.3* | 7.2 | 25.0* |
| Limited attack | 44.4 | 60.3 | 48.7 | 45.2 |
| All attack options | 44.4 | 70.9* | 39.6 | 57.1* |
Legend: Occurrence (%): percentage of occurrence; Side-out % : Successful side-out percentage; *Statistically significant at a level of p < 0.001 (Chi-Square Test).
Teams that won the game presented higher side-out success using all types of attack tempos, except when the second contact attack was used by the setter where both teams had similar efficacy values (Table 3). No differences were found in the use of the different types of attack between winning and losing teams. In teams that lost, the quick attacks and second contact attack presented a significantly higher probability of winning the rally, while the third tempo and out-of-system attacks presented a significantly higher probability of losing the play. These tendencies were not found in winning teams.
Table 3
Side-out success in relation type of attack tempo used and the result of the rally in women’s college volleyball teams in winning and losing games (values are expressed in percentages)
| Type of attack tempo | Won games | Lost games | ||
| Occurrence | SO Won | Occurrence | SO Won | |
| First | 38.5 | 68.9 | 38.1 | 56.0+ |
| Second | 45.3 | 69.3 | 41.6 | 50.2 |
| Third | 2.5 | 54.5– | 3.9 | 34.1– |
| Second contact | 2.4 | 66.7 | 4.3 | 63.0+ |
| Out of system | 11.3 | 53.5– | 12.1 | 42.2– |
Legend: Occ %: percentage of occurrence; SO Won: Successful side-out percentage; *Statistically significant at a level of p < 0.002 (Chi-Square Test).
Teams that won the game presented higher side-out success using the standing set and the jump set (Table 4). Significant differences were found in the use of the jump set by winning and losing teams (winning teams use the jump set 7% more). However, no significant differences were found among teams that won the games in won/lost actions using the different types of set. In teams that lost the games, the use of the jump set presented a significantly higher probability of winning the rally and the use of the standing set presented a significantly higher probability of losing the rally. These tendencies have not been found in winning teams.
Table 4
Side-out success in relation to type of set used by the setter and the result of the rally in women’s college volleyball teams in winning and losing games (values are expressed in percentages)
| Type of set | Won games | Lost games | ||
| Occurrence | SO Won | Occurrence | SO Won | |
| Standing set | 67.8 | 64.8 | 74.5 | 49.1– |
| Jump set | 32.2 | 70.4 | 20.0 | 58.5+ |
Legend: Occ % : percentage of occurrence; Side-out % : Successful side-out percentage; *Statistically significant at a level of p < 0.019 (Chi-Square Test).
4Discussion
The goal of the study was to find out the ways teams score and achieve success in side-out in women’s college volleyball. The results show that winning teams presented a higher percentage of side-out success and obtained a point in more than six out of 10 side-outs (63.5%). Winning teams achieved a higher number of points attained through attack and counter-attack in side-out and obtained a higher number of points from the opponent errors in counter-attack and general errors. These results show a possible relationship between the attack efficacy of the side-out team and the number of opponent errors. Therefore, it is not only the attack that gets points, it is also that this attack does not allow the opponent to construct their counter-attack properly.
Regarding how teams that serve obtained points, winning teams achieved more than five out of 10 defenses in the game. Winning teams had more points from counter-attacks and blocks, fewer errors, fewer points from the opponent attack and counter-attack, and more points from opponent errors. These results show a possible relationship between the serve of the team in defense and the increase in the defense’s options. Therefore, the difference is not the serve aces, but rather the effect of the serve in offense and the action of block-defense-counter attack (García-Alcaraz, Ortega, & Palao 2016).
The data confirm previous results that presented side-out and defense success as good performance indicators in volleyball (Fellingham et al., 1994; Palao, 2004, 2008). The values of success percentage found in side-out for college women are similar than values found at the women’s international level (Japanese Volleyball Association, 1999; Palao, 2004). In defense, the opposite tendency was found. Women’s college teams had higher defense phase success than women’s international teams. The values found in the present study can be used as a reference for the college level to establish goals in practice and competition (adapted to the characteristics of the teams). These data also provide information about the way this side-out success should be achieved. For teams of a similar competitive level, when they work on the side-out phase in practice, for example, the goal of a minimum of six out of 10 side-outs should be established (without counting the opponent serve errors [authors’ recommendations]). Of the six positive actions of teams in side-out, at least four actions should be obtained from the first attack. The rest of the positive actions should be obtained from counter-attack and block or opponent error. These goals will ensure that teams are at least working with the quality and demands required to win the game. A goal proposal for the defense phase for college women of a similar level could be a minimum of five out of 10 defenses (counting the serve errors). Of the five positive actions by the team in defensive, at least three actions should be obtained from the block and/or from counter-attack. The rest of the positive actions should be obtained from serve and from opponent errors.
In relation to the opportunities to score, data from the current study show that winning teams in side-out had the initiative, and it did not matter how many times the ball went over the net. They still had more success. This confirms the importance of neutralizing the opponent’s serve and having a good first attack. These results confirm previous studies that show that side-out teams have better success in the following phases than teams in defense (Palao, 2004). Values found indicated that on average the ball goes over the net once at the women’s college level (average of 1.37). The fact that 70% of the times balls go over the net less than two time shows that special importance should be put on players’ concentration (e.g. avoiding a chain of bad actions) and on explosive training. Twenty-seven percent of the times the ball goes over the net between two and five times. For the other 3% , the ball goes over the net more than five times. These values can be a reference for establishing how much continuity coaches should create artificially in practice (i.e. tossing balls).
With regard to the relationship between reception efficacy and side-out success, the results logically show that with better reception, there is better side-out success. However, winning teams had higher side-out success in receptions that allowed them to play the ball than losing teams (limited attack and all attack options). The results confirm the relationship between the level of reception and side-out success at the women’s college level (Miskin, Fellingham, & Florence 2010; Palao et al., 2006; Papadimitriou et al., 2004). The reason for this relationship is that better reception gives teams better opportunities for attacking. The values that were found can allow coaches to be more specific when they establish their goals. For example, in team exercises that start with a free ball or a controlled serve done by coaches or the opponent, the goal to achieve in side-out should be raised to seven out of ten.
In relation to type of attack (tempo) and side-out success, the results show that quick attacks (first tempo, second tempo, and second contact by the setter) allowed teams to achieve better performance than slow attacks or out-of-system attacks. However, although winning and losing teams presented the same tendency and same use of these types of attack, winning teams had an 11-20% higher side-out success. The results again confirm the importance of the first attack in women’s volleyball and how this action is the key to achieving performance (Miskin, Fellingham, & Florence 2010; Palao, Santos, & Ureña 2004; Stamm et al., 2016). Tendencies found in the women’s college level are similar to the international level in relation to the better efficacy with the use of quick tempo attacks (Afonso & Mesquita 2011; Palao, Santos, & Ureña 2007). The coaching applications of these results are similar to those for the data found in relation to reception efficacy. When receptions allow teams to construct all attack options, teams play in the system and use first and second tempo attacks. Therefore, these results confirm the importance of adequate work in reception, set, and first attack in volleyball.
With regard to the use of the jump set, the results show a higher use of the jump set by winning teams (5% difference). For winning and losing teams, the use of the jump set involved higher side-out success. However, there is the possibility that this relationship is caused by the fact that the jump set is used when the reception allows all attack options. In relation to the use of the jump set, the results from the present study are lower than the use of the jump set at the women’s international level where 65% of the sets are done using a jump (Palao & Echeverria 2008). More studies should be done to confirm the use of the jump set at the college women’s level. If this level of use is confirmed, there is much room for improvement in relation to this aspect of the game. These differences show the way in which teams and setters should improve in order to increase their performance in their developmental process.
Data that were found show the importance of the different aspects of the game in the final outcome. This information can guide the study related to the different technical and tactical performance indicators of this level of competition. The study of the variables of ways to score and phase success gives a broad perspective, which is necessary to understand the game. More studies are needed in order to know which variables must be analyzed to implement multi-disciplinary and realistic approaches in order to study the game as the complex system that it is. These studies should be done longitudinally and transversally (level of competition and categories) in order to provide a deeper understanding of the game.
5Conclusions
The findings provide reference values to guide the analysis of the volleyball team and understand the way winning teams score and build their side-out in the women’s college population. The results confirm the importance of the side-out phase efficacy as a variable to monitor team performance and provide different ways of analysis and use (percentage and points to achieve for each action). The data show the weight of the different actions in the side-out success. In the population studied, the action that best differentiates winning and losing teams was the attack after reception. The results show the contribution of different ways to build the side-out. The actions with greater contribution were the ones that increased the setter’s possibilities to build the offense and accelerate the game, such as through the reception efficacy and the use of the jump set. These findings suggest that future studies must consider the ways to score, the game phases, and game actions to study the different levels of competition and categories from a broad perspective. This information about levels of competition and categories is needed to properly guide the development of female volleyball players with objective information. From an applied perspective, the results can serve as references for the way points are obtained in side-out and defense in women’s college volleyball for similar levels of competition. Knowing the key aspects of side-out and defense may allow coaches to better analyze and evaluate their players and teams technically and tactically. Additionally, the information that was found can specifically help in the establishment of goals for practice and competition.
References
1 | Afonso J. & Mesquita I. , (2011) , Determinants of block cohesiveness and attack efficacy in high-level women’s volleyball. European Journal of Sport Science, 11: (1), 69–75. |
2 | Ahrabi-Fard I. & Hensley L. , (1995) , Empirical analysis of rally scoring. Coaching Volleyball. June-July, pp. 18–21. |
3 | Anguera M.T. , (2003) , Observational Methods (General). In Fernández-Ballesteros R. (Ed.), Encyclopedia of Psychological Assessment, Vol. 2: . London: Sage. |
4 | Coleman J.E. , Neville B. & Gordon B. , (1969) , A statistical system for volleyball and its use in Chicago Women’s Assn. International Volleyball Review, 17: , pp. 72–73. |
5 | Fellingham G.W. , Collings B.J. & McGown C.M. , (1994) , Developing an optimal scoring system with special emphasis on volleyball. Research Quarterly for Exercise and Sport, 65: (3), 237–243. |
6 | García-de-Alcaraz A. , Ortega E. & Palao J.M. , (2015) , Effect of age group on male volleyball players’ technical-tactical performance profile for the spike. International Journal of Performance Analysis in Sport, 15: (2), 668–686. |
7 | García-de-Alcaraz A. , Ortega E. & Palao J.M. , (2016) , Effect of age group on male volleyball players’ technical-tactical performance profile for the serve. Perceptual and Motor Skills, 16: , in press. |
8 | Glazier P.S. , (2010) , Game, set and match? Substantive issues andfuture directions in performance analysis. Sports Medicine, 40: (8), 625–634. |
9 | Japanese Volleyball Association, 1999, Analysis of final round matches in the 13th volleyball women’s World Championchip ((1998) ), The coach, 1: , 16–21. |
10 | Kountouris P. , Drikos S. , Aggelonidis I. , Laios A. & Kyprianou M. , (2015) , Evidence for differences in men’s and women’s volleyball games based on skills effectiveness in four consecutive Olympic tournaments. Comprehensive Psychology, 4: , 30–50. |
11 | McGarry T. , O’Donoghue P. & Sampaio J , (2013) , Routledge handbook of sports performance analysis. London: Routledge. |
12 | Mesquita I. , Palao J.M. , Marcelino R. & Afonso J. , (2013) , Chapter 29. Indoor volleyball and beach volleyball (pp. 367–379). In McGarry T. , O’Donoghue P. & Sampaio J. (editors). Routledge Handbook of Sports Performance Analysis. London: Routledge. |
13 | Miskin M. , Fellingham G.W. & Florence L.W. , (2010) , Skill importance in women’s volleyball. Journal of Quantitative Analysis in Sports, 6: (2), 1–14. |
14 | Palao J.M. & Echevarría C.J. , (2008) , Evolution of the use of jump set in women’s volleyball and its effect on the game. Kronos, 7: (13), 35–44. |
15 | Palao J.M. , (2004) , Effect of game phases and setter position on volleyball performance in competition. Rendimiento Deportivo, 9: , 1–19. |
16 | Palao J.M. , (2008) , Options for analysis of the volleyball score sheet. International Journal of Performance Analysis in Sport, 8: (2), 26–43. |
17 | Palao J.M. & Hernández-Hernández E. , (2014) , Game statistical system and criteria used by Spanish volleyball coaches. International Journal of Performance Analysis in Sport, 14: (2), 564–573. |
18 | Palao J.M. , Manzanares P. & Ortega E. , (2009) , Techniques used and efficacy of volleyball skills in relation to gender. International Journal of Performance Analysis in Sport, 9: (2), 281–293. |
19 | Palao J.M. , Manzanares P. & Ortega E. , (2015) , Design and validation of an observational instrument for technical and tactical actions in indoor volleyball. European Journal of Human Movement, 34: , 75–95. |
20 | Palao J.M. , Santos J.A. & Ureña A. , (2004) , Effect of team level on skill performance in volleyball. International Journal of Performance Analysis in Sport, 4: (2), 50–60. |
21 | Palao J.M. , Santos J.A. & Ureña A. , (2006) , Effect of reception and dig efficacy on spike performance and manner of execution in volleyball. Journal of Human Movement Studies, 51: (4), 221–238. |
22 | Palao J.M. , Santos J.A. & Ureña A. , (2007) , Effect of the manner of spike execution on spike performance in volleyball. International Journal of Performance Analysis in Sport, 7: (2), 126–138. |
23 | Papadimitriou K. , Sermaki, E.P.I. , Mellas S. & Papas M. , (2004) , The effect of the opponents’ serve on the offensive actions of Greek setters in volleyball games. International Journal of Performance Analysis in Sport, 4: (1), 23–33. |
24 | Silva M. , Lacerda D. & João P.V. , (2014) , Match analysis of discrimination skills according to the setter defence zone position in high-level volleyball. International Journal of Performance Analysis in Sport, 14: (2), 463–472. |
25 | Silva M. , Lacerda D. & João P.V. , (2013) , Match analysis of discrimination skills according to the setter attack zone position in high-level volleyball. International Journal of Performance Analysis in Sport, 13: (2), 452–460. |
26 | Silva M. , Marcelino R. , Lacerda D. & João P.V. , (2015) , Match analysis in volleyball: A systematic review. Montenegrin Journal of Sports Science and Medicine, 5: (1), 35–46. |
27 | Stamm R. , Stamm M. , Torilo D. , Thomson K. & Jairus A. , (2016) , Comparative analysis of the elements of attack and defence in men’s and women’s games in the Estonian volleyball highest league. Papers on Anthropology, 25: (1), 37–54. |
28 | Zhang R. , (2000) , How to profit by the new rules. The Coach, 1: (9), 11. |
29 | Zimmermann B. , (1993) , International Volley Tech. Main characteristics of defense (block-court defense - counter-attack) in top volleyball, 1: , 9–15. |


