
The competitiveness of games in professional sports leagues
Abstract
A sports game is about competition. The competitiveness of a game is important in terms of fan interest. Teams ahead or behind in a non-competitive game may also be more likely to substitute reserve players to reduce risk of injury to key players or gain experience for lesser-used players. Changes in how a team plays in a non-competitive game also impact secondary competitions such as betting or fantasy sports due to player behavior changes in a non-competitive game.
This work examines the competitiveness of games in six professional sports leagues using a variety of metrics and finds that Major League Baseball (MLB) games are clearly the least competitive compared with games from each of the other leagues in our study. MLB games have the highest percentage of game segments that are played in less competitive situations. Major League Soccer and Barclay’s Premier League games tend to be the most competitive in general; largely because about half of game time for these leagues is spent with the game tied. However, if a team does take the lead in one of these leagues then they, along with MLB, have the highest chance that this team will not relinquish the lead.
1Introduction
A sports game is about competition. The competitiveness of a game is important in terms of fan interest as a non-competitive game will cause fans attending a game to lose interest and be more likely to leave the game early. Fans viewing the game live will find another activity to do. A non-competitive game also affects how the teams themselves play relative to the norm. A team that is behind by a large margin might resort to more risky play in order to get back and make the game competitive while a team ahead by a large margin may resort to conservative play to retain its margin, particularly when the game includes a clock.
Teams ahead or behind in a non-competitive game may also be more likely to substitute reserve players to reduce risk of injury to key players or gain experience for lesser-used players. These portions of the game are referred to as “garbage time” in basketball or a “blowout” in baseball. Previous work of (Goldman & Rao, 2011) on shooting decisions by players in NBA games explicitly ignores garbage time in its analysis.
These changes in how a team plays in a non-competitive game also impact secondarycompetitions such as betting or fantasy sports due to player behavior changes in a non-competitive game. Experienced betters are well aware of the “back door cover” where meaningless points are scored to at the end of the game which do not affect the game outcome, but affect the gambling spread. Similarly, meaningless plays in a non-competitive game affect player statistics used for fantasy sports, but do not affect the game outcome.
Given its importance, what does it mean for a game to be non-competitive? Fans and players have an intuitive sense of what it means, but one contribution of our work is to quantify potential metrics in a way that can be compared between sports as there is no singular metric for measuring it. Does it mean that the team ahead is certain to win? Likely to win? Does it mean that the game is decided in that the team ahead will stay ahead? Other work by (Paine, 2013; Beuoy & McCann, 2015; Bashuk, 2012) has looked at the idea of win probability for a particular sport where the likelihood of a team winning is evaluated at each point of the game. Win probabilities are a potential measure of competitiveness where a high win probability implies a non-competitive game, but we could also have games where one team is ahead andultimately wins, but the game itself is still competitive. The other problem with work on win probabilities is that they take into account information specific to each sport or use different methodologies making it difficult to compare the results across sports. Work by (Clauset et al., 2015) models lead changes in different sports, but does not explicitly compare the competitiveness of games between these sports.
Rather than investigate a single metric for competitiveness, our approach allows us to explore a number of metrics for measuring it. We then use these multiple metrics to analyze the competitiveness of games across different professional sports leagues. Is one league or sport inherently more or less competitive than another and does it make a difference depending on the metric that is used? Our approach is to focus on intra-game competitiveness using actual game data from recent league seasons.
Using the gathered game data we explore different metrics for measuring the competitiveness of a game. We do so in a manner that allows us to not only examine competitiveness in games of a single sport, but to compare the competitiveness across major sports leagues in North America and Europe. This approach provides insight on the most and least competitive sports and sports leagues.
Our work makes a number of contributions relative to previous work in that we perform our analysis:
• of competitiveness throughout all portions of game,
• for multiple sports,
• using multiple metrics of competitiveness,
• in a way to allow direct comparison of competitiveness across games in different sports, and
• for individual teams as well as home/away teams across leagues.
In the remainder of this paper we describe our methodology in Section 2 and use it to examine results for different measures of competitiveness in Section 3. We summarize the competitiveness results in Section 4. In Section 5 we use our competitiveness metrics to examine additional per-season and per-team results. We describe related work in Section 6 and conclude with a summary and future work in Section 7.
2Methodology
In our work we choose to analyze the competitiveness of games in six professional sports focused on the five major North American sports leagues in baseball, basketball, football, hockey and soccer as well as the English professional soccer league. We choose these leagues for variety and added a sixth league to compare two separate professional leagues in the same sport.
In analyzing each sport we first obtained the scoring events in each game played in one or more seasons of each sport league. These events were obtained from (MLB, 2016; NBA, 2016; NFL, 2016; NHL, 2016; FC, 2016). A summary of the data for each league are shown in Table 1 with the number of seasons analyzed a function of the number of games within each league season. Data from only one recent season were obtained for the MLB, NBA and NHL leagues because teams play relatively more games. Data from multiple seasons were obtained for the NFL, BPL and MLS because a season consists of relatively fewer games. As shown in the table, more than 1000 games were analyzed in all but one of the soccer leagues and those are close to that number.
Table 1
Analyzed professional sports leagues
| League | Abbrev. | Season(s) | # Games |
| Major League Baseball | MLB | 2015 | 2429 |
| National Basketball Assoc. | NBA | 2014-15 | 1310 |
| National Football League | NFL | 2012, 2013, 2014, 2015 | 1068 |
| National Hockey League | NHL | 2014-15 | 1319 |
| Barclay’s Premier League | BPL | 2012-13, 2013-14, 2014-15 | 1089 |
| Major League Soccer | MLS | 2013, 2014, 2015 | 814 |
Appropriate scripts were developed to download and extract the list of scoring events for each game in each sport. Each scoring event documents which team scored, how much (in sports where a score is a variable number of points) and at what point (generally time) in the game. For our analysis we divided games into discrete minute-long segments based on the game clock. For baseball, the one sport we analyzed without a clock, we divided a game into segments based on the current inning and number of outs. The resulting number of segments for each game is 54 for MLB (9 innings of 6 outs each), 48 for the NBA (4 quarters of 12 minutes each), 60 for the NFL (4 quarters of 15 minutes each), 60 for the NHL (3 periods of 20 minutes each) and 90 for the BPL and MLS (2 halves of 45 minutes each). Our data also include scoring events for extra time or extra innings, but we assume any extra play is always competitive and only use these events to determine the winner (if the game has one).
Our analysis is done by analyzing the state of the game at the end of each segment where the effect of all scoring events within a single segment on the state of the game are combined. We examine the current score margin at the end of each segment and depending on the competitiveness metric may also examine the remaining scoring events and outcome of the game. We are aware of the home and away team in our analysis, but most results are presented independent of whether it is the home or away team that is leading.
A significant advantage of our approach is that all sports are analyzed in the same manner with the only difference between leagues being the number of segments into which each game is divided. By dividing each segment number by the total number of segments for the league, we can use a timeline for games for all sports from 0% (beginning of the game) to 50% (halftime) to 100% (end of the regulation game) and have a common timeline to compare the competitiveness of different leagues through the course of a game.
3Competitiveness results
In this section we use our data for each game in each sport to explore the competitiveness of each game using a number of metrics. The use of multiple metrics allows us to compare how the different leagues perform under each metric. Results using each metric are determined and shown over the timeline of all games for each league as well as summarized for comparison.
3.1Competitiveness based on one team leading
A game with the score tied is by definition a competitive game as the outcome is not known. Therefore a game in which one team is ahead is less competitive. Figure 1 shows the results for the percentage of games in which one team is in the lead throughout the timeline of a game for each of the six professional leagues.
Fig.1
Games with Team Leading Throughout the Timeline of a Game.
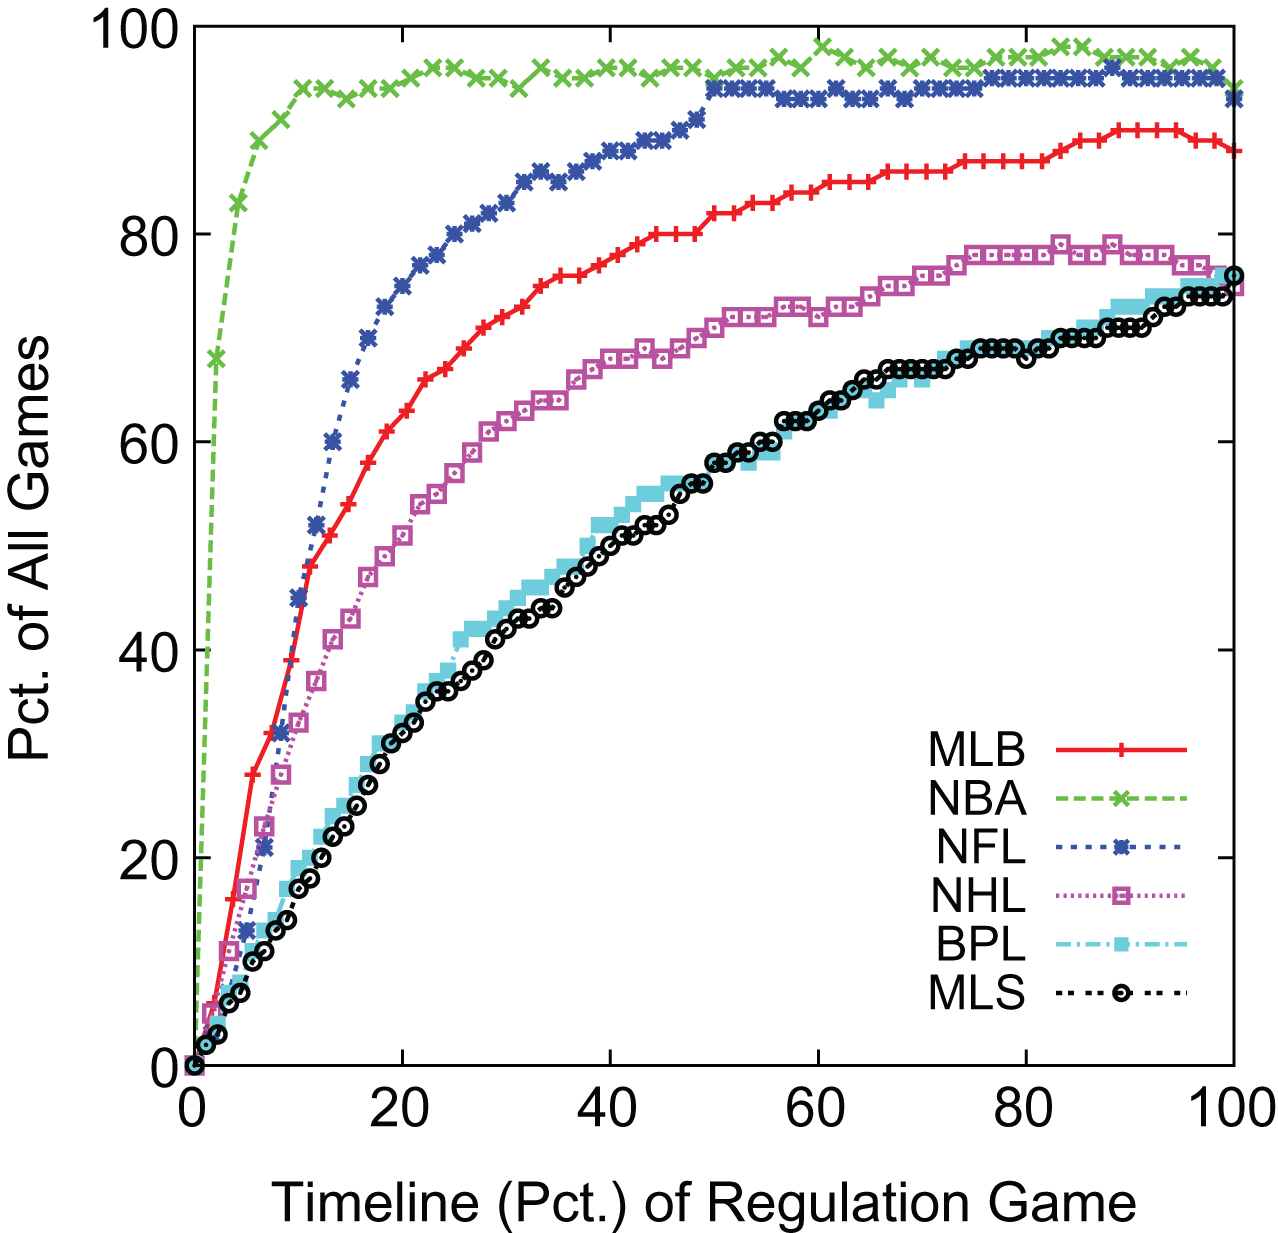
The figure shows most NBA games have a team take the lead near the beginning of the game. For example, more than 90% of NBA games have a team in the lead within the first four minutes (8%) of the game. In contrast, the percentage of NFL games with a team in the lead does not grow to over 90% until just before half-time. MLB has the next highest percentage of games with a team in the lead followed by the NHL. Not surprisingly, The BPL and MLS have close to the same results and have the lowest percentage of games where a team is in the lead throughout the timeline of a regulation game.
The results at the right edge of Fig 1 show that 94% of NBA and 93% of NFL games end regulation time with a team in the lead and therefore winning. 88% of MLB games have a winner after nine innings. The remaining three leagues have virtually identical results for a winning team in regulation with 75% for the NHL, and 76% for each of the professional soccer leagues.
Figure 2 summarizes the team-in-the-lead results of Fig 1 by summing the area under each of the curves in that figure. This summarization approach is appropriate because it represents the total amount of game time that is played with one team ahead and therefore in a less competitive situation. We will employ a similar summarization approach for other metrics that we use to evaluate competitiveness.
Fig.2
Summary Percentage of Game Time with a Team in the Lead.
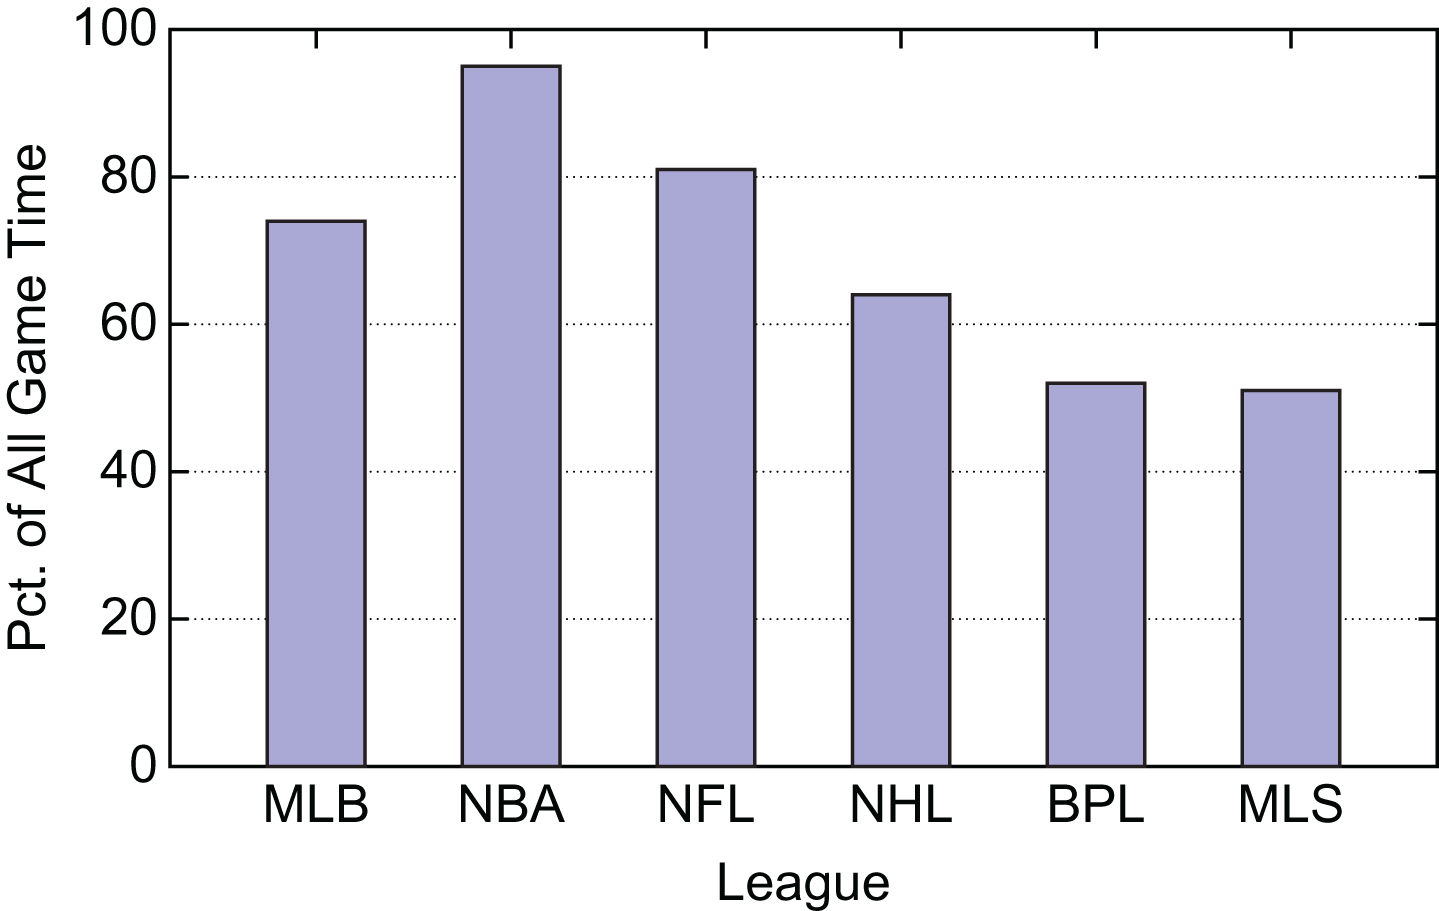
As expected, 95% of the total time of NBA games is played with one team in the lead with 81% of NFL game time. The BPL and MLS have the lowest percentage at just over 50%. These summary results for all leagues show that if a team being in the lead is used as the measure of competitiveness then the NBA is the least competitive league while the two soccer leagues are the most competitive. We investigate additional metrics of competitiveness in the remainder of this section.
3.2Competitiveness based on number of scores behind
One team being in the lead is probably not the best measure of how competitive a game is, but considering the number of scores that would be needed to catch up by the trailing team may have merit. However the point value of a “score” varies between leagues.
In baseball, hockey and soccer a score is a single run or goal. A score in football and basketball is harder to determine as each sport has multiple scoring plays each resulting in a different number of points. For our analysis we treat a score in football as a touchdown and kicked extra point for seven points. In basketball we use a three-point basket, the maximum value, as a score. Using these values for a score in each sport, Figure 3 shows the percentage of games with a team in the lead by more than one, two, three and four scores throughout a game.
The relative results mimic those for a team in the lead shown in Fig 1. The NHL results for being behind by more than one score in Fig 3 jump at the end of regulation as teams trailing by a goal pull their goalie for an extra skater in an attempt to equalize the score and in doing so give up another goal. We note that Fig 1 does show a slight dip in percentage of games with a team leading at the end for NHL games where teams also succeed with this strategy.
Fig.3
Games with Team Leading by More than Given Number of Scores Throughout the Timeline of a Game
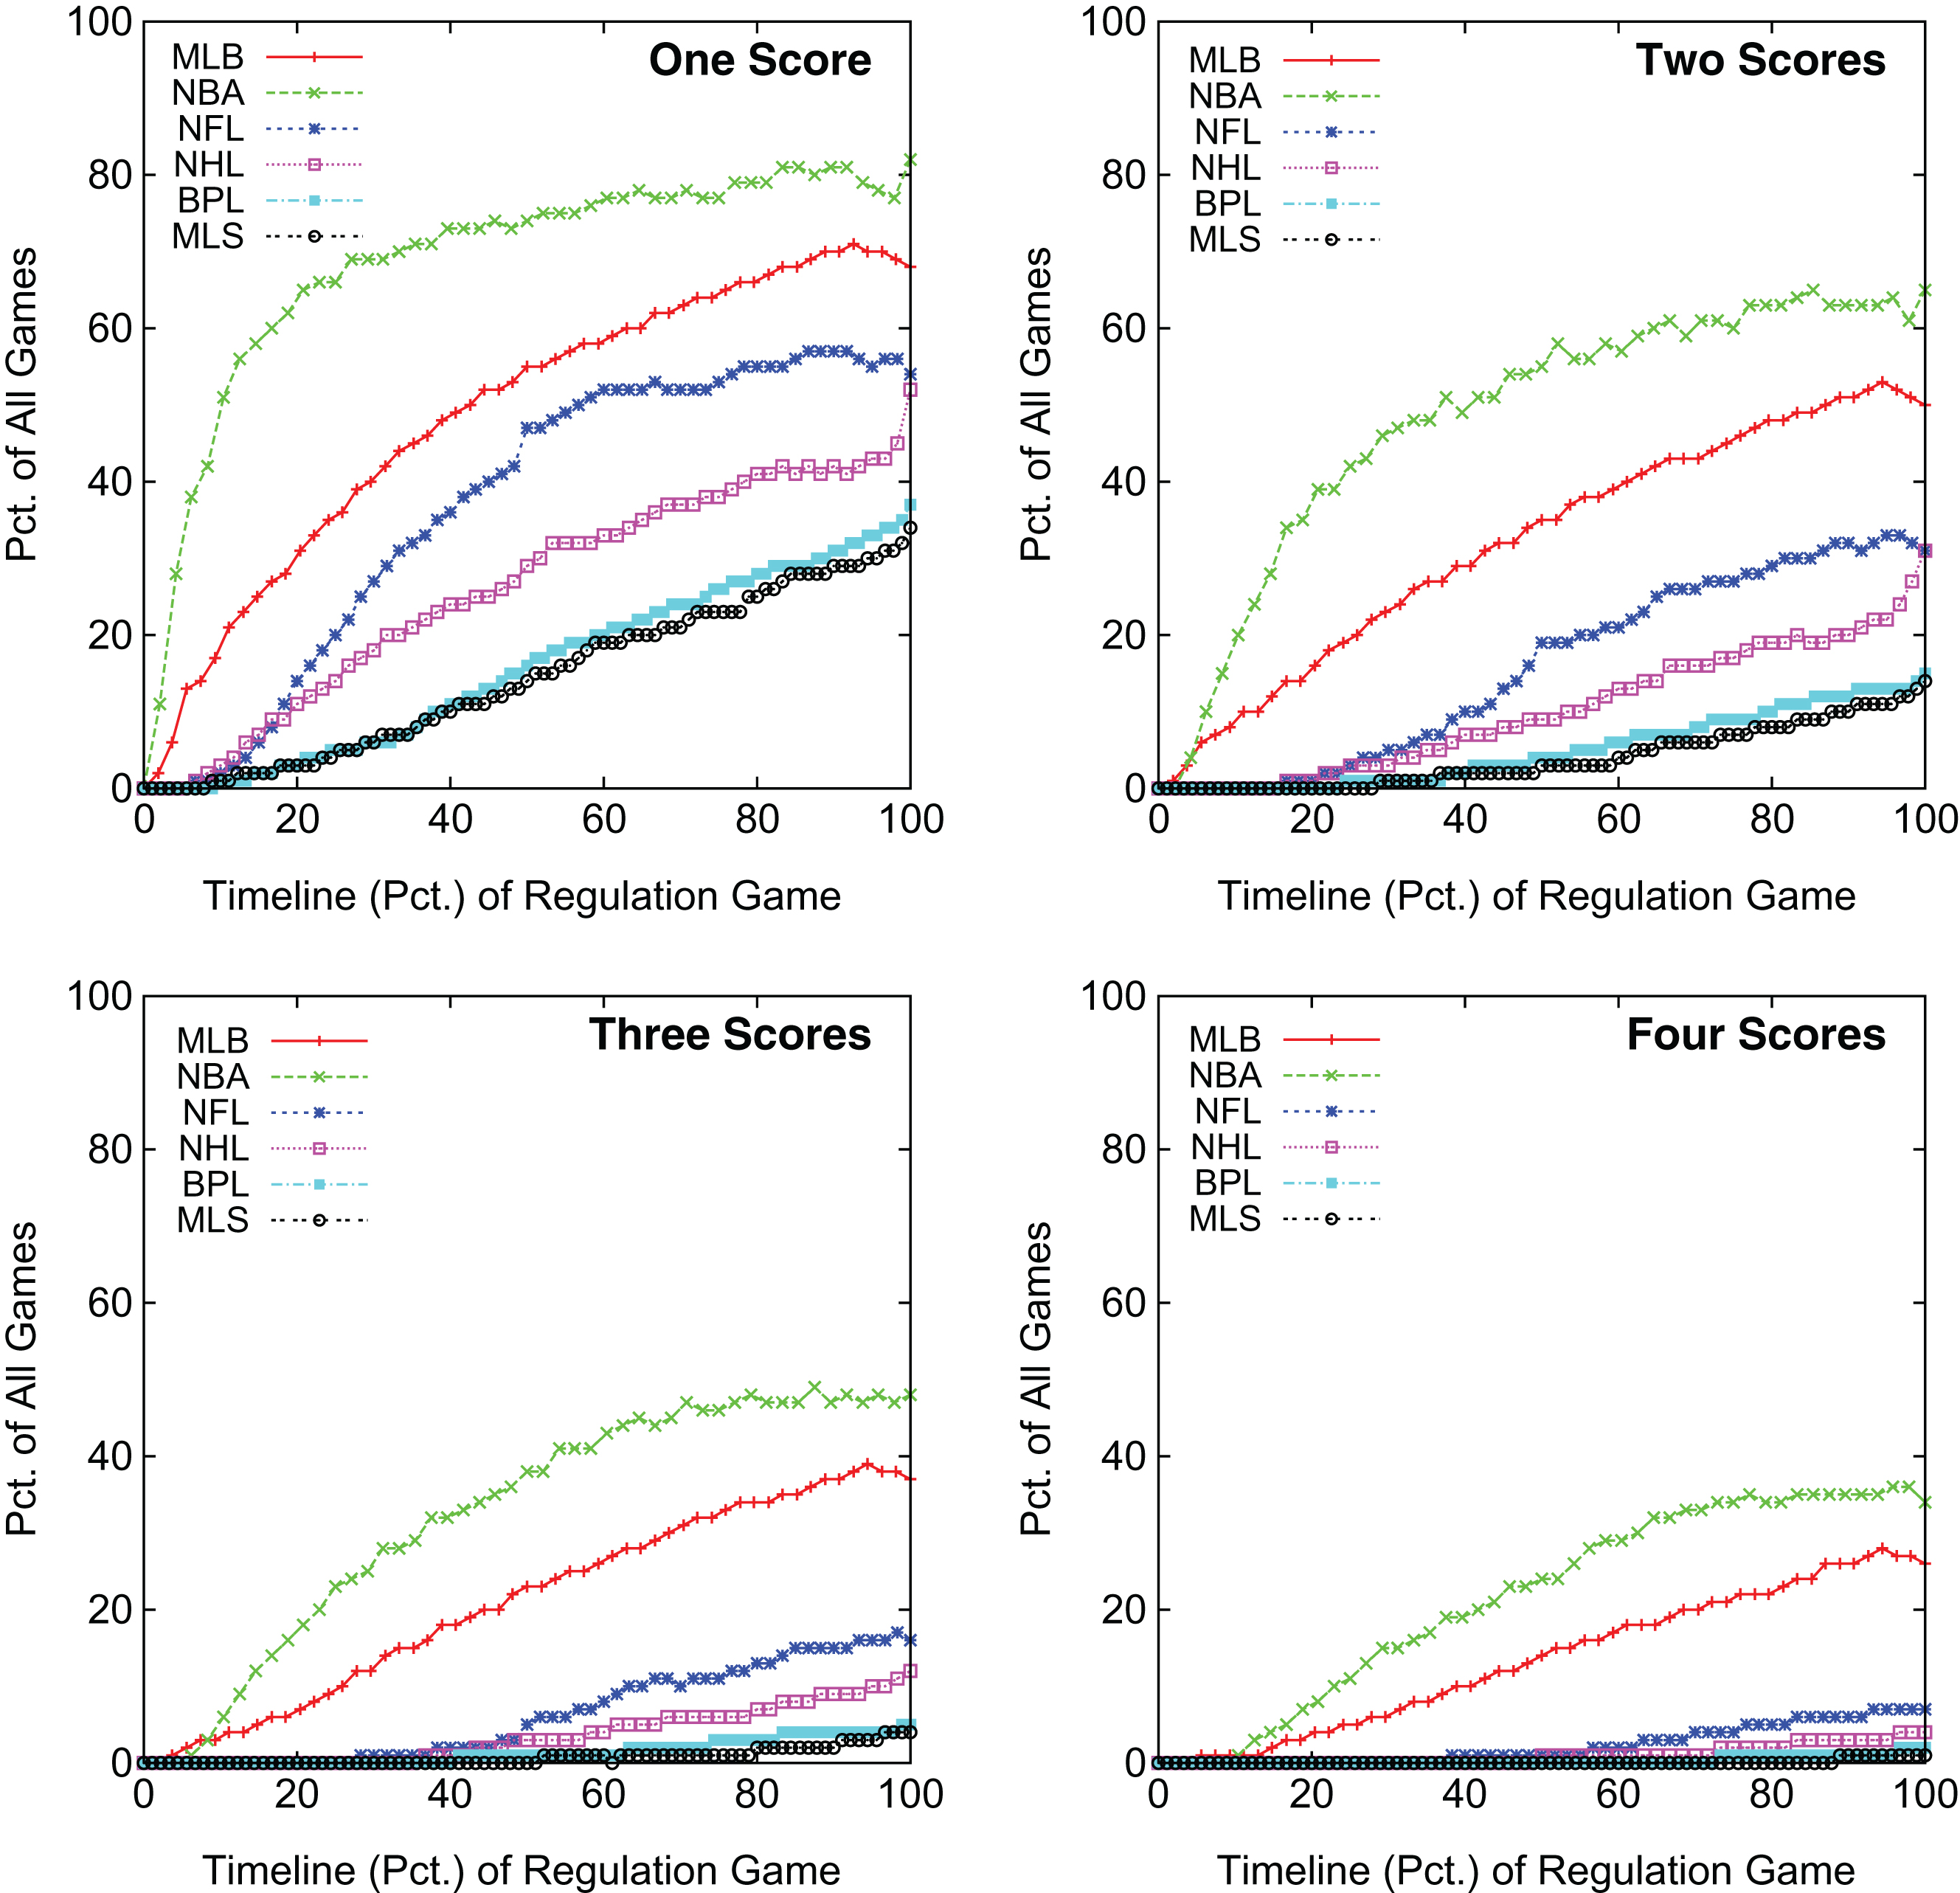
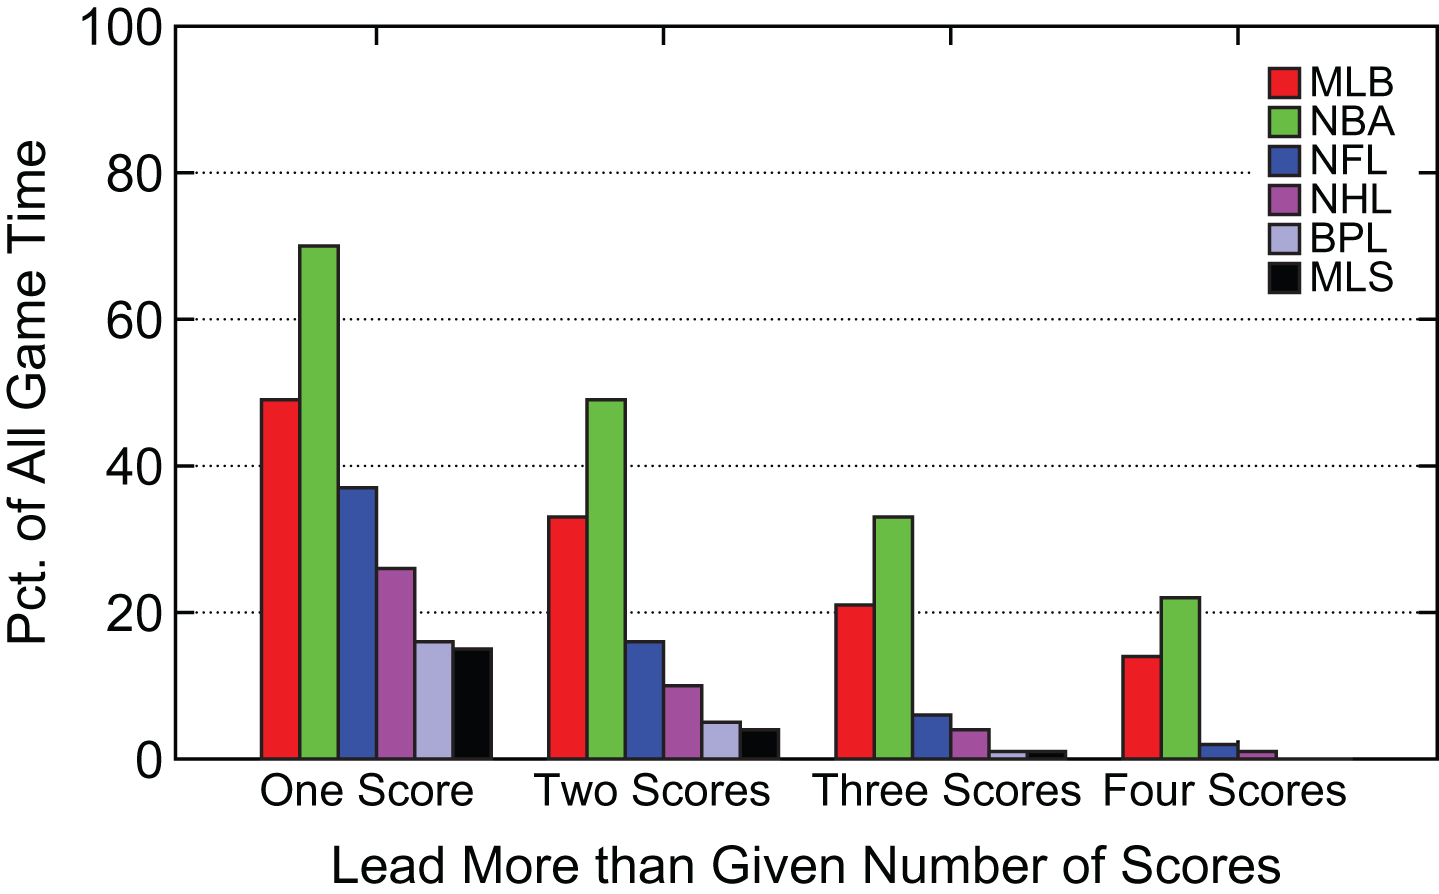
Figure 4 shows summary results for the percentage of game time spent with a team ahead by more than a given number of scores. Like results in Fig 2, the NBA is again the least competitive with the highest percentage of game time with a lead more than a given number of scores, but MLB is now second for each number. Again the BPL and MLS are the most competitive by this metric.
Fig.4
Summary Percentage of Game Time with Team Leading by More than Given Number of Scores.
3.3Competitiveness based on game outcome
Rather than investigate metrics involving the size of the lead, we next consider metrics that take into account the outcome of the game. During an actual game the outcome is not known, but our data allows us to know the outcome of each game. The first of these metrics determines the frequency in which a team is currently in the lead and goes on to win the game. For this analysis we count games ending in a tie as a half win so that all games are considered. The left graph of Fig 5 shows game timeline results for this metric. For example, if we examine the mid-point of games for each league then the NBA has the highest percentage of games (71%) where a team is in the lead and goes on to win. As shown, the NBA consistently has the highest percentage of games of any league across the timeline of a game. The percentage of such games for the NFL and MLB tend to be the next highest across the timeline of a game with 70% and 66% of teams having a lead at the midpoint of games and going on to win. Finally, the two soccer leagues have the lowest percentage of such games throughout the timeline of a game.
Fig.5
Games with a Team Ahead that Wins and is Ahead-for-Good Throughout the Timeline of a Game.
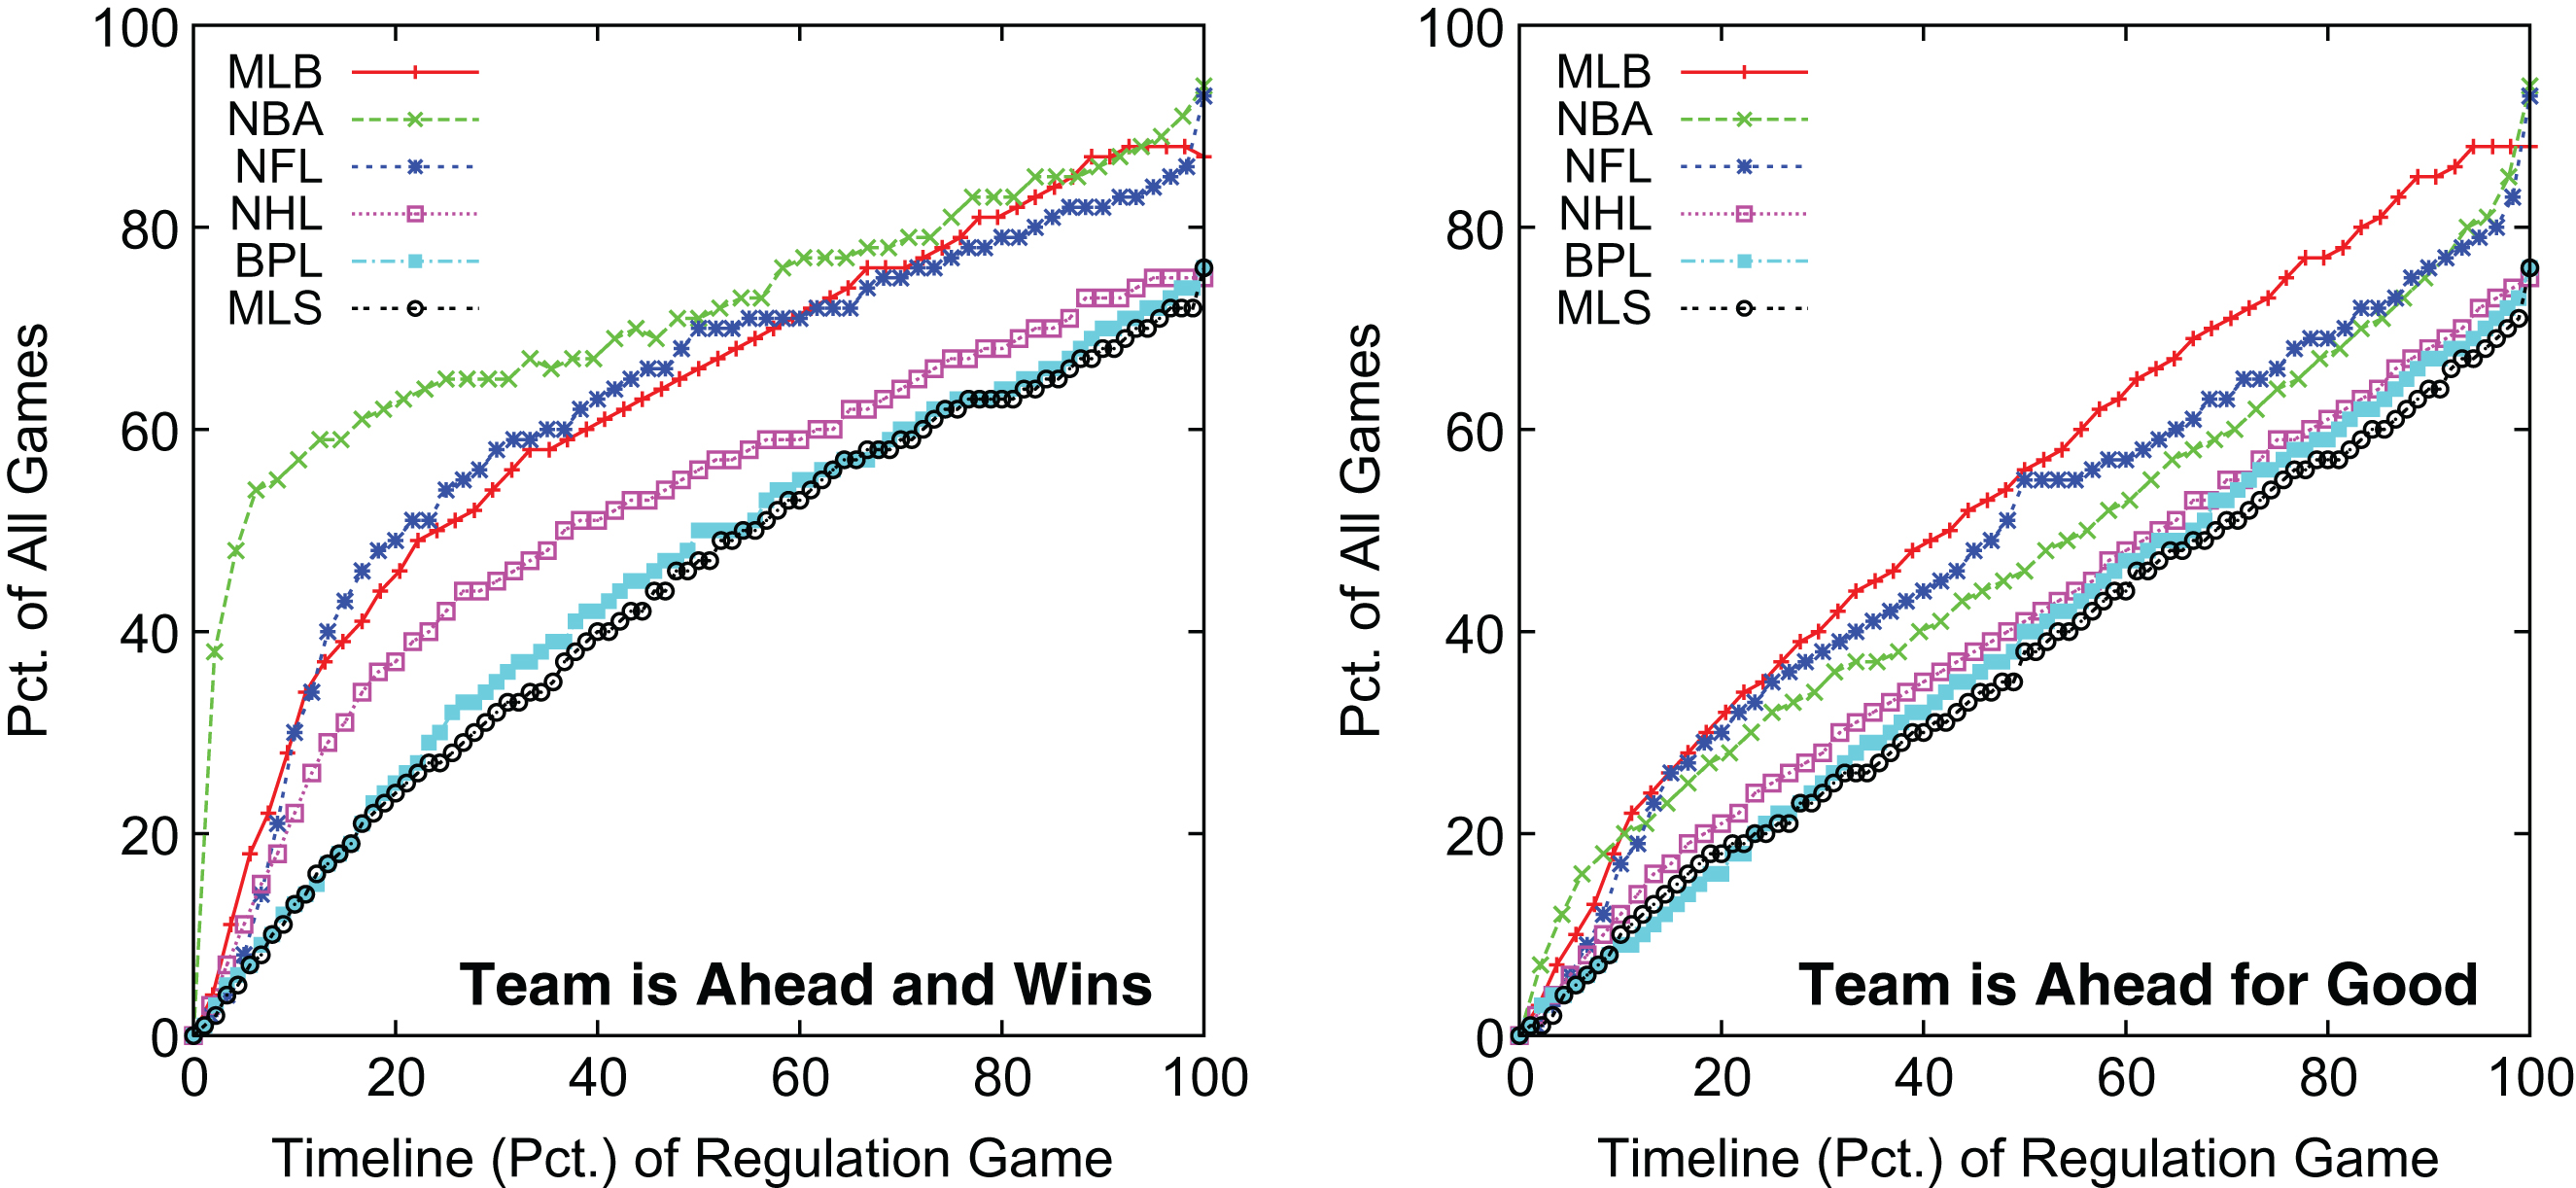
While this ahead-and-wins metric has merit as a measure of competitiveness, we believe it is not the best measure of a competitive game. The problem with this metric is a team ahead that wins in the end could be tied or even trail along the way in which case we would consider the game to be competitive. We believe a more appropriate metric is to not simply look at the outcome of the game, but to examine the nature of scoring between the current point in the game and the final outcome.
The result is to examine a “ahead-for-good” metric where a team is in the lead and this team is not tied or does not trail at any subsequent point in the game. The right graph of Fig 5 shows a timeline of games with the percentages being where a team is ahead for good. Overall the graphs shows is less variation in the results for each league, although MLB tends to generally have the highest percentage of such games across the entire timeline of a game. For example if we again examine the mid-point of games then 56% of MLB games have a team ahead for good at this point in the game. At half-time, the NFL is next at 54% followed by the NBA at 46% (substantially smaller than the 71% in the left graph of Fig 5). At the game mid-point, the remaining three leagues have approximately 40% their games with a team in the lead for good.
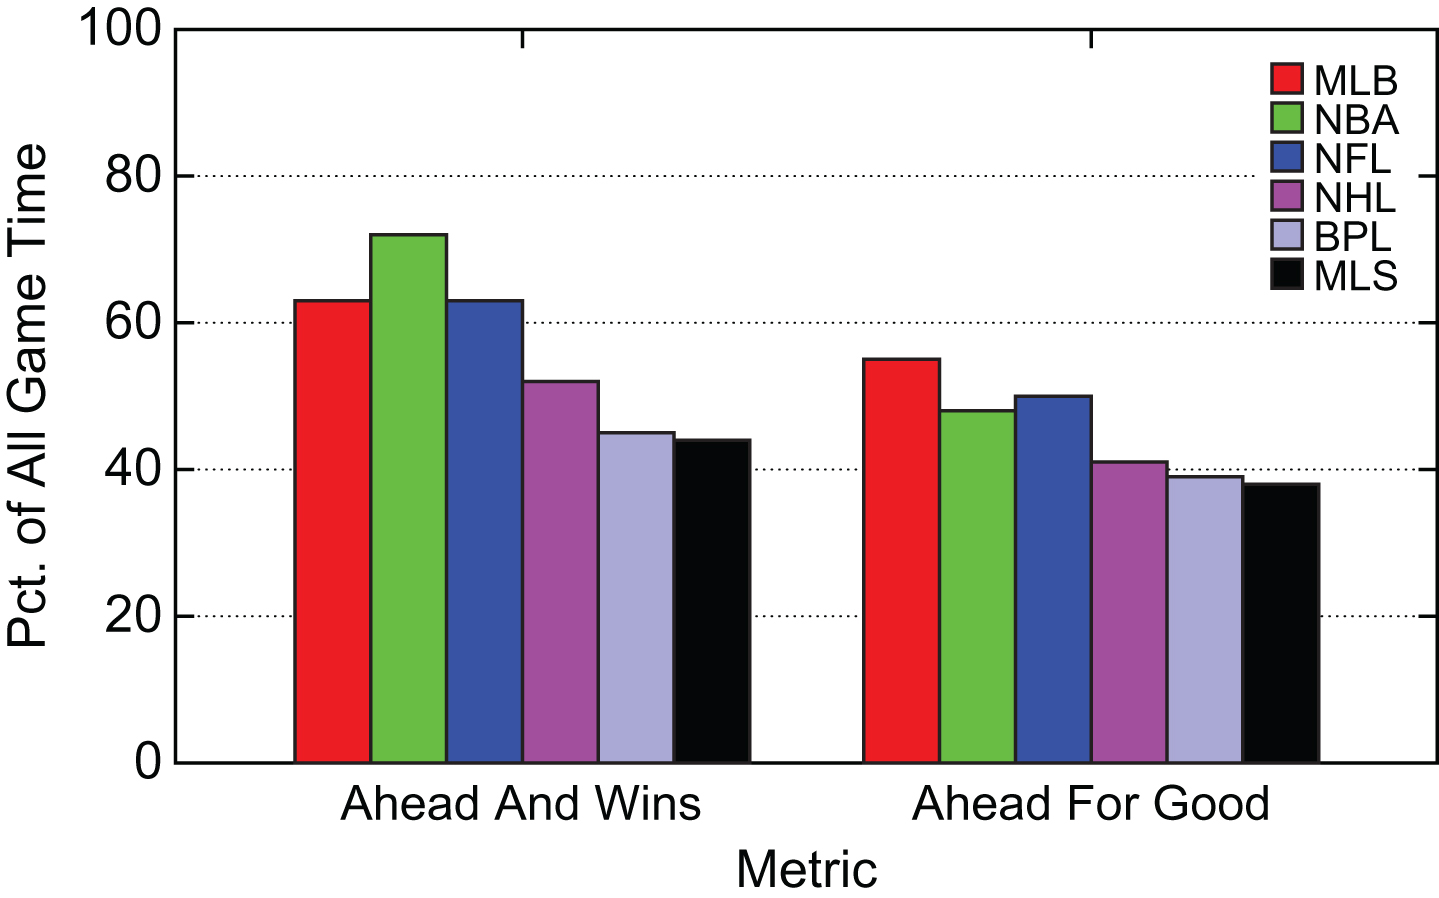
Figure 6 summarizes area-under-the-curve results in Fig 5 for each of the two metrics. Over 70% of NBA game time is played with a team in the lead that wins the game, which is the least competitive league for the metric. On the other hand, 55% of MLB game time is played with a team ahead for good, which is the least competitive league for this metric. Again the soccer leagues are the most competitive using either metric, although the NHL is close in competitiveness using the ahead-for-good metric.
Fig.6
Summary Percentage of Game Time with Team Ahead and Wins or Ahead for Good.
3.4Competitiveness based on team already leading and game outcome
The previous metrics count games where one team is in the lead and either goes on to win or be ahead for good. These metrics are therefore directly affected by the percentage of games that are tied and as shown in Figure 1 this percentage varies by league. To better understand the impact of tied games, Figure 7 shows the percentage of games won and where a team is ahead for good, but only considers points in games where one team is already ahead. As expected, the percentages in each graph are higher than the corresponding graphs in Fig 5. The increased volatility at the beginning of games (closer to 0% on the timeline) in each graph is because there tend to be fewer games where a team is leading early in the game.
Fig.7
Winning and Ahead-for-Good Percentages During Game for Teams with Lead.
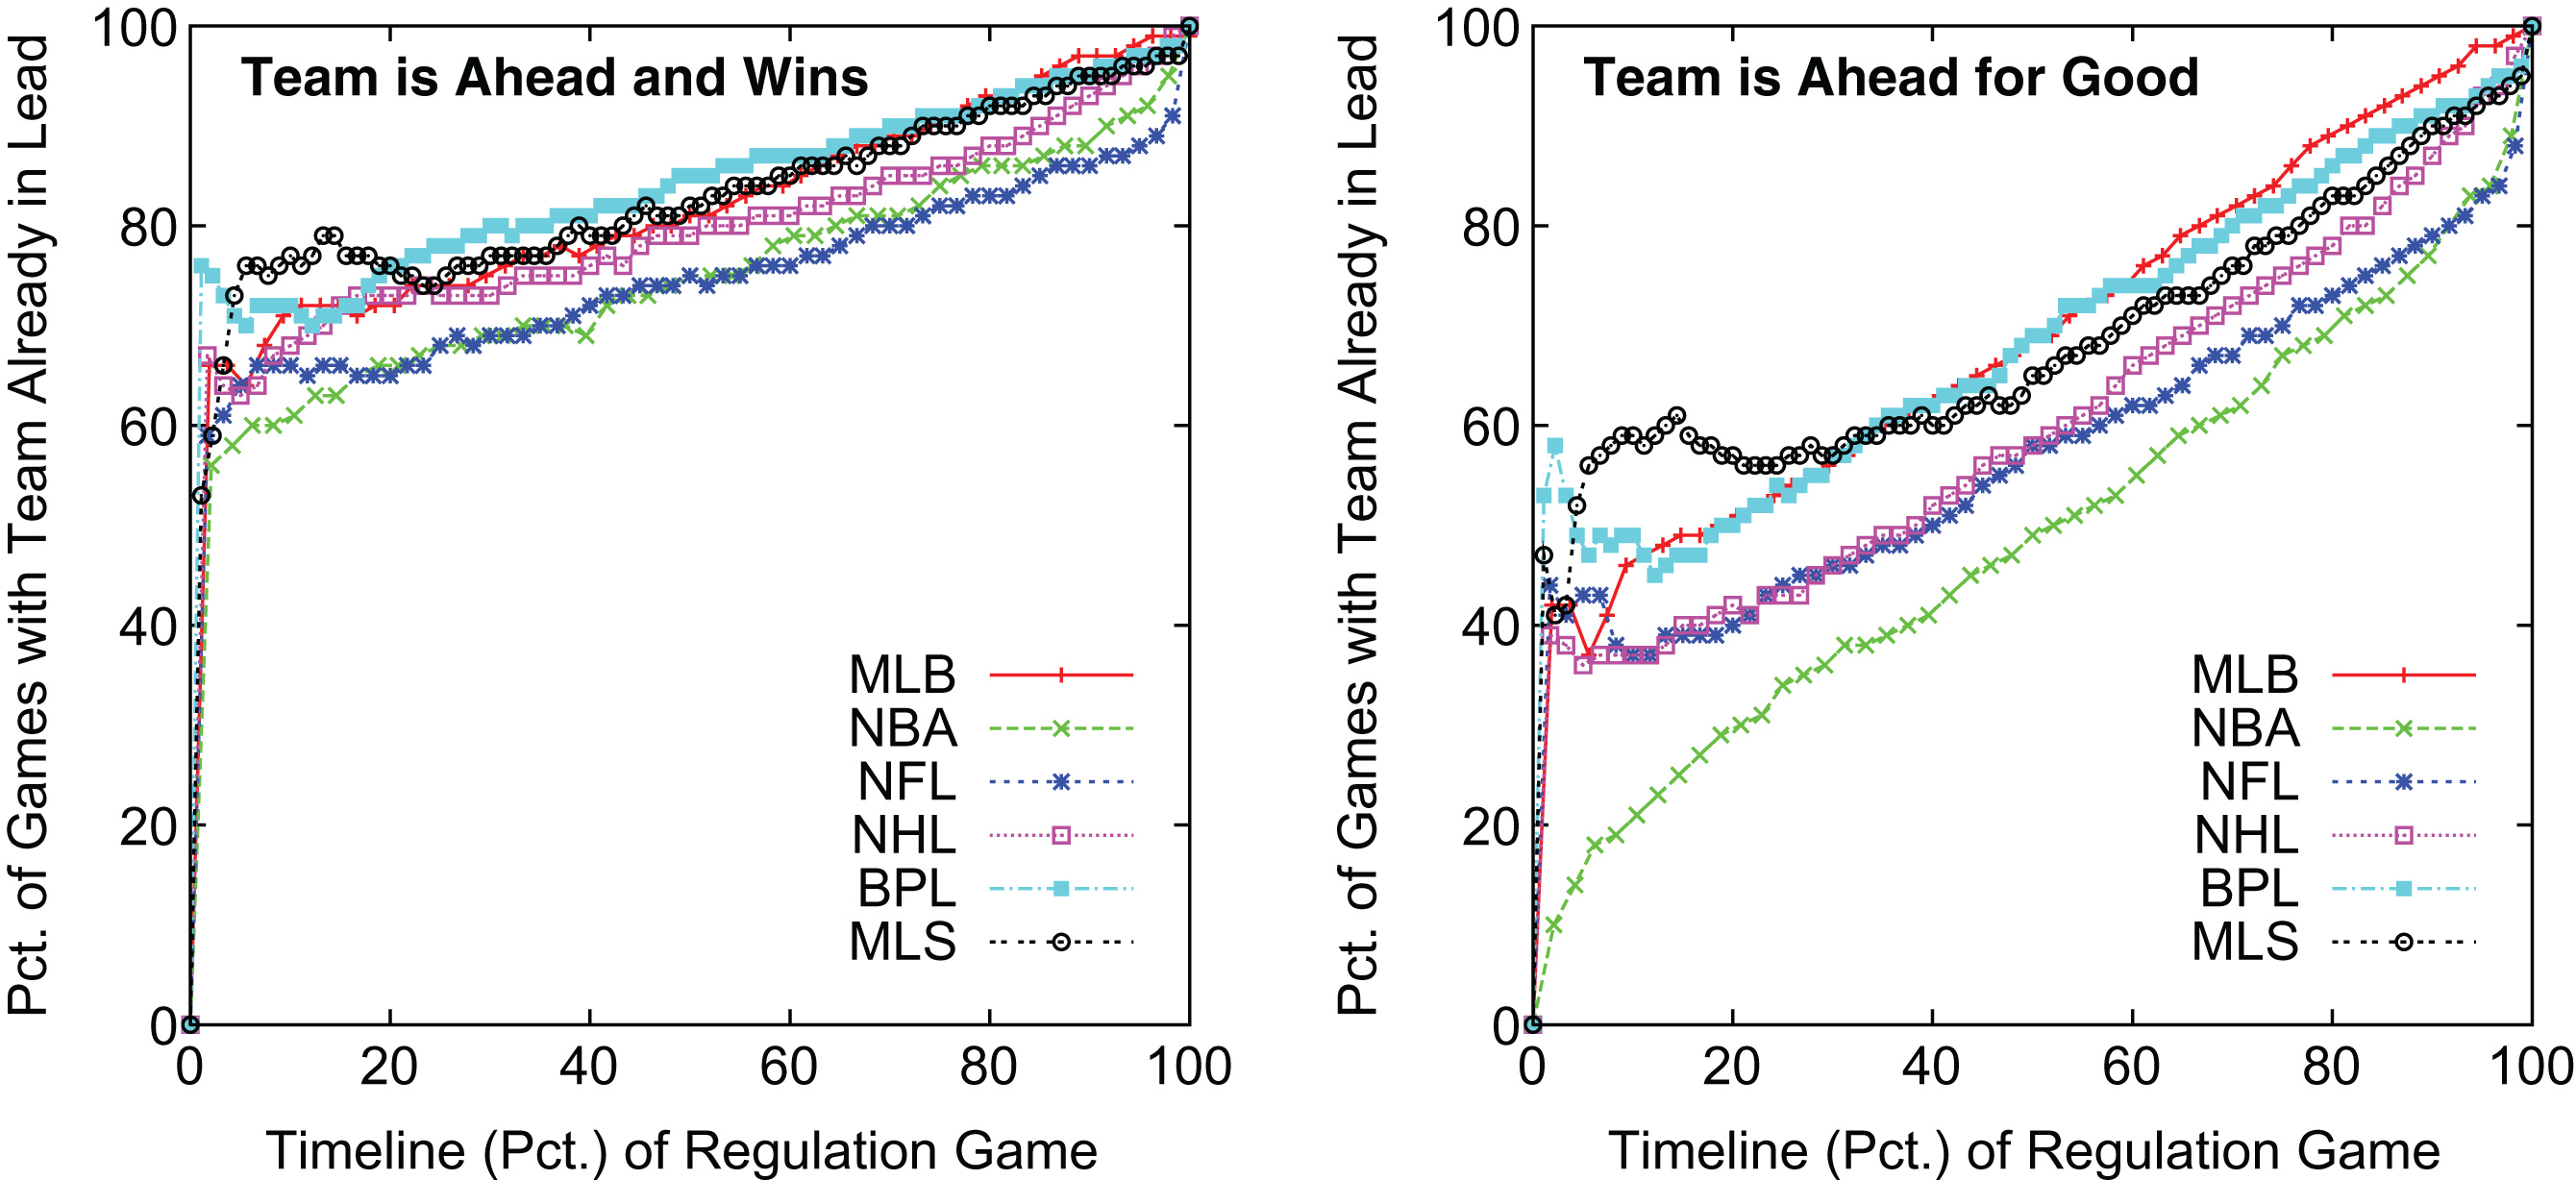
These results also allow us to compare against an early work by Cooper et al. (1992) on predicting professional sports game outcomes from intermediate game scores. In that 1992 work, the authors examined the frequency in which teams leading in “late-game” situations of different sports go on to win. In their work “for basketball and football, the late point is the end of the third quarter; for baseball, it is seven innings; for hockey it is two periods.” They found MLB teams leading in these situation win 93% of games, NBA teams win 79% of games, NFL 77% of games and NHL 81%. The left graph ofFig 7 contains these percentages at the same point of the game as previously studied with MLB at 92% the NBA at 84%, the NFL at 82% and the NHL at 83%. These percentages are generally a bit higher than found in the previous work. The left graph of Fig 7 also allows us to uniformly compare all six of our leagues at the three-quarter mark on the game timeline with MLB at 91%, the NBA at 84%, the NFL at 82%, the NHL at 86%, the BPL at 91% and the MLS at 90%. The results show that the NBA, NFL and NHL have more comebacks by a team losing at the three-quarter game mark while MLB, the BPL and MLS have fewer comebacks.
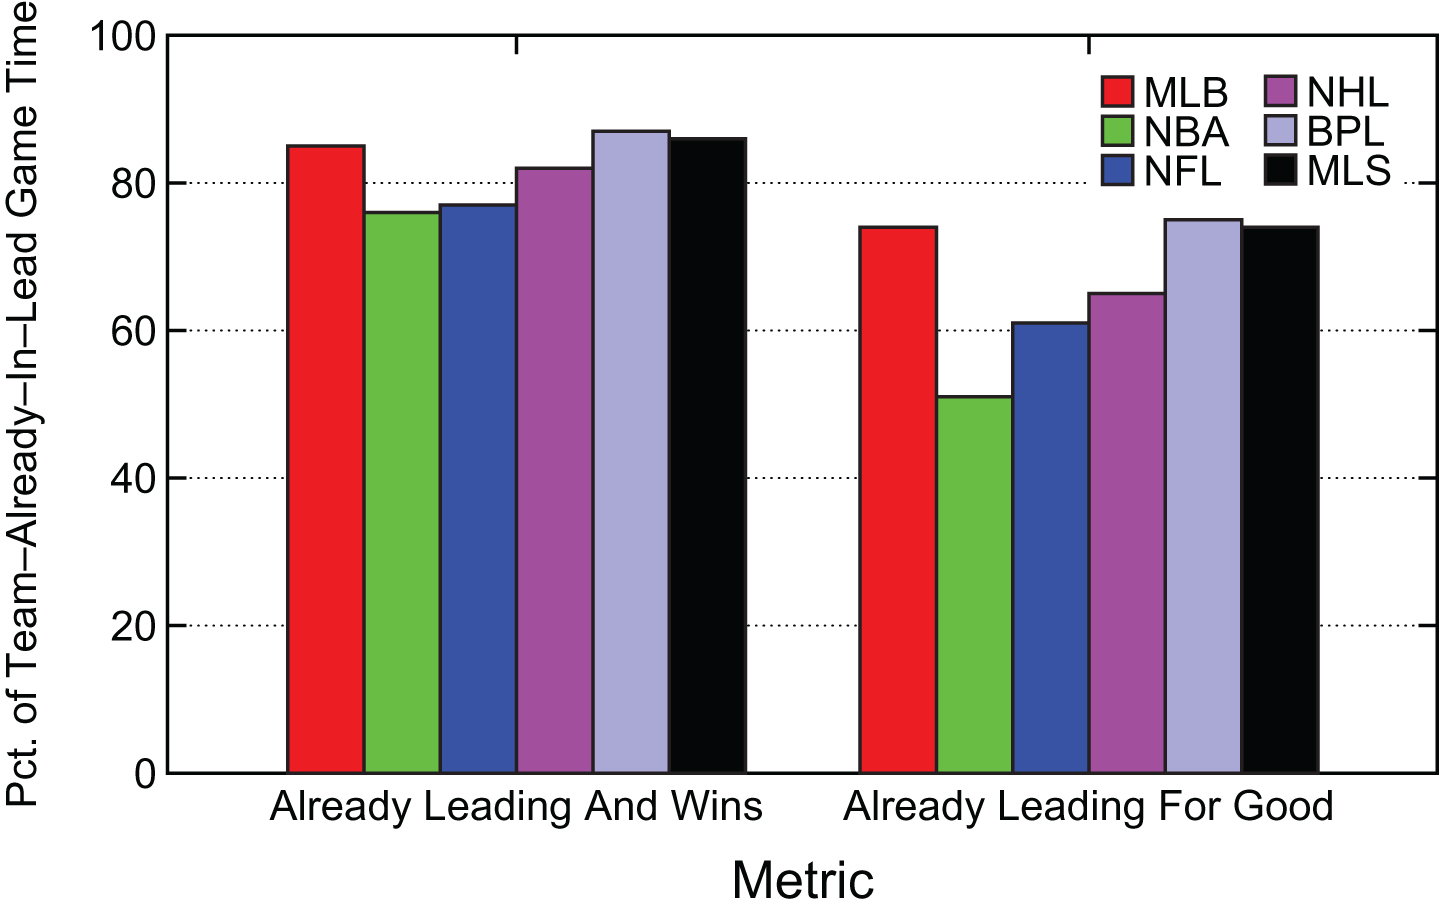
Figure 8 summarizes the results in Fig 7 across the entire game where a team is leading. There is less game time at the beginning of games and more at the end when a team is already leading. The results show that MLB, BPL and MLS games are the least competitive using this metric because once a team is in the lead there is the least chance for the trailing team to comeback. In contrast, the NBA is the most competitive by either metric. For example, only 51% of NBA game time with a team already leading has that team staying in the lead for good.
Fig.8
Summary Percentage of Game Time where Team Already in Lead Wins or Stays Ahead.
3.5Competitiveness based on predicted outcomes
Rather than use the known outcome of a game as we did for the previous two metrics, the last set of competitiveness metrics we investigate use the predicted likelihood of game outcomes. For this analysis we focus on the metric of whether a team is in the lead and is likely to stay ahead for good in the game. As a precursor to this analysis, we first compute the likelihood that a team will stay ahead for good for each combination of game segment and score margin in our data. The resulting “maps” are then post-processed to do limited averaging of nearby combinations as well as to fill in combinations with no data. Previous work by (Schmotzer, 2008) did a similar analysis for college basketball using the metric that the team in the lead goes on to win the game. This work considered, but did not explore the metric that a team is ahead for good.
The resulting maps of each league for the likelihood of a team staying ahead for good at any given point in a game with a given score margin are shown in Fig 9. The maps show segment and score margins where a team has at least a 100%, 90% and 80% chance of staying ahead for good. Lower likelihoods are not shown. In order to be able to visually compare these maps across the sports despite the varying scoring margins in each league, we use the 98th-percentile of final scoring margins in each league as the maximum y-axis value in the graphs.
Fig.9
Lead For Good Maps at 80%, 90% and 100% Levels of Certainty.
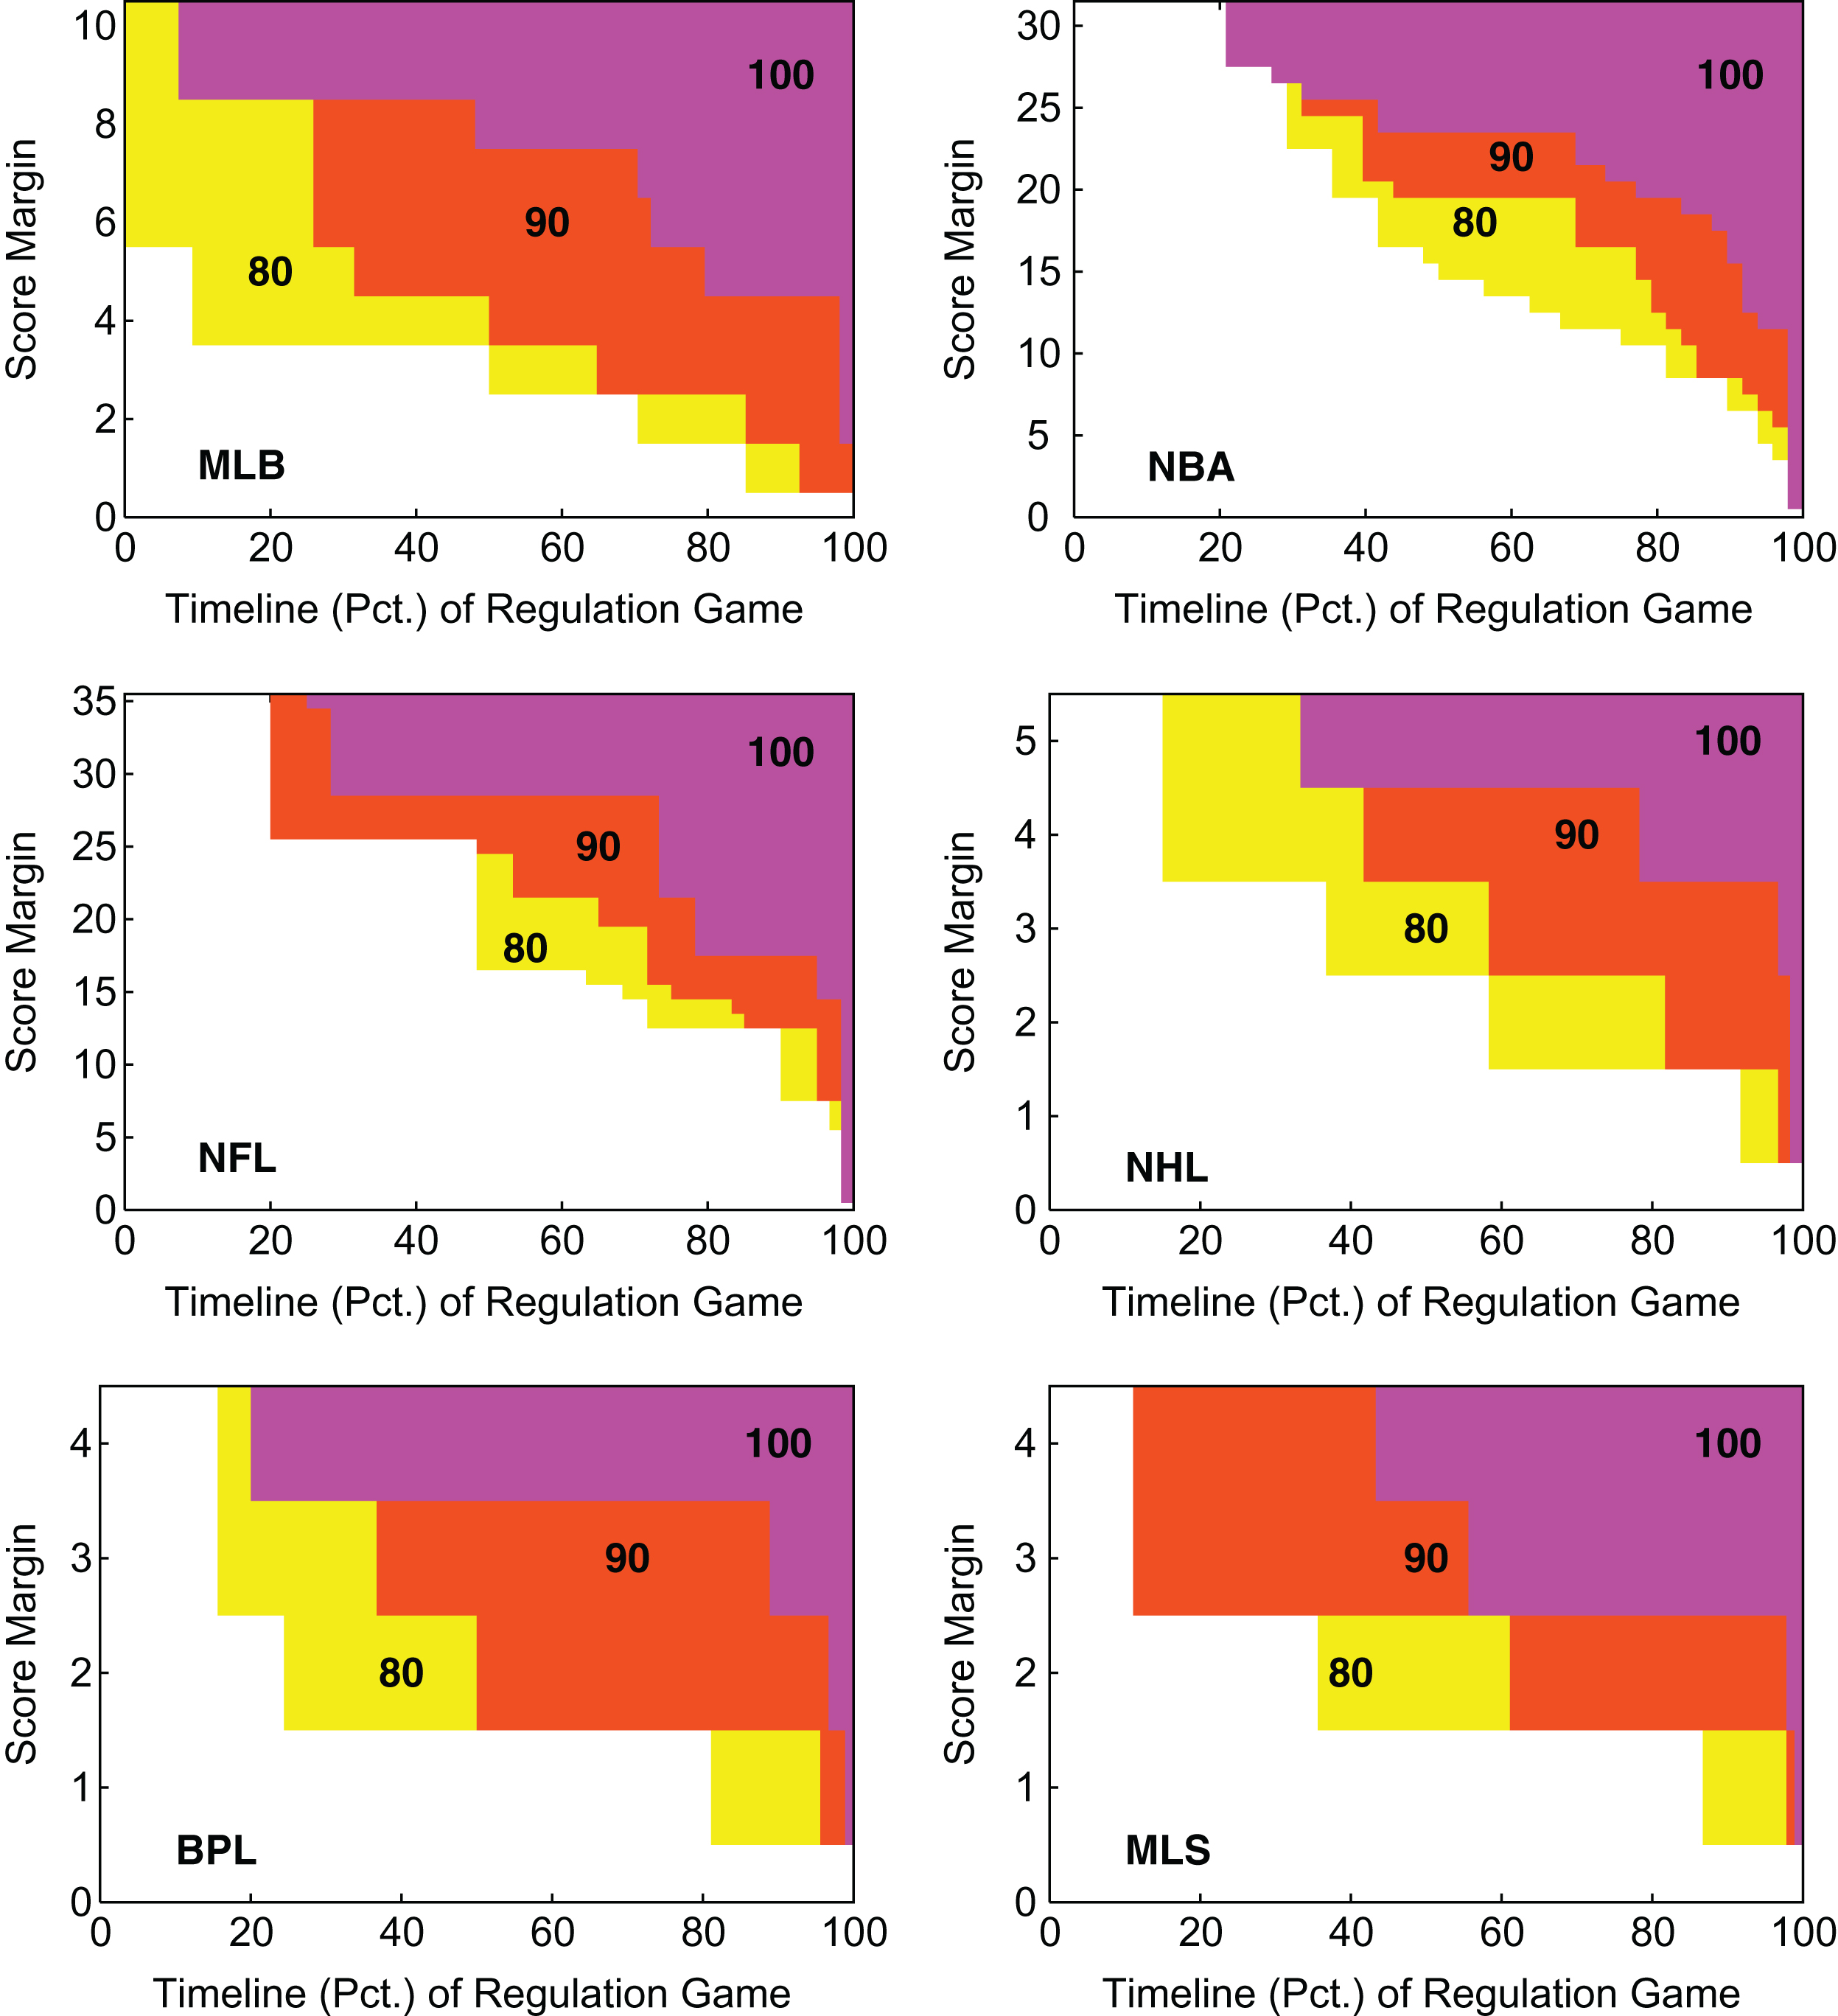
In general, the maps are as expected with a larger lead needed at the beginning of a game to have the same level of outcome certainty as later in the game. Looking at the maps for a few specific leagues, we see that at the mid-point of a game a MLB team ahead by four runs has at least a 80% chance of staying ahead for good. At this same point in the game, a MLB team leading by six runs has at least a 90% chance of staying in the lead for good and a MLB team in the lead by nine runs has a 100% chance of staying in the lead for good based upon the data.
For a NBA game, a team leading at half-time by 16 points has at least an 80% chance of staying in the lead for good. An NBA team leading at half-time by 20 points has at least a 90% chance of staying in the lead for good and an NBA team leading at half-time by 24 points has a 100% chance of staying in the lead for good. Similarly for NFL games, a team leading at half-time by 17 points has at least an 80% chance of staying in the lead for good. An NFL team leading at half-time by 28 points has at least a 90% chance of staying in the lead for good and an NFL team leading at half-time by a greater margin has a 100% chance of staying in the lead for good.
Using the maps for each league in Fig. 9, Figure 10 shows the percentage of games that are at least 100% and 80% certain of the leading team being ahead for good. As expected, results (not shown) for 90% lie between these two sets of curves.
Fig.10
Percentage of Games Spent at Different Predicted Percentages of Team Ahead for Good.
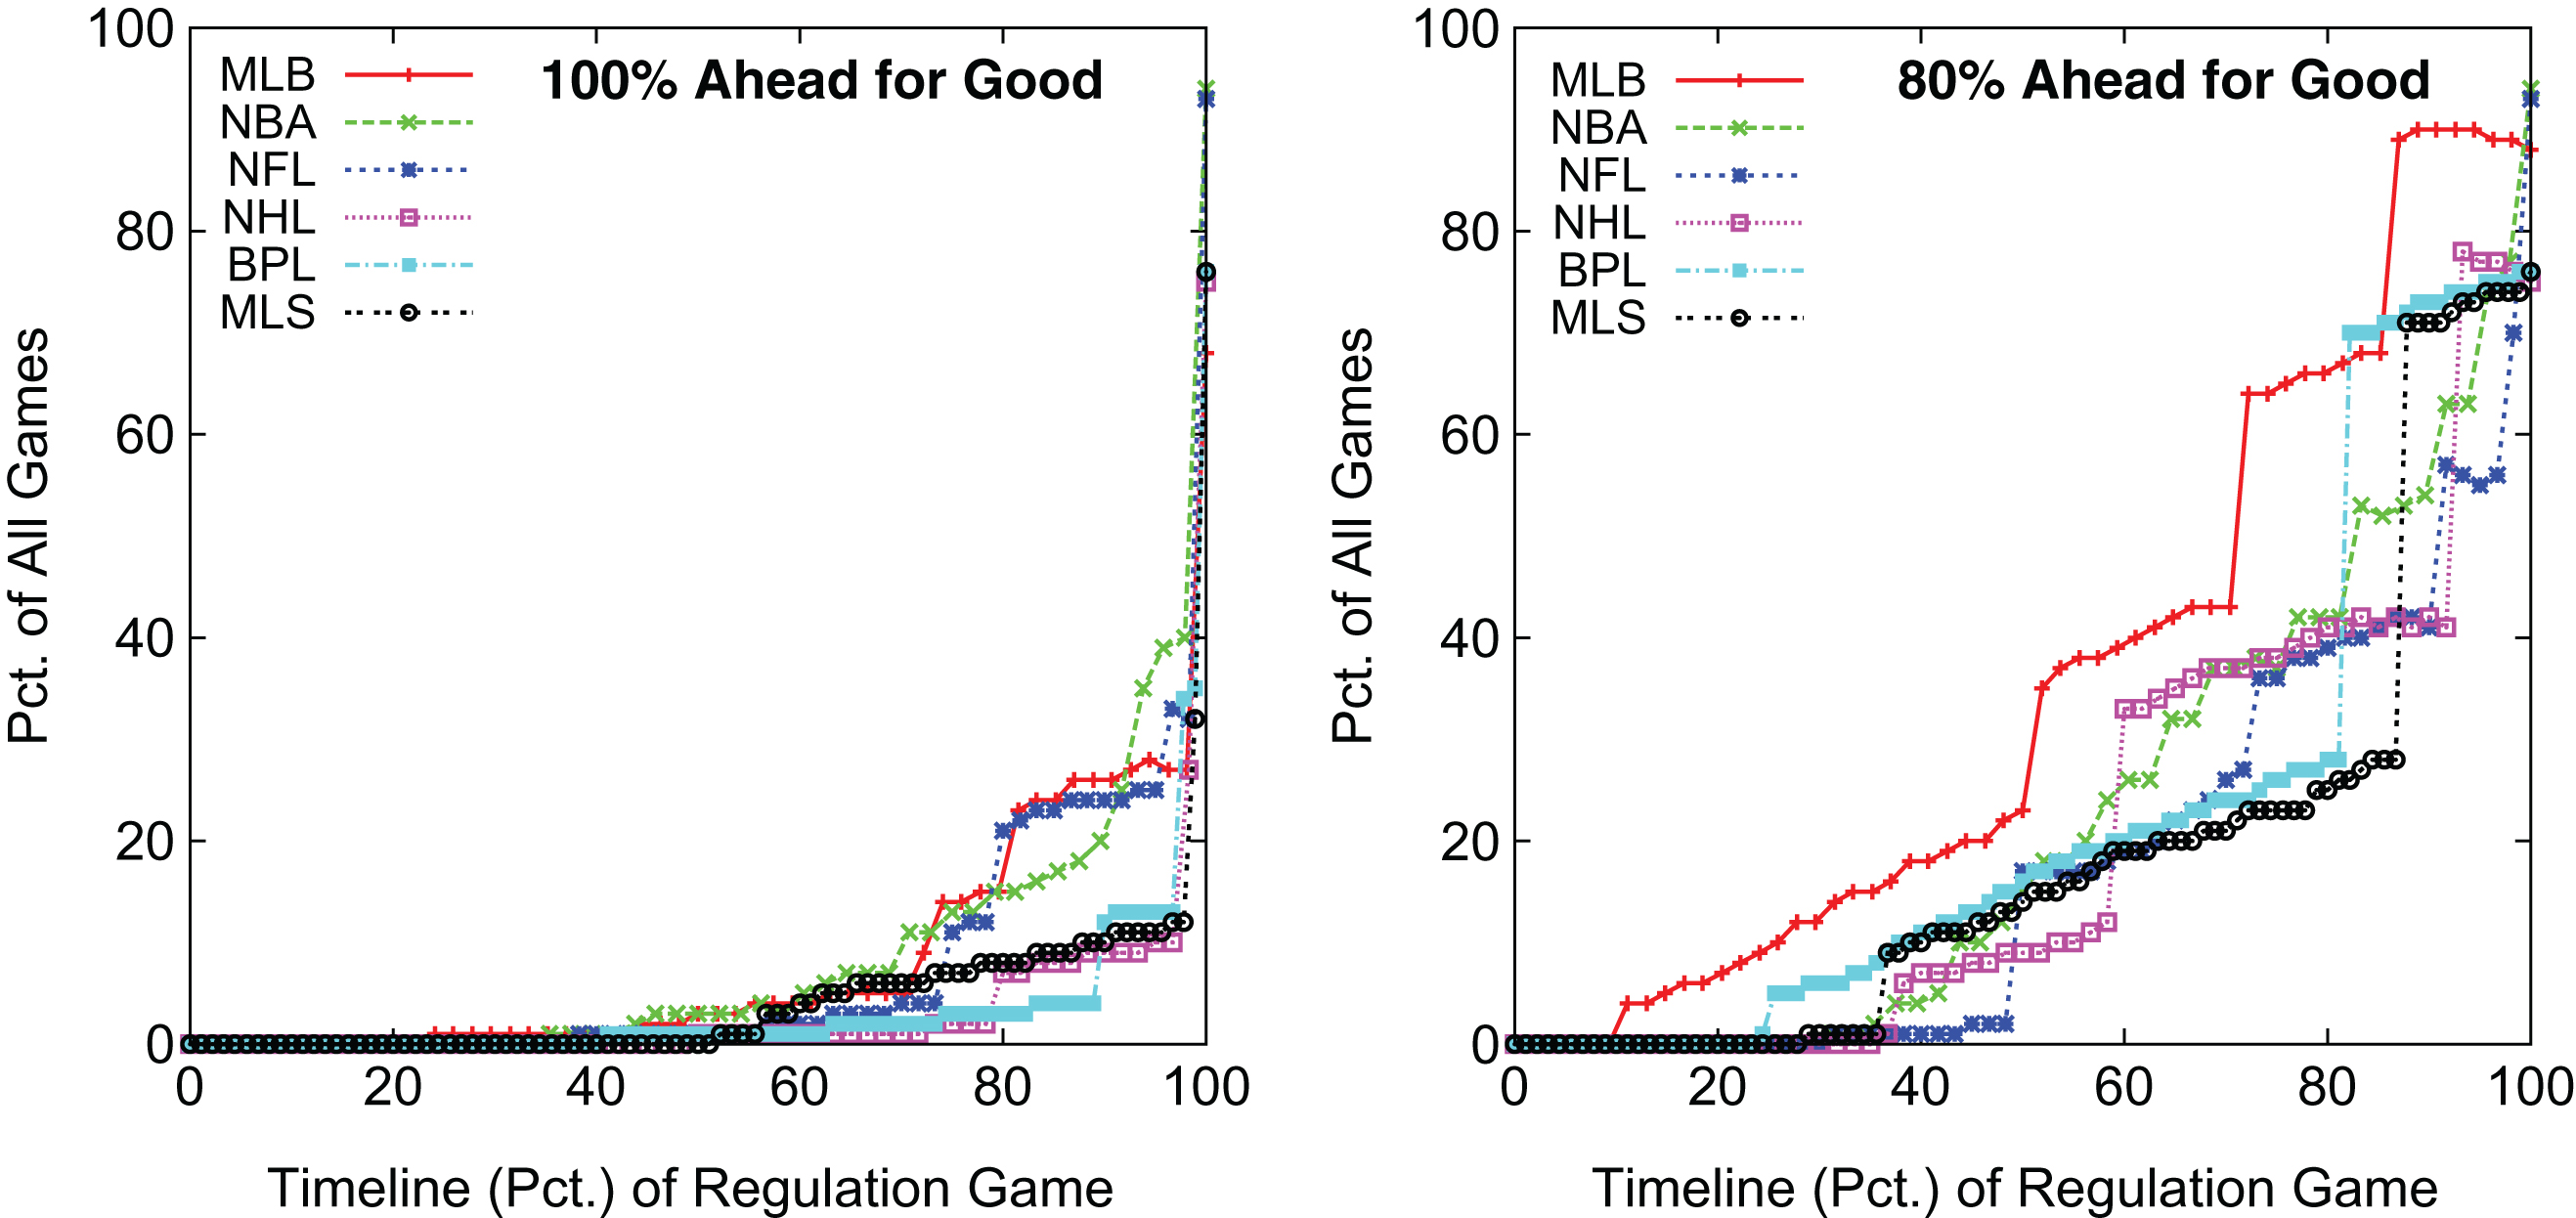
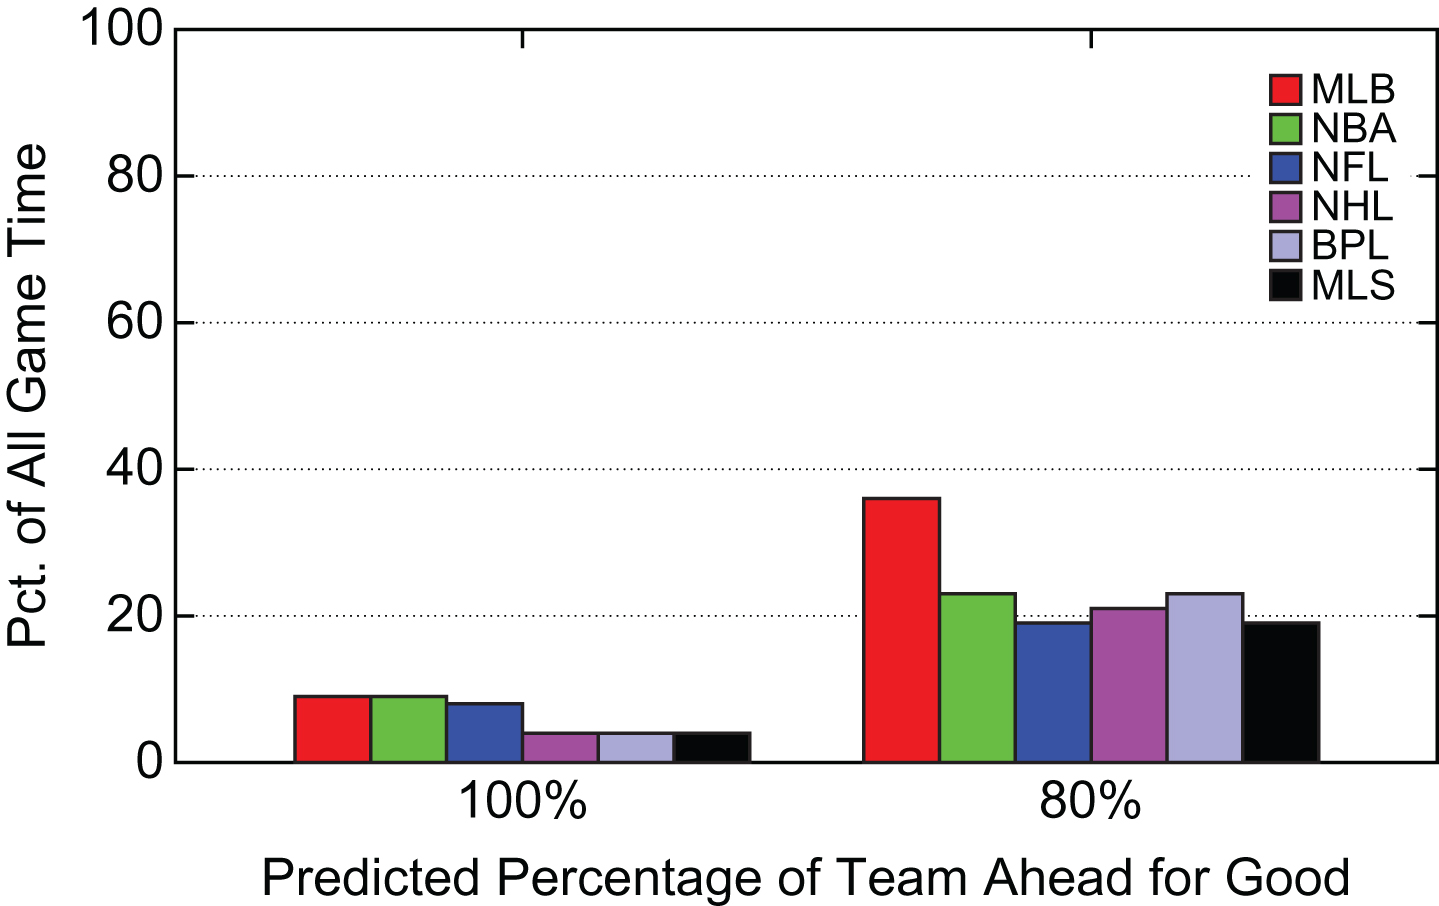
Figure 11 summarizes the results in Fig 10 where 9% of game time in MLB and NBA games is a situation where the team that is ahead is 100% likely to stay ahead. If we look at at results for 80% likelihood of the outcome then MLB is by far the largest at 36% of game time with the NFL and MLS the smallest at 19% of game time. These summary results suggest that games in MLB are the least competitive, while those in the other leagues are more competitive using the 80% level of certainty.
Fig.11
Summary Percentage of Game Time Spent at Different Predicted Percentages of Team Ahead for Good.
4Summarization of competitiveness results
Section 3 examines competitiveness results of games in the six professional sports leagues using different metrics. In this section, we summarize the results of these metrics to examine the relative competitiveness of games in these leagues. Figure 12 contains three scatter graphs showing pairwise comparison of metric results from Section 3. In each case the ahead-for-good metric results from Fig. 6 are shown on the x-axis of each graph.
Fig.12
Summary Percentage of Game Time with Lead for Good Compared with Three Other Summary Competitiveness Metrics.
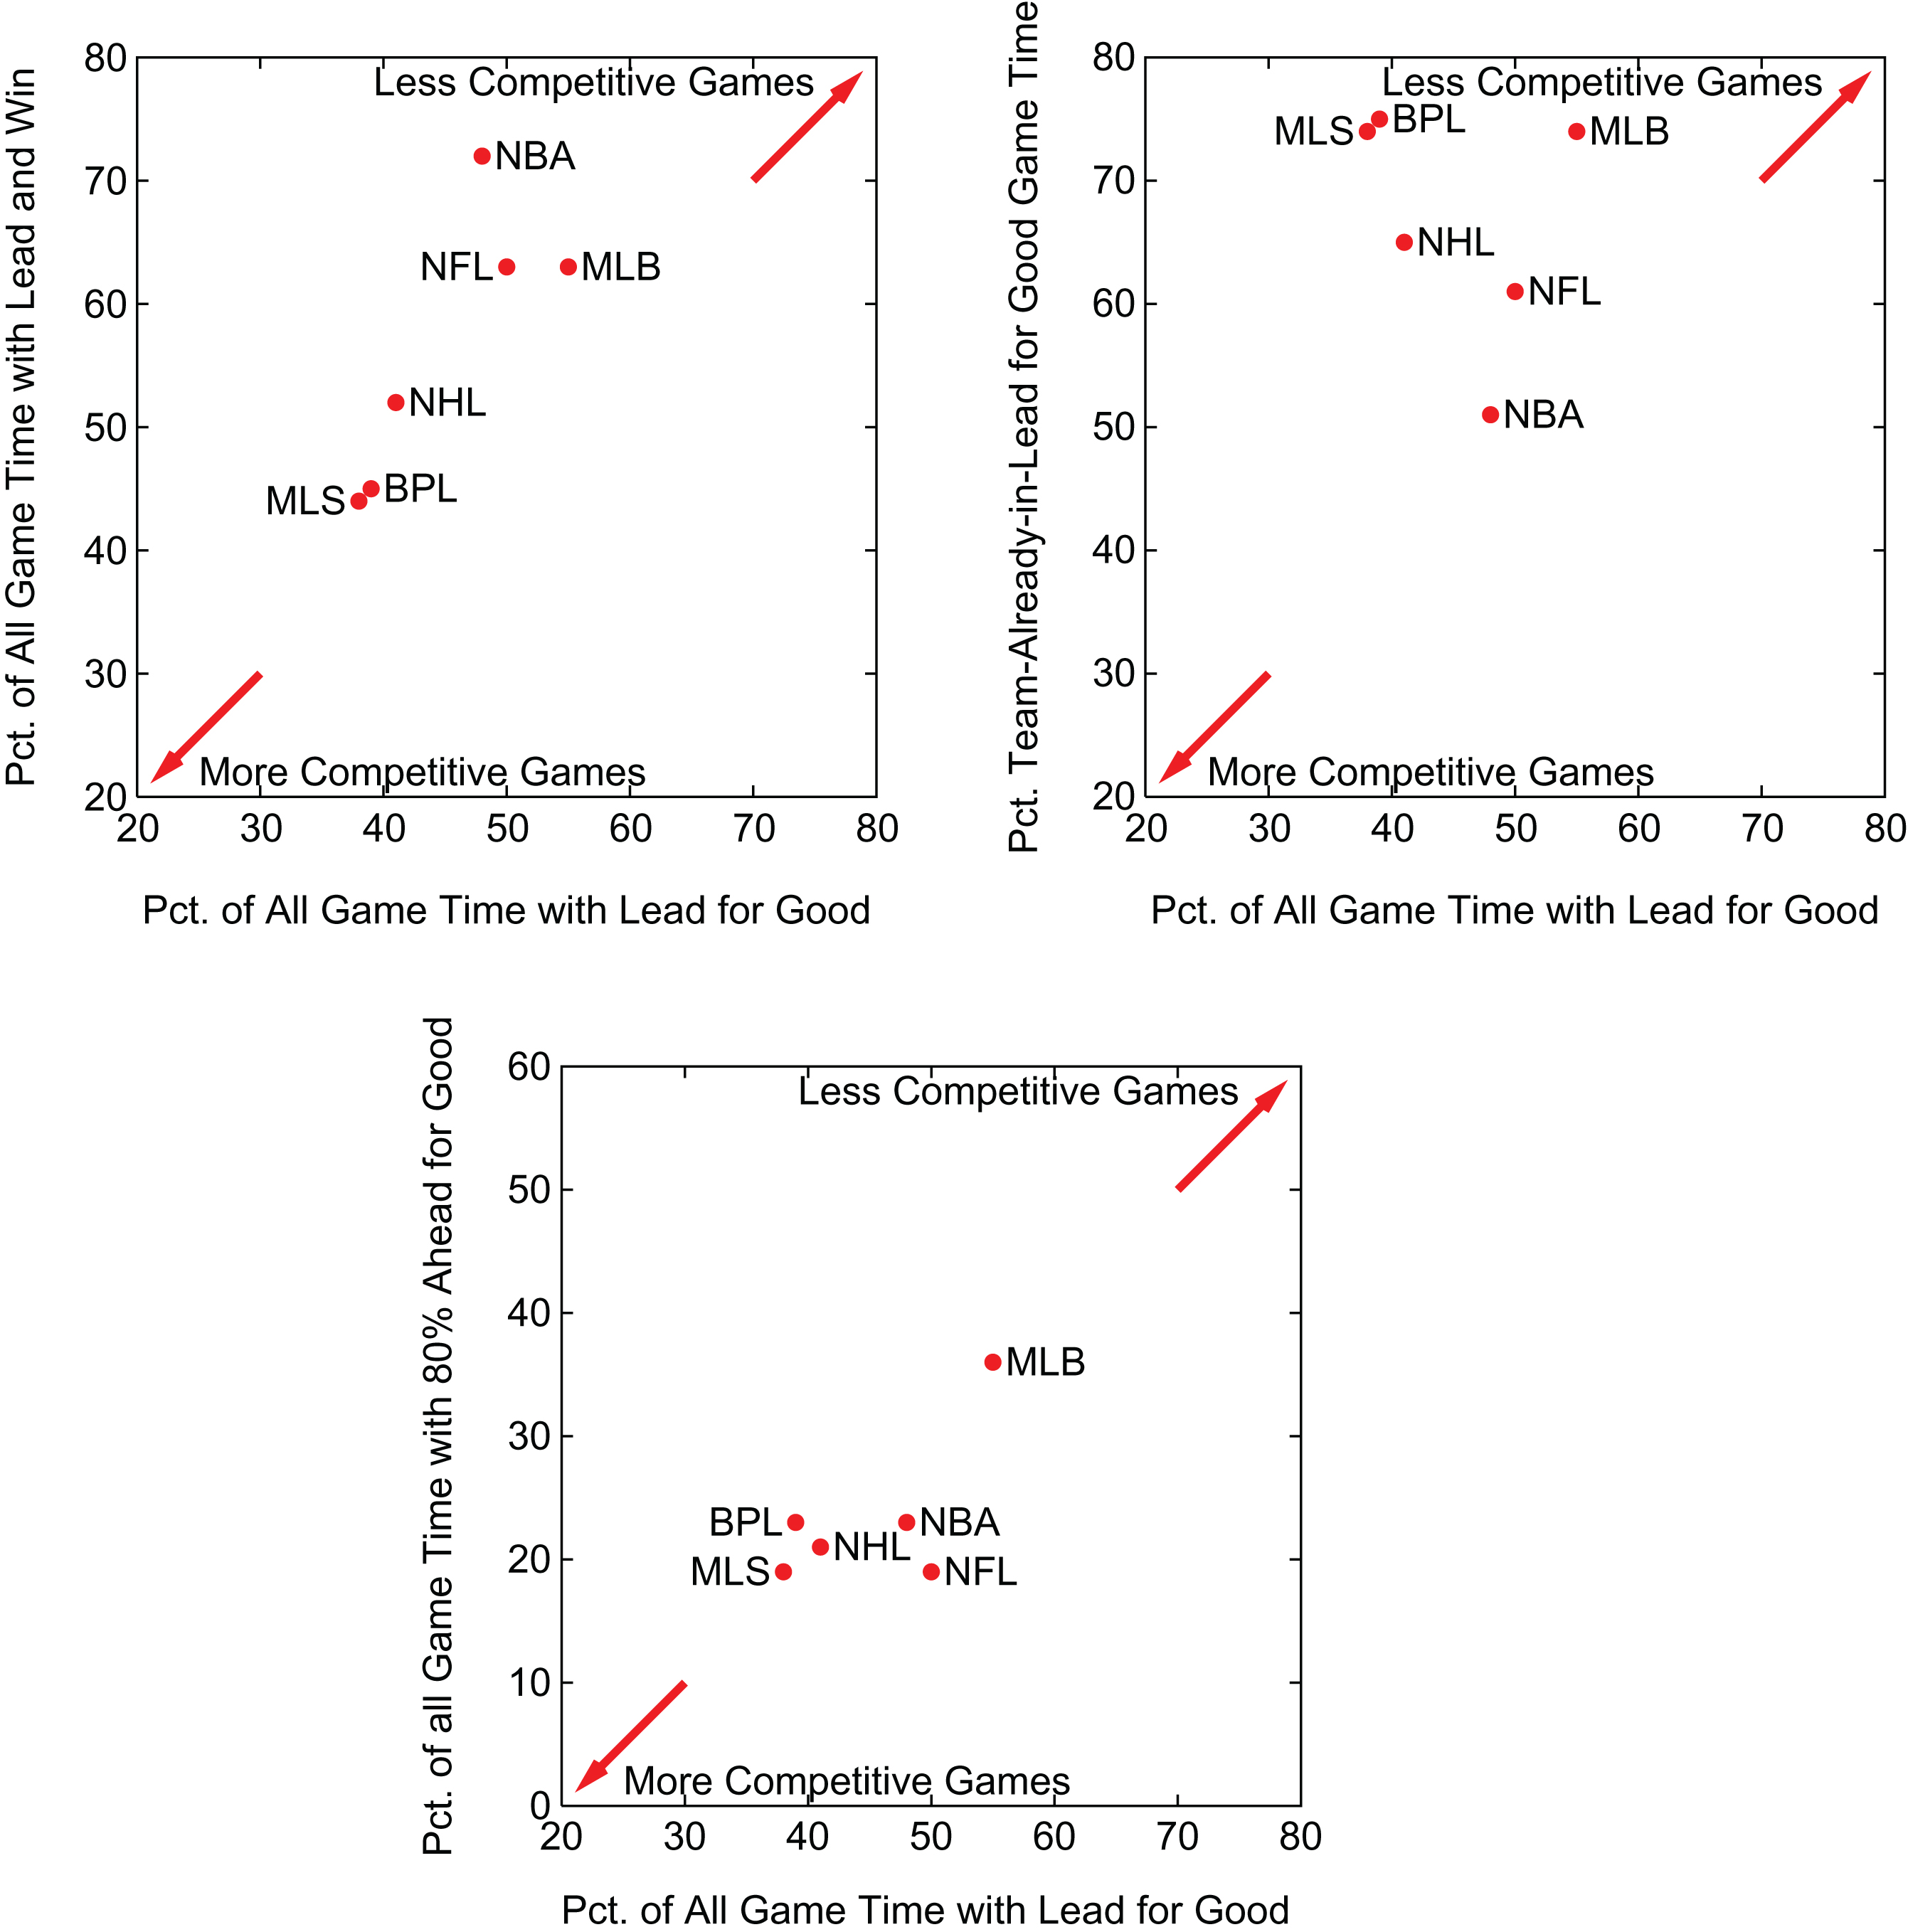
The graph in the upper-left of Fig. 12 compares the summary percentage of game time with the lead for good against the percentage of game time where the team in the lead goes on to win. These results are taken from Fig. 6. The graph is augmented with explanatory arrows indicating leagues with results that are closer to the upper-right corner are relatively less competitive while those closer to the lower-left corner are relatively more competitive. Results from these two metrics indicate that games in the NBA and MLB are relatively less competitive while those in the MLS and BPL are relatively more competitive.
The graph in the upper-right of Fig. 12 compares the summary percentage of game time with the lead for good against the percentage of game time where a team is already in the lead and stays in the lead for good. These results are taken from Figs. 6 and 8. This pairwise comparison of results show that MLB games are the least competitive while NBA games are the most competitive because teams trailing in an NBA game have the best chance of catching up at some point in the remainder of the game.
Finally the graph in the bottom of Fig. 1 compares the summary percentage of game time with the lead for good against the percentage of game-time where a team is ahead and has at least an 80% chance of staying ahead for good. These results are taken from Figs. 6 and 11. This pairwise comparison of results show that MLB games are the least competitive while results from the other leagues tend to be bunched with MLS having the most competitive games for this pair of metrics.
The outcome of these pairwise comparison of metric results is that games from MLB are clearly the least competitive compared with games from each of the other leagues in our study. MLB games have the highest percentage of game segments that are played in less competitive situations. MLS and BPL games tend to be the most competitive in general; largely because about half of game time for these leagues is spent with the game tied. However, if a team does take the lead in one of these leagues then they, along with MLB, have the highest chance that this team will not relinquish the lead. Results for the NFL and NHL show that they are neither relatively the most or least competitive. We believe variation in the competitiveness of the leagues occurs because of the nature of the sports in terms of how they are played and scored as well as the specific leagues themselves.
5Additional competitiveness results
Our metrics afford us the opportunity to investigate additional competitiveness results. In each of these cases we use the ahead-for-good metric introduced in Section 3.3 as the basis for our analysis.
5.1Competitiveness variation by season
A natural question is the degree to which game competitiveness varies across seasons. While we did not examine multiple seasons of data for all leagues, we do have four seasons worth of data for the NFL. In addition, (Pennington, 2015), a New York Times article written towards the end of the 2015 season, indicates that through 13 weeks of that regular season teams trailing in fourth quarter had rallied to win at a near-record seasonal number of times.
While we do not directly examine this statistic we can compare our competitive metrics for each of the four NFL seasons. Results for the set of metrics compared in Section 4 are shown in Fig. 13 for the 2012 to 2015 NFL seasons.
Fig.13
Summary Percentage of Game Time for Four Competitiveness Metrics.
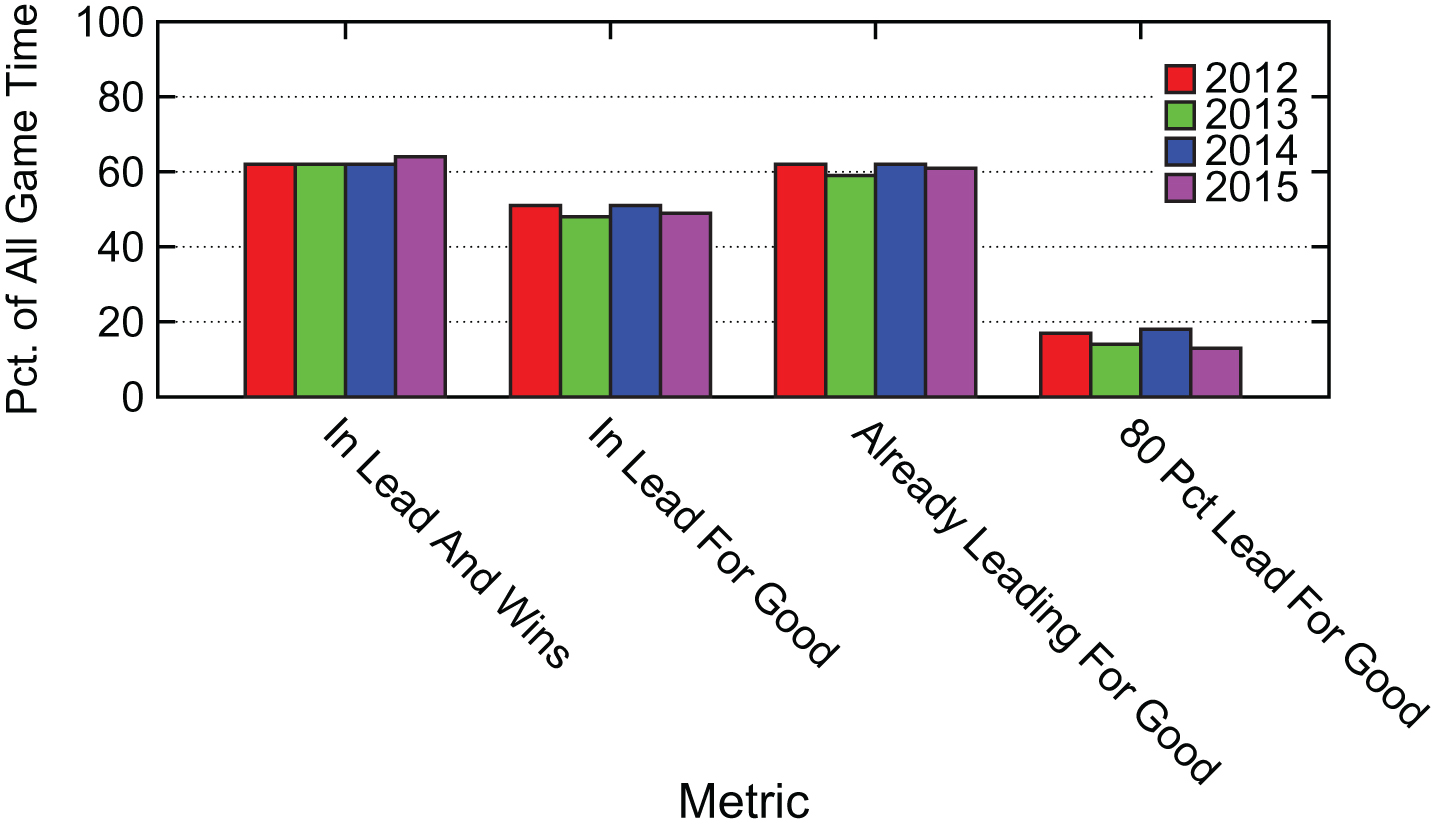
The results in Fig. 13 show that there is not a large variation in competitiveness metric results between the four NFL seasons. In particular, based upon our metrics, the 2015 season did not result in more competitive games than in the previous three seasons.
5.2Competitiveness of home and away teams
Another natural question that our metrics allow us to examine is the impact of home-field advantage in the various leagues. As a baseline, home teams win more than away teams in all six of the leagues we studied. The specific percentages for the home team winning (again we count a tie game as a half win) in each league are: MLB 54%, NBA 58%, NFL 57%, NHL 54%, BPL 58% and MLS 64%.
Whether the home team wins or loses a game does not necessarily reflect the competitiveness of the game. Again using the competitiveness metric of game time spent with a team ahead for good, Figure 14 shows the percentage of game time that the home and away team in each league spend in the lead for good.
Fig.14
Summary Home/Away Percentages of Game Time Ahead for Good.
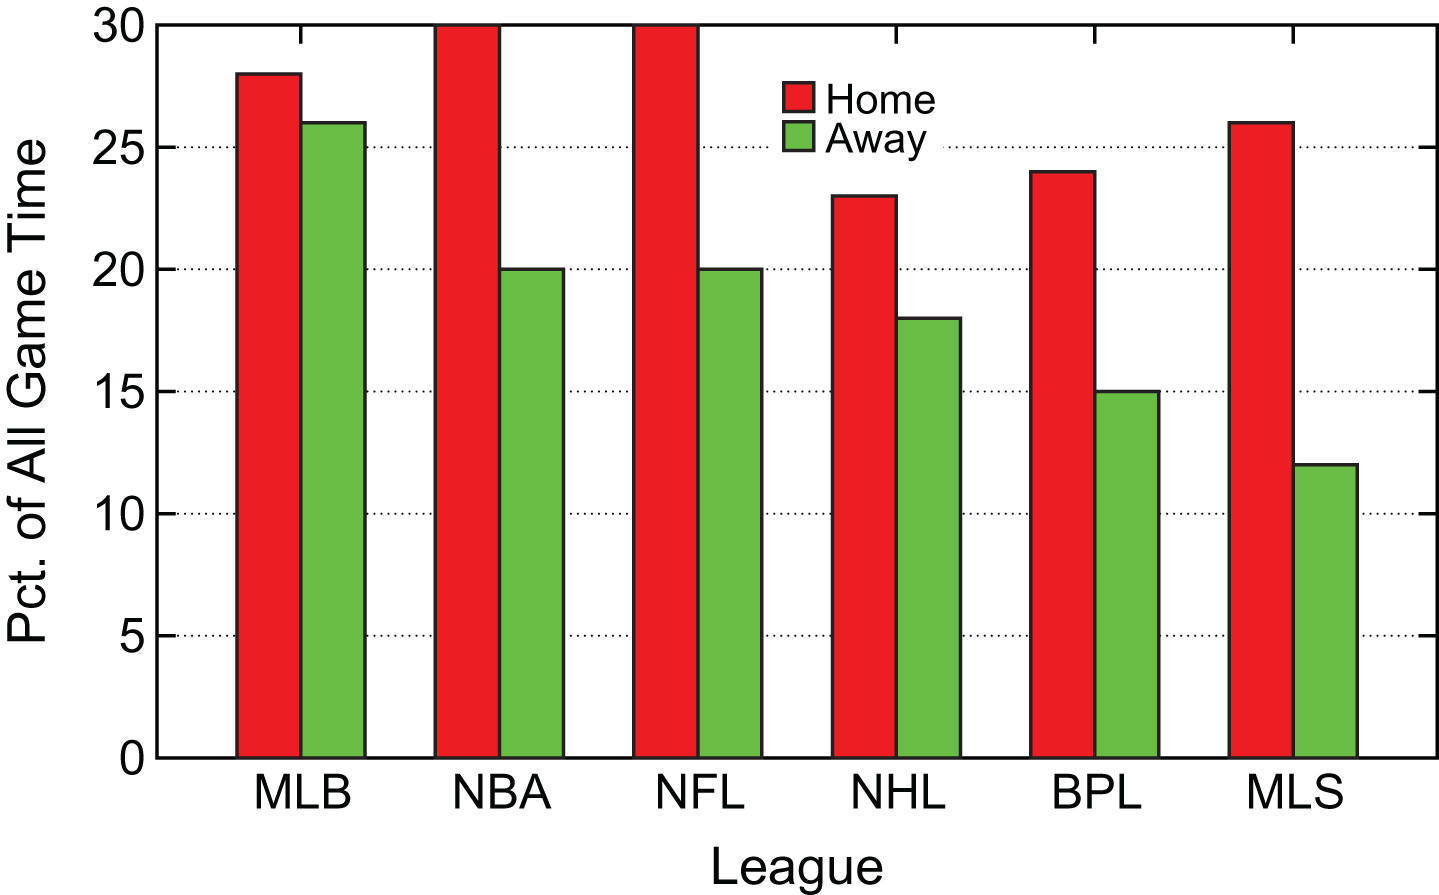
The results show that NFL and NBA home teams spend around 30% of game time ahead forgood—more than other leagues. NHL home teams spend the least amount of game time in the lead for good at 23%. MLB away teams spend the most amount of game time in the lead for good at 26% and MLS away teams the least at 12%. The difference between home and away team performance on this competitiveness metric is the least for MLB and the most for MLS. These results suggest that home-field advantage has the least impact on competitiveness for MLB and the most for MLS.
5.3Competitiveness of specific teams
Another advantage of our analysis approach is that we can compare of results of different teams not only within the same league, but across leagues. In the following we examine results for all teams in each of the six leagues for the seasons in our dataset.
For each team in each league we compute three values—the percentage of game time that a team is in the lead for good, the percentage of game time that the team is behind for good and the percentage of game time in which neither condition is true, meaning the game is still undecided. Results for each team in the MLB, NBA and NFL are shown in Fig. 15 with results for teams in the NHL, BPL and MLS shown in Fig. 16. In all graphs teams are ordered based upon the percentage of game time that the team is in the lead for good, which is the size of the bottom of the three bar segments for each team.
Fig.15
Team Competitiveness for MLB, NBA and NFL—Percentage of Game Time Ahead for Good, Behind for Good and Neither (Game Still Undecided).
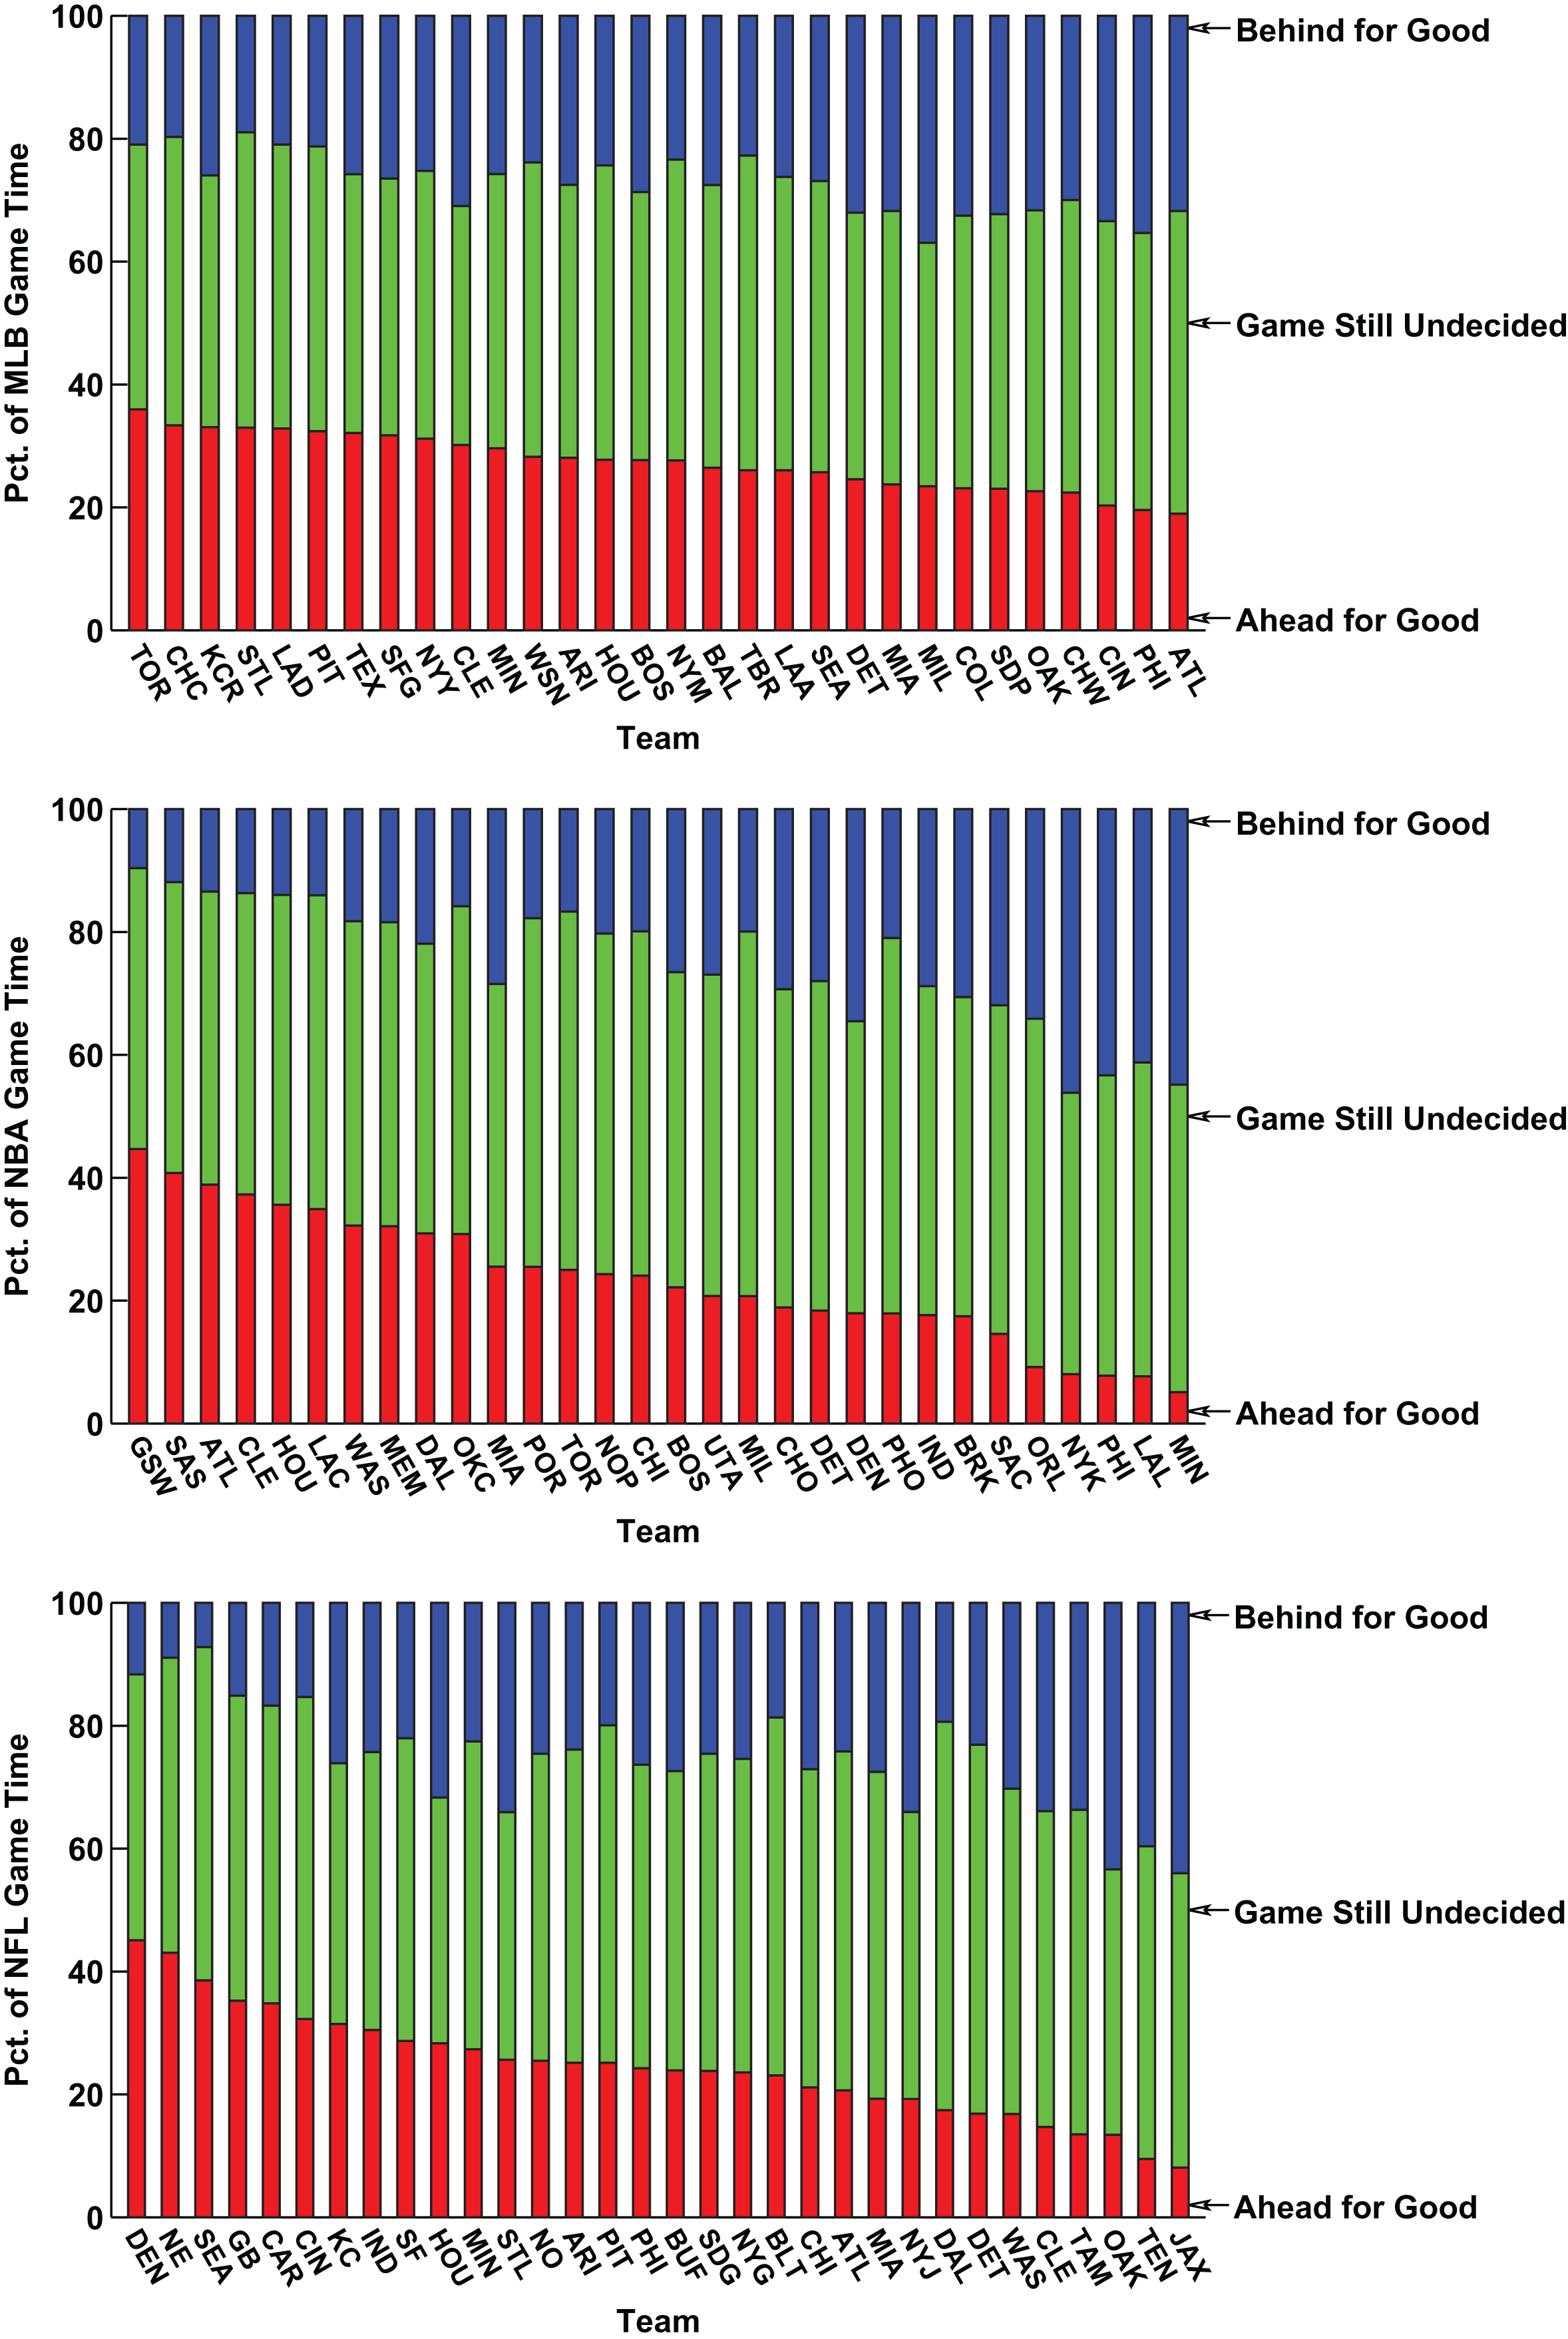
Fig.16
Team Competitiveness for NHL, BPL and MLS—Percentage of Game Time Ahead for Good, Behind for Good and Neither (Game Still Undecided).
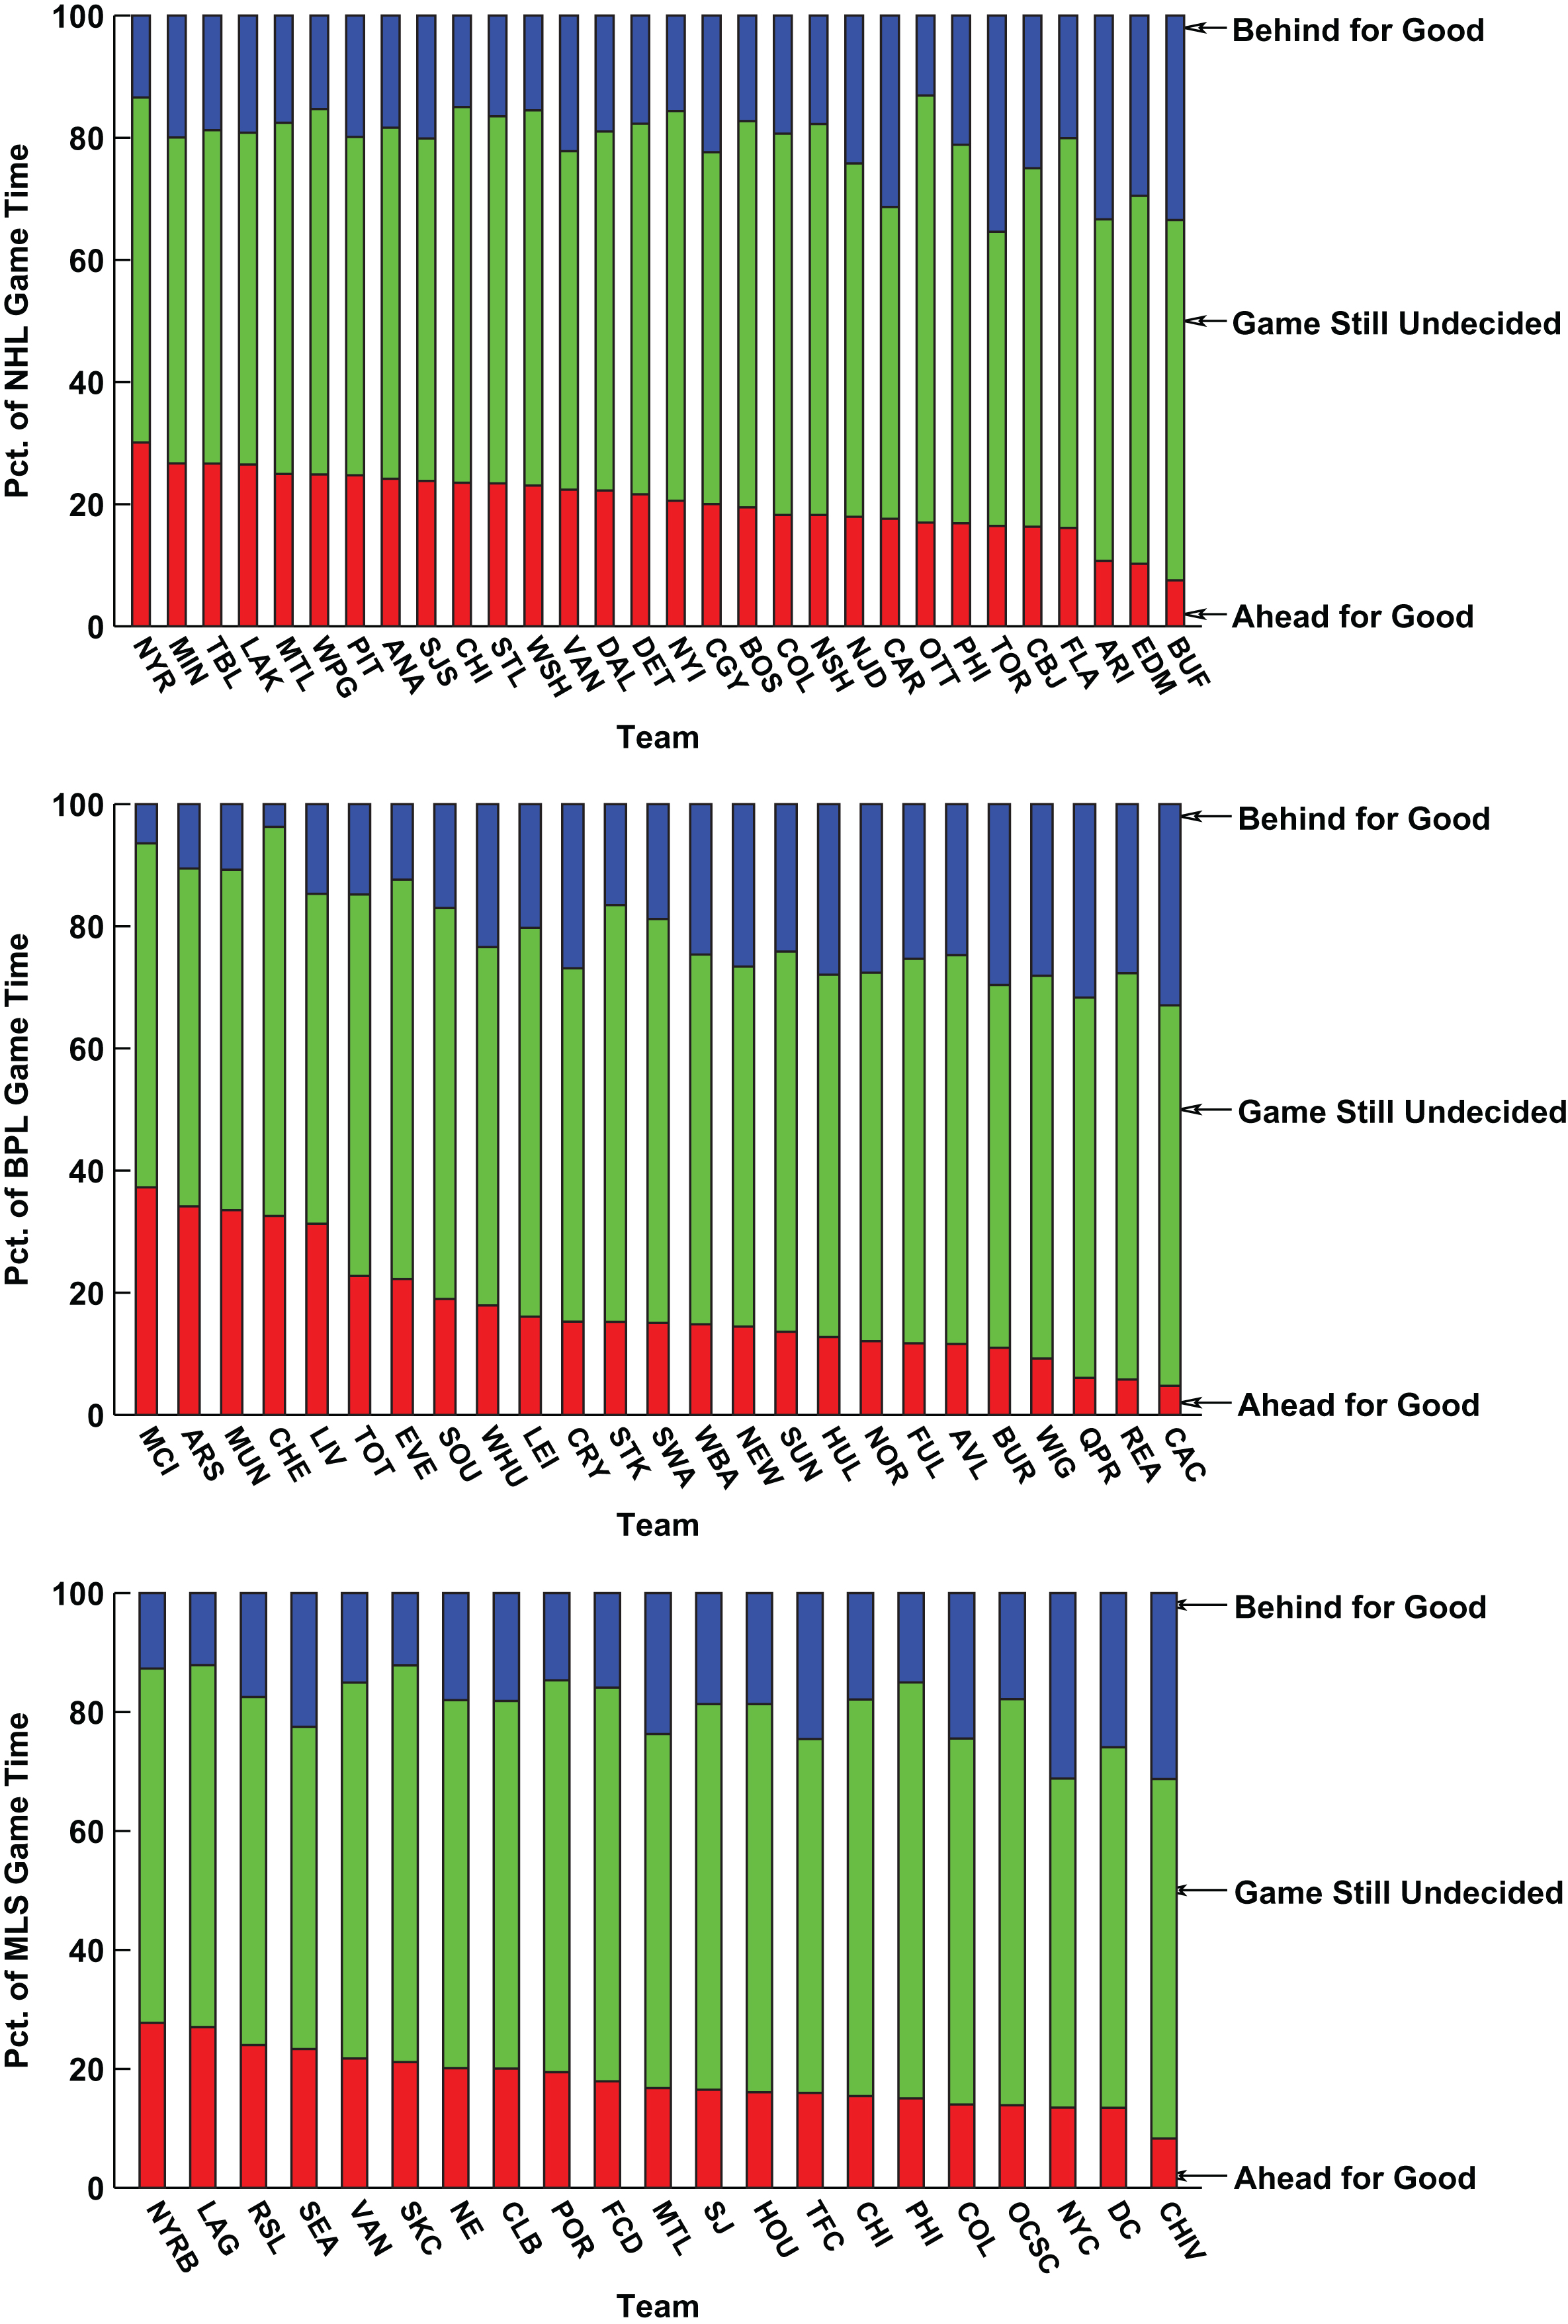
The results show that across the six leagues, the three teams with the highest percentage of game time spent in the lead for good (size of the bottom bar for each team) are the Golden State Warriors (GSW) of the NBA (45%), Denver Broncos (DEN) of the NFL (44%) and the New England Patriots (NE) of the NFL (43%). The three teams with the lowest percentage of game time spent in the lead for good are Cardiff City (CAC) of the BPL (5%), the Minnesota Timberwolves (MIN) of the NBA (5%) and the Queens Park Rangers (QPR) of the BPL (6%).
The three teams spending the lowest percentage of game time behind for good (size of the top bar for each team) are Chelsea (CHE) of the BPL (4%), Manchester City (MCI) of the BPL (6%) and the Seattle Seahawks (SEA) of the NFL (7%). At the other end of the spectrum, the three teams with the highest percentage of game time spent behind for good are the New York Knicks (NYK) of the NBA (46%), the Minnesota Timberwolves (MIN) of the NBA (45%) and the Jacksonville Jaguars (JAX) of the NFL (44%).
The three teams spending the most amount of game time in which neither they or their opponent is in the lead for good—largest middle bar for each team and the most competitive games—are the Philadelphia Union (PHI) of MLS (70%), Ottawa Senators (OTT) of the NHL (70%) and Stoke City (STK) of the BPL (68%). The three teams spending the most amount of game time either ahead or behind for good—smallest middle bar for each team and the least competitive games—are the Cleveland Indians (CLE) of MLB (39%), the Houston Texans (HOU) of the NFL (40%) and the Milwaukee Brewers (MIL) of MLB (40%).
Finally, the three teams with the most dominant performance during games—those with the largest positive percentage difference between game time played ahead for good against behind for good are the Golden State Warriors (GSW) of the NBA (+35%), the New England Patriots (NE) of the NFL (+34%) and the Denver Broncos (DEN) of the NFL (+33%). The least-dominant teams with the largest negative percentage difference between game time played ahead for good against behind for good are the Minnesota Timberwolves (MIN) of the NBA(-40%), the New York Knicks (NYK) of theNBA (-38%) and the Jacksonville Jaguars (JAX) of the NFL (-36%).
6Related work
Related work of different types has been previously done. Along with providing statistics about games, Web sites such as (NFL, 2016) determine a running win probability throughout the course of game, which is described in (Paine, 2013). (Beuoy & McCann, 2015) has computed win probabilities for all NBA teams. (Bashuk, 2012) generated a Win Probability Index for NCAA basketball. (Polson & Stern, 2015) start with the point spread for a game and calculate the implied volatility of a sports game. These works take into account more information for a single game than the score margin analysis in our work, but our approach allows us to easily accumulate results across games and sports along with considering more metrics of competitiveness than simply win probability.
(Cooper et al., 1992; Schmotzer, 2008) have examined the likelihood that a team will win based upon leading at various points in a game while (Brimberg & Hurley, 2009) examines the impact of scoring the first goal in hockey. (Clauset et al., 2015) models safe leads and lead changes while (Gill, 2000) models late-game reversals. Part of the work by (Falter & Pe'rignon, 2000) examines intra-match winning probability in French football. (McGivney & Zegarelli, 2008) conjectures that the winner of an NBA game can be predicted if the lead grows larger than the number of minutes remaining in the game. (Stern, 1994) modeled a sports contest as a Brownian motion process to predict the progress of scores in NBA games. (Merritt & Clauset, 2014) models within-game scoring dynamics to predict game outcomes.
In terms of work on competitiveness, (Ben-Naim, Vazquez & Redner, 2005, 2006) examine the competitiveness and parity among teams within professional sports leagues by examining game results and season-end standings. These works do not examine intra-game competitiveness. (Wolfson & Koopmeiners, 2015) also seeks to use game results to correctly predict games from prior results. (de Saá Guerra et al., 2012) models the overall competitiveness of a sports league rather than ofindividual games. Early work by (Stern, 1991) examined the probability of winning a football game.
7Summary and future work
In this work we have examined the competitiveness of games in six professional sports leagues. We obtained the list of scoring events for each game and mapped each event into a discrete segment, based on minutes played or outs recorded, for each game. A significant advantage of our approach is that all sports are analyzed in the same manner with the only difference between leagues being the number of segments into which each game is divided. This approach allows us to compute a common percentage-based timeline to compare the competitiveness of different leagues through the course of a game.
A distinguishing feature of our work is that we explore a number of potential measures of competitiveness using our data. These measures include whether a team is leading, whether a team is leading by more than a given number of scores, whether a team is in the lead and wins the game, whether a team is in the lead for good, whether a team already winning goes on to win or stay ahead for good, and the probability that a team with the lead at a given point in the game will stay ahead for good.
We analyze the games in each professional sports league using each of these competitiveness metrics and find that MLB games are clearly the least competitive compared with games from each of the other leagues in our study. MLB games have the highest percentage of game segments that are played in less competitive situations. MLS and BPL games tend to be the most competitive in general; largely because about half of game time for these leagues is spent with the game tied. However, if a team does take the lead in one of these leagues then they, along with MLB, have the highest chance that this team will not relinquish the lead. Results for the NFL and NHL show that their games are neither relatively the most or least competitive. We believe variation in the competitiveness of the leagues occurs because of the nature of the sports in terms of how they are played and scored as well as the specific leagues themselves.
We go on to find that NFL home teams spend the most amount of game time ahead for good and NHL home teams spend the least. Using this ahead-for-good metric, there is the most amount difference for home and away teams in MLS while there is the least in MLB.
Finally we use this same ahead-for-good metric to evaluate the competitiveness performance of all teams across the six leagues in our study. The Denver Broncos of the NFL spent the most game time ahead for good of all professional teams while Chelsea of the BPL spent the least amount of time behind for good. The Golden State Warriors of the NBA and the New England Patriots of the NFL had the most dominant game performance based upon the difference in ahead-for-good versus behind-for-good game time.
The study has a number of directions for future work. An obvious direction is to examine other leagues playing the same sports analyzed in this work. These include additional professional soccer leagues from around the world and American college sports. The analysis can also be extended to any sport where games have a fixed duration with identifiable scoring events such as rugby or lacrosse. Analysis of other sports such as volleyball and tennis could be done, but matches are not a fixed length as they end once a team (player) wins a given number of games (sets). This variable game length would need to be accounted for. A game like chess is even more challenging in identifying scoring events and dealing with resignation by a player, which is a clear sign of a noncompetitive game. Finally we have even done preliminary work on applying our approach to video games where we have analyzed League of Legends games, which has required identifying scoring events and handling resignation.
References
1 | Bashuk M. ((2012) ). Using cumulative win probabilities to predict NCAA basketball performance, in Proceedings of the MIT Sloan Sports Analytics Conference, pp. 1–10. |
2 | Ben-Naim E. , Vazquez F. & Redner S. ((2005) ). What is the most competitive sport? arXiv preprint physics/0512143. |
3 | Ben-Naim E. , Vazquez F. & Redner S. ((2006) ). Parity and predictability of competitions, Journal of Quantitative Analysis in Sports, 2: (4). |
4 | Beuoy M. & McCann A. ((2015) ). Every NBA team’s chance of winning in every minute across every game. http://fivethirtyeight.com/features/every-nba-teams-chance-of-winning-in-every-minute-across-every-game/ |
5 | Brimberg J. & Hurley W. ((2009) ). A note on the importance of the first goal in a National Hockey League game, International Journal of Operational Research, 6: (2), 282–287. |
6 | Clauset A. , Kogan M. & Redner S. ((2015) ). Safe leads and lead changes in competitive team sports, Physical Review E, 91: (6), 062815. |
7 | Cooper H. , DeNeve K.M. & Mosteller F. ((1992) ). Predicting professional sports game outcomes from intermediate game scores, Chance, 5: (3-4), 18–22. |
8 | de Saá Guerra Y. , González J.M. , Montesdeoca S.S. , Ruiz D.R. , García-Rodríguez A. & García-Manso J. ((2012) ). A model for competitiveness level analysis in sports competitions: Application to basketball, Physica A: Statistical Mechanics and its Applications, 391: (10), 2997–3004. |
9 | Falter J.-M. & Pérignon C. ((2000) ). Demand for football and intramatch winning probability: an essay on the glorious uncertainty of sports, Applied Economics, 32: (13), 1757–1765. |
10 | FC ((2016) ). ESPN FC. http://www.espnfc.us |
11 | Gill P.S. ((2000) ). Late-game reversals in professional basketball, football, and hockey, The American Statistician, 54: (2), 94–99. |
12 | Goldman M. & Rao J.M. ((2011) ). Allocative and dynamic efficiency in NBA decision making, in Proceedings of the MIT Sloan Sports Analytics Conference, pp. 4–5. |
13 | McGivney K. , McGivney R. & Zegarelli R. ((2008) ). Light it up, Chance, 21: (4), 45–50. |
14 | Merritt S. & Clauset A. ((2014) ). Scoring dynamics across professional team sports: tempo, balance and predictability, EPJ Data Science, 3: (1), 1–21. |
15 | MLB ((2016) ). Baseball-reference.com. |
16 | NBA ((2016) ). Basketball-reference.com. |
17 | NFL ((2016) ). Pro-football-reference.com. |
18 | NHL ((2016) ). Hockey-reference.com. |
19 | Paine N. ((2013) ). The p-f-r win probability model. http://www.pro-football-reference.com/about/win_prob.htm |
20 | Pennington B. ((2015) ). That rarity, the last-minute comeback is happening quite a bit more, The New York Times, December 13 issue. |
21 | Polson N.G. & Stern H.S. ((2015) ). The implied volatility of a sports game, Journal of Quantitative Analysis in Sports, 11: (3), 145–153. |
22 | Schmotzer B. ((2008) ). When is the lead safe in a college basketball game? Chance, 21: (4), 37–44. |
23 | Stern H. ((1991) ). On the probability of winning a football game, The American Statistician, 45: (3), 179–183. |
24 | Stern H.S. ((1994) ). A Brownian motion model for the progress of sports scores, Journal of the American Statistical Association, 89: (427), 1128–1134. |
25 | Wolfson J. & Koopmeiners J.S. ((2015) ). Who’s good this year? comparing the information content of games in the four major US sports, arXiv preprint 1501.07179. |


