
Competition between sports hurts TV ratings: How to shift league calendars to optimize viewership
Abstract
Television is becoming an increasingly critical revenue stream in the sports industry, as media rights deals in the four major North American sports (NBA, MLB, NHL, and NFL) continue to escalate by huge rates every time they are up for renewal. However, games frequently overlap with each other on the calendar, and this competition for viewership often has substantial negative effects on ratings. This paper attempts to isolate the effects of overlap from each sport, examine how that competition hurts viewership in each league, and quantify the value lost due to that overlap. We find that competition can have very damaging effects for TV viewership for every sport, most notably the NHL, and these losses can significantly diminish the value of a network’s investments in sports programming. In most cases, this overlap is entirely avoidable with some relatively unobtrusive season calendar shifts.
1Introduction
In an age where live events are the only television programs that can garner collective mass American audiences anymore, sports programming rights fees have exploded and are becoming increasingly vital to the sustainability of the broadcast television model. In fact, in 2013, 34 that fall’s 35 highest-rated programs in America were NFL games, and TV rights are becoming an ever more important portion of leagues’ bottom lines. Pioneering NFL businessman Tex Schramm even predicted in 1980 that every football game would one day be played in made-for-TV soundstages absent of fans.
Live sports certainly captivate large numbers of viewers, and according to conventional wisdom, when two live events air at the same time, they compete head-to-head for those eyeballs. It is often discussed how NFL games allegedly crush ratings for the World Series or NBA playoff games devour the audience for their NHL playoff counterparts. If ratings are so critical to franchise bottom lines and competition does in fact hurt ratings, though, why do so many sports willingly overlap while other parts of the year are left empty, flush with fans hungering for sports programming? Much of this overlap can easily be prevented, as there is a vast stretch of the summer from mid-June to the end of August during which the only major sport in season is regular season MLB games— among the lowest rated programming of the four major sports.
Would NHL or NBA playoff TV ratings increase if either pushed its calendar back and avoided directly competing with the other from April-June? Would World Series ratings cease their downward spiral if they moved up from October before getting caught in the supposed NFL black hole? In an industry where teams hire armies of statisticians, coaches, trainers, and scouts to claw at every last inch of competitive edge and where leagues squeeze out every last drop of revenue, one would think someone would notice if that were the case— or does programming competition from other sports simply have little effect on ratings?
2Data collection and classification
After meticulously gathering TV ratings data from the websites Sports Media Watch and TV by the Numbers, we have a data set of 1,824 MLB, NBA, NHL, and NFL nationally broadcast games between 2000–2014. (Roughly 85% of these games occurred in 2009 or later.) For the years 2013 and 2014, this is a nearly-complete sample of all NBA, NHL, NFL, and MLB playoff games that occurred on those years. (The only omissions are those not included in the Sports Media Watch or TV by the Numbers databases for unknown reasons; they constitute less than two percent of playoff games in those years.)
There should not be any significant selection issues with this study. We have collected complete data for every NHL and NBA playoff game in 2013-2014 as well as every NFL national broadcast game during those years. In addition, we have collected Stanley Cup Finals, World Series, and NBA Finals data for most years since 2006 and complete nationally-broadcast NHL and NBA regular season data for 2013 and 2014. We control for playoff round and regular season in the regression, so an imbalance in playoff game data should not bias the results.
Because of the tedious nature of this data collection— often individually documenting games one-by-one from various articles and reports— our data set is in essence a proprietary one, and for that reason, it has been posted in a public GitHub account, jpagels/Sports-Television-Ratings, so that the results may be reproducible.
This sample is comprised solely of nationally televised games. Locally broadcast games on regional sports networks (RSNs) are not included. For each game in each league’s data set, there are documented a large number of variables in an attempt to accurately isolate the effects of competition from other leagues. Most of these variables are tracked in all four data sets, but some are unique to particular sports. A complete list of variables included can be found in the appendix.
Games are coded as overlapping if they started within 1.5 hours of each other. This also includes intra-sport overlap (i.e. if two NBA playoff games occurred at the same time). College football is accounted for as an overlap metric for the four professional leagues but is not itself studied for the effects of other sports on college football.
While regionally broadcast games are not included in the sample, they are in fact counted as competition. For example, the NBA does not have a national television package on Sunday nights, but during Sunday nights in the fall, there are almost always at least five NBA games on RSNs in markets around the country, which are also available streaming online and on NBA’s “League Pass” package. These non-nationally televised NBA games are not counted as records in the NBA data set, but they are counted as NBA overlaps in the NHL, MLB, and NFL data sets. While these local NBA broadcasts are not as widely accessible as TNT’s or ESPN’s nationally broadcast cable games, it seems more reasonable to classify these situations as overlap rather than to simply ignore them. We make this decision due to the rarity of there being fewer than five games televised on American RSNs as well as the ability to stream these games online in any region of the country.
Other studies have examined NFL TV ratings based on factors such as the performance of teams and uncertainty of games. One study by Paul and Weinbach (2007) found that fans tuned in at higher rates for high-scoring and winning teams where the game outcome was uncertain, results later confirmed by Grimshaw and Burwell’s (2014) study of NFL games in the Salt Lake City market. This research has also been applied to European soccer by Buraimo, Forrest, and Simmons (2007), which found that TV audiences are more likely to tune in to games that are uncertain as dictated by the pre-game betting lines. Another study of German national football team games in the 1990s by Feddersen and Rott (2011) found quality of opponents and significance of match to be the largest determinants of TV audience size. Due to the limitations of our data collection methodology, we will not include team quality or performance as controls in our study. However, given our large random sample and low variance of our coefficients, we are confident the omission of these variables will not significantly bias our results.
3Methodology
Using R Statistical Software, we can analyze each league’s data set with a multiple linear regression model, which isolates the adjusted effects of each variable on total viewership. We code year and playoff round as factors while labeling time as numerical.
We then use a backwards selection regression in which variables with the highest p-values— thus non-significant predictors of ratings— are removed from the model one-by-one until no remaining variables have p-values values greater than 0.1. For example, here is the final model used for NHL playoffratings:
Our key variables for this study are the overlap ones, but in some instances, they are collinear with other variables and thus do not appear in our initial models. (This collinearity most commonly occurs with the variables NFL overlap and weekday, as the NFL plays almost all of its games exclusively on Thursdays, Sundays, and Mondays.) In these situations, we first remove the most likely collinear variables. If collinearity persists, we remove the relevant variables with the highest p-values one-by-one until the source of collinearity is determined. The removed relevant variables are then re-added to the model.
Some sets of variables are so collinear, though, that it is impossible to separate their effects without severely compromising the model— specifically in the case of NHL regular season games overlapping with NBA regular season games and vice versa, as those leagues’ schedules nearly perfectly overlap without many off-night examples to study viewership sans competition from the other.
Our study benefits from some recent accidents of scheduling. In most years, the NHL playoffs overlap with only the last few games of the NBA regular season before the NBA’s playoffs start themselves, and the NBA and NHL playoffs nearly perfectly overlap with each other. However, recent lockouts in the NHL (2012-13) and NBA (2011-12), each created a natural experiment in pushing back the regular season and playoffs for their respective sports and thus providing: a) a larger sample of overlap between playoff games and regular season games and b) a larger sample of regular season and playoff games free from competition, as the lockout league’s season would stretch further into the summer than the other sport’sseason.
4Results
In each model, we will take the coefficient estimate for the overlap variables and use it as a measure of the average viewers lost due to the presence of this competition. The overlap of another sport was significant in predicting viewership in the following situations documented in Table 1.
Table 1
Percentage and total viewers lost to overlap
| Game type | Competition | Average viewers | Lost from overlap | Standard error | Percent lost |
| NHL regular season | NBA playoffs | 905,500 | 478,500 | 199,400 | 34.6% |
| NHL regular season | NBA regular season | 905,500 | 393,500 | 151,700 | 30.3% |
| NHL regular season | MLB regular season | 905,500 | 264,500 | 102,900 | 22.6% |
| NHL Playoffs | NBA playoffs | 1,886,000 | 474,700 | 208,000 | 20.1% |
| NBA regular season | MLB regular season | 1,889,158 | 471,900 | 127,000 | 20.0% |
| MLB Playoffs | College football | 10,029,306 | 1,549,000 | 349,000 | 13.4% |
| NBA playoffs | NHL playoffs | 5,706,000 | 515,500 | 227,600 | 8.3% |
| NFL regular season | MLB playoffs | 18,018,474 | 1,603,000 | 443,600 | 8.2% |
The NHL bears the brunt of most overlap damage, with the four highest percentage losses. Most damaging is the fact that the NHL playoffs lose on average 34.6% of its audience when competing head-to-head with the NBA playoffs— an overlap that occurs during nearly every playoff game other than the Stanley Cup Finals. The NHL also loses 30.3%, 22.6%, and 20.1% of its audience for games that compete against the NBA regular season, MLB regular season, and NBA playoffs respectively, but these overlaps occur less frequently. (In fact, the NHL regular season – NBA playoff overlap only occurred during the 2012-13 season when the NHL’s lockout pushed back its start and caused its regular season to extend into the NBA playoff calendar.)
One interesting finding is that while it may seem like the NFL’s arrival crushes the MLB (and conventional wisdom certainly holds as much), the model shows no impact on the presence of NFL games during the MLB regular season or playoffs. (Some of this likely due to the fact that many Sunday MLB playoff games benefit from the FOX NFL Sunday lead-in.)
Based on the current rates of rights fees per viewer, we can quantify the lost revenue competition costs each league, as noted in Table 2. Value per viewer for each league is calculated by finding the average viewership for each type of game for each league (i.e. regular season, first round of playoffs, etc.) and by TV network. That average is then multiplied by the total number of such games that had occurred in a single season, to produce a total season viewership by network. That total season viewership is then divided by the average annual TV rights a network had paid. For example, in 2011, the NHL sold U.S. media rights to NBC for $2 billion over 10 years, for an average of $200 million per year. This $200 million was then divided by the total season viewership for nationally televised NBC games. For leagues in which there are more than one national TV broadcaster, total viewership was calculated for each network and summed, and annual TV revenue was calculated for each network and summed. Total TV revenue across all networks was then divided by total viewers across all networks to calculate average revenue per viewer.
Table 2
Total annual viewership value lost to overlap
| League | Value per | Average | Viewers lost | Value lost per | Value lost per |
| (competition) | viewer1 | yearly | overlap | overlap | year |
| overlaps | |||||
| NBA playoffs (NHL playoffs) | $3.73 | 65 | 515500 | $1,922,815 | $124,982,975 |
| NFL regular season (MLB playoffs) | $2.80 | 8 | 1603000 | $4,488,400 | $35,907,200 |
| NHL Playoffs (NBA playoffs) | $1.11 | 65 | 474700 | $526,917 | $34,249,605 |
| MLB Playoffs (College football) | $4.00 | 3 | 1549000 | $6,196,000 | $18,588,000 |
| NBA regular season (MLB regular season) | $3.73 | 9 | 471900 | $1,760,187 | $15,841,683 |
| NHL regular season (NBA regular season) | $1.11 | 26 | 393500 | $436,785 | $11,356,410 |
| NHL regular season (MLB regular season) | $1.11 | 6 | 264500 | $293,595 | $1,761,570 |
| NHL regular season (NBA playoffs) | $1.11 | 02 | 478500 | $531,135 | $0 |
1These values are based off the most recent national television contracts and average audience for those games. 2This type of overlap only occurred in the 2013 season as a result of that year’s NHL lockout.
The NBA, thanks to its lucrative television deal signed in October 2014, has a high per viewer value and thus sustains by far the greatest financial loss due to overlap. The NHL, which has the greatest percentage losses to overlap, has a relatively small revenue lost by comparison. This is largely due to lower starting audiences as well as far lower per viewer value. This latter fact persists mostly for two reasons: 1. The NHL signed its current deal with NBC in 2011, right before the explosion in TV rights fees for sports, 2. Much of the league’s television revenue comes from Canadian contracts, which were not factored into this calculation. When the NHL signs a new U.S. national television contract starting in the 2021-22 season, assuming media rights trends continue, this lost overlap revenue will surely be significantly higher.
5Calendar improvement
These findings strongly suggest that leagues should communicate and organize their schedules in such a way that they do not overlap and hurt each other’s ratings. These numbers offer some other suggestions for how leagues could avoid overlap and improve ratings:
• This most damaging competition in terms of percent of audience lost— the NHL playoffs being hurt by the NBA playoffs— can easily be avoided with a move away from April-June, possibly to the currently barren July-August. This finding is the second-largest potential per game viewership gain in the study and by far the most impactful in the aggregate, as there are many NHL playoff games (average of 88.5 per year from 2011–2014), so the effects of such overlap loss are multiplied over a greater number of events.
• MLB takes a 13.4% hit for playoff games when it competes head-to-head with college football, and this is the second-greatest estimated per game damage in this study in terms of total viewers lost. MLB might consider moving its season earlier to avoid college football, as there are no other games for which baseball is affected. (This move would have the added benefit for the NFL of resolving the NFL’s overlap damage from MLB playoff games.) However, this may not be of utmost concern to MLB given that this damaging overlap only occurs one day a week for the roughly two months the MLB and college football seasons overlap.
• The NFL could garner a slight ratings boost by moving its season two months later to start in November after the MLB playoffs have concluded. The NFL proves immune to damage from both the NBA and NHL regular seasons, so greater overlap with these leagues should not harm NFL ratings. The NFL does take the largest ratings hit in terms of numbers of viewers when competing with the MLB playoffs, but this large loss is simply because NFL games already have such large audiences in the first place, and the loss is a relatively small 8.2% of the NFL’s total audience.
• The NBA might consider moving its season back so that its regular season games do not overlap as much with the NFL and so that its playoffs do not overlap with the NHL’s. However, such a move would mean greater numbers of NBA games that overlap with MLB regular season ones, which are roughly as damaging to the NBA viewership-wise as NFL games are. Also, as MLB games occur every night of the week, such a move would affect all four of the NBA’s spring national TV nights (Mondays, Wednesdays, Thursdays, and Fridays) as opposed to the NFL only competing with Thursday games in the fall. Instead, the NBA’s best outcome is to encourage the NHL to move back its schedule and avoid overlap in a mutually beneficial calendar shift.
So, what would an improved sports calendar look like in which the four major sports leagues cooperate to minimize competition among each other for viewers? We can take our findings from the previous section and, as shown in in Fig. 1, manually adjust the current sports calendar so as to avoid the most damaging overlaps. We will prioritize avoiding competition for playoff games, as those are the highest-rated games in each sport. We also seek to leave outdoor sports during their proper time of year so that baseball is not played in winter or football in the summer, as well as avoid scheduling playoffs from mid-to-late March, the time during which the NCAA Men’s Basketball Tournament is held.
Fig.1
An adjusted annual calendar should leagues cooperate to prevent overlaps and maximize ratings.
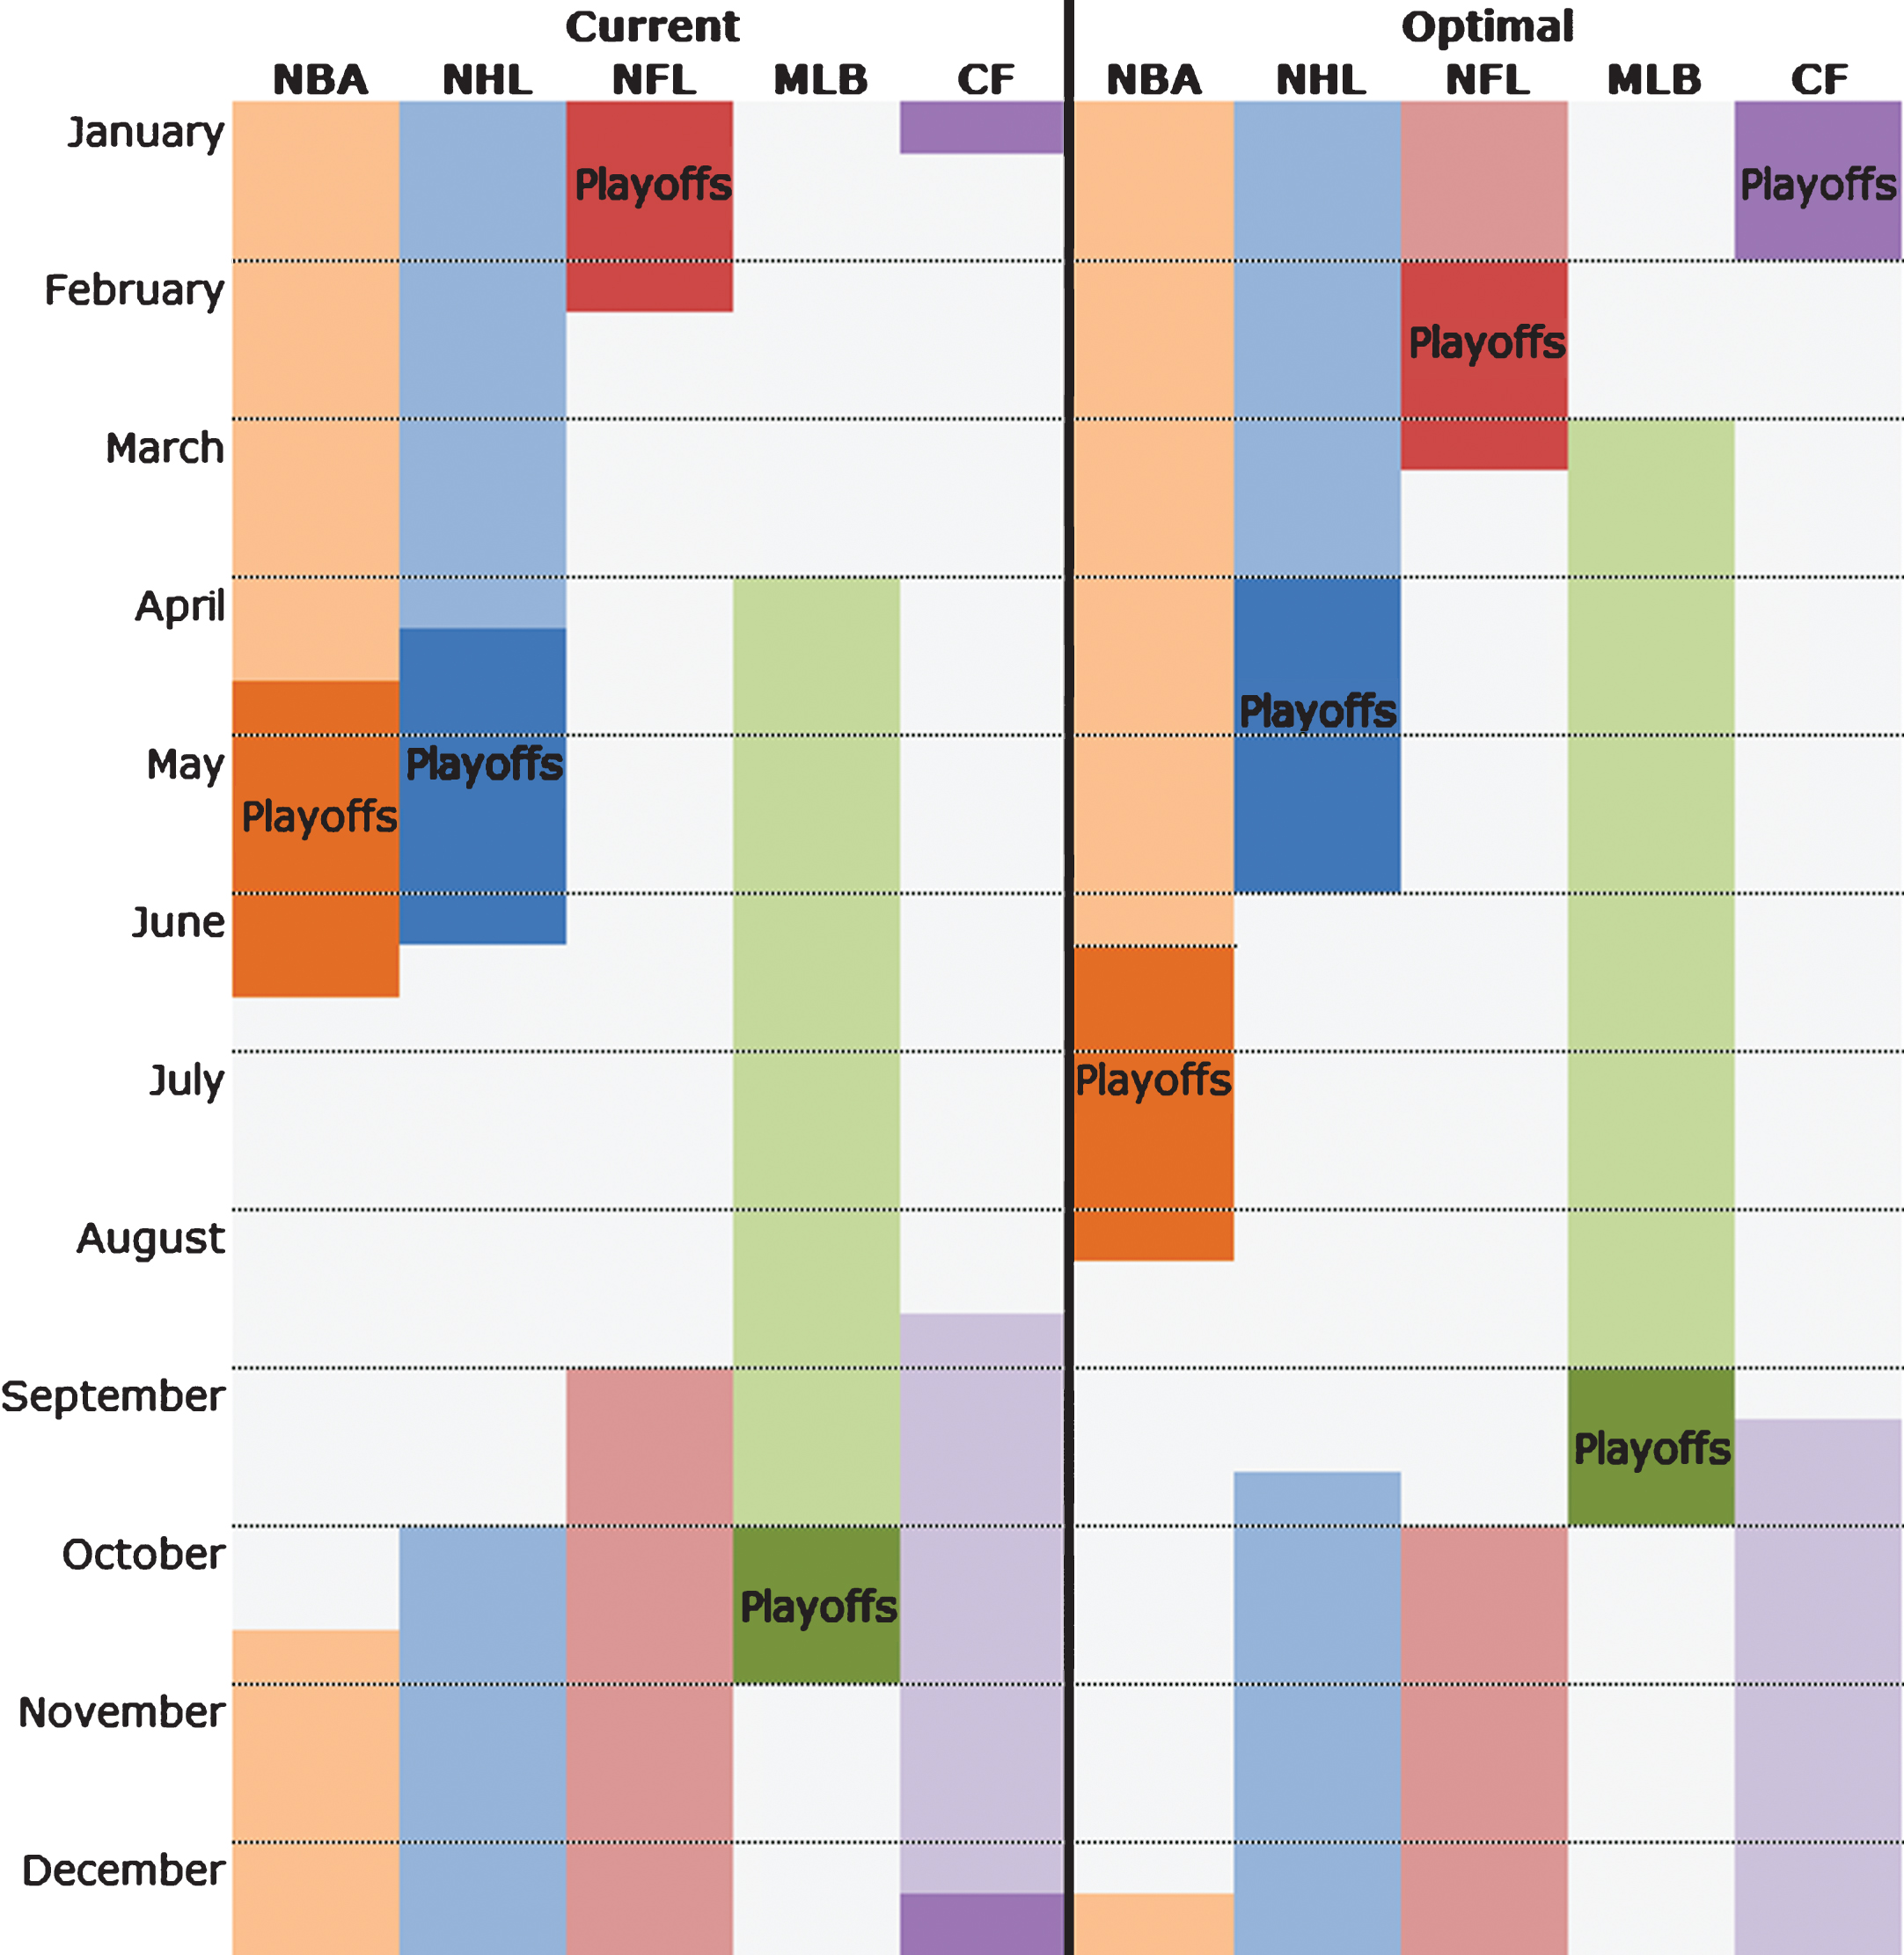
In this improved schedule, we have successfully avoided the most damaging overlaps, shifting the NHL season back two months, the MLB season forward one month, and the NFL season back one month, saving the leagues an estimated $200 million in annual viewership value.
6Conclusions
While this data shows that competition hurts viewership in many instances, there are many reasons to believe it severely underestimates the potential viewership gains to be made by avoiding overlap with other sports.
For one thing, while this analysis does control for many variables, it is not entirely ceteris paribus. It does not account for any ratings benefit a league would garner by securing a monopoly on June-August national media attention. In this hypothetical optimized calendar in which the NHL playoffs move back and solely occupy July and August, hockey would be the lead story nearly every day for two months on every major sports news outlet. One recent study found that the NHL currently only occupies less than 3% of air time on ESPN’s flagship show, SportsCenter, a figure that would surely increase if the NHL playoffs did not have to compete with the NBA playoffs for airtime. This extra attention would likely increase the interest and viewership for subsequent NHL playoff games. This study ignores that additional benefit and simply states how large a boost NHL games would receive in their current April-June slot with everything— media attention, etc.— as the same levels but simply without an NBA playoff game on at the same time.
Secondly, the potential viewers recovered from overlap loss are clearly not as dedicated fans as those immune to competition, and thus more likely to be considered “casual” fans. This is a potentially lucrative market to target, as there is much room for growth in merchandising, ticket sales, etc. among this portion of the customer base.
There is, however, one major issue that could give some hesitation to leagues considering a move to July and August. While these months are largely vacant on the American sports calendar, the FIFA World Cup and Summer Olympics usually occur during this time period and would likely detract viewership from any league that potentially moves games to this part of the year. Those quadrennial events are very popular overseas and would likely do more damage to international audiences— viewership not accounted for in this study— if scheduled opposite NBA or NHL playoff games. However, World Cup and Olympics only occur two out of every four years and only last a month and two weeks respectively, so overlap would not be as large as the NBA and NHL’s two-month playoff overlap that occurs every year. Another concern is that July and August are the months when most American students are out of school, and families often schedule vacations during this time, possibly keeping them away from potential sports watching.
Before declaring any grand schedule shifts, though, it is also worth acknowledging that TV ratings are not everything, and they vary in importance by league, as noted in Fig. 2.
Fig.2
The portion of annual league revenues derived from American national TV rights fees.
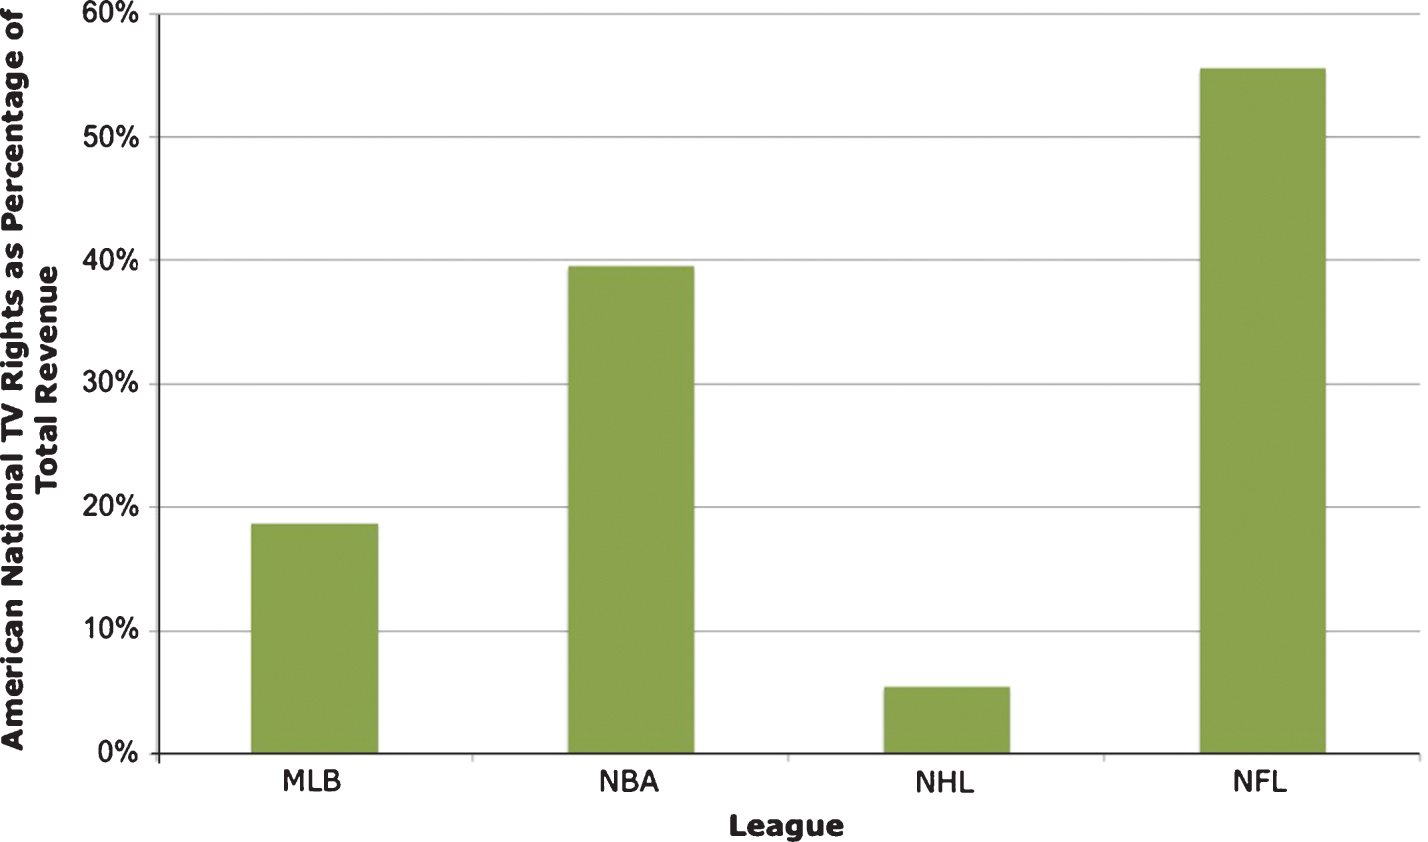
While a ratings boost would certainly help the bottom line in any league, we can see that it would have a much greater effect in the NFL, though as noted above, the NFL does not suffer from very much overlap loss in the first place.
The NHL has a very small portion of its revenues from American national television rights, likely due some extent to losses from overlap competition, but also the league’s poorly timed 2011 national TV contract and large Canadian audience. When factoring in the national TV rights for the league’s recent 12-year, $5.232 billion contract with Canadian cable company Rogers Communications, the portion of NHL revenues that come from national TV deals jumps to 17.1%.
TV revenue is not independent from other revenue sources, though, and a boost in TV ratings would likely have ancillary benefits in ticket sales, merchandising, and other revenue streams. For the NHL, long the fifth-most popular sport in America, it is not too difficult to imagine a two-month July-August window of hockey supremacy in the in the national media spotlight and the even higher ratings that would come with that undivided attention. Of course, the NHL’s Canadian audience is roughly equal to America’s, and the league certainly should not make decisions to solely cater to the audience south of the 49th parallel. Still, 23 of the 30 teams are based stateside, and America remains the league’s most important customer base.
In the four major sports, there are roughly six months of playoffs: NBA (2), NHL (2), NFL (1), and MLB (1). It should not be very complicated to prevent overlap and have postseason games on the calendar for six different, non-overlapping months out of each year. Though there are likely some hidden costs to shifting season calendars, it seems based on current television trends, that this long-term strategic repositioning would be a wise investment for most leagues and would be something that would benefit owners, players, and fans alike.
Supplementary material
[1] The supplementary material is available in the electronic version of this article: 10.3233/JSA-170117.
Acknowledgments
The author would like to thank Michael Lopez, an assistant professor of mathematics at Skidmore University for lending a hand from the earliest days of this project. He would also like to thank Harper Weaver of the blog baseball.systems, for being a frequent resource and Paulsen at Sports Media Watch, for documenting and providing a large portion of the TV ratings data used in this study. Lee Freeman of the University of Michigan and Ryan Rodenberg of Florida State University also provided highly valuable feedback.
References
1 | Anonymous, (2015) , TV By the Numbers. |
2 | Bayless S. , (2013) , Snow joke. ESPN. |
3 | Buraimo B. , Forrest D. , and Simmons R. , (2007) , Outcome uncertainty measures: How closely do they predict a close game? Statistical Thinking in Sports. |
4 | Burns P. , (2013) , What I Learned From A Year Of Watching SportsCenter. Deadspin. |
5 | Condor B. , (2011) , NHL, NBC sign record-setting 10-year TV deal. NHL.com |
6 | Feddersen A. and Rott A. , (2011) , Determinants of demand for televised live football: Features of the German national football team, Journal of Sports Economics. |
7 | Grimshaw S. and Burwell S. , (2014) , Choosing the most popular NFL games in a local TV market, Journal of Quantitative Analysis in Sports. |
8 | Jones A. , (2018) , Outlook for the Sports Market in North America through. PricewaterhouseCoopers LLP. |
9 | Loudenback T. , (2015) , The 10 biggest television events of 2015. Business Insider. |
10 | Mahler J. and Carter B. , (2014) , Series Is On, and Everybody’s Watching … Football. The New York Times. |
11 | Mecloader, (2012) , Stanley Cup Television Ratings down in Canada. Metro News. |
12 | Pagels J. , (2014) , Sports Television Ratings. Github |
13 | Paul R. and Weinbach A. , (2007) , The Uncertainty of Outcome and Scoring Effects on Nielsen Ratings for Monday Night Football, Journal of Economics and Business. |
14 | Paulsen., (2015) , Sports Media Watch. |
15 | R Core Team. R. R Foundation for Statistical Computing. |
16 | Smith M. , (2014) , 34 of America’s 35 Most-watched Fall TV Shows Were NFL games. ProFootballTalk. |


