
When do soccer players peak? A note
Abstract
The peak age for professional soccer players is of significant interest to coaches, managers and executives alike. The evidence so far is predominantly anecdotal and subjective. This paper formally analyzes the peak or optimal age in professional men’s soccer using performance ratings of players in the four major top flight leagues of Europe. WhoScored.com ratings from 2010/11 to 2014/15 are used. The analysis is done for all outfield players, separately by field position. In addition to simple age distribution and bivariate approaches, a player fixed effects model that accounts for potential selection bias is estimated. The results show that the average professional soccer player peaks between the ages of 25 and 27. In the preferred models, the average forward peaks at 25, whereas the typical defender peaks at 27. For midfielders, the estimated peak age varies by model but still occurs in the 25–27 age band. Defenders experience relatively minimal curvature in the age-performance relationship. Further results show that peak age may vary directly with ability.
1Introduction
For several years, the Premier League soccer club Arsenal has had an unofficial policy of offering players over the age of 30 only a one-year contract extension. The policy was largely driven by their astute manager, Arsene Wenger, and his view that by age 30, a soccer player is well past his peak (Kuper and Szymanski, 2009). This view and the contract policy have baffled many of his players. Observers have also pointed out that the policy is partly to blame for a few of the club’s most influential players leaving, at the peak of their powers when nearing 30, looking for better and longer contracts elsewhere. For them, a strict cut-off such as 30 years of age is too rigid. It also ignores evidence – after all, the club and manager have witnessed stellar performances from “over age” players whose services were retained, especially during the early days of the manager’s tenure (for a recent example, see Hytner, 2014).
The club has since softened its stance somewhat (Jackson, 2010; James, 2014). However, at the heart of the discussion here is the question of peak or optimal age: ‘Given a measure of performance, when do professional soccer players in the men’s game typically achieve peak or maximum performance?’ Conventional wisdom has it that the average player peaks in his mid to late 20 s. This is largely based on anecdotal evidence and views of professionals in the game. In his early days at Arsenal, Wenger reportedly held the view that a professional player is finished physically after age 30 (Rees, 2003). More recently he said that the optimum or peak age is between 23 and 30, while admitting that exceptional fitness of the modern player and the value of experience in the modern game imply clubs need to retain a few over 30 players in their squad (James, 2014).
Others have spoken similarly about peak age for soccer players. Alex Ferguson, the legendary former manager of Manchester United, has intimated that players peak in the band of 24 to 28 years of age (Ferguson, 2013). Former and current players generally agree. Paul Scholes, a former player of Alex Ferguson’s, has spoken of the ‘normal’ peak for players occurring at age 28 or 29 (Ducker, 2014). Very recently, Samir Nasri, a current player for Manchester City noted that a midfielder is in his prime at 27–31 or 28 –32 (Jackson, 2014).
Our research could not uncover any systematic, published study that examines peak age in professional soccer. Most of the semi-formal evidence comes in the form of short newspaper articles and blog posts. The World Cup and the role of average squad age in winning it has been fertile ground for discussion. The average age of the 32 teams that participated in the most recent world cup was 27.5 years. The BBC’s Ben Carter notes that this is “historically the perfect age to be a player in the World Cup” since it also happens to be the mean age of the winning teams in the 19 prior World Cups (Carter, 2014). The Economist also analyzed the impact of average age of squad on performance of defending World Cup champions, a relatively homogenous group in terms of overall quality. Although the analysis was not focused on determining peak age per se, it found that a one-year increase in average squad age results in a four-place drop in performance (The Economist, 2014).
Of course a month-long tournament is different from a regular league season that typically spans 10 months and, likely, so are the determinants of performance. Analyzing data on players featuring regularly in seven of the world’s elite clubs, Simon Kuper concluded that the average player enters his peak between the ages of 23 and 25. Attackers tend to peak earlier than defenders but, interestingly, he also argues peak performance can last a while, until about age 31 (Kuper, 2011). This optimal age range of the mid to late 20 s, he notes, matches up well with the range in other sports as well, such as professional basketball, baseball and even tennis. Caley (2013) analyzed minutes played in the Premier League as a proxy for performance and concluded that peak age likely occurs between the ages of 24 and 28, with attacking players likely to peak at 25-26. Using a similar approach, Gleave (2015) labels players into three age categories: Talents (younger than 24), peak age (24–29) and veterans (older than 29).
Alternatively, to the extent that a player’s transfer value is a good proxy for his ability and performance, one way to gauge optimal age is by estimating when transfer market value peaks. Chris Anderson and David Sally, writing on their blog, Soccer by the Numbers, analyzed transfer market value of all players in the Premier League in October 2012 using regression analysis. Their results showed that an inverted-U curve characterizes the relationship between market valuation and age, with peak value occurring at age 26 (Anderson and Sally, 2012).
There are several reasons why, for analysts, the age-performance profile of players may be difficult to map, possibly explaining the dearth of systematic evidence on the issue. As noted by many observers, soccer is the quintessential team game that lacks clear and quantifiable dimensions of individual performance, which are typically present in other sports such as baseball, tennis or even basketball (Anderson and Sally, 2013; Simmons, 2007). In essence, a player’s performance could very much ebb and flow with that of other players on the team, a fact that introduces too many unknowns into the estimation of individual profiles. Second, whereas clubs track data on some measures of physical performance (e.g. speed, stamina, etc.) from training and matches, these data historically have been proprietary, and are typically used to make game-by-game decisions by managers. In recent years match-day data on these and other variables are becoming increasingly available for analysts and the public, but the extent to which they can be aggregated and utilized to measure longer-term performance by players is yet to be seen.
Knowledge of optimal age in soccer is intrinsically valuable from the perspective of performance analysis. However, it also has significant value for the business of soccer. As illustrated above, clubs’ perception of when players peak can affect various personnel decisions, from the kind of contract they offer a player to the fee they are willing to pay (or accept) for a transfer. Player contract is especially important in soccer because, unlike in other sports (e.g. in the National Football League), it is often guaranteed. It is also shown to more closely track, relative to other team sports, a player’s contribution to the team, particularly for a first team player (Simmons and Forrest, 2004; Simmons, 2007). In an industry where the wage to revenue ratio typically pushes the 70% mark – players are a major asset a club possesses – whether a player is ‘on the up’ or ‘over the hill’ is an extremely valuable piece of insight for managers and executives alike.
This paper aims to shed light on the optimal or peak age in professional soccer. For the analysis, it uses performance ratings of players who played in the top four European leagues during the last five seasons, 2010-11 to 2014-15. The ratings come from WhoScored.com, the influential website whose detailed statistics and ratings are widely used by analysts and contributors to various media outlets. The estimation exercise adopts a panel fixed effects model, which utilizes the longitudinal variation in age and performance to determine optimal age. Separate models are estimated for each outfield position (defence, midfield and forward). Additional robustness exercises estimate individualized age-performance curves and test for potential variation in peak age by ability.
The rest of the paper is organized as follows. The next section describes the data. Section 3 presents preliminary estimates of peak age using distributional and bivariate methods. Section 4 discusses the main fixed effects model and results. Further results are presented in Section 5. Section 6 contextualizes the results in the broader literature on age and performance in sports and the final section concludes.
2Data
The data for the study come from the increasingly influential soccer statistics website WhoScored.com. For the top leagues around the world, the site obtains its raw statistics from Opta and presents them in an accessible, publicly available platform. The analysis in this paper employs data from the four major European top flight leagues – the Bungesliga (Germany), Premier League (England), Serie A (Italy) and La Liga (Spain). We use data from the last five seasons, 2010/11 through 2014/15.
The main indicator of performance is players’ WhoScored.com rating. WhoScored.com gives a rating out of 10 points for every player in a match on the basis of each recorded event using a computer algorithm. Here is how WhoScored.com describes the rating system:
“Whoscored.com Ratings are based on a unique, comprehensive statistical algorithm, calculated live during the game. There are over 200 raw statistics included in the calculation of a player’s/team’s rating, weighted according to their influence within the game. Every event of importance is taken into account, with a positive or negative effect on ratings weighted in relation to its area on the pitch and its outcome. An Example: An attempted dribble (event) in the opposition’s final third (area of the pitch) that is successful (outcome) will have a positive effect on a player’s rating.” (www.whoscored.com/Explanations)
According to the ratings scale, a rating of 6.0–6.9 is considered “Average”, whereas 7.0–7.9, 8.0–8.9 and 9 or above are respectively classified as “Good”, “Very Good” and “Excellent”. Ratings of 5.9 or less are labeled “Poor” to “Extremely Poor” depending on the specific value. WhoScored.com states that its ratings are received as “the most accurate, respected and well-known performance indicators in the world of football”, increasingly being used by clubs, the media and bookmakers. While ratings are updated live during a match, the final rating is determined after full time, taking into account match outcomes and any necessary adjustments and corrections in statistics.
The use of an algorithmic rating such as WhoScored.com’s for measuring performance is a strong suit of the paper. First, as noted the rating gives a composite measure of performance, taking into account all contributions, positive and negative, of a player. It can be argued that no other single statistic commonly reported in the sport sufficiently captures overall performance, even for a homogenous group of players. For example, forwards are often assessed by goals and assists, but these statistics miss other important facets of a forward’s contributions, such as link or hold-up play or dribbles into danger areas. Lack of an adequate proxy for performance is even more of an issue for defenders and, particularly, midfielders whose roles are intrinsically multi-faceted. Second, although the weighting of outcomes underlying an algorithm inevitably involves some value judgment, the overall rating itself is objective in the sense that it is applied consistently across players and over time.
More specifically, in this paper we adopt a player’s season-average WhoScored.com rating (WS rating) as the main measure of performance. We prefer average rating because it likely smoothes out fluctuations in performance that occur during the course of a season – due to individual and team form, injury, luck, and various other factors – and thereby gives a truer measure of sustained performance.
Age is measured by player’s age as of January 15, approximately the mid-season mark for a typical league. It is thus measured on a continuous scale. For instance, a player born on October 26, 1984 is 28.2 years of age in the 2012-13 season. In instances where age will be treated as a discrete or categorical variable, the computed age is rounded off to the nearest whole number.
The initial sample consisted of all outfield players in the four leagues who registered positive minutes in any of the five seasons under consideration. The data are stacked in panel form (each player across years). Players are then classified into three groups based on their field position: Forwards, Midfielders and Defenders. We exclude observations (player-year) with less than 270 minutes of total playing time during a season (roughly the equivalent of 3 full games). This is done to minimize potential bias arising from including fringe players who nonetheless receive a rating. For example, a player that is just breaking through sometimes shines – and receives a high rating – with minimal minutes, but it is difficult to assume he would maintain that level of performance over extended playing time over a season. The threshold of 270 minutes provided an acceptable balance between the competing goals of removing outlier observations and minimizing the loss of unduly large number of observations. We also dropped entries when a player is younger than 18 (after rounding off) or older than 38. It is reasonable to assume that those who manage to play sustained minutes in a competitive European league at these ages are outliers.1
After these constructions, the final sample consisted of 7968 observations on 3102 players. The breakdown comprised of 1721 observations in the sample for forwards, 2779 for midfielders and 3468 for defenders. The panel data for each group was unbalanced because not all players had entries for each of the five seasons. Table 1 presents summary statistics on WS rating and age for each group.
3Preliminary evidence
Before we present and estimate a formal statistical model of the age-performance relationship, we begin with two relatively simple methods of identifying peak age: Age distribution and bivariate analyses.
3.1Age distribution
Arguably the most straightforward method of determining age of peak performance is to plot the players’ age distribution and find the modal age. The premise is simple: If most players, including those with marginal ability, play professionally when they are at their highest performance level, then the modal age – the age at which most players participate – also happens to be the peak age.
Figures 1a to 1c present the histogram age distribution for forwards, midfielders and defenders. The modal age for forwards happens at 26. But near peak frequencies – contributions of 8 percent or above – are observed 2 years either side of the peak. There is a substantial drop-off at 29, albeit followed by a slight recovery at 30. Midfielders realize a very similar pattern as forwards – a peak at 26 and near peak frequencies between 24 and 28. The percentage contribution to the age distribution in these years ranges from 8.28 to 10. But the decline in participation after the drop-off at 29 is more uniform for midfielders. Defenders, meanwhile, have their modal age a year later, at 27, and near peak frequencies for a longer period (24–29 years). The decline later on is also visibly more gradual. In sum, based on modal age alone, one can conclude that forwards and midfielders share the same peak age (26) and “peak range” (24–28), whereas defenders peak a year later and perform close to near-peak levels for longer as well.
3.2Bivariate approaches
Bivariate approaches to estimating peak age simply plot a measure of performance against age. Two types of bivariate analysis are employed here. In the first playing time is used to proxy performance. The second uses WS rating.
3.2.1Playing time versus age
The use of playing time as a proxy for performance follows a similar logic. If, at any given time, coaches or managers pick players purely on the basis of performance, then the players who are given the most minutes are the best performers. The age at which the most minutes are registered is thus the peak age.
Figures 2a to 2c plot the ratio of total minutes by age for forwards, midfielders and defenders, respectively. Age is again rounded off to the nearest integer and the ratio for a given age is calculated by dividing the total minutes of players of that age by the total minutes of all players. For example, for 23 year-old forwards, the ratio represents the minutes played by all 23 year-old forwards to total minutes played by all forwards. In addition to the simple plot, the best cubic fit line is also shown.2 In all figures a vertical reference line is inserted at age 25 for easier visualization.
As can be seen from Fig. 2a, the minutes ratio for forwards peaks at age 27. However, near-peak ratios, again conveniently defined as contributions of 8 percent or more, are observed between the ages of 24 and 28. In Fig. 2b, the peak for midfielders happens earlier – at 26 – but they again share the same “peak range” as forwards. Interestingly, the plot for midfielders has a sharper peak, signifying that during the peak years, midfielders are given a relatively higher proportion of playing time than forwards. Finally, defenders realize the literal peak in minutes at 27 years of age while their “peak range” extends from 24 to 29. In sum, except for the later peak age of forwards, the results of the bivariate ‘minutes versus age’ analysis mirror those from the simple/univariate age distribution above.
3.2.2Mean WS rating versus age
Another routinely used method defines peak age as the one when average performance, computed over the available sample, is highest. Accordingly, we calculate mean WS rating by age, for ages 18 to 38. Figures 3a to 3c plot average performance by age for forwards, midfielders and defenders, respectively. When possible, the best quadratic or cubic fit line is also shown.
According to this method, forwards technically peak at age 27 – that is when computed average performance is highest – but they maintain near peak performance roughly from 21 to 30. A cubic function fits the average rating – age relationship best with a highly significant cubic term and R2 of 0.82. The predicted peak age from the cubic fit is 25 years. Midfielders meanwhile hit the literal peak at 29 years, although near peak performance, even when conservatively defined as average WS rating of 6.8 or higher, persists from 24 to 31 years of age. A quadratic polynomial best fits the data for midfielders (R2 = 0.80, insignificant cubic polynomial) and the predicted peak age is also 29. For Defenders, however, the bivariate approach fails to show any discernible pattern of improvement and decline in performance in the normal career years (Fig. 3c). A regression of average performance on age yields statistically insignificant estimates whether in a cubic or quadratic polynomial.
This result, as well as a careful look at the implied average performance of forwards and midfielders during the early and late career years in Figs. 3a and 3b, shows why this approach is sometimes called Naïve (Brander et al., 2014). It suffers from the problem of selection bias. Entry and exit from professional sports is non-random. Very good players start earlier and quit later than average or weak players. This means average computed performances during the early and later career years are biased upward due to the prevalence of players of very high ability in the sample. In turn, this dulls the age-performance curvature – that is, it masks the improvement and decline in performance in the pre- and post-peak years, respectively.
In summary, the age distribution and bivariate approaches, while simple to implement and informative, can in fact lead to biased estimates of the age-performance curve and peak age. Age distribution can be unduly influenced by marginal players that feature in the game at their peak only. Playing time as a proxy strongly rests on the assumption that no other factor plays a role in player selection and minutes played (e.g. it assumes there is no so-called veteran bias). Mean rating, as noted, typically suffers from selection bias.
4Modeling the age-performance relationship: Player fixed effects estimation
An exercise in modeling the age-performance relationship and the estimation of peak age should therefore use an actual measure of performance and also adequately address the problem of potential selection bias. Since selection bias primarily stems from unobservable differences among players, such as differences in [innate] ability, addressing it requires a model that accounts for player heterogeneity.
In this paper we utilize the longitudinal dimension of the data and estimate a panel model of the form:
(1)
A few recent papers investigating the age-performance relationship in professional sports have employed fixed effects panel estimation.4 The attraction of the fixed effects model is that, through the player-specific term, ∝i, it allows each player to have an individualized age-performance trajectory. The estimation exercise can essentially be conceived as a separate model being estimated for each player across seasons – hence commonly known as within-estimation – except using the entire data set.
We present two sets of results based on how the age function, f (Ageit), is modeled. First, as is commonly done in such exercises, age is assumed to be continuous and f () specified as a polynomial. Results from both a cubic polynomial and a quadratic polynomial are presented. Second, age is inserted in the model as a categorical or dummy variable. This approach essentially allows the ‘functional form’ of the age-performance relationship to be determined by the data.
4.1Age polynomials
As noted, we estimate two types of polynomials. A third-degree polynomial of the form:
(2)
(3)
Table 2 presents the results of the fixed effects model with polynomials in age. For forwards and midfielders, the cubic and/or other terms are not well determined when specifying a third-degree polynomial, therefore the focus will be on the quadratic specification. For defenders, the relevant terms are significant in both specifications. For each group, the estimated coefficients have the expected signs – positive linear age and negative squared age – and are highly significant. The peak age, which is computed through the appropriate non-linear transformation of the estimated coefficients, is presented along with a 95% confidence interval.5
The results show that forwards and midfielders peak at 25 years of age. This estimate of peak age is bolstered by a relatively narrow confidence interval for each group. Defenders peak about 1 to 1.5 years later, at 25.7 and 26.5 years, to be precise, in the two specifications. These estimates imply that professional soccer players generally peak at or closer to their mid-20 s (between 25 and 27 when rounding-off), perhaps somewhat earlier than conventional wisdom holds.
Based on the fixed effects estimates, Figs. 4a to 4c plot the predicted age-performance trajectory for the average player – that is, when ∝i = 0. The plots for forwards and midfielders are based on the quadratic specification, hence the symmetry around peak age. The two plots for defenders (Figs. 4c-1 and 4c-2) are based on the cubic and quadratic specifications, respectively. It is easy to note that forwards and midfielders share very similar age-performance profiles. In contrast, defenders generally realize much smaller curvature in performance by age. The ascent towards peak age is relatively similar for all three groups, but the post-peak decline is significantly flatter for defenders. Whereas defenders lose very little in performance even after 30 years of age, forwards and midfielders experience a considerably steeper decline in their 30 s. Accordingly, for the average defender, the range in predicted performance is tighter and the duration of near-peak performance longer. If, for instance, near-peak performance is defined as a rating of 6.8 or above, the average forward performs near the maximum level between 21 and 29 years of age, the average midfielder between 20 and 29, and the average defender between 20 and 33.6.
4.2Age dummy variables
Polynomials such as (2) and (3) are often employed for modeling the age-performance relationship. Here, they also fit the data relatively well.7 However, by imposing a parametric structure, a polynomial constrains the age effect to have a certain, pre-determined form. For example, a quadratic polynomial implies a single peak and symmetry around that peak.
One way of allowing the age effect to be naturally determined by the present data is through the use of age dummy variables. Specifically, we estimate a specification of the form:
(4)
Table 3 presents the regression results. For each group, the constant term predicts the performance of the average 18 year-old. The estimated coefficients measure the difference in performance by an average player of a given age, relative to the average 18 year-old. The sum of the constant term and an estimated age coefficient therefore measures predicted performance at that age. Figures 5a to 5c plot this predicted performance along with 95% confidence intervals.
The results imply that the average forward peaks at 26. But, as can be seen from Fig. 5a, forwards maintain near-peak performance from about 21 to 28 years of age.8 The age-specific coefficients for midfielders are generally not well-determined due to large standard errors, but Fig. 5b shows that the overall trajectory of performance is significant and fits the expected pattern. The trajectory also shows that midfielders seem to perform near maximum levels over a slightly longer period, from about 21 to 29 years. As shown in Fig. 5c, the predicted performance curve is much flatter for defenders even well into their 30 s, confirming the results from the polynomial regressions. Visually, defenders maintain a very high level of performance – less than half the sample standard deviation from peak predicted rating – from about 21 to 32 years of age. More generally, a comparison of the shapes of the age-performance profiles in 5a-5c to those in 4a-4c confirms that, for all three groups of players, the more parsimonious polynomial specifications indeed fit the data well.9
5Further analyses
Individualized age-performance trajectories
In the fixed effects specification in (1), all players in a sample share the same basic age-performance trajectory, f (Ageit). Player-specific trajectories are then obtained through intercept shifts introduced by the player fixed effect and regression error. However, what if players have individualized age-performance trajectories, with varying slopes and peaks? Could it be, for instance, that aging functions vary on the basis of ability – that is, higher ability players peak systematically earlier or later than their lower ability counterparts?
To further examine this, we estimate a model that allows each player to have his own aging trajectory of the general form:
(5)
There are different ways of estimating such a model (see Brander et al., 2014). In this paper, we fit a random-coefficients model on a parsimoniously specified quadratic aging function:
(6)
As can be seen from the notation, the coefficients in the model vary by player. Specifically, a random-coefficients model introduces random effects to the slope and intercept parameters in additive form:
(7)
In this exercise, we again estimate Equation (6) separately for the three groups of players. For each group, we predict the player-specific BLUPs of the random effects, combine them with the estimated fixed components, and construct individualized age-performance trajectories. We then compute peak age for each player based on his fitted trajectory. The distribution of peak ages is analyzed for comparison with the peak age implied by the polynomial fixed effects model in the previous section. Furthermore, we regress individual peak age on a performance proxy to check for the presence of a systematic relationship between ability and peak age.
Figures 6a–c plot the individual fitted trajectories for forwards, midfielders and defenders, respectively, based on the estimated random coefficients model in (6). Due to lack of convergence during maximum likelihood estimation, the results for forwards use the sub-sample of players who have data points for 3 or more seasons (1208 observations from 289 players). No such problem was encountered for midfielders and defenders, whose regressions used the full samples. Comparing Figs. 6a-6c, it is apparent again that, as a group, forward and midfield players face more pronounced curvature in their age-performance trajectories than defenders. Under a watchful eye, it also appears that the denser concentration of fitted trajectories and peak performances occur progressively to the right as one moves from Figs. 6a to 6c, implying, as a group, forwards seem to have their best years earlier than midfielders and defenders.10
To be more precise with such statements, the peak age is computed for each player based on his fitted individual age-performance trajectory. Table 4a presents important summary statistics on the estimated peak ages, whereas Figs. 6d-6f show the full histogram distribution for the three groups (along with the estimated kernel density). It is clear from the results that indeed forwards as a group peak relatively early. The middle two quartiles of the peak age distribution are bounded by 25.1 and 25.4 years, with the mean (and median) peak age occurring at 25.3 years. In fact, Fig. 6d shows that more than 80% of the estimated peak ages for forwards are between 25 and 25.5 years. According to the results in Table 4a, the mean (and median) peak ages for midfielders and defenders are comparable, although the distribution is noticeably tighter for midfielders than defenders. For instance, the standard deviation of peak age for defenders is more than three times that of midfielders. A comparison of Figs. 6e and 6f makes this visually apparent – the peak age distribution for defenders not only exhibits a wider range, it also sits slightly to the right on the age scale relative to the one for midfielders.
For forwards and defenders, the mean (or median) peak age computed from the individualized trajectories here is comparable to the estimated peak age from the polynomial fixed effects regressions in Table 2. In both models, forward players peak around 25 years of age, whereas defenders peak around 27 years. For midfielders though, the estimated peak ages do not match up well – the fixed effects model implies a peak age that is roughly 1.5 to 2 years younger than the average peak from the individual fitted trajectories. The discrepancy suggests that midfield players are perhaps a more heterogenous group and the assumption that they share the same basic age-performance trajectory is probably too strong.11
As noted earlier, the final exercise in this section checks for the presence of a systematic relationship between ability and age of peak performance. To check this simply, the peak age estimated from the individualized age-performance trajectory is regressed on a measure of player ability. We use two proxies for player ability – average WS rating and maximum WS rating – and separate regressions are run using the two measures. The results, which are presented in Table 4b, strongly imply that better players indeed peak later in their playing career. For example, a forward player whose average rating is 0.4 points higher – the equivalent of one standard deviation in rating for the full sample of forwards – peaks about a quarter year later. A similar computation for midfielders yields a comparable increase in peak age. The implied effect for defenders is quite substantial though – the equivalent of a full-sample unit standard deviation rise in the average rating of a defender pushes back his peak age by more than a year.
6Discussion
Put simply, the principal implication of the analyses so far is that professional soccer players peak around their mid-20 s – more precisely, between 25 and 27 years of age, depending on playing position. This is perhaps earlier than what conventional soccer wisdom holds. But is it broadly consistent with the peak age identified for other sports that require similar physical skills and dexterity as soccer? The answer, largely, is yes.
In a seminal study, Schulz and Curnow (1988) analyzed historical data from multiple sports to determine peak performance. Their analyses showed that athletic events that demand strength, speed, explosive power, quick reaction and body coordination tend to experience peak performances in the early 20 s. Swimming, sprinting and tennis belong to this category. Those events that rely on endurance and more complex motor and acquired skills, such as baseball and golf, tend to peak in the late 20 s. Interestingly, they also find that although peak performance in most events improved dramatically during the course of the 20th century, the age of peak performance has largely held steady. This, they argue, is evidence that physiological constraints primarily dictate the window for optimal performance.
Other studies have since corroborated the general conclusions of Schulz and Curnow (1988) in the context of various sports. For instance, peak performance in baseball is generally thought to be achieved between the ages of 27 and 30, although peak age varies widely between specific tasks of the game (Schulz et al., 1994; Fair, 2008; and Bradbury, 2009, among others). The peak age in ice hockey, among the most physically demanding of all sports, occurs between 27 and 29 years depending on playing position (Berry, et al., 1999; Brander et al., 2014). Berry et al. (1999) noted that this is somewhat earlier than home run hitters in baseball (29 years) and considerably earlier than golfers (around 34 years; see also Tiruneh, 2010). Track and field performance peaks between 23 and 28 years depending on the specific event (Hollings et al., 2014). Runners and jumpers, for example, peak around 25 years of age whereas throwers peak later, around 26 to 28 years. A recent study on tennis indicated that the age of peak performance has probably edged up over time, perhaps owing to the increasing importance of stamina in the modern game (Kovalchik, 2014).
In a recent paper, Allen and Hopkins (2015) provided a systematic review of estimates of age of peak performance of elite athletes in the twenty-first century. They classify events into three types – explosive power/sprint, endurance, and mixed/skill – and summarize their findings by relating peak age to event duration. In explosive events, such as sprints and 50–100 m swimming, the peak age ranges from 20 to 27 years, but it invariably decreases with event duration (i.e. longer duration explosive events realize younger peak age). For endurance events, such middle- and long/ultra-distance running and cycling, the range for peak age is considerably wider, but it linearly increases with event duration. There was no specific pattern for mixed-skillevents.
The physical and physiological demands of elite soccer would make it a quintessential mixed-skill event a la ice hockey and tennis. On the one hand, the game requires extraordinary endurance – outfield players run 6-7 miles in a game at an average intensity close to the anaerobic threshold, defined as 80–90% of the maximal heart rate (Stolen et al., 2005). This endurance aspect of the game presumably pushes the age of peak performance to the upper 20 s. On the other hand, within the endurance context, strength and explosive power are equally essential. Force generated by the neuromuscular system, speed and acceleration routinely combine to produce the maximum power that is needed to undertake the numerous bursts of explosive activity. These include sprinting, high-intensity running, tackling, jumping, cutting, dueling and so on.12 According to the evidence cited above, performance in these types of predominantly strength and power events peaks in the early 20 s. Therefore, the peak window of mid-20 s estimated in this paper is perhaps explained by the unique combination of endurance and explosive power that is necessary to perform at the highest levels of thegame.
Moreover, the other important finding of the paper – that forwards peak probably earlier than midfielders and certainly earlier than defenders – is also largely explainable by the physical demands of playing each position. Time-motion analysis in elite soccer has shown that forwards undertake the most maximal sprints and for longer durations, ahead of midfielders and defenders (Bloomfield et al., 2007 and sources cited therein). Using data from the Premier League, Bloomfield et al. (2007) confirm that defenders spend the least amount of time sprinting and running, whereas midfielders run the most and shuffle the least. Forwards, on the other hand, perform significantly higher amount of shuffling, endure the most physical contact at high intensity, and generally undertake more high to very high intensity activity relative to players in the other two positions. These findings suggest that, for forwards, the explosive/power elements of the game probably predominate the endurance component.
Put another way, the results confirm the conventional wisdom that the physical demands placed on defenders are perhaps less strenuous. Because of this, defence is probably the one position where acquired learning and experience can be most utilized to compensate age-induced deterioration in physical performance. Schulz et al. (1994) noted that among the three interrelated factors that determine performance – physiological capacity, experience and motivation – only experience continues to rise over time, albeit with diminishing marginal gains. Motivation of elite athletes is assumed to remain more or less constant, while physiological capacity declines after the well-known threshold age of 30 (Gabbard, 2004). In athletic endeavors, they conclude, typically physiological capacity eventually overrides experience. However, one would expect that the lesser the physical demands, in relative terms, the better the chances of slowing down this overriding process. This is presumably why defenders tend to peak later but also maintain near-peak performance over a wider range, sometime well into their 30 s. The fruits of experience – such as game knowledge, anticipation and tactical awareness – can be brought to the fore to minimize the effects of physical decline.
Alex Ferguson’s advice to Rio Ferdinand, one of the most physically and technically gifted central defenders of his era, encapsulates this:
“In his autumn years I had to tell him to change his game to take account of age and what it does to all of us. The years catch up with you. I told him, publicly and privately, that he needed to step back a yard or two to give himself a chance against strikers. Five years previously it had been lollipop stuff. With his change of pace he’d rob a center-forward just when the striker thought he was in business. He could no longer do that. He needed to be on the scene before the crime could happen.” (Ferguson, 2013:85)
In fact, his advice encapsulates the theme of this paper.
7Conclusion
Modern professional soccer players are finely tuned athletes that perform at a very high level physically. They do so despite an increasingly demanding and crowded calendar of competitions and games. Part of the credit for this goes to clubs, who over the years have invested considerably in sports science support infrastructure – from modern training facilities, to fitness and diet professionals, to performance analytics capabilities – to monitor, elevate and sustain player performance (Anderson and Sally, 2013; Williams, 2013).
But even with state-of-the-art fitness regimen, nature will surely have its say on the limits of player performance. This paper has examined one aspect of this, namely the optimal age for performance. The results show that the average player peaks between ages 25 and 27. This represents perhaps a younger and narrower age band than the widely considered peak age of mid to late 20 s. But in line with conventional wisdom, forwards peak earlier than defenders. They most likely peak earlier than midfielders as well, although in one model the two groups are found to peak around the same age (25 years).
The results in the paper are useful in terms of informing our expectations about when soccer players are likely to perform at the maximum level. By implication, they also inform us about when they are likely to be most valuable in the marketplace. Two caveats are in order, however. First, the results largely pertain to the ‘average’ player. Players vary in physical and other ability and only individualized assessment can inform us when a specific player is likely to perform optimally (Strudwick, 2013).13 Second, as already noted in the paper, soccer remains the prototypical team game, and the extent to which a player can express his ability, physical or otherwise, still largely depends on the players surrounding him, in addition to numerous other factors.
Notes
1 270 minutes represents roughly the 26th, 24th and 14th percentiles, respectively, in the minutes distribution of the original sample of forwards, midfielders and defenders. The age restriction then ruled out only 9 player-year observations –6 defenders and 3 midfielders.
2 For each group, two regressions were estimated: The ratio of minutes on a quadratic and a cubic polynomial of age and, when feasible, the better fit of the two is chosen. Better fit was determined by the significance of the cubic term and goodness-of-fit measures. For all three groups, the cubic specification was found to be the better fit.
3 Relative to other disciplines, fixed effects panel data model is the workhorse of applied economic research.
4 These include Fair (2008) in baseball and Brander et al. (2014) in ice hockey. Bradbury (2009) also analyzes baseball but employs a random effects estimator. Other applications of fixed effects estimation in sports include Arkes (2010), who tests the hot hand theory in basketball, and Broadie and Rendleman Jr. (2013), who examine world rankings in golf.
5 Computing peak age is akin to finding the root/s of the derivative of the estimated function. Under the cubic specification (2), the roots are given by:
6 In general, absence of an acutely steep pre- and post-peak gradient in the age-performance curvature and, consequently, the presence of a prolonged period of near-maximum performance by elite athletes is well documented in the literature (see for instance Berry et al., 1999 for baseball and golf; Bradbury, 2009 for baseball; Brander et al., 2014 for hockey). The long duration of near-peak performance predicted here for soccer players is in line with the observations of Arsene Wenger (James, 2014) and Kuper (2011)
7 The appendix presents the top 25 players in each position according to the estimated player-specific effect,
8 A statistical test of age-by-age difference in performance confirms this.
9 Despite its supposed flexibility, the dummy variable specification is generally associated with statistical ‘roughness’ in the estimation of age-specific coefficients, which renders precise or literal interpretation of the results difficult (see Albert, 1999; Furnald, 2012; Brander et al., 2014).
10 For the initiated and curious, the two fitted lines at the top of Figure 6a, seemingly in a universe of their own, belong to Messi and Ronaldo. Messi is on top.
11 As noted by a reviewer, one reason for this could be the varying demands of playing in different areas/positions in midfield.
12 Stolen et al. (2005) provide estimates of the number and duration of these various activities in a typical game.
13 It goes without saying that this is why clubs do extensive scouting and monitoring of potential buys and current players.
Appendices
Appendix
Top players by estimated player fixed effect
| Forwards | Midfielders | Defenders | ||||
| EFE | EFE | EFE | ||||
| 1 | Lionel Messi | 1.855 | Franck Ribery | 1.281 | Giorgio Chiellini | 0.662 |
| 2 | Cristiano Ronaldo | 1.468 | Arjen Robben | 1.082 | Naldo | 0.620 |
| 3 | Francesco Totti | 1.170 | Andrea Pirlo | 1.061 | Ricardo Rodriguez | 0.607 |
| 4 | Antonio Di Natale | 0.941 | Steven Gerrard | 0.785 | Dani Alves | 0.574 |
| 5 | Luis Suarez | 0.913 | Paul Scholes | 0.769 | Mats Hummels | 0.569 |
| 6 | Kevin De Bruyne | 0.876 | Gareth Bale | 0.740 | Hugo Campagnaro | 0.567 |
| 7 | Marco Reus | 0.798 | Massimo Ambrosini | 0.728 | Mehdi Benatia | 0.512 |
| 8 | Mario Gotze | 0.797 | Xavi | 0.724 | Emir Spahic | 0.506 |
| 9 | Claudio Pizarro | 0.765 | Eden Hazard | 0.722 | Mario Yepes | 0.488 |
| 10 | Stefan Kiesling | 0.683 | Juan Arango | 0.714 | Javi Martinez | 0.485 |
| 11 | Robin van Persie | 0.680 | Paul Pogba | 0.708 | Nemanja Vidic | 0.481 |
| 12 | Miroslav Klose | 0.665 | Santi Cazorla | 0.689 | Sergio Ramos | 0.473 |
| 13 | Roberto Firmino | 0.662 | Daniele Conti | 0.676 | Martin Stranzl | 0.472 |
| 14 | Carlos Tevez | 0.656 | Xabi Alonso | 0.672 | Daniel Carvajal | 0.469 |
| 15 | Alexis Sanchez | 0.624 | Arturo Vidal | 0.668 | Marcelo | 0.442 |
| 16 | David Di Michele | 0.611 | Frank Lampard | 0.655 | Kyriakos Papadopoulos | 0.430 |
| 17 | Luca Toni | 0.609 | Mark van Bommel | 0.651 | Santiago Garcia | 0.404 |
| 18 | Robert Lewandowski | 0.606 | Marti | 0.611 | Patrice Evra | 0.399 |
| 19 | Jefferson Farfan | 0.604 | Bastian Schweinsteiger | 0.592 | David Alaba | 0.393 |
| 20 | Raffael | 0.603 | Gabi | 0.588 | Giuseppe Biava | 0.388 |
| 21 | Didier Drogba | 0.601 | Bruno | 0.573 | Daniel van Buyten | 0.385 |
| 22 | Wayne Rooney | 0.597 | Francisco Punal | 0.566 | Gael Clichy | 0.383 |
| 23 | Samuel Eto’o | 0.576 | David Pizarro | 0.564 | Nicola Legrottaglie | 0.367 |
| 24 | Sergio Aguero | 0.557 | Tiago | 0.561 | Zdenek Pospech | 0.360 |
| 25 | Fabrizio Miccoli | 0.546 | Yaya Toure | 0.549 | Juanfran | 0.358 |
Note: For forwards and midfielders, the estimated fixed effect (EFE) is from the quadratic polynomial; for defenders it is from the cubic polynomial. See Table 2. The ranking shows the top 25 players, by position, who had at least 3 data points in the estimation sample. Notable omissions are Zlatan Ibrahimovic (EFE = 1.110) and Neymar (EFE = 0.869), each with ratings for two seasons only (the former had moved to the French League and the latter joined Barcelona in 2013/14). With their EFEs, they ranked 4th and 8th, respectively, in the forwards list.
Acknowledgments
I thank Eugene Shen, the editor, and three anonymous reviewers for many insightful comments that improved the paper considerably. I also thank Adey Kefenie for encouraging me to write about soccer. Any errors are mine.
References
1 | Albert J. , (1999) . Bridging different eras in sports: Comment. Journal of the American Statistical Association, 94: (447), 677–680. |
2 | Allen S.V. , and Hopkins W.G. (2015) . Age of peak competitive performance of elite athletes: A systematic review. Sports Medicine, 45: (10), 1431–1441. |
3 | Anderson C. , and Sally D. (2012) . Age and the inverted-U: Player age and transfer market valuations, Soccer by the Numbers, 6 December.http://www.soccerbythenumbers.com/2012/12/age-and-inverted-u-player-age-and.html. |
4 | Anderson C. , and Sally D. (2013) . The Numbers Game: Why Everything You Know about Soccer is Wrong. Penguin, New York. |
5 | Arkes J. (2010) . Revisiting the hot hand theory with free throw data in a multivariate framework. Journal of Quantitative Analysis in Sports, 6: (1), 1–12. |
6 | Berry S.M. , Reese C.S. , and Larkey P.D. (1999) . Bridging different eras in sports. Journal of the American Statistical Association, 94: (447), 661–676. |
7 | Bloomfield J. , Polman R. , and O’Donoghue P. (2007) . Physical demands of different positions in FA Premier League soccer. Journal of Sports Science and Medicine, 6: (1), 63–70. |
8 | Bradbury J.C. (2009) . Peak athletic performance and ageing: Evidence from baseball. Journal of Sports Sciences, 27: (6), 599–610. |
9 | Brander J.A. , Egan E.J. , and Yeung L. (2014) . Estimating the effects of age on NHL player performance. Journal of Quantitative Analysis in Sports, 10: (2), 241–259. |
10 | Broadie M. , and Rendleman R.J. Jr. (2013) . Are the official world golf rankings biased? Journal of Quantitative Analysis in Sports, 9: (2), 127–40. |
11 | Caley M. (2013) . The football aging curve. SB Nation Cartilage Free Captain, 9 December. http://cartilagefreecaptain.sbnation.com/2013/12/9/5191634/the-football-aging-curve. |
12 | Carter B. (2014) . When do footballers reach their peak? BBC.com, 10 July. http://www.bbc.com/news/magazine-28254123. |
13 | Ducker J. , (2014) . Wayne Rooney could be past his peak already, Paul Scholes believes, Times, 22 May. http://www.thetimes.co.uk/tto/sport/football/clubs/manchesterunited/article4097035.ece. |
14 | Fair R. , (2008) . Estimated age effects in baseball. Journal of Quantitative Analysis in Sports, 4: (1), 1–39. |
15 | Ferguson A. , (2013) . Alex Ferguson: My Autobiography. Hodder and Stoughton, London. |
16 | Furnald N.A. , (2012) . The impact of age on baseball players’ performance. Unpublished manuscript, Colgate University. |
17 | Gabbard C. , (2004) . Lifelong Motor Development. Benjamin Cummings: San Francisco, CA. |
18 | Gleave S. , (2015) . Analyse This: The ageing game. Infostrada live, 15 February. http://infostradalive.com/2015/02/15/analyse-this-the-ageing-game/. |
19 | Hollings S.C. , Hopkins W.G. , and Hume P.A. , (2014) . Age at peak performance of successful track & field athletes. International Journal of Sports Sciences & Coaching, 9: (4), 651–662. |
20 | Hytner D. , (2014) . Arsenal’s Mikel Arteta criticizes Arsène Wenger’s age-related contracts, Guardian, May. http://www.theguardian.com/football/2014/may/15/arsenal-mikel-arteta-arsene-wenger-contracts. |
21 | Jackson J. , (2010) . Arsène Wenger relaxes his ‘over-s rule’ to sign Sebastien Squillaci, Guardian, 26 August, http://www.theguardian.com/football/2010/aug/26/arsene-wenger-sebastien-squillaci-arsenal. |
22 | Jackson J. , (2014) . Manchester City’s players’ future rests on Champions League – Samir Nasri, Guardian, 24 November. http://www.theguardian.com/football/2014/nov/24/manchester-city-future-champions-league-qualification-samir-nasri. |
23 | James J. , (2014) . Football is like a fast train, Arsenal.com, 1 April. http://www.arsenal.com/news/features/20140325/-football-is-like-a-fast-train-. |
24 | Kovalchik S.A. , (2014) . The older they rise the younger they fall: Age and performance trends in men’s professional tennis from 1991 to 2012. Journal of Quantitative Analysis in Sports, 10: (2), 99–107. |
25 | Kuper S. , (2011) . The optimal age to be an athlete, Askmen.com. http://www.askmen.com/sports/fanatic_300/325_the-best-age-for-athletes.html. |
26 | Kuper S. , and Szymanski S. , (2009) . Soccernomics. Nation Books, New York. |
27 | Rees J. , (2003) . I’ve never seen a player lose it with Arsène, Guardian, 18 August. http://www.theguardian.com/football/2003/aug/19/sport.biography. |
28 | Schulz R. , and Curnow C. , (1988) . Peak performance and age among superathletes: Track and field, swimming, baseball, tennis, and golf. Journal of Gerontology, 43: (5), 113–120. |
29 | Schulz R. , Musa D. , Staszewski J. , and Siegler R.S. , (1994) . The relationship between age and Major League Baseball performance: Implications for Development. Psychology and Aging, 9: (2), 274–286. |
30 | Simmons R. , (2007) . Overpaid athletes: Comparing American and European football. WorkingUSA: The Journal of Labor and Society, 457–471. |
31 | Simmons R. , and Forrest D. , (2004) . Buying success: Relationships between team performance and wage bills in the US and European Sports leagues. In Fort R. , and Fizel J. , (eds.), International Sports Economics Comparisons, 123–40 Westport: Praeger, pp. 123–40. |
32 | Stolen T. , Chamari K. , Castagna C. , and Wisloff U. , (2005) . Physiology of soccer: An update. Sports Medicine, 35: (6), 501–536. |
33 | Strudwick A.J. , (2013) . Contemporary issues in the physical preparation of elite players. In. Williams M.A. , (ed.), Science and Soccer: Developing Elite Performers (3rd Edition), Routledge, pp. 335–356. |
34 | The Economist, (2014) . Player age in football: The clock is ticking, 4 July. http://www.economist.com/blogs/gametheory/2014/07/player-age-football. |
35 | Tiruneh G. , (2010) . Age and winning professional golf tournaments. Journal of Quantitative Analysis in Sports, 6: (1), 1–16. |
36 | Williams M.A. (ed.). (2013) . Science and Soccer: Developing Elite Performers. Third Edition, Routledge, London and New York. |
Figures and Tables
Fig.1
a. Age distribution – Forwards. b. Age distribution – Midfielders. c. Age distribution – Defenders.
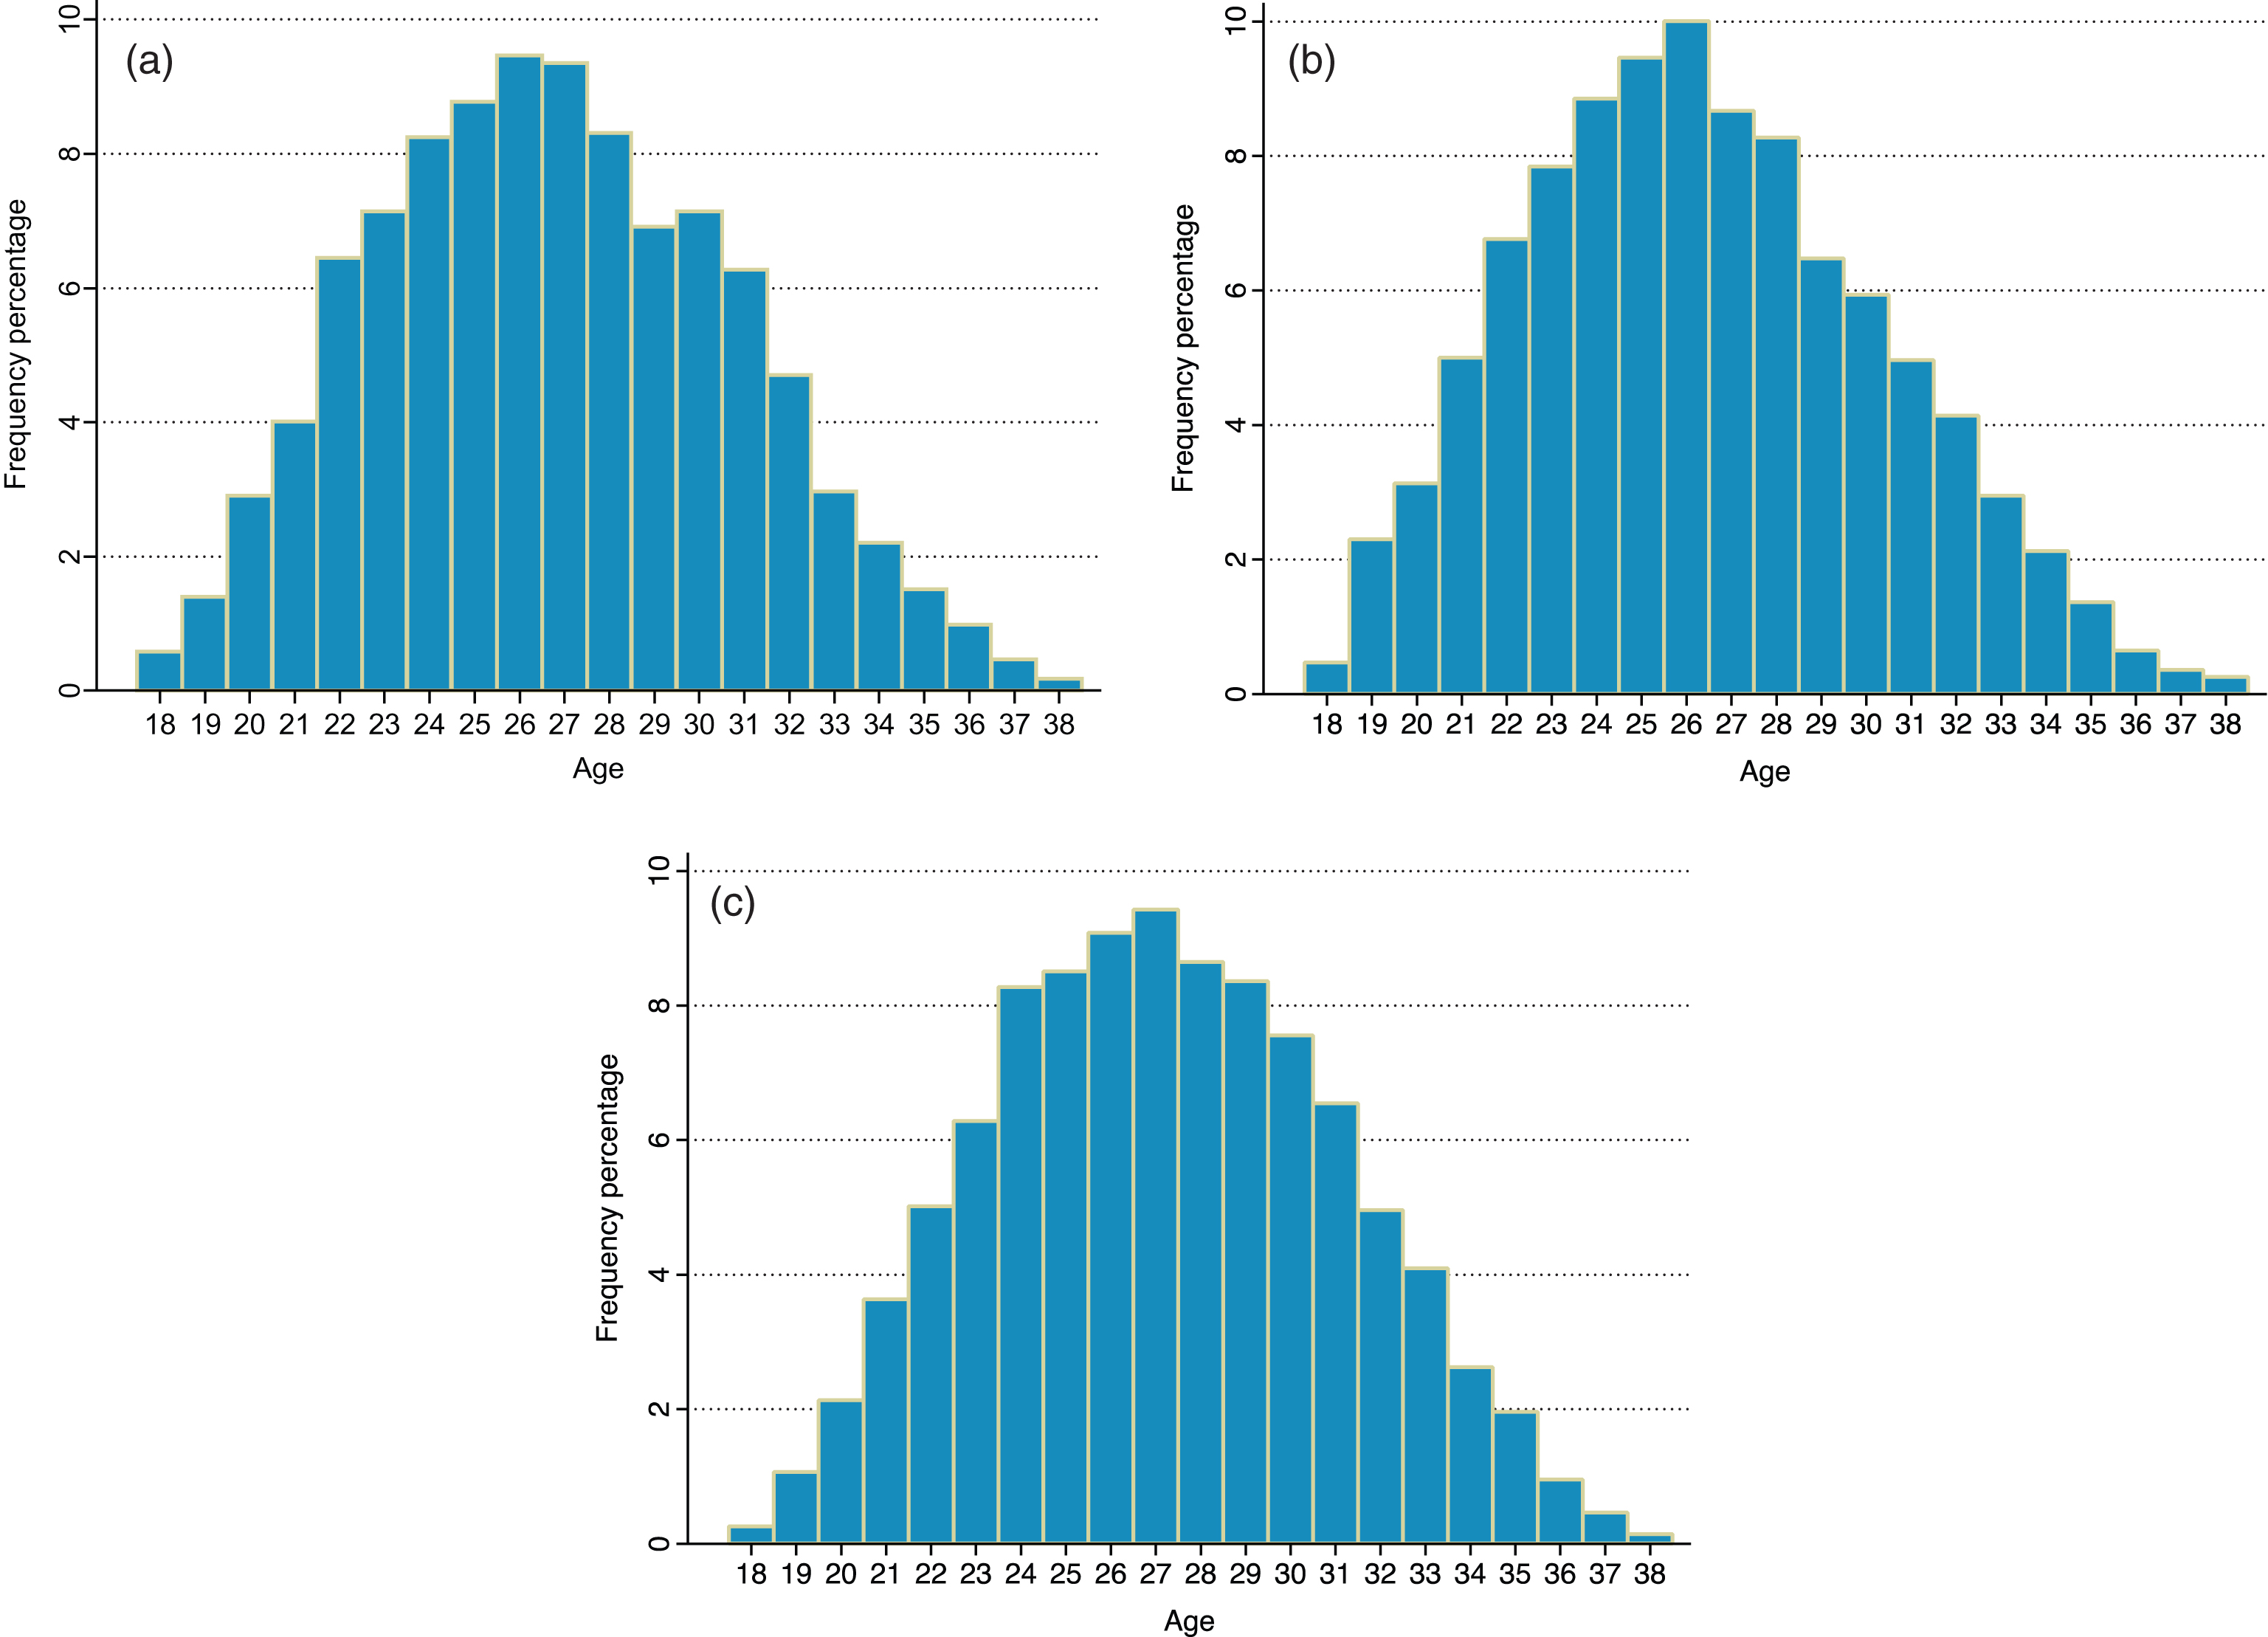
Fig.2
a. Playing time by age – Forwards. b. Playing time by age – Midfielders. c. Playing time by age – Defenders.
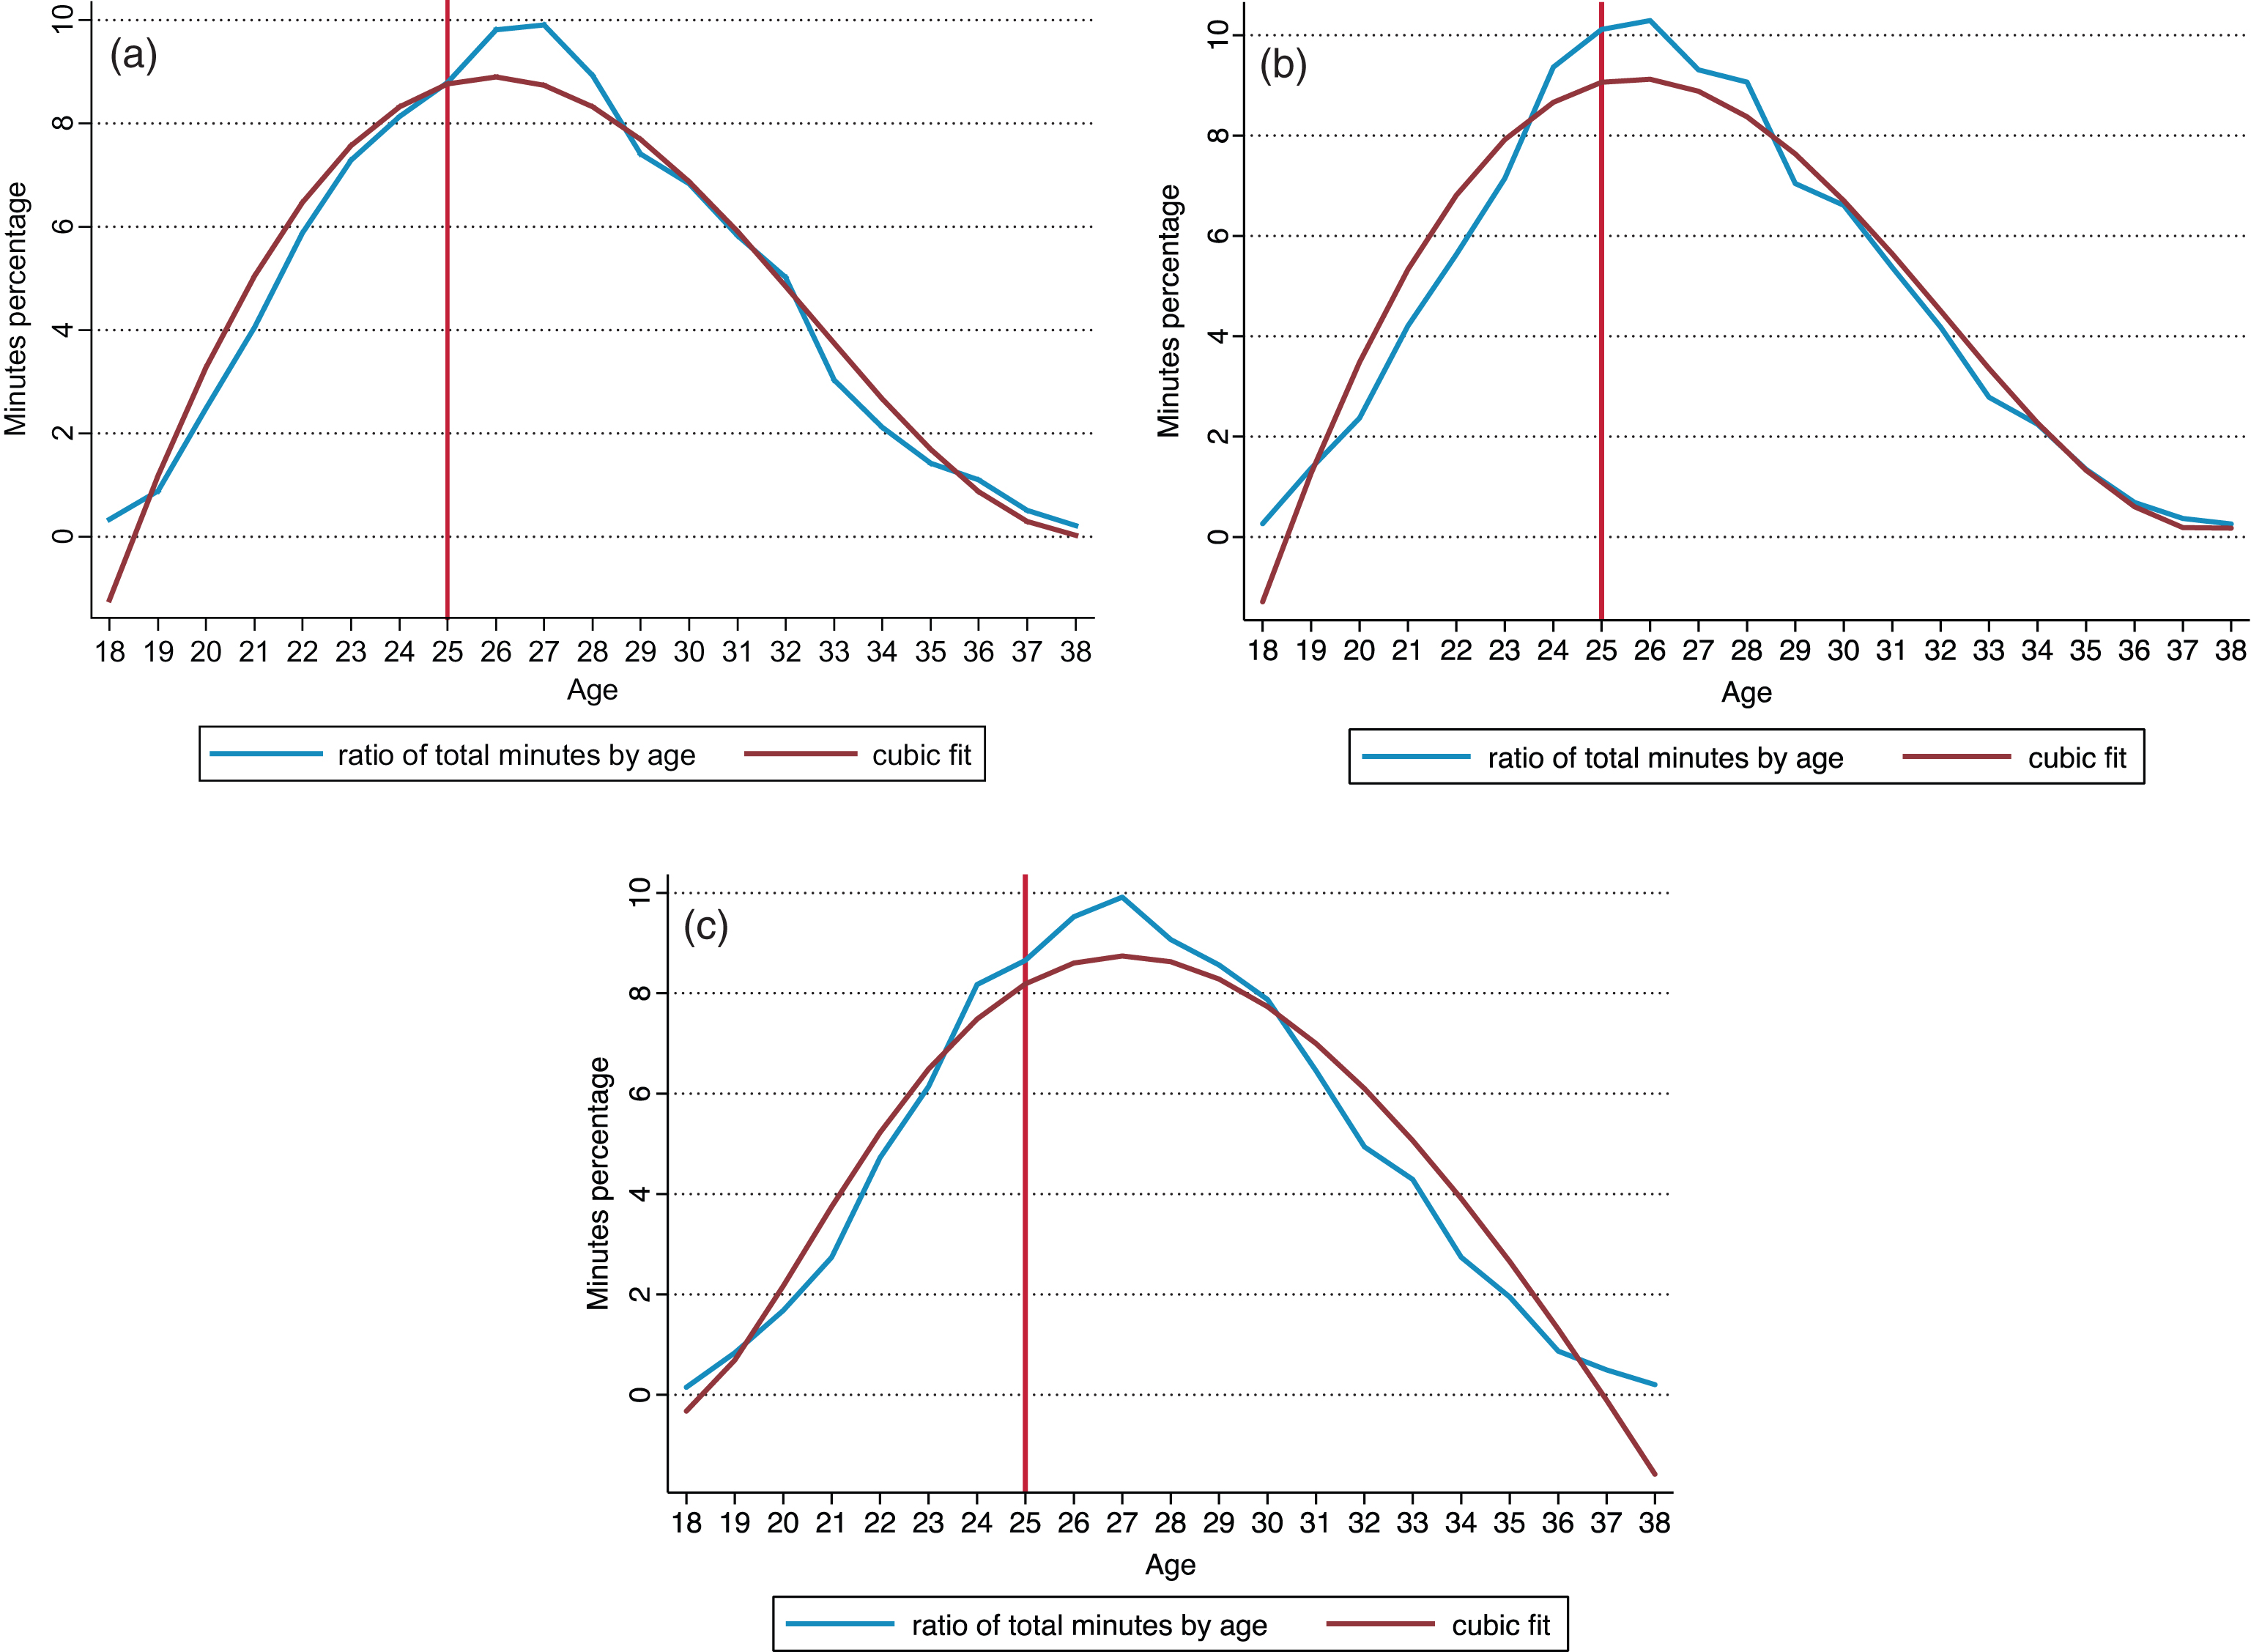
Fig.3
a. Mean performance by age – Forwards. b. Mean performance by age – Midfielders. c. Mean performance by age – Defenders.
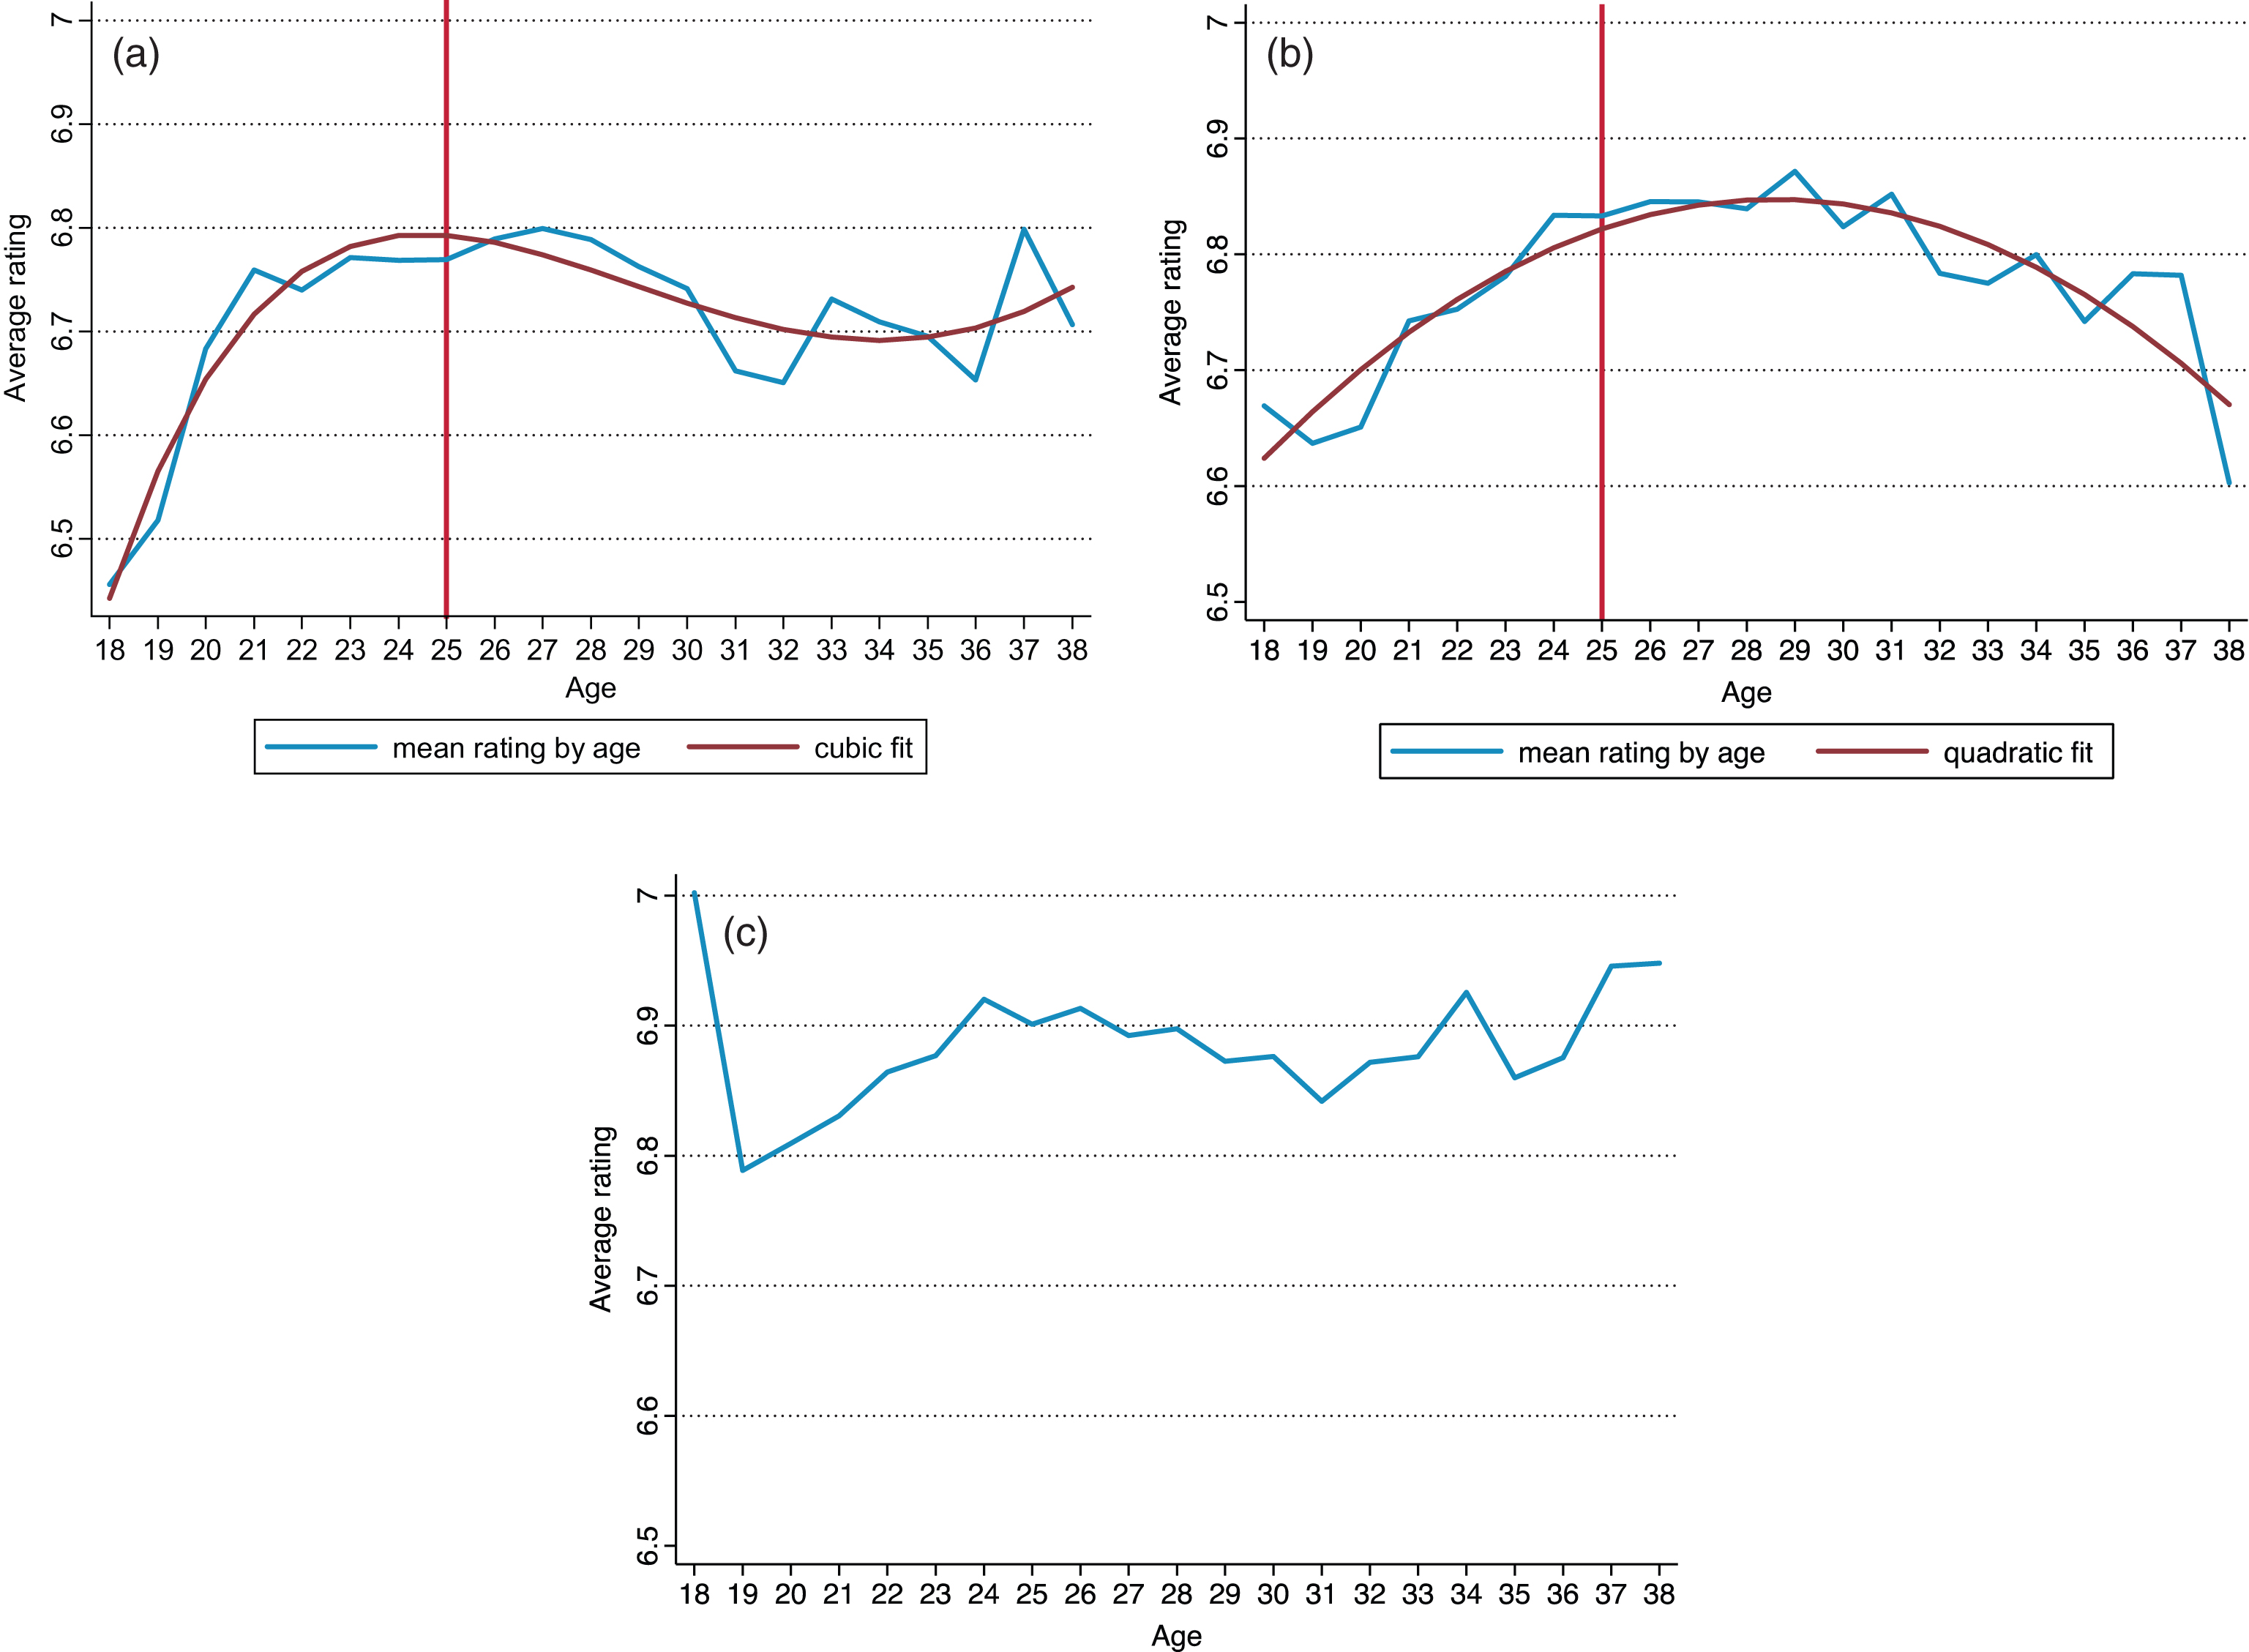
Fig.4
a. Age and performance: Fixed effects regression fit, quadratic specification – Forwards. b. Age and performance: Fixed effects regression fit, quadratic specification – Midfielders. c-1. Age and performance: Fixed effects regression fit, cubic specification – Defenders. c-2. Age and performance: Fixed effects regression fit, quadratic specification – Defenders.
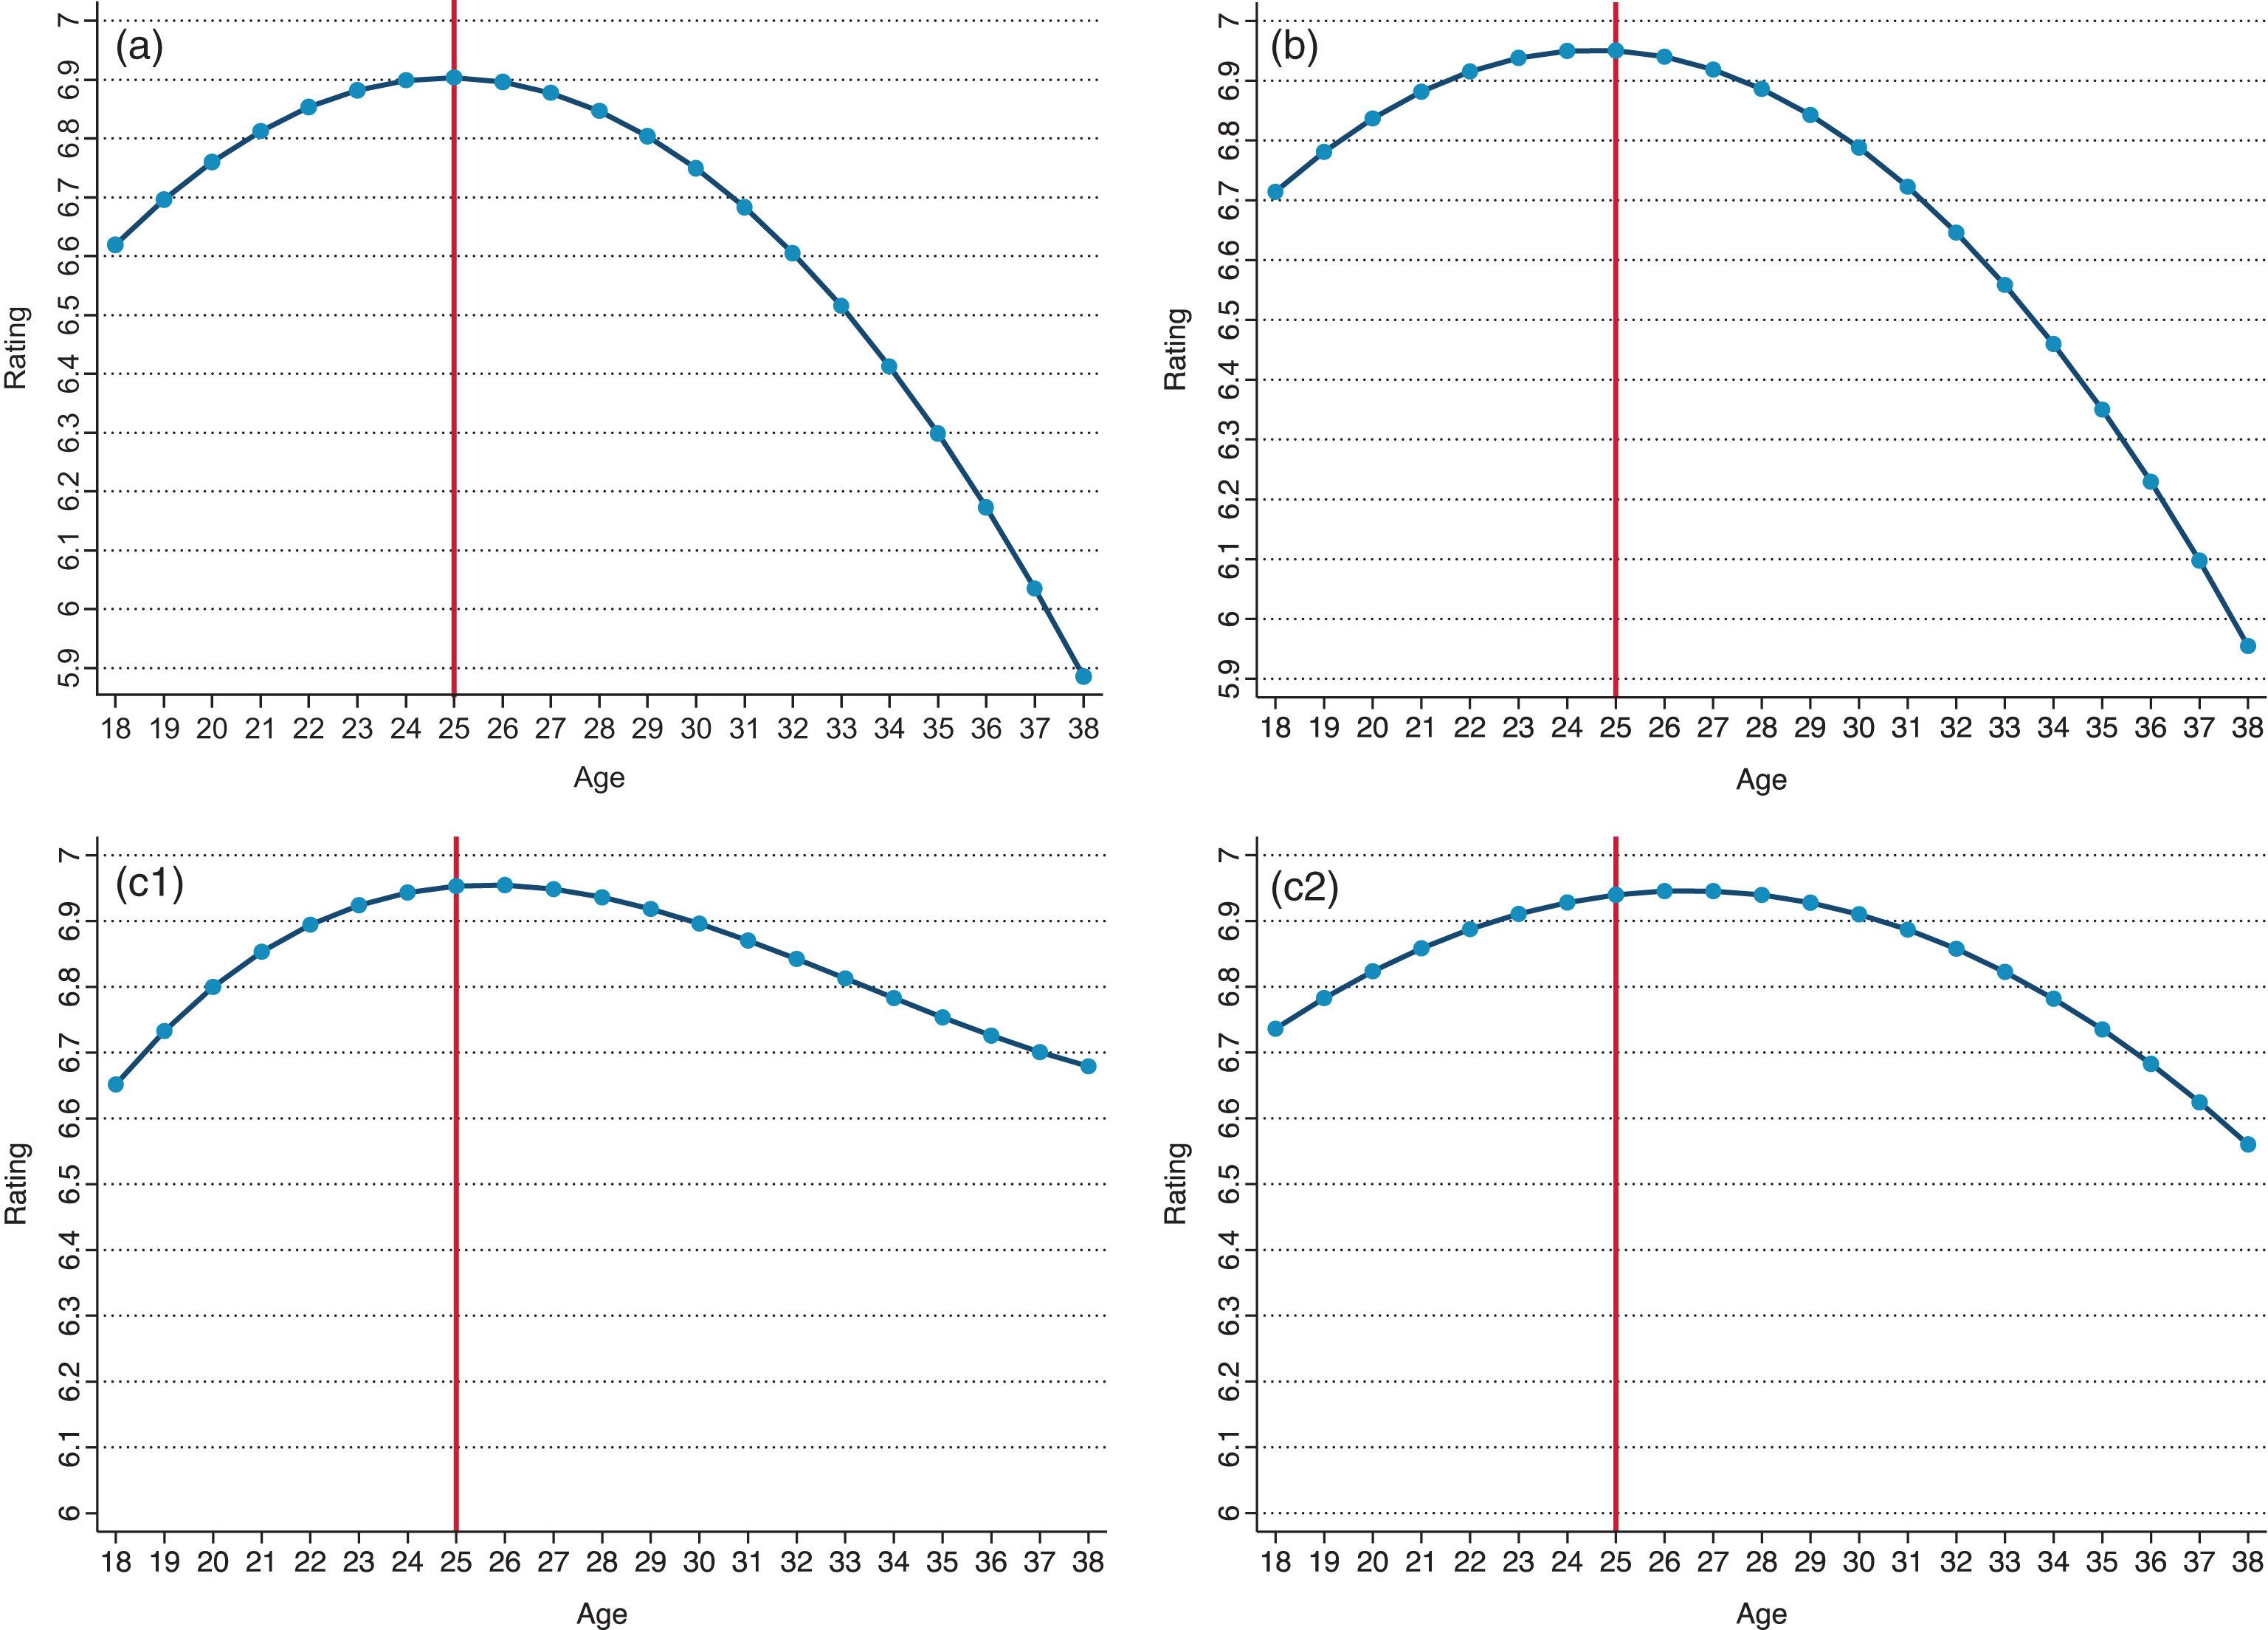
Fig.5
a. Age and performance: Fixed effects regression fit, dummy variable specification – Forwards. b. Age and performance: Fixed effects regression fit, dummy variable specification – Midfielders. c. Age and performance: Fixed effects regression fit, dummy variable specification – Defenders.
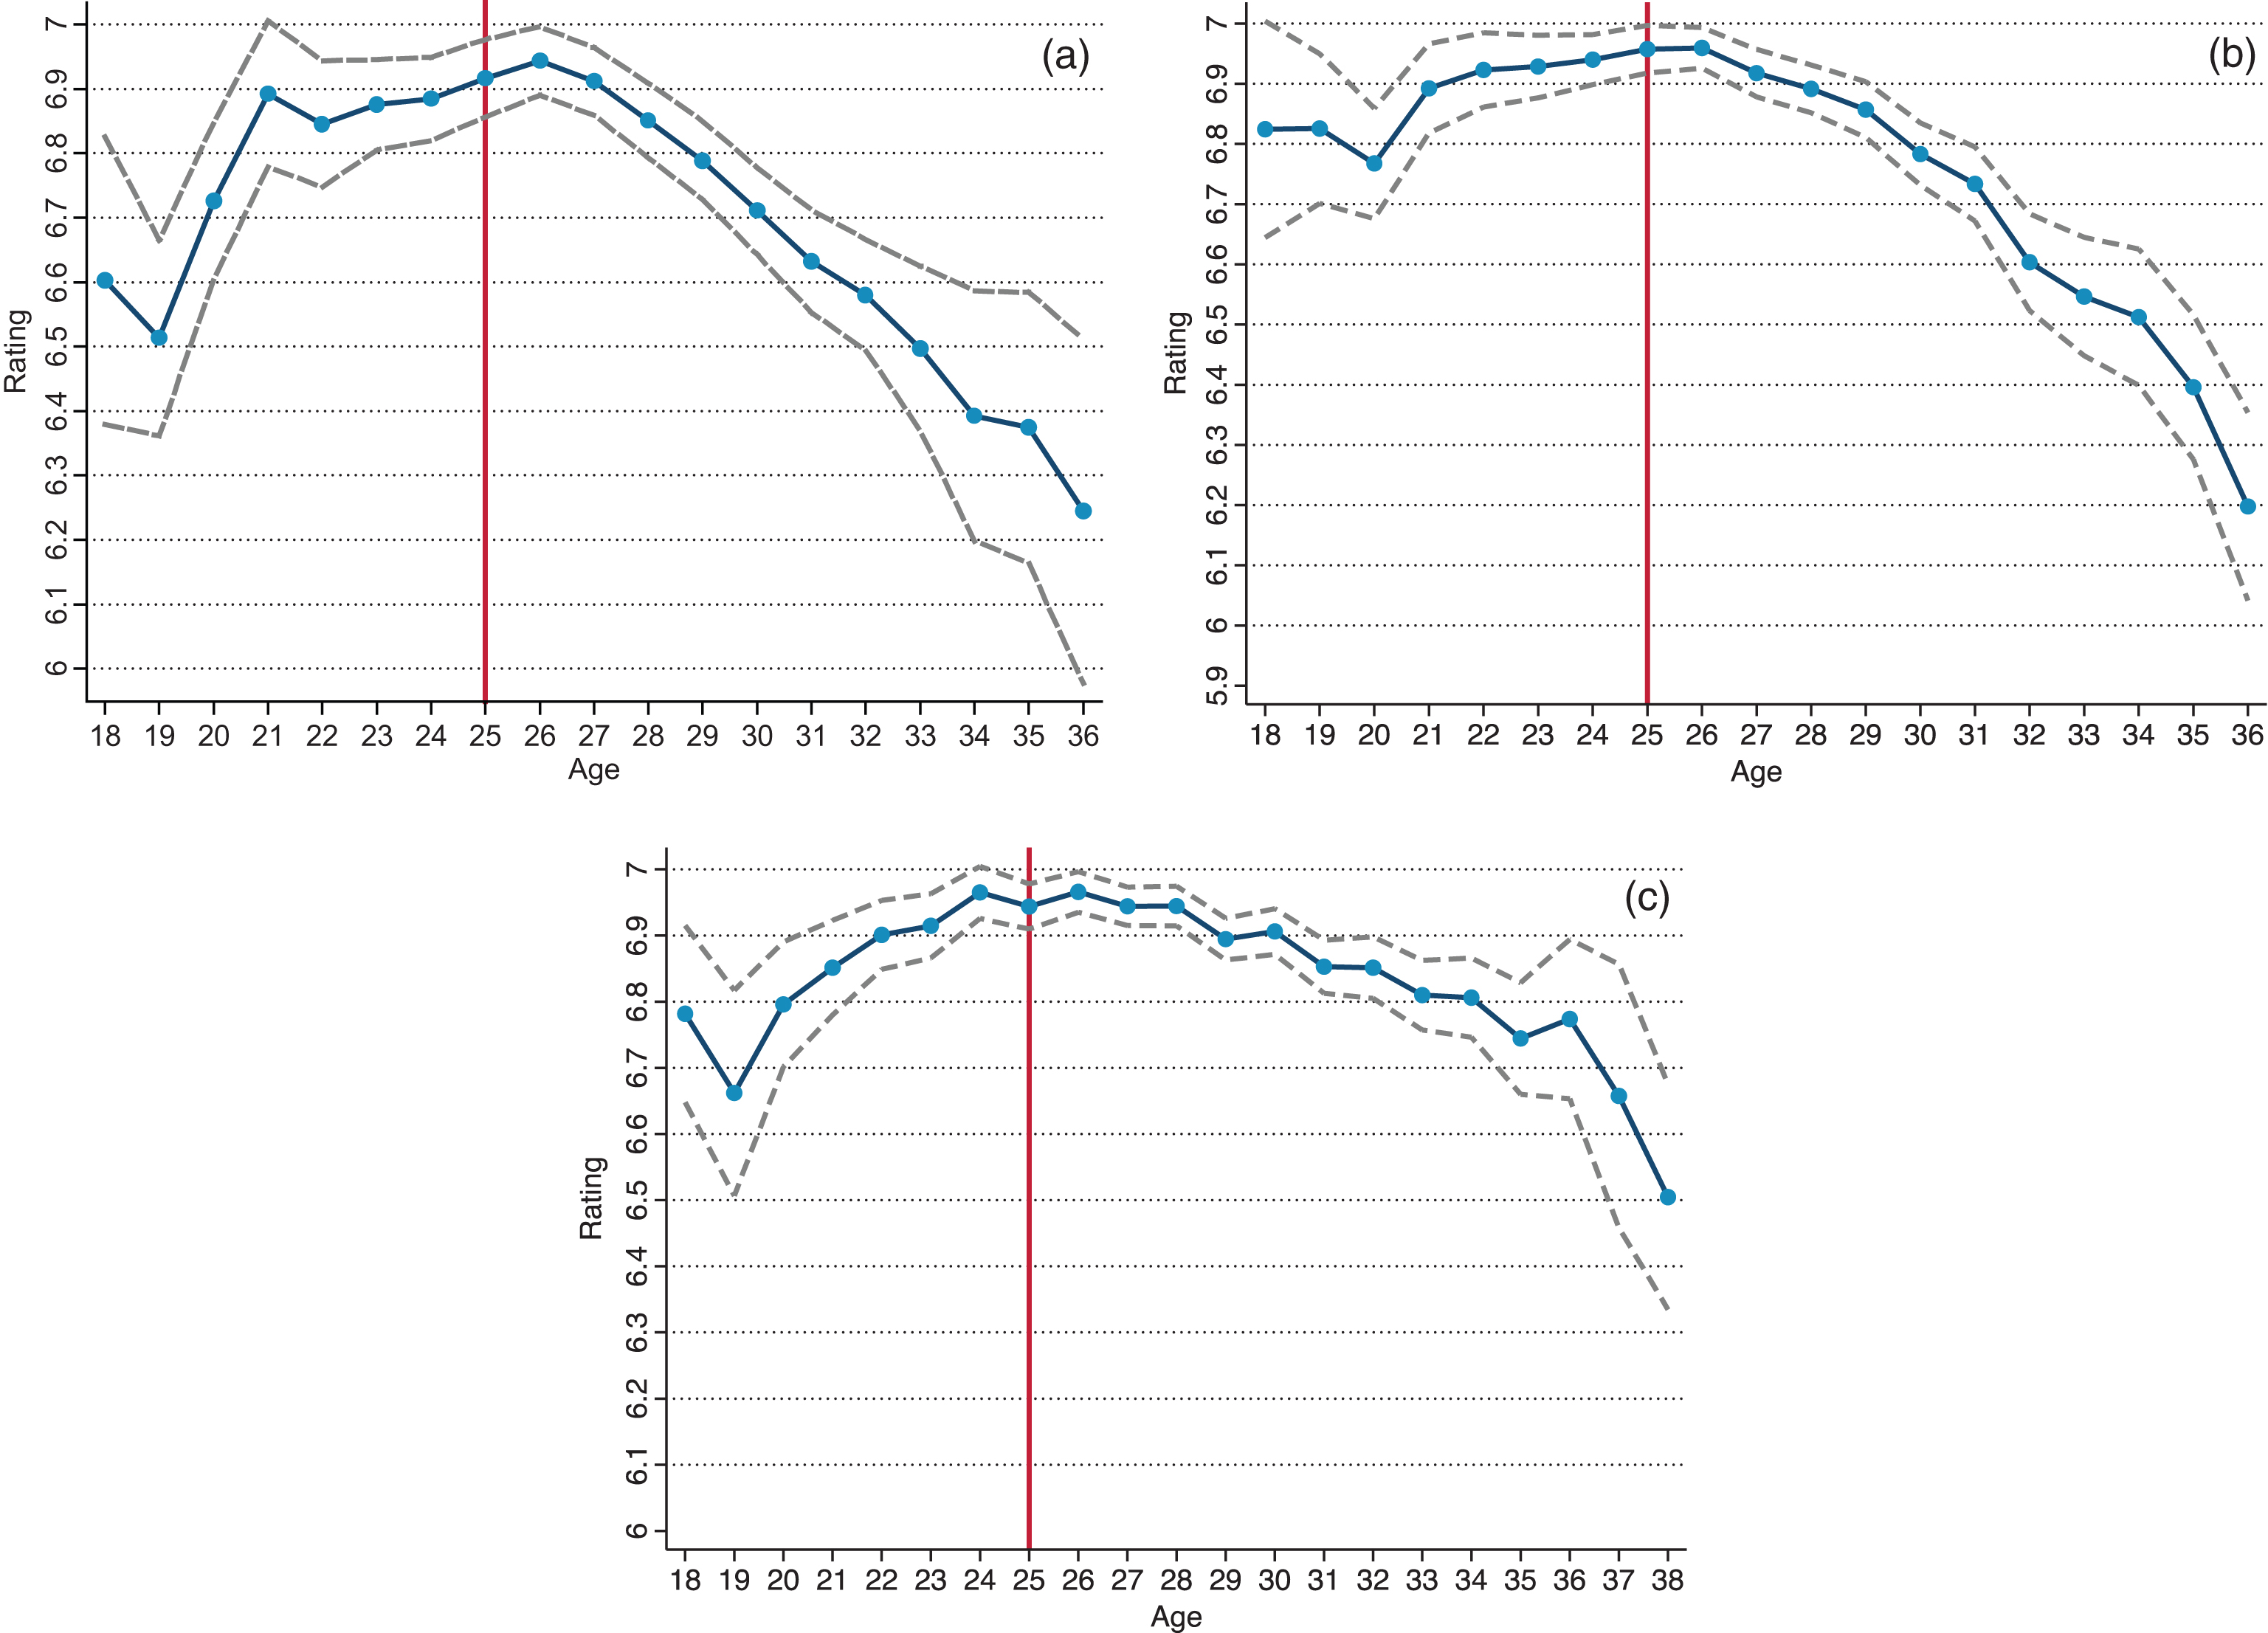
Fig.6
a. Age and performance: Random coefficients regression fits – Forwards. b. Age and performance: Random coefficients regression fits – Midfielders. c. Age and performance: Random coefficients regression fits – Defenders. d. Peak age distribution from individualized age-performance fits – Forwards. e. Peak age distribution from individualized age-performance fits – Midfielders. f. Peak age distribution from individualized age-performance fits – Defenders.
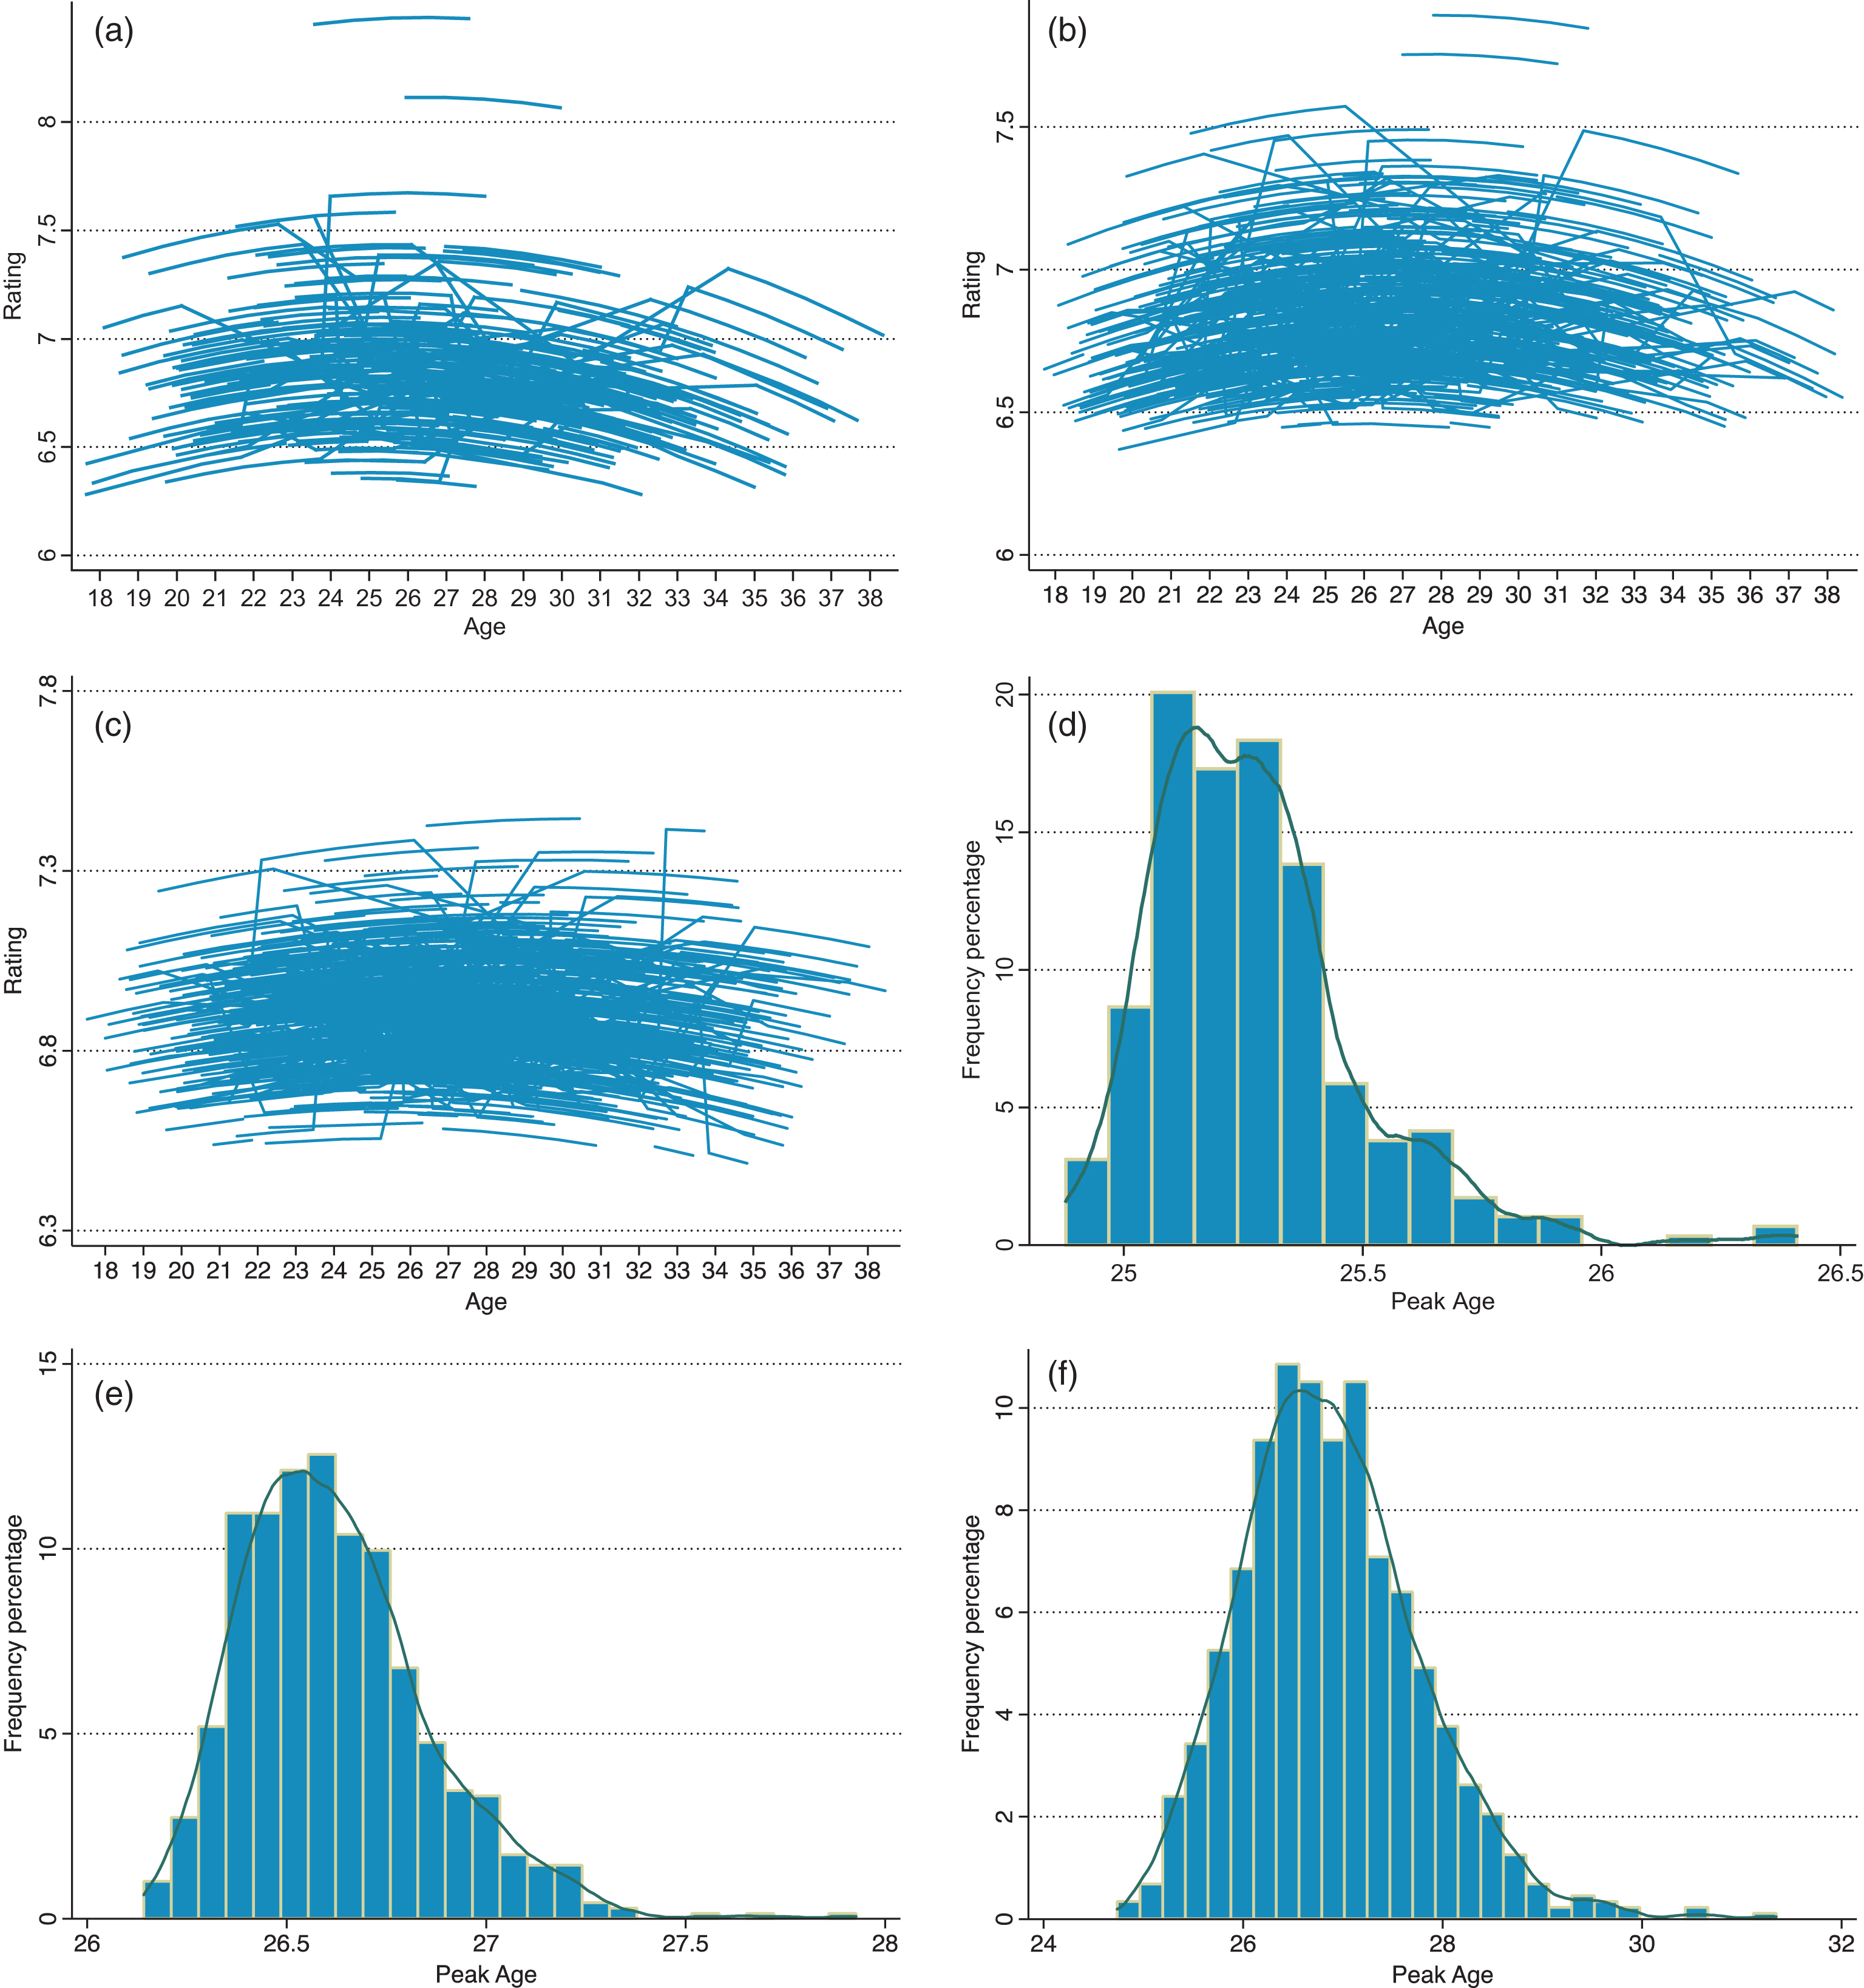
Table 1
Summary statistics on age and rating
| Min | Max | Mean | Std. Dev. | |
| Forwards | ||||
| Age | 17.66 | 38.33 | 26.79 | 3.98 |
| WS rating | 5.93 | 8.88 | 6.75 | 0.41 |
| Midfielders | ||||
| Age | 17.72 | 38.39 | 26.36 | 3.97 |
| WS rating | 6.06 | 8.47 | 6.81 | 0.34 |
| Defenders | ||||
| Age | 17.53 | 38.46 | 27.23 | 3.94 |
| WS rating | 5.97 | 8.01 | 6.88 | 0.28 |
Table 2
Age and performance: Player fixed effects regression
| Forwards | Midfielders | Defenders | ||||
| Age | 0.876*** | 0.296*** | 0.226 | 0.271*** | 0.528*** | 0.154*** |
| (2.65) | (5.03) | (1.11) | (7.38) | (2.78) | (5.47) | |
| Age squared | –0.028** | –0.006*** | –0.004 | –0.006*** | –0.017** | –0.003*** |
| (2.20) | (5.37) | (0.51) | (8.08) | (2.43) | (5.80) | |
| Age cubed | 2.65e-4 | –2.08e-5 | 1.67e-4** | |||
| (1.68) | (0.23) | (2.04) | ||||
| Constant | –1.849 | 3.218*** | 4.017** | 3.624*** | 1.583 | 4.903*** |
| (0.64) | (4.15) | (2.19) | (7.39) | (0.91) | (12.47) | |
| Adjusted R2 | 0.56 | 0.56 | 0.53 | 0.53 | 0.42 | 0.42 |
| Observations | 1504 | 1504 | 2319 | 2319 | 3048 | 3048 |
| Peak age | 24.5 | 24.9 | 24.6 | 24.6 | 25.7 | 26.5 |
| Peak age CI | 23.4–25.5 | 23.7–26.1 | 23.6–25.6 | 23.6–25.5 | 24.5–26.8 | 25.2–27.8 |
| S-H χ2 | 24.1 | 22.7 | 69.0 | 69.4 | 30.5 | 28.5 |
Note: |t| ratios based on robust standard errors are shown in parentheses. *** – shows significance at 1%; ** – shows significance at 5%. Peak age CI – Peak age 95% confidence interval. S-H χ2 – Sargan-Hansen Chi2 statistic for fixed versus random effects.
Table 3
Age and performance: Player fixed effects regression, age dummy variable specification
| Forwards | Midfielders | Defenders | |
| Age | |||
| 19 | –0.089 (0.80) | 0.001 (0.02) | –0.120 (2.34)** |
| 20 | 0.123 (1.18) | –0.057 (0.63) | 0.014 (0.23) |
| 21 | 0.289 (2.66)*** | 0.068 (0.80) | 0.070 (1.05) |
| 22 | 0.243 (2.22)** | 0.099 (1.07) | 0.119 (1.75)* |
| 23 | 0.273 (2.42)** | 0.104 (1.12) | 0.133 (1.96)** |
| 24 | 0.282 (2.39)** | 0.116 (1.24) | 0.183 (2.67)*** |
| 25 | 0.314 (2.65)*** | 0.133 (1.41) | 0.162 (2.31)** |
| 26 | 0.341 (2.85)*** | 0.135 (1.42) | 0.184 (2.60)*** |
| 27 | 0.309 (2.56)*** | 0.093 (0.96) | 0.162 (2.27)** |
| 28 | 0.248 (2.04)** | 0.067 (0.69) | 0.163 (2.24)** |
| 29 | 0.186 (1.51) | 0.033 (0.33) | 0.113 (1.54) |
| 30 | 0.108 (0.86) | –0.041 (0.41) | 0.124 (1.68)* |
| 31 | 0.030 (0.24) | –0.091 (0.89) | 0.071 (0.94) |
| 32 | –0.022 (0.17) | –0.221 (2.08)** | 0.070 (0.91) |
| 33 | –0.105 (0.75) | –0.278 (2.51)*** | 0.028 (0.36) |
| 34 | –0.210 (1.31) | –0.312 (2.72)*** | 0.024 (0.31) |
| 35 | –0.228 (1.38) | –0.428 (3.68)*** | –0.037 (0.44) |
| 36 | –0.358 (1.92)* | –0.627 (4.92)*** | –0.008 (0.08) |
| 37 | –0.454 (1.93)** | –0.736 (5.23)*** | –0.124 (0.99) |
| 38 | –0.431 (1.21) | –0.938 (7.19)*** | –0.277 (2.43)** |
| Constant | 6.603 (58.01)*** | 6.824 (74.34)*** | 6.782 (99.47)*** |
| Adjusted R2 | 0.56 | 0.53 | 0.42 |
| Observations | 1504 | 2319 | 3048 |
| S-H χ2 | 56.8 | 101.1 | 55.6 |
Note: A player fixed effects model is estimated. |t| ratios based on robust standard errors are shown in parentheses. *** – shows significance at 1%; ** – shows significance at 5%; * – shows significance at 10%. S-H χ2 – Sargan-Hansen Chi2 statistic for fixed versus random effects.
Table 4a
Summary statistics on peak age derived from individualized age-performance fits
| Percentile | Mean | Std. Dev. | N | |||
| 25th | 50th | 75th | ||||
| Forwards | 25.12 | 25.25 | 25.37 | 25.28 | 0.22 | 289 |
| Midfielders | 26.46 | 26.59 | 26.75 | 26.62 | 0.24 | 693 |
| Defenders | 26.26 | 26.80 | 27.40 | 26.88 | 0.90 | 875 |
Table 4b
Ability and peak age
| Forwards | Midfielders | Defenders | ||||
| WSmean | 0.616*** | 0.847*** | 4.073*** | |||
| (31.17) | (68.81) | (61.52) | ||||
| WSmax | 0.473*** | 0.633*** | 3.117*** | |||
| (17.79) | (37.19) | (37.57) | ||||
| Constant | 21.081*** | 21.917*** | 20.857*** | 22.19*** | –1.138*** | 4.890*** |
| (159.45) | (118.34) | (250.02) | (188.56) | (2.51) | (8.43) | |
| R2 | 0.80 | 0.68 | 0.92 | 0.76 | 0.91 | 0.72 |
| Observations | 289 | 693 | 875 | |||
Note: Ordinary Least Squares regression of peak age on ability. |t| ratios based on robust standard errors are shown in parentheses. *** - shows significance at 1%.


