
Revisiting the ranking of outstanding professional sports records
Abstract
Twenty-eight years ago Golden and Wasil (1987) presented the use of the Analytic Hierarchy Process (AHP) for ranking outstanding sports records. Since then much has changed with respect to sports and sports records, the application and theory of the AHP, and the availability of the internet for accessing data. In this paper we revisit the ranking of outstanding sports records and build on past work, focusing on a comprehensive set of records from the four major American professional sports. We interviewed and corresponded with two sports experts and applied an AHP-based approach that features both the traditional pairwise comparison and the AHP rating method to elicit the necessary judgments from these experts. The most outstanding sports records are presented, discussed and compared to Golden and Wasil’s results from a quarter century earlier.
1Introduction
In 1987, Golden and Wasil (GW) applied the Analytic Hierarchy Process (AHP) to rank what they considered to be “some of the greatest active sports records” (Golden and Wasil, 1987). At the time, the AHP was in its infancy with Saaty’s ground breaking book on AHP having been published a few years earlier (Saaty, 1980). Since that time, the theory and applications of the AHP have been expanded, and also a number of sports records have been broken. In addition, data about sports records, such as current and previous record holders, are more readily available. All of these factors provide the motivation for conducting an updated and expanded evaluation of sports records. We revisit the use of an AHP-based approach for ranking outstanding sports records and follow the outline of GWs approach, but focus on only individual records set in the four major professional American sports (baseball, basketball, football, and hockey). In addition, we expand the set of records considered, create a single AHP analysis for different types of records (career, season, consecutive and game), and harness the opinions of sports experts to adjust the set of criteria and their weights and to drive the evaluation process.
In addition to GW we found one study on sports ranking that was completed as a requirement for an MS thesis at the University of Maryland supervised by Professor Golden (Alford, 2004). The main differences between GW and that study are that the latter considers an expanded set of records across a broad array of professional sports and evaluates these records using the AHP rating method instead of pairwise comparisons. We will use a mix of both AHP methods as will be discussed later in this paper.
The difficulty in ranking sports records relates to three challenges: identifying a set of criteria that are applicable across the four sports and different types of records; determining the importance of these evaluative criteria; and determining the degree to which each of the records achieves these criteria. It is inherently a subjective process, but can be driven by data and informed by the opinion of experts to improve the quality of the results. We choose to apply the AHP to ranking sports records since it can effectively handle multiple criteria that are either quantitative or qualitative.
In the next section we display and examinethe records used by GW and how they have changed over time. Then we discuss the records we have selected to consider in our study. This is followed by a discussion of the AHP model and how it is specified. The results of our analysis are then presented and discussed and the most outstanding sports records will be revealed. We then draw some conclusions.
2A look back at golden and wasil
Table 1 displays the 22 sports records that GW considered.1 Of the 22 records, eleven have been broken, nine are identical to what they were 25 years ago and two career records have been extended by players who were active at the time of GW. GW defined a season record as one accomplished during a regular season, while a career record corresponds to a record set over at least several seasons. A single game record was established during a one-time contest.
GW made several observations at the time they wrote this paper. They expected Wayne Gretzky to break Gordie Howe’s record which he did. They expected Nolan Ryan and Kareem Abdul-Jabbar to extend their career records for strikeouts and points scored, respectively, which they did, although GW greatly under-forecasted by how much Nolan Ryan would increase his record.
GW also noted that Paul Hornung had an advantage over modern football players because he not only scored points for touchdowns but, in addition, he also kicked field goals and points after touchdowns whereas no modern player is both a position player and a kicker. However, in spite of this advantage, Paul Hornung’s record for points in a season was broken by LaDainian Tomlinson. Hornung had 176 points in 12 games (14.67 points per game) and LaDainian Tomlinson had 186 points in 16 games (11.63 points per game). Thus, the cross-era advantage that Hornung had was mitigated by the length-of-season advantage thatTomlinson had.
GW also noted other issues besides length of season and the fact that Paul Hornung was a running back who also kicked extra points and field goals. They also note that rule changes and equipment improvements can impact records. Examples of rule changes include the height of the mound in baseball, the inclusion of the designated hitter in the American League, the NFL not allowing defenders to touch receivers outside of five yards from the line of scrimmage, the addition of the 3-point shot in basketball, and the change in the rule about the two-line pass in hockey. An example of an equipment change that GW mentions is the introduction of the “lively” baseball. More recent events like the advent of performance enhancing drugs (PEDs) makes evaluating records even murkier. Our experts insisted that an advantage given to a PED user is not that much different than the advantage of playing in a different era. For example, Cy Young was the starting pitcher in almost one-third of the games played early in his career, whereas modern-day pitchers typically start at most one-fifth of the games played.
In the next section, we explain how we address these points through the selection of appropriate criteria and subcriteria. This discussion illustrates the importance of focusing the argument on the selection of the evaluative factors and their weights as opposed to arguing about which record is greater. For this reason we agree with GW that the AHP is an ideal vehicle to structure the debate. We now turn to the records we evaluated.
3The records to be considered
In determining the records that should be included in our study we have taken a different approach than in the previous two studies (Golden and Wasil, 1987; Alford, 2004). We narrowed our scope to the four major American professional sports leagues: Major League Baseball (MLB), National Football League (NFL), National Basketball Association (NBA), and National Hockey League (NHL). This eliminated Bob Beamon’s long jump record (track) that was considered in both of the previous studies, and records from several other U.S. professional sports considered in Alford (2004).
For classification purposes, we decided to add a category termed “Consecutive”. We moved Johnny Unitas’ record for consecutive games with touchdown passes and Joe DiMaggio’s 56 game hitting streak to this category. While for discussion purposes we have four categories rather than three, one of the major differences between our study and GW is that we are going to rank all records together, regardless of type, rather than having three or four separate AHP analyses.
In order to create our list of records, we pursued a four-pronged approach:
1) Include the GW records that met our specifications above,
2) Include any additional records featured in Alford (2004),
3) Include records that were in an article in Sports Illustrated that referenced the GW paper(McCallum, 1990), and
4) Perform a Google search to find articles from reputable websites that featured sports records.
In total, we identified 65 records for consideration in the study. We considered records set as of August 31, 2013. (We note that one record, longest field goal, has been broken since then). Our experts validated these records indicating that none should be deleted and they offered no other records to add to the list. Information on the current record holders is provided in Table A1 in the Appendix, information on the previous record holders and the next best performances is given in Table A2, and the web sites that serve as sources for each of the records are listed in Table A3.
4AHP analysis
There have been a number of papers published applying the AHP to sports. Several of these have applied the AHP to ranking player performances. For example, Lanou and Revetta (1993), Bodin and Epstein (2000), and Chen et al. (2014) use the AHP to rank Major League Baseball players with respect to various performance characteristics, while in a similar fashion, Wang and Si (2008) and Wu (2013) apply the AHP to ranking basketball players. Other papers have examined the AHP in ranking team performances. Specifically, Sinuany-Stern (1988), Sinuany-Stern et al. (2006), and Sun 2007 apply the AHP in ranking teams in soccer, basketball, and football respectively. However, the only two publications addressing the ranking of sports records are GW (1987) and Alford (2004).
Following GW and the subsequent Master’s project (Alford, 2004) we decided to apply the AHP to the ranking of sports records. The AHP is an appropriate methodology for prioritizing alternatives when multiple criteria must be considered (Saaty, 2000). The AHP allows the decision maker to structure problems in the form of a hierarchy or a set of integrated levels, such as: the goal, the criteria, the subcriteria, and the alternatives. An AHP analysis uses pairwise comparisons to measure the impact of items on one level of the hierarchy on the next higher level. For example, the criteria are pairwise compared to determine their importance in achieving the goal. The question asked is: how much more important is one criterion as compared to another in achieving the goal? The alternatives can be pairwise compared to determine the extent to which they achieve the criteria (or subcriteria if they are present). In cases where many alternatives need to be evaluated, the AHP ratings approach (Saaty, 2000) may be used. This approach requires that a series of ratings or intensities be developed for each criterion (subcriterion), such as “excellent”, “very good”, “good”, “fair”, and “poor.” These intensities must be pairwise compared to determine their weights or priorities, and then the alternatives are evaluated by selecting the appropriate intensity for each criterion. The AHP measures the degree to which judgments are inconsistent and establishes an acceptable tolerance level for the degree of inconsistency. The AHP is a proven decision making technique and has been applied widely and successfully. The interested reader is referred to Vaidya and Kumar (2006) who review 150 AHP applications. While AHP is one method that can be applied in such circumstances, there are others, such as utility theory and decision analysis that might be applied as well.
The hierarchy for sports ranking is shown in Fig. 1. As previously mentioned, we decided to form onehierarchy for all sports records, whether season, career, individual, or consecutive. GW had three closely-related hierarchies for season, career, and individual, which differed only due to the addition of one subcriterion in the season hierarchy. The highest level of our hierarchy, or the goal, is to select the best sports record from among all four categories of records. Following GW and after consultation with our experts, our hierarchy has three criteria: “Duration of Record” (Duration), “Incremental Improvement” (Incremental), and “Other Record Characteristics” (Other). The next level of our hierarchy is comprised of subcriteria. Under Duration, “Years Current Record Has Stood” (Years Current) was included as a subcriterion since as stated in GW, “if a record is old and has not been broken, it is more likely to be a great record.” (Golden and Wasil, 1987, p.38). Our second subcriterion under Duration is “Years Previous Record Has Stood” (Years Previous). A record may have been recently broken, but the previous record may have stood for a long time, lending credence that it is still a very good record with respect to Duration.
For example, just seven years ago LaDainian Tomlinson scored 186 points and broke Paul Hornung’s 1960 record (176 points) for most points scored in an NFL season. Although the current record has stood for a relatively short period of time, the previous record stood for quite some time (46 years), adding credence to the value of this record. On the other hand, a record may have stood for a long time, but the previous record stood for a short period of time, somewhat diminishing its importance with respect to Duration. For example, while Rogers Hornsby’s season batting average of 0.424 has stood for a very long time (89 years), George Sisler set the previous record of 0.420 just two years earlier. We choose this subcriterion instead of GW’s “Years Record Is Expected to Stand” since past duration could be more objectively measured than future expectations.
Under Incremental we included “Percent Better Than Previous Record” (Percent Previous) as a subcriterion. A record that improves on a previous record by a larger percentage amount is likely to be a very good record. We did not include “Percent Better Than Contemporaries” as GW did in their model to select the best season record, since we did not include “Years Record Is Expected to Stand” under the Duration criterion. However, similar to Years Previous as a subcriterion under Duration, we included “Percent Better Than Next Best Performance” (Percent Next) as a second subcriterion under incremental improvement. In many situations the previous record is not the next best performance. For example, Cy Young set the record for the most career baseball wins as a pitcher at 511 in 1911. He broke Kid Nichols record of 361 wins set in 1906. However, Walter Johnson has the second largest number of wins at 417 set in 1927. The amount that a record is better than the second best performance is another indication of the value of the record in terms of rate of improvement.
The third criterion, Other, has three subcriteria: “How Well Known” (Known), “Purity” (Purity), and “Era Played” (Era). The first subcriterion, Known, replaces “Glamour” in GW. “Glamour” includes Known and the fact that some records receive more recognition than others. For example, in basketball and hockey scoring gets more recognition than assists. However, we decided that recognition tends to translate into how well known the record is and so we decided to focus on the latter factor only. We included Purity as did GW and it indicates the degree to which the record relates to the achievement of the individual record holder. In this context, a home run record is “purer” than a Runs Batted In record, and a scoring record is “purer” than an assists record since Runs Batted In and assists both involve other players. We added a third subcriterion not found in GW called Era. This factor reflects the influence of PEDs, rule changes, and the level of competition on the setting and breaking records. The fourth, and final, level of the hierarchy includes the sports records themselves that need to be evaluated with respect to the seven subcriteria.
One factor that was considered but was ultimately not included in the study was “Contribution to Winning”. While there have been attempts to both objectively correlate various statistics to winning and to analyze an individual’s contributions to winning, the experts did not wish to include these in the model. In the sports of baseball and basketball, researchers have analyzed and determined the contributions that statistics, such as home runs and assists, have in respect to winning percentage and have derived measures to value players like Wins above Replacement and Win Shares. Other sports, such as football and hockey, are still in the process of doing so. Altogether, there is significant variation in the ability to isolate an individual contribution to winning across different sports. Even if one wereable to look at how a team performed while a record was set, it would be difficult to compare across the types of records, such as single-game vs. career. As more research is performed in this area, contribution to winning could be considered in a future study.
4.1Specifying the model
We sought the opinions of two experts to review and critique our hierarchy, provide the necessary judgments, and review and validate the records that we considered. The first expert is Hall of Fame writer Jack McCallum of Sports Illustrated (Sports Illustrated, 2013). Since 1981, McCallum has been a regular contributor to SI and has written eight books, including the recent book Dream Team (McCallum, 2012) where he covered the 1992 star-studded United States Olympic basketball team. In his 1990 Sports Illustrated article, “The Record Company”, McCallum discusses outstanding sports records to date, featuring GW (McCallum, 1990). The second expert, nominated by McCallum, is Thomas “Nus” Hansen, an avid sports fan and staff member at Vanguard financial group. At first, we were hesitant to include an expert whose vocation was not related to sports. However, after our initial meeting with Jack and Nus it was apparent that Hansen has an encyclopedic knowledge of the four major American professional sports, including their evolution, teams, players, and records. Hansen exhibited an amazing recall of sports records and offered numerous insights about them. As a preliminary step, the experts were presented with a list of nominated sports records and asked to make any necessary adjustments. Upon review, the experts acknowledged the viability of each record for inclusion in the study and did not suggest adding any records to the study.
The next step involved the judgments and evaluations needed to specify the AHP model given in Fig. 1. We begin at the top of Fig. 1, where the weights of the three criteria are determined. The pairwise comparison matrix for measuring the importance of the criteria with respect to our goal of ranking sports records is given as Table 2. Our experts reached a consensus and indicated that both Duration and Incremental were equally important and were considered slightly more important than Other. These judgments led to weights of 0.35, 0.35, and 0.30 for Duration, Incremental, and Other, respectively. These weights vary from those found in GW, who placed more weight on Duration (0.5), about the same weight on Incremental (0.333) and less weight on Other (0.167). Such differences are not unexpected, since this a subjective process.
Moving down the hierarchy we need to determine the weights for the subcriteria under each of the three criteria. For Duration and Incremental only one judgment is required: the pairwise comparison relating the importance of one subcriterion as compared to the other. In both cases the experts placed more weight on the measure of the current record than the previous one, as might be expected. Specifically with respect to Duration, the experts felt that Years Current is 2.33 times more important than Years Previous. With respect to Incremental they felt that Percent Previous was three times more important than Percent Next. Their judgments led to a weight of 0.70 for Years Current (GW used 0.80) and 0.30 for Years Previous, and 0.75 for Percent Previous (same as GW) and 0.25 for Percent Next.
Our third criterion, Other, contains three subcriteria and so three judgments were elicited and are given in Table 3. The experts found that Era was the most important of the three subcriteria. Specifically, they found that Era was six times as important as “how well known” and twice as important as Purity. When comparing Purity with Known, they gave the edge to Purity, and judged it to be three times as important as Known. These judgments led to subcriteria weights of 0.6, 0.1, and 0.3 for Era, Known, and Purity, respectively. During the judgment elicitation process, the experts adjusted the pairwise comparisons a bit to arrive at a set of weights that they felt were most reflective of their joint opinions.
Since GW did not include era, our subcriteria weights under Other are different. GWs subcriteria weights were 0.667 for Glamor (related to our Known subcriterion as previously discussed) and 0.333 for Purity. While our experts placed about the same weight for Purity as did GW, the inclusion of Era in our model significantly diminished the resulting weight for Known.
The next step is to evaluate each of the 65 sports records with respect to each of the seven subcriteria. We adopta modified version of GWs approach for evaluating the records with respect to the quantitative subcriteria under both Duration and Incremental. As an example, for Years Current consider the comparison of Joe DiMaggio’s record of 56 consecutive games with a hit set in 1941 and Kareem Abdul-Jabbar’s career record of 38,387 points scored set in 1989. Record years was obtained by subtracting the year the record was set from 2013, and then adjusting the result for the number of years that the sport has been played professionally in the modern era. For hockey, football, and basketball, the adjustment year was set to the formation of the associated professional leagues, or 1917, 1920, and 1946, respectively. For baseball the adjustment year was set at 1900, the beginning of the modern era for this sport. The adjusted years for a record is computed as: 100* (Years Current/years since the beginning of the modern era for that sport). For DiMaggio,
A 65 × 65 pairwise comparison matrix was formed using these judgments, and weights for Years Current were determined for each record using a well-known approximation of the AHP eigenvalue method (Saaty, 2000). These “distributive weights” were normalized to determine “ideal weights” so that the record with the highest weight would be set at one. This was accomplished by dividing all of the weights by the record with the highest weight. Cy Young’s records for 511 career wins and 749 complete games, both set in 1911, had the highest weight, and so were set at one for this subcriterion. This normalization procedure was also used for the remaining three quantitative subcriteria.
The pairwise comparisons for Years Previous were determined using the same approach described above. The previous record of 41 consecutive games with hits was set by George Sisler in 1922 and so stood for 19 years, while the previous record of 31,419 career points scored was set by Wilt Chamberlain in 1973 and stood for 16 years. The adjusted years for DiMaggio is
For Percent Previous and Percent Next we also used the same approach, except we capped the percentages at 100. For DiMaggio’s record, Percent Previous is
Similar to Alford (2004) we applied an AHP ratings approach to evaluate the three subcriteria under Other. For each subcriterion the experts developed a set of ratings categories and then assigned weights to each category. The resulting categories and weights are summarized in Tables 4 through 6.
These three tables were used by the experts to evaluate each record. For a given subcriterion, the weights associated with the categories the experts selected for a specific record were averaged to get a subcriterion score. Returning to DiMaggio’s record, both experts rated it as being “widely known to the general public” and so its score with respect to the Known subcriterion is 1.00. Concerning Purity for DiMaggio’s record, the experts differed, with one indicating “not aided by teammates” and the other selecting “slightly aided by teammates” for a score of
To gain some further insight into the Known subcriterion, we posted a quiz on Sporcle (Sporcle, 2013) that asked the respondent to select the name of the record holder from a set of five choices for each of the 65 records we considered. Based on a sample size of 508 respondents we found that the Sporcle quiz results and the Known scores have a significant (p < 0.0001) positive linear relationship. Of course, the respondents are most likely sports fans, but the results do provide some qualified support for the experts’ results. The most well-known record holder according to the quiz results is Barry Bonds, with 76.7% of the respondents indicating that he is the career leader in home runs with 762 (Sporcle, 2013).
The final step in the AHP process is the computation of the total scores for each record. A weighted averaging approach is used to compute these scores as follows. Each subcriterion’s weight is multiplied by the associated criterion weight and then by the record’s score with respect to that subcriterion. These weighted scores are summed over all subcriteria to obtain the record’s final score. This process is illustrated in Table 7 for DiMaggio’s and Abdul-Jabbar’s records. Since the subcriteria scores were normalized to have values between 0 and 1, total scores can vary over this interval as well. These final scores have ratio-scaled meaning, so based on this analysis, DiMaggio’s record is
5Results
We used Decision Lens Suite (Decision Lens, 2010) and Excel to implement the AHP model that we have described. The complete results on all 65 records appear in Table A4. The AHP scores ranged from 0.4848 to 0.1239. In Table 8 we list the ten records with the highest scores. The record that is best in each of our four categories is highlighted in bold.
Given the records that Barry Bonds has set in baseball it might not be surprising that according to our analysis he holds the best sports record. What might be surprising is that this record is for688 intentional walks during his career, while his single season record of 73 home runs is the lowest ranked record in our analysis!; The main reason why his career intentional walks record is ranked first might be surprising as well:Bonds received the full criterion weight of 0.35 for Incremental, since he had the highest percentage improvement over both the previous record and the second best performance. The previous record is also the second best and was set by Hank Aaron with 293 career intentional walks. Barry Bonds’ 688 career intentional walks is more than double Hank Aaron’s record. We also note that the AHP score of Barry Bonds’ intentional walk record is only 1.57% better than the AHP score of Nolan Ryan’s career no hitters record, which is the second best record in our analysis. On the other hand, Bonds season home run record scores poorly on three highly weighted subcriteria that his intentional walks record scored nearly perfectly. That is, the home run record is only 4.3% better than the previous record, which is also the next best performance, and the previous record stood for only three years.
Some might argue that Bonds’ intentional walk record should be further reduced since he played in the “Steroids Era.” However, Era has a substantial effect on the overall AHP score since it has 60% of Other’s weight, giving it 18% (0.6*0.3) of the total possible score. Since Bonds’ intentional walk record received the lowest rating possible for this subcriterion, it was significantly negatively impacted by Era, but still is the best record.
Five of the top ten are career records (Table 8). We were concerned that the methodology might have been biased towards career records so we computed the mean and median rank for the four different types of records as shown in Table 9. The results show that there is not a bias towards career records. If anything there is a bias in favor of game records and against season records.
We also were interested in how the four sports fared, and so we computed their mean and median ranksas shown in Table 10. Baseball seems to be highest, possibly due to its popularity or longevity, while football records seem to be significantly less remarkable as compared to the other three sports.
5.1Records that are not well known and the lowest ranked records
Several of the top records are, in the experts’ opinions, not widely known. Anexample of a record not widely known is Jim Bottomley’s game Runs Batted In record, which is currently ranked 4th. If the reader objects to such records being ranked so highly or even included, we offer two observations. A reason why Bottomley’s record, for example, is ranked so highly overall is that it performs well in several highly-weighted subcriteria and is not penalized significantly for not being well known, since this subcriterion has little weight (0.3*0.1 = 0.03). Concerning the inclusion of not widely known records, any record that has a low score for Known, for example, 0.25 or less, could be eliminated from the list of records. Doing so is called a “must have” in the Kepner-Tregoe system (Decision Making Confidence, 2013).
Examining the ten lowest ranked records (see Table A4) leads to some interesting observations. One notable feature these records share is that eight of the ten have been set in the 21st century, with all of them being set in 1984 or later. In contrast, the top records were set between 1911 and 2007 with their average year being 1960. The overall average for the year in which the record was most recently set (for all 65 records) is 1979. Our model rewards older records so this is not surprising. However, it is still possible for more recent records to rank highly as exhibited by Bonds’ intentional walk record.
5.2Comparison to golden and wasil and inclusion of additional records
Only three of our top ten records were included in the GW paper. Some of our additional records lack the glamour of Joe DiMaggio’s 56 game hitting streak or Wilt Chamberlain’s 100 points in an NBA game. However, it is safe to assume that, since GW had glamour as only 17% of their total score, if they had included these less glamorous records, some would have scored highly in their AHP Analysis.
As a second point of comparison, we compared our AHP ranks to the GW ranks. Of course, we could only compare those records that were not broken afterthe GW paper was published. Table 11 displays the ranks of those records within each of GW’s three categories and our ranks. We note that within each of the three categories, our ranking order is identical to the rank order in GW. On one hand this is not surprising because our model modifies and extends the GW model. On the other hand, since some of the subcriteria are different the results could have been different. We think the resultslend credence to both models.
The Johnny Unitas record had the highest rank for career records in GW. However, this record was eclipsed in the 2012 season by Drew Brees. Because the new record is so young, Brees’ record is ranked only 28th in our analysis. Dropping in rank when a record is broken is exactly the behavior we expect to see because the new record has not lasted a long time.
5.3Correlation and sensitivity analysis
We ran a correlation matrix on the AHP score and all of the subcriteria scores and identified several interesting findings (Table 12). With respect to the AHP score, Years Current has the highest correlation (0.53), while Years Previous (0.07) and Known (0.11) have minimal correlation. The Percent Previous (0.42) and the Percent Next (0.39) subcriteria have similar, relatively high, correlations with the AHP score. That those two correlations are similar is not surprising since for 40 of the records the previous record is the second best record. This relationship also appears in the correlation of 0.88 between the Percent Next and the Percent Previous.
It is also noteworthy that Years Current is negatively correlated with Years Previous. As a general rule, if a record was set recently, the previous record was set a long time ago and vice-versa. Alternatively, we might say that records that have stood for a longer period of time tend to be replaced sooner than records that stood for a shorter period of time. There was no a priori reason to expect this. One last observation is the relatively high negative correlation between Era and Years Current (–0.38). Recall that higher values for Era indicate that Era had less impact (Table 5). Thus, the negative correlation indicates that the scores for Era decrease as the records get older. So according to our experts, Era is more important for the older records than the newer records.
The high correlation of Percent Previous and Percent Next led us to investigate how sensitive the top ten ranks are if the latter subcriterion is eliminated and its weight added to the former. The results given in Table 13 show that the top ten records are the same but their ranks have changed somewhat. The largest increase would be for Wayne Gretzky’s record for consecutive games with a point that would rise from 9th to 6th place while the largest drop would be only one rank for several records.
To continue with our analysis of the top records, we explored their ranking sensitivity to changes in the criteria weights. When the weight for Duration is increased from 0.35 to 0.40 (14.2%), Joe DiMaggio’s record jumps from third best to first. However, the top ranking is very sensitive to changes in the weight of Other andIncremental. When the weight for Other is increased by 3.7% from 0.3 to 0.311, Nolan Ryan’s record becomes the top record. Meanwhile, Nolan Ryan’s record also moves to first if the weight for Incremental is decreased by just 3.3% to 0.3383. This sensitivity analysis indicates that small changes in two of the three criterion weights could reverse the top two rankings.
6Summary and conclusions
In this paper we have provided an AHP-based approach for evaluating and ranking sports records and have applied it to the four major American professional sports. We have built on the original work of Golden and Wasil (1987) and have expanded the set of records analyzed, and revised and refined the set of evaluative factors and their measurement using opinions of experts. The results demonstrate that it is possible to evaluate different types of records from different sports as long as the set of criteria considered can be reasonably applied to all candidate records. Sensitivity analysis shows that the set of top ten records is robust, and remains the same even if one of the subcriteria is eliminated.
In our analysis we have used a mix of objective and subjective criteria to rank sports records. Regardless, many ranking problems of interest, including sports records, are inherently subjective, but can benefit when expert judgments play an important role.
It is important to note that the candidate set of records for consideration in this study was identified through a structured process that combined records used in GW with those mentioned in relevant sources relating to outstanding sports records over the last 28 years. The records selected for this study were endorsed by the experts. Similarly. the AHP model used for this study, and the criteria and subcriteria selected under the single hierarchy used to evaluate the four categories of records were endorsed by the experts, and, in addition, the specific set of weights were derived through their judgements and evaluations.
Our analysis does not, nor should it for that matter, settle to everyone’s satisfaction as to what are the best sports records. However, it provides a framework to structure the debate. Using this framework facilitates a process that can lead to an improved model and/or more confidence in the results.
While we have focused on the four major professional sports leagues, our approach can also be applied to include other professional sports teams such as soccer, cricket, and lacrosse. Applying this framework contrasts with employing arguments that are all too often based on one’s biases and heightened emphasis of a particular factor. Interestingly, such emotional and self-serving arguments are unfortunately as common in the boardroom or faculty meetings as they are in the sports pub.
Appendices
Appendix
Table A1
The 65 sports records evaluated
| Record Information | |||||
| Sport | Year | Record Holder | Number | Type | Item |
| B | 1911 | Cy Young | 511 | Ca | Wins |
| B | 1911 | Cy Young | 749 | Ca | Complete Games |
| B | 1914 | Dutch Leonard | 0.961 | S | Earned Run Average |
| B | 1924 | Jim Bottomley | 12 | G | Runs Batted In |
| B | 1924 | Rogers Hornsby | 0.424 | S | Batting Average |
| B | 1927 | Walter Johnson | 110 | Ca | Shutouts |
| B | 1928 | Ty Cobb | 0.366 | Ca | Batting Average |
| B | 1930 | Hack Wilson | 191 | S | Runs Batted In |
| B | 1935 | Babe Ruth | 0.69 | Ca | Slugging Percentage |
| B | 1939 | Ted Williams | 0.482 | Ca | On-base Percentage |
| B | 1941 | Joe DiMaggio | 56 | Co | Games with Hits |
| B | 1973 | Nolan Ryan | 383 | S | Strikeouts |
| B | 1982 | Ricky Henderson | 130 | S | Stolen Bases |
| B | 1986 | Pete Rose | 4256 | Ca | Hits |
| B | 1988 | Orel Hershiser | 59 | Co | Scoreless Innings |
| B | 1989 | Vince Coleman | 50 | Co | Consecutive Stolen Bases |
| B | 1993 | Nolan Ryan | 7 | Ca | No Hitters |
| B | 1993 | Nolan Ryan | 5715 | Ca | Strikeouts |
| B | 1998 | Cal Ripken | 2632 | Co | Games Started |
| B | 2001 | Barry Bonds | 73 | S | Homeruns |
| B | 2001 | Barry Bonds | 0.863 | S | Slugging Percentage |
| B | 2003 | Rickey Henderson | 1406 | Ca | Stolen Bases |
| B | 2004 | Eric Gagne | 84 | Co | Saves |
| B | 2004 | Barry Bonds | 232 | S | Walks |
| B | 2004 | *Ichiro Suzuki | 262 | S | Hits |
| B | 2007 | Barry Bonds | 688 | Ca | Intentional Walks |
| B | 2007 | Barry Bonds | 762 | Ca | Homeruns |
| BB | 1960 | Wilt Chamberlain | 55 | G | Rebounds |
| BB | 1961 | Wilt Chamberlain | 27.2 | S | Rebound Average |
| BB | 1962 | Oscar Robertson | 41 | S | Triple Doubles |
| BB | 1962 | Wilt Chamberlain | 50.4 | S | Scoring Average |
| BB | 1962 | Wilt Chamberlain | 100 | G | Points |
| BB | 1973 | Wilt Chamberlain | 22.89 | Ca | Rebounds/Game |
| BB | 1989 | Kareem Abdul-Jabbar | 38387 | Ca | Points |
| BB | 1997 | AC Green | 1192 | Co | Games Played |
| BB | 2003 | John Stockton | 15806 | Ca | Assists |
| BB | 2003 | Michael Jordan | 30.12 | Ca | Points Per Game |
| F | 1970 | Tom Dempsey | 63 | G | Field Goal Length |
| F | 1951 | Norm Van Brocklin | 554 | G | Passing Yards |
| F | 1952 | Dick Lane | 14 | S | Interceptions |
| F | 2012 | *Drew Brees | 54 | Co | Games with Touchdown Pass |
| F | 1965 | Gale Sayers | 36 | G | Points Scored |
| F | 1973 | OJ Simpson | 143.1 | S | Average Rushing Yards/Game |
| F | 1984 | Eric Dickerson | 2105 | S | Rushing Yards |
| F | 1990 | Derrick Thomas | 7 | G | Sacks |
| F | 2004 | Jerry Rice | 22895 | Ca | Receiving Yards |
| F | 2004 | Jerry Rice | 274 | Co | Games With Reception |
| F | 2004 | Jerry Rice | 208 | Ca | Touchdowns |
| F | 2004 | Jerry Rice | 1549 | Ca | Receptions |
| F | 2004 | Emmit Smith | 18355 | Ca | RushingYards |
| F | 2006 | LaDainian Tomlinson | 31 | S | Touchdowns |
| F | 2006 | LaDainian Tomlinson | 186 | S | Points |
| F | 2007 | Morten Andersen | 2544 | C | Points |
| F | 2007 | *Tom Brady | 50 | S | Touchdown Passes |
| F | 2007 | *Adrian Peterson | 296 | G | Rushing Yards |
| F | 2010 | Brett Favre | 508 | Ca | Touchdowns |
| F | 2010 | Brett Favre | 71838 | Ca | Passing Yards |
| F | 2010 | Brett Favre | 297 | Co | Starts |
| H | 1962 | Glenn Hall | 502 | Co | Games Played In Goal |
| H | 1982 | Wayne Gretzky | 92 | S | Goals |
| H | 1983 | Wayne Gretzky | 51 | Co | Games With A Point |
| H | 1986 | Wayne Gretzky | 163 | S | Assists |
| H | 1986 | Wayne Gretzky | 215 | S | Points |
| H | 1999 | Wayne Gretzky | 1963 | Ca | Assists |
| H | 1999 | Wayne Gretzky | 2857 | Ca | Points |
B = baseball, BB = basketball, F = football, H = hockey, S = season, G = game, Ca = career, Co = consecutive. *denotes active players.
Table A2
2nd place and previous record information for the 65 sports records evaluated
| Sport | Record Categories | 2nd best | Previous Record | |||||
| Type | Item | Year | Holder | # | Year | Holder | # | |
| B | Ca | Wins | 1927 | W Johnson | 417 | 1906 | K Nichols | 361 |
| B | Ca | Complete Games | 1927 | W Johnson | 531 | 1906 | K Nichols | 531 |
| B | S | Earned Run Average | 1906 | M Brown | 1.038 | 1906 | M Brown | 1.038 |
| B | SG | Runs Batted In | 1993 | M Whiten | 12 | 1911 | H Zimmerman | 9 |
| B | S | Batting Average | 1922 | G Sisler | 0.42 | 1922 | G Sisler | 0.42 |
| B | Ca | Shutouts | 1930 | P Alexander | 90 | 1916 | C Mathewson | 79 |
| B | Ca | Batting Average | 1937 | R Hornsby | 0.358 | 1920 | J Jackson | 0.356 |
| B | S | Runs Batted In | 1931 | L Gehrig | 184 | 1927 | L Gehrig | 175 |
| B | Ca | Slugging Percentage | 1939 | T Williams | 0.6338 | 1934 | Wilson | 0.5447 |
| B | Ca | On-Base Percentage | 1935 | B Ruth | 0.474 | 1935 | B Ruth | 0.474 |
| B | Co | Games With Hits | 1978 | P Rose | 44 | 1922 | G Sisler | 41 |
| B | S | Strikeouts | 1965 | S Koufax | 382 | 1965 | S Koufax | 382 |
| B | S | Stolen Bases | 1974 | L Brock | 118 | 1974 | L Brock | 118 |
| B | Ca | Hits | 1928 | T Cobb | 4189 | 1928 | T Cobb | 4189 |
| B | Co | Scoreless Innings | 1968 | D Dysdale | 58 | 1968 | D Dysdale | 58 |
| B | Co | Cons Stolen Bases | 2006 | *I Suzuki | 45 | 1975 | D Lopes | 38 |
| B | Ca | No Hitters | 1966 | S Koufax | 4 | 1966 | S Koufax | 4 |
| B | Ca | Strikeouts | 2009 | R Johnson | 4875 | 1988 | S Carlton | 4136 |
| B | Co | Games Started | 1939 | L Gehrig | 2130 | 1939 | L Gehrig | 2130 |
| B | S | Homeruns | 1998 | M McGuire | 70 | 1998 | M McGuire | 70 |
| B | S | Slugging Percentage | 1920 | B Ruth | 0.8472 | 1920 | B Ruth | 0.8472 |
| B | Ca | Stolen Bases | 1979 | L Brock | 938 | 1979 | L Brock | 938 |
| B | Co | Saves | 1999 | T Gordon | 54 | 1999 | T Gordon | 54 |
| B | S | Walks | 2002 | B Bonds | 198 | 2002 | B Bonds | 198 |
| B | S | Hits | 1920 | G Sisler | 257 | 1920 | G Sisler | 257 |
| B | Ca | Intentional Walks | 1976 | H Aaron | 293 | 1976 | H Aaron | 293 |
| B | Ca | Homeruns | 1976 | H Aaron | 755 | 1976 | H Aaron | 755 |
| BB | SG | Rebounds | 1960 | B Russell | 51 | 1960 | B Russell | 51 |
| BB | S | Rebound Average | 1960 | W Chamberlain | 26.96 | 1960 | W Chamberlain | 26.96 |
| BB | S | Triple Doubles | 1968 | W Chamberlain | 31 | 1961 | O Robertson | 26 |
| BB | S | Scoring Average | 1963 | W Chamberlain | 44.8 | 1961 | W Chamberlain | 38.4 |
| BB | SG | Points | 2006 | K Bryant | 81 | 1961 | W Chamberlain | 78 |
| BB | Ca | Rebounds/Game | 1969 | B Russell | 22.45 | 1969 | B Russell | 22.45 |
| BB | Ca | Points | 2004 | K Malone | 36,928 | 1973 | W Chamberlain | 31419 |
| BB | Co | Games Played | 1983 | R Smith | 906 | 1983 | R Smith | 906 |
| BB | Ca | Assists | 2011 | J Kidd | 11,578 | 1992 | M Jackson | 10334 |
| BB | Ca | Points/Game | 1973 | W Chamberlain | 30.07 | 1973 | W Chamberlain | 30.07 |
| F | SG | Field Goal Length | 1998 | J Elam, *Janikowski, *Akers | 63 | 1953 | B Rechichar | 56 |
| F | SG | Passing Yards | 1990 | W Moon | 527 | 1949 | J Lujack | 468 |
| F | S | Interceptions | 1980 | L Hayes, D Sandifer, S Sanders | 13 | 1948 | D Sandifer | 13 |
| F | Co | Games With Touchdown Pass | 1960 | J Unitas | 47 | 1942 | J Unitas | 47 |
| F | SG | Points Scored | 1961 | P Hornung | 33 | 1961 | P Hornung | 33 |
| F | S | Average Rushing Yards/Game | 1963 | J Brown | 133.1 | 1963 | J Brown | 133.1 |
| F | S | Rushing Yards | 2012 | A Peterson | 2096 | 1973 | OJ Simpson | 2003 |
| F | SG | Sacks | 2007 | F Dean, D Thomas, O Umenyiora | 6 | 1983 | F Dean | 6 |
| F | Ca | Receiving Yards | 2010 | T Owens | 15934 | 1993 | J Lofton | 14004 |
| F | Co | Games With Reception | 2008 | Harrison | 190 | 1985 | A Monk | 183 |
| F | Ca | Touchdowns | 2004 | E Smith | 175 | 1997 | M Allen | 145 |
| F | Ca | Receptions | 2012 | *T Gonzalez | 1149 | 2002 | C Carter | 1101 |
| F | Ca | Rushing Yards | 1987 | W Payton | 16726 | 1987 | W Payton | 16726 |
| F | S | Touchdowns | 2005 | S Alexander | 28 | 2005 | S Alexander | 28 |
| F | S | Points | 1960 | P Horning | 176 | 1960 | P Horning | 176 |
| F | C | Points | 2004 | G Anderson | 2434 | 2004 | G Anderson | 2434 |
| F | S | Touchdown Passes | 2004 | *P Manning | 49 | 2004 | *P Manning | 49 |
| F | SG | Rushing Yards | 2003 | J Lewis | 295 | 2003 | J Lewis | 295 |
| F | Ca | Touchdowns | 1999 | D Marino | 420 | 1999 | D Marino | 420 |
| F | Ca | Passing Yards | 1999 | D Marino | 61361 | 1999 | D Marino | 61361 |
| F | Co | Starts | 1979 | J Marshall | 270 | 1979 | Jim Marshall | 270 |
| H | Co | Games Played In Goal | 1926 | G Vezina | 367 | 1926 | G Vezina | 367 |
| H | S | Goals | 1987 | W Gretzky | 87 | 1971 | P Esposito | 76 |
| H | Co | Games With a Point | 1989 | M Lemieux | 46 | 1983 | W Gretzky | 30 |
| H | S | Assists | 1985 | W Gretzky | 135 | 1985 | W Gretzky | 135 |
| H | S | Points | 1982 | W Gretzky | 212 | 1982 | W Gretzky | 212 |
| H | Ca | Assists | 2004 | R Francis | 1249 | 1980 | G Howe | 1049 |
| H | Ca | Points | 2007 | M Messier | 1887 | 1972 | G Howe | 1850 |
B = baseball, BB = basketball, F = football, H = hockey, S = season, SG = single game, Ca = career, Co = consecutive. *denotes active players.
Table A3
Internet sources for the 65 sports records evaluated
| Record Holder | Item | Source |
| C Young | Wins | 1 |
| C Young | Complete Games | 3 |
| D Leonard | Earned Run Average | 1 |
| J Bottomley | Runs Batted In | 2 |
| R Hornsby | Batting Average | 2 |
| W Johnson | Shutouts | 1 |
| T Cobb | Batting Average | 2 |
| H Wilson | Runs Batted In | 1 |
| B Ruth | Slugging Percentage | 1 |
| T Williams | On-Base Percentage | 1 |
| J DiMaggio | Games With Hits | 2 |
| N Ryan | Strikeouts | 2 |
| R Henderson | Stolen Bases | 1 |
| P Rose | Hits | 1 |
| O Hershiser | Scoreless Innings | 2 |
| V Coleman | Cons Stolen Bases | 3 |
| N Ryan | No Hitters | 1 |
| N Ryan | Strikeouts | 1 |
| Cl Ripken | Games Started | 3 |
| B Bonds | Homeruns | 1 |
| B Bonds | Slugging Percentage | 1 |
| R Henderson | Stolen Bases | 1 |
| Ec Gagne | Saves | 3 |
| B Bonds | Walks | 1 |
| Ichiro | Hits | 1 |
| B Bonds | Intentional Walks | 1 |
| B Bonds | Homeruns | 1 |
| W Chamberlain | Rebounds | 3 |
| W Chamberlain | Rebound Average | 4 |
| O Robertson | Triple Doubles | 5 |
| W Chamberlain | Scoring Average | 6 |
| W Chamberlain | Points | 3 |
| W Chamberlain | Rebounds/Game | 4 |
| K Abdul Jabbar | Points | 3 |
| AC Green | Games Played | 7 |
| D Lane | Interceptions | 9 |
| D Brees | Games With Touchdown Pass | 3 |
| G Sayers | Points Scored | 9 |
| OJ Simpson | Average Rushing Yards/Game | 9 |
| E Dickerson | Rusing Yards | 9 |
| D Thomas | Sacks | 9 |
| J Rice | Receiving Yards | 9 |
| J Rice | Games With Reception | 10 |
| J Rice | Touchdowns | 9 |
| J Rice | Receptions | 9 |
| E Smith | Rushing Yards | 9 |
| L Tomlinson | Touchdowns | 9 |
| L Tomlinson | Points | 9 |
| M Andersen | Points | 9 |
| T Brady | Touchdown Passes | 9 |
| A Peterson | Rushing Yards | 9 |
| B Favre | Touchdowns | 9 |
| B Favre | Passing Yards | 9 |
| B Favre | Starts | 3 |
| G Hall | Games Played In Goal | 11 |
| W Gretzky | Goals | 12 |
| W Gretzky | Games With A Point | 13 |
| W Gretzky | Assists | 14 |
| W Gretzky | Points | 14 |
| W Gretzky | Assists | 12 |
| W Gretzky | Points | 14 |
1 – www.baseball-reference.com. 2 – www.baseball-almanac.com. 3 – www.wikipedia.com. 4 – www.basketball-reference.com. 5 – www.examiner.com. 6 – www.hoopsvibe.com. 7 – www.funtrivia.com. 8 – www.mmbolding.com. 9 – www.pro-football-reference.com. 10 – www.hickoksports.com. 11 – http://sportsillustrated.cnn.com. 12 – www.sportscity.com. 13 – www.rauzlusstreet.com. 14 – www.hockey-reference.com.
Table A4
Ranks, scores and year set for the 65 sports records evaluated
| Rank | Record | Sport | Score | Year Record Set |
| 1 | Barry Bonds Career Intentional Walks (688) | Baseball | 0.4848 | 2007 |
| 2 | Nolan Ryan Career No Hitters (7) | Baseball | 0.4773 | 1993 |
| 3 | Joe DiMaggio Consecutive Games With Hits (56) | Baseball | 0.4582 | 1941 |
| 4 | Jim Bottomley Single Game Runs Batted In (12) | Baseball | 0.4552 | 1924 |
| 5 | Oscar Robertson Season Triple Doubles (41) | Basketball | 0.4264 | 1962 |
| 6 | Cy Young Career Wins (511) | Baseball | 0.4151 | 1911 |
| 7 | Wilt Chamberlain Single Game Points (100) | Basketball | 0.4136 | 1962 |
| 8 | Cy Young Career Complete Games (749) | Baseball | 0.4091 | 1911 |
| 9 | Wayne Gretzky Career Assists (1963) | Hockey | 0.4047 | 1999 |
| 10 | Norm Van Brocklin Single Game Pass Yards (554) | Football | 0.3978 | 1951 |
| 11 | Ty Cobb Career Batting Average (0.366) | Baseball | 0.3831 | 1928 |
| 12 | Ted Williams Career On-Base Percentage (0.482) | Baseball | 0.3807 | 1939 |
| 13 | Glenn Hall Consecutive Games Played In Goal (502) | Hockey | 0.3773 | 1962 |
| 14 | Dick Lane Season Interceptions (14) | Football | 0.3769 | 1952 |
| 15 | Ichiro Season Hits (262) | Baseball | 0.3757 | 2004 |
| 16 | Babe Ruth Career Slugging Percentage (0.6898) | Baseball | 0.3753 | 1935 |
| 17 | Cal Ripken Consecutive Games Started (2632) | Baseball | 0.3717 | 1998 |
| 18 | Walter Johnson Career Shutouts (110) | Baseball | 0.3632 | 1927 |
| 19 | Tom Dempsey Single Game Field Goal Length (63) | Football | 0.3620 | 1970 |
| 20 | Dutch Leonard Season Earned Run Average (0.961) | Baseball | 0.3492 | 1914 |
| 21 | Pete Rose Career Hits (4256) | Baseball | 0.3478 | 1986 |
| 22 | Rickey Henderson Career Stolen Bases (1406) | Baseball | 0.3474 | 2003 |
| 23 | Gale Sayers Single Game Points Scored (36) | Football | 0.3383 | 1965 |
| 24 | Wilt Chamberlain Season Scoring Average (50.4) | Basketball | 0.3375 | 1962 |
| 25 | Wilt Chamberlain Single Game Rebounds (55) | Basketball | 0.3373 | 1960 |
| 26 | Rogers Hornsby Season Batting Average (0.424) | Baseball | 0.3336 | 1924 |
| 27 | AC Green Consecutive Games Played (1192) | Basketball | 0.3331 | 1999 |
| 28 | Drew Brees Consecutive Games With Touchdown Pass (54) | Football | 0.3273 | 2012 |
| 29 | Michael Jordan Career Points Per Game (30.12) | Basketball | 0.3265 | 2003 |
| 30 | Wilt Chamberlain Season Rebound Average (27.2) | Basketball | 0.3192 | 1961 |
| 31 | Nolan Ryan Career Strikeouts (5715) | Baseball | 0.3164 | 1993 |
| 32 | Wayne Gretzky Consecutive Games With A Point (51) | Hockey | 0.3132 | 1983 |
| 33 | Brett Favre Consecutive Starts (297) | Football | 0.3064 | 2010 |
| 34 | Wayne Gretzky Career Points (2857) | Hockey | 0.3059 | 1999 |
| 35 | Nolan Ryan Season Strikeouts (383) | Baseball | 0.3044 | 1973 |
| 36 | Orel Hershiser Consecutive Scoreless Innings (59) | Baseball | 0.2981 | 1988 |
| 37 | Vince Coleman Consecutive Stolen Bases (50) | Baseball | 0.2951 | 1989 |
| 38 | John Stockton Career Assists (15806) | Basketball | 0.2899 | 2003 |
| 39 | Kareem Abdul-Jabbar Career Points (38387) | Basketball | 0.2884 | 1989 |
| 40 | Ricky Henderson Season Stolen Bases (130) | Baseball | 0.2768 | 1982 |
| 41 | Jerry Rice Career Receiving Yards (22895) | Football | 0.2767 | 2004 |
| 42 | Derrick Thomas Single Game Sacks (7) | Football | 0.2698 | 1990 |
| 43 | Eric Gagne Consecutive Saves (84) | Baseball | 0.2645 | 2004 |
| 44 | Wayne Gretzky Season Goals (92) | Hockey | 0.2566 | 1986 |
| 45 | Hack Wilson Season Runs Batted In (191) | Baseball | 0.2550 | 1930 |
| 46 | OJ Simpson Season Average Rushing Yards/Game (143.1) | Football | 0.2499 | 1973 |
| 47 | Morten Andersen Career Points (2544) | Football | 0.2482 | 2007 |
| 48 | Wilt Chamberlain Career Rebounds/Game (22.89) | Basketball | 0.2460 | 1973 |
| 49 | Jerry Rice Consecutive Games With Reception (274) | Football | 0.2414 | 2004 |
| 50 | Barry Bonds Season Slugging Percentage (0.8634) | Baseball | 0.2304 | 2001 |
| 51 | Wayne Gretzky Season Points (215) | Hockey | 0.2198 | 1986 |
| 52 | Brett Favre Career Touchdowns (508) | Football | 0.2085 | 2010 |
| 53 | Ladainian Tomlinson Season Points (186) | Football | 0.2069 | 2006 |
| 54 | Jerry Rice Career Receptions (1549) | Football | 0.2058 | 2004 |
| 55 | Emmit Smith Career Rushing Yards (18355) | Football | 0.2025 | 2004 |
| 57 | Eric Dickerson Season Rushing Yards (2105) | Football | 0.2020 | 1984 |
| 58 | Jerry Rice Career Touchdowns (208) | Football | 0.2008 | 2004 |
| 59 | Brett Favre Career Passing Yards (71838) | Football | 0.1826 | 2010 |
| 60 | Adrian Peterson Single Game Rush Yards (296) | Football | 0.1756 | 2007 |
| 61 | Barry Bonds Career Homeruns (762) | Baseball | 0.1723 | 2007 |
| 62 | Tom Brady Season Touchdown Passes (50) | Football | 0.1648 | 2007 |
| 63 | Ladainian Tomlinson Season Touchdowns (31) | Football | 0.1644 | 2006 |
| 64 | Barry Bonds Season Walks (232) | Baseball | 0.1593 | 2004 |
| 65 | Barry Bonds Season Homeruns (73) | Baseball | 0.1239 | 2001 |
Acknowledgments
We wish to thank our two experts Jack McCallum and Thomas “Nus” Hansen for generously taking the time to meet and interact with us while providing their expert opinions throughout the study. We also wish to thank Villanova MBA Fellow Brian Q. Coughlin for his able assistance during this research.
Notes
1 For statistical definitions see the following: http://en.wikipedia.org/wiki/Baseball_statistics, http://en.wikipedia.org/wiki/Basketball_statistics, http://en.wikipedia.org/wiki/Ice_hockey_statistics, http://www.pro-football-reference.com/about/glossary.htm.
References
1 | Alford B., (2004) . Two applications involving the analytic hierarchy process. Master’s Thesis, University of Maryland. |
2 | Bodin L. , Epstein E. , (2000) . Who’s on first-withprobability 0.4.. Computers & Operations Research. 27: (3), 205–215. |
3 | Chen C. , Lee Y. , Tsai C. . Professional baseball team starting pitcher selection using AHP and TOPSIS methods. InternationalJournal of Performance Analysis in Sports. 14: (2), 545–563. |
4 | Decision Lens. 2010. Decision Lens Suite, v1.10.3, Arlington, VA. |
5 | Decision Making Confidence 2013. Kepner-Tregoe decision making: The steps, the pros and the cons. http://www.decision-making-confidence.com/kepner-tregoe-decision-making.html. Accessed August 26, 2013. |
6 | Golden B. , Wasil E. , (1987) . Ranking outstanding sports records. Interfaces. 17: (5), 32–42. |
7 | Lanoue M. , Revetta J. Jr , (1993) . An analytic hierarchy approachto major league baseball offensive performance ratings. Mathematical andComputer Modeling. 17: (4-5), 195–209. |
8 | Mccallum J. , (2012) . Dream Team: How Michael, Magic, Larry, Charles, and the Greatest Team of All Time Conquered the World and Changed the Game of Basketball Forever. (Ballantine Books, New York). |
9 | Mccallum J., (1990) . The record company. Sports Illustrated, January 8. http://sportsillustrated.cnn.com/vault/article/magazine/MAG1069308/index.htm. Accessed August 3, 2013. |
10 | Saaty T. , (1980) . The Analytic Hierarchy Process: Planning, Priority Setting, Resource Allocation. (McGraw-Hill, New York). |
11 | Saaty T. , (2000) . Fundamentals of Decision Making and Priority Theory with the Analytic Hierarchy Process. (RWS Publications, Pittsburgh, PA). |
12 | Sinuany-Stern Z. , (1988) . Ranking of Sports Teams via the AHP. Journal of the Operational Research Society. 39: (7), 661–667. |
13 | Sinuany-Stern Z. , Israeli Y. , Bar-Eli M. , (2006) . Application of the analytic hierarchy process for the evaluation of basketball teams. International Journal of Sports Management and Marketing. 1: (3), 193–207. |
14 | Sporcle 2013. Can you name the professional sports record holders? http://www.sporcle.com/games/BCoughlin829/professional-sports-records-/results. Accessed August 26, 2013. |
15 | Sports Illustrated 2013. Jack McCallum: Archive. http://sportsillustrated.cnn.com/writers/jack_mccallum/archive. Accessed September 9, 2013. |
16 | Sun Y., (2007) . The ranking of football teams using concepts from theanalytic hierarchy process. Master’s Thesis, University of Louisville. |
17 | Vaidya O. , Kumar S. , (2006) . Analytic hierarchy process: An overview of applications. European Journal of Operational Research. 169: (1), 1–29. |
18 | Wang P. , SI L. , (2008) . Quantitative research on high-level basketball players in the medium Term selection indicators based on analytic hierarchy process. Journal of the Jilin Institute of Physical Education. 24: , 76–78. |
19 | Wu L. , (2013) . Research of Basketball Offensive Technical Ability Based onAHP Analysis. Information Technology Journal. 12: (14), 2736–2740. |
Figures and Tables
Fig.1
AHP hierarchy for evaluating sports records.
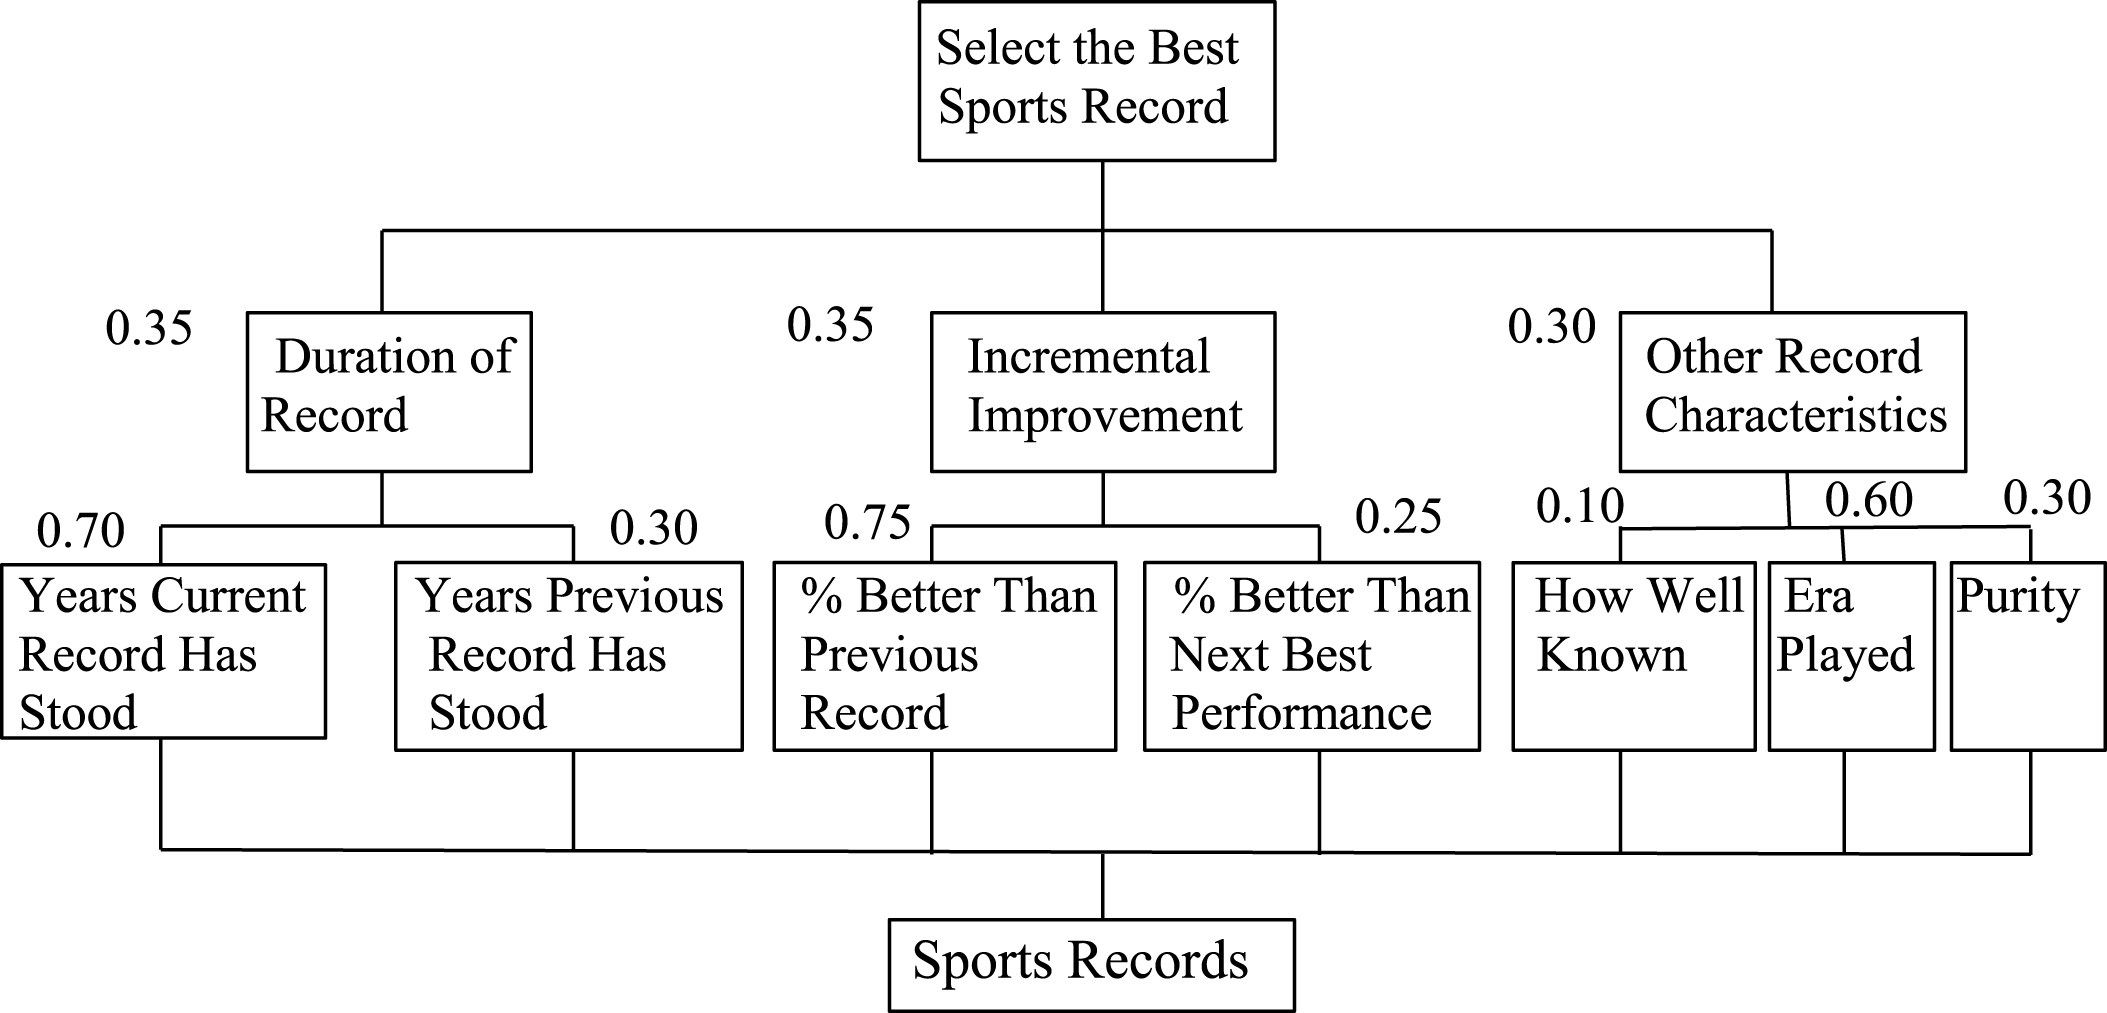
Table 1
A look back at the sports records considered by Golden and Wasil (1987)
| Sport | Athlete | Year | Record | Record holder in 1987 (if different from current) | |
| Season Records | |||||
| Consecutive games with hits | Baseball | Joe DiMaggio | 1941 | 56 | |
| Homeruns | Baseball | Barry Bonds | 2001 | 73 | Roger Maris |
| Slugging percentage | Baseball | Barry Bonds | 2001 | 0.8634 | Babe Ruth |
| Runs Batted In | Baseball | Hack Wilson | 1930 | 191 | |
| Scoring average | Basketball | Wilt Chamberlain | 1962 | 50.4 | |
| Rushing yards | Football | Eric Dickerson | 1984 | 2105 | |
| Points | Football | LaDainian Tomlinson | 2006 | 186 | Paul Hornung |
| Points | Hockey | Wayne Gretzky | 1986 | 215 | |
| Career Records | |||||
| Homeruns | Baseball | Bonds | 2007 | 762 | Henry Aaron |
| Stolen bases | Baseball | Rickey Henderson | 2003 | 1406 | Lou Brock |
| Hits | Baseball | Pete Rose | 1986 | 4256 | |
| Slugging percentage | Baseball | Babe Ruth | 1935 | 0.6898 | |
| Strikeouts | Baseball | Nolan Ryan | 1993 | 5715 | Active at the time |
| Points | Basketball | Kareem Abdul-Jabbar | 1989 | 38387 | Active at the time |
| Points | Football | Morten Andersen | 2007 | 2544 | George Blanda |
| Rushing yards | Football | Emmit Smith | 2004 | 18355 | Walter Payton |
| Consecutive games with touchdown pass | Football | Drew Brees | 2012 | 54 | Johnny Unitas |
| Points | Hockey | Wayne Gretzky | 1999 | 2857 | Gordie Howe |
| Day/Game Records | |||||
| Points | Basketball | Wilt Chamberlain | 1962 | 100 | |
| Rush yards | Football | Adrian Peterson | 2007 | 296 | Walter Payton |
| Pass yards | Football | Norm Van Brocklin | 1951 | 554 | |
| Distance | Track/Field | Mike Powell | 1991 | 29’4 3/8” | Bob Beamon |
Table 2
Criteria pairwise comparison matrix for evaluating sports records
| Duration | Incremental | Other | |
| Duration | 1 | 1 | 1.17 |
| Incremental | 1 | 1 | 1.17 |
| Other | 0.86 | 0.86 | 1 |
Table 3
Pairwise comparison matrix for other record characteristics criterion
| Known | Era | Purity | |
| Known | 1 | 0.17 | .33 |
| Era | 6 | 1 | 2 |
| Purity | 3 | .5 | 1 |
Table 4
Rating categories for the Known subcriterion
| Rating Category | Weight |
| The record is widely known by the general public | 1.00 |
| The record is widely known by sports fans | 0.75 |
| The record is widely known by fans of the particular sport | 0.40 |
| Obscure record that is not widely known by fans of this particular sport | 0.10 |
Table 5
Rating categories for the Era subcriterion
| Rating Category | Weight |
| No impact | 1.00 |
| Minimal impact | 0.75 |
| Moderate impact | 0.40 |
| Strong impact | 0.10 |
Table 6
Rating categories for the Purity subcriterion
| Rating Category | Weight |
| Not aided by teammates | 1.00 |
| Slightly aided by teammates | 0.75 |
| Moderately aided by teammates | 0.40 |
| Greatly aided by teammates | 0.10 |
Table 7
Sample calculations for computing total scores for sports records
| Criterion | Duration | Incremental Improvement | Other Record Characteristics | |||||
| Subcriterion | Years Current | Years Previous | Percent Next | Percent Previous | Known | Purity | Era | Total Score |
| Criterion weight (A) | 0.3500 | 0.3500 | 0.3500 | 0.3500 | 0.3000 | 0.3000 | 0.300 | |
| Subcriterion weight (B) | 0.7000 | 0.3000 | 0.2500 | 0.7500 | 0.1000 | 0.3000 | 0.600 | |
| DiMaggio | ||||||||
| Scores (C) | 0.4983 | 0.0499 | 0.0744 | 0.1338 | 1.0000 | 0.8800 | 1.000 | |
| Weighted Scores (A*B*C) | 0.1221 | 0.0052 | 0.0065 | 0.0351 | 0.0300 | 0.0792 | 0.180 | 0.4582 |
| Jabbar | ||||||||
| Scores (C) | 0.1575 | 0.1007 | 0.0016 | 0.0492 | 0.4000 | 0.8800 | 0.750 | |
| Weighted Scores (A*B*C) | 0.0386 | 0.0106 | 0.0001 | 0.0129 | 0.0120 | 0.0792 | 0.135 | 0.2884 |
Table 8
Top ten records of the four major American professional sports Comparisons by Sport and Record Type
| Rank | Record | Sport | Score | Record Type | Year Record Set |
| 1 | Barry Bonds Career Intentional Walks (688) | Baseball | 0.4848 | Career | 2007 |
| 2 | Nolan Ryan Career No Hitters (7) | Baseball | 0.4773 | Career | 1993 |
| 3 | Joe DiMaggio Consecutive Games with Hits (56) | Baseball | 0.4582 | Consecutive | 1941 |
| 4 | Jim Bottomley Single Game Runs Batted In (12) | Baseball | 0.4552 | Game | 1924 |
| 5 | Oscar Robertson Season Triple Doubles (41) | Basketball | 0.4264 | Season | 1962 |
| 6 | Cy Young Career Wins (511) | Baseball | 0.4151 | Career | 1911 |
| 7 | Wilt Chamberlain Single Game Points (100) | Basketball | 0.4136 | Game | 1962 |
| 8 | Cy Young Career Complete Games (749) | Baseball | 0.4091 | Career | 1911 |
| 9 | Wayne Gretzky Career Assists (1963) | Hockey | 0.4047 | Career | 1999 |
| 10 | Norm Van Brocklin Single Game Pass Yards (554) | Football | 0.3978 | Game | 1951 |
*Bold denotes the top-ranked record in each of the four categories (career, season, game and consecutive).
Table 9
Mean and median ranks for the four types of sports records
| Career | Season | Game | Consecutive | |
| Mean | 31 | 41 | 24 | 29 |
| Median | 31 | 45 | 21 | 32 |
Table 10
Mean and median sports record ranks for the four major American professional sports
| Baseball | Basketball | Football | Hockey | |
| Mean | 26 | 27 | 44 | 34 |
| Median | 21 | 28 | 49 | 34 |
Table 11
Comparison of sports records ranks between GW and our results
| Sport | Athlete | Year | GW Rank (by category) | Our Overall Rank | |
| Season Records | |||||
| Consecutive games with hits | Baseball | Joe DiMaggio | 1941 | 2 | 3 |
| Scoring Average | Basketball | Wilt Chamberlain | 1962 | 3 | 24 |
| Runs Batted In | Baseball | Hack Wilson | 1930 | 4 | 45 |
| Points | NHL | Wayne Gretzky | 1986 | 5 | 51 |
| RushingYards | Football | Eric Dickerson | 1984 | 8 | 57 |
| Career | |||||
| Slugging Percentage | Baseball | Babe Ruth | 1935 | 2 | 16 |
| Hits | Baseball | Pete Rose | 1986 | 10 | 21 |
| Day/Game Records | |||||
| Points | Basketball | Wilt Chamberlain | 1962 | 1 | 7 |
| Passing Yards | Football | Norm Van Brocklin | 1951 | 2 | 10 |
Table 12
Correlation matrix of the AHP sports records scores and subcriterion scores
| AHP Score | Years Current | Years Previous | Percent Next | Percent Previous | Known | Purity | |
| Years Current | 0.529 | ||||||
| Years Previous | 0.077 | –0.297 | |||||
| Percent Next | 0.387 | –0.182 | –0.027 | ||||
| Percent Previous | 0.418 | –0.138 | –0.099 | 0.876 | |||
| Known | 0.107 | –0.066 | 0.116 | 0.022 | –0.013 | ||
| Purity | 0.459 | 0.301 | 0.122 | 0.055 | –0.092 | 0.121 | |
| Era | 0.168 | –0.382 | 0.160 | –0.186 | –0.192 | 0.062 | –0.052 |
Table 13
Original sports record ranks as compared to revised ranks when the subcriterion weight of Percent Next is added to Percent Previous
| Record | Sport | Original Rank | Revised Rank | Difference in Rank |
| Barry Bonds Career Intentional Walks (688) | Baseball | 1 | 1 | 0 |
| Nolan Ryan Career no hitters (7) | Baseball | 2 | 2 | 0 |
| Joe DiMaggio Consecutive games with hits (56) | Baseball | 3 | 4 | –1 |
| Jim Bottomley Single Game Runs Batted In (12) | Baseball | 4 | 3 | 1 |
| Oscar Robertson Season triple doubles (41) | Basketball | 5 | 5 | 0 |
| Cy Young Career Wins (511) | Baseball | 6 | 7 | –1 |
| Wilt Chamberlain Single Game points (100) | Basketball | 7 | 8 | –1 |
| Cy Young Career Complete Games (749) | Baseball | 8 | 9 | –1 |
| Wayne Gretzky Career assists (1963) | Hockey | 9 | 6 | 3 |
| Norm Van Brocklin Single Game pass yards (554) | Football | 10 | 10 | 0 |


