
Smart e-waste management system utilizing Internet of Things and Deep Learning approaches
Abstract
Electronic waste is presently acknowledged as the rapidly expanding waste stream on a global scale. Consequently, e-waste represents a primary global concern in modern society since electronic equipment contains hazardous substances, and if not managed properly, it will harm human health and the environment. Thus, the necessity for more innovative, safer, and greener systems to handle e-waste has never been more urgent. To address this issue, a smart e-waste management system based on the Internet of Things (IoT) and Deep Learning (DL) based object detection is designed and developed in this paper. Three state-of-the-art object detection models, namely YOLOv5s, YOLOv7-tiny and YOLOv8s, have been adopted in this study for e-waste object detection. The results demonstrate that YOLOv8s achieves the highest mAP@50 of 72% and map@50-95 of 52%. This innovative system offers the potential to manage e-waste more efficiently, supporting green city initiatives and promoting sustainability. By realizing an intelligent green city vision, we can tackle various contamination problems, benefiting both humans and the environment.
1.Introduction
A smart city is an advanced ecosystem characterized by integrating information and communications technologies (ICT) to enhance environmental sustainability and citizens’ quality of life [12]. Smart city applications, including personal and home services like remote patient monitoring and utilities and mobile solutions like smart grid, traffic management, and waste management, contribute to creating more intelligent and sustainable urban environments [22]. In this aspect, electronic waste disposal is one of the significant challenges linked with smart city applications, which impacts humans and the environment’s health, making it a notable area of research.
Electronic waste – also called e-waste – is discarded electronic devices that are no longer needed, do not function, or are obsolete. The rapid technological advancement today and increasing consumer demand make lots of electronic devices reach the end of their estimated lifespan after short periods of use.
Nowadays, e-waste is currently recognized as the waste stream experiencing the most rapid growth worldwide, entitled by the United Nations as a “tsunami of e-waste” [16]. As mentioned by Forti et al. [11], global e-waste production reached around 53.6 million metric tons in 2019, with a noticeable increase of 44.4 million metric tons in only five years. The study anticipates that the entire mass of e-waste will increase to 74 million metric tons by 2030. As documented, only 17.4% of collected e-waste is properly recycled.
According to some estimates in Europe, an average household has 72 electronic devices, out of which 11 are either broken or no longer in use [17]. Alongside, Cisco provided in its annual report in 2018 an estimate of 28.5 billion smart devices to be connected to the Internet by 2022 and anticipated that 5% of IoT-enabled devices would be trashed per year by consumers; as a consequence, this could lead to 1.5 billion new e-waste items annually [6].
Thus, e-waste management is a primary growing concern today, especially in developing countries like Palestine. Improper disposal and mishandling of e-waste can lead to hazardous effects on both human health and the environment. Certain e-waste remnants contain toxic and flammable chemicals, such as cadmium, beryllium, lead, and brominated flame retardants, which may easily catch fire in an open environment, thus, threatening lives, increasing diseases, economic loss, and pollution [35]. Hence, the realization of intelligent systems for e-waste management to significantly reduce their harmful effects is of immense importance and has become a hot topic.
Technological advancement and the appearance of novel technologies, i.e., the Internet of Things (IoT) and Deep Learning (DL), facilitate numerous new improvements to the existing infrastructures and systems in various domains. IoT refers to a system of interconnected things (e.g., devices) enriched by the ability to exchange data through the Internet [8]. In contrast, DL offers cutting-edge solutions for comprehensively understanding human behavior [13] and facilitates numerous new improvements to the existing infrastructures and systems in various domains. Considering the e-waste management challenges, implementing IoT and DL solutions is becoming compulsory for smart city vision since it allows objects to interconnect and interact with humans in a pervasive and intelligent way [20].
Convolutional Neural Networks (CNNs) represent a category of deep learning techniques primarily utilized for image processing and object recognition tasks [25]. Integrating CNN, such as YOLO (You Only Look Once) [28], into a smart e-waste management system leads to notable improvements in various aspects. The ability to accurately identify and categorize e-waste items makes resource utilization during recycling more efficient. Properly sorting e-waste at the source enables recycling facilities to streamline operations, reducing labor and processing costs. Moreover, this integration ensures the safe and controlled disposal of potentially hazardous materials in some e-waste, minimizing environmental risks.
This study proposes the design and development of a smart e-waste management system utilizing the IoT and DL based object detection. The proposed system holds the potential to manage e-waste better to support green city initiatives and meet sustainability goals. By realizing a smart green city vision, we will be able to realize numerous human health and environmental contamination problems.
Our proposed system performs e-waste object detection and identification using a pre-trained object detection model within the TensorFlow Lite framework. The model is trained on an electronic object dataset using the concept of transfer learning for e-waste object detection in images. In addition, the system continuously monitors the condition of the e-waste bin, such as the temperature and humidity inside the bin, to detect and prevent fires. Moreover, the system provides up-to-date, real-time information to various stakeholders (i.e., municipalities, service waste managers, and system administrators) regarding e-waste count, e-waste weight/volume, and the filling level of the bin. We have utilized the ThingSpeak cloud platform to store and retrieve all the monitoring data using two main protocols, HTTP and MQTT protocol over the Internet and displayed for system administrators via an interactive Web-based interface (UI).
The remainder of this paper is structed as follows: Section 2 explores the related works on e-waste management. In Section 3, we present our proposed system in detail and in Section 4 we present the used Object Detection model. Finally, Section 5 concludes the work and outlines potential areas for future research.
2.Related work
The majority of waste management articles found in the literature suggest the implementation of smart dustbins or waste bins that prioritize IoT-based segregation and recycling mechanisms for items such as plastic, paper, bottles, and glass.
Abba and Light [1] outline the development and deployment of an IoT-based Arduino microcontroller equipped with ultrasonic sensors. The system’s primary function is to detect the waste level within garbage bins positioned in various locations. It continuously monitors the bin status at regular intervals, displaying information such as “filled,” “half-filled,” or “empty” on an LCD screen. Simultaneously, the microcontroller transmits the content level information to a central web-server system, which graphically displays the garbage bin levels for efficient end-user and authorities remote monitoring.
Haque et al. [14] proposed a waste collection system that monitors waste bins in a designated area, identifying bins that need to be emptied during each collection cycle. It incorporates real-time waste level, odor, condition monitoring, and temperature and humidity tracking, with the information transmitted to the IoT cloud over Wifi for storage and analysis. Based on these factors, the system determines which bins are ready for collection. It utilizes Google API to display the most optimized route for waste collection. In addition, users can remotely monitor real-time data of the bins through the Thingspeak private channel.
Anjanappa et al. [4] developed a smart dustbin capable of autonomously segregating waste into biodegradable and non-biodegradable materials. The system employs components like ESP32 cam, an AI model built with the CNN algorithm, and a NodeMCU microcontroller. The ESP32 cam captures images of the waste thrown into the dustbin, which are then sent to the cloud for analysis by the AI model. Based on the prediction, the NodeMCU module activates a motor connected to the dustbin’s top to open the respective compartment for the waste type. An ultrasonic sensor on the dustbin’s lid measures the distance to determine if the bin is full, sending an alert through ThingSpeak software if needed.
Al Duhayyim et al. [2] proposed the AEOIDLSWM technique. A novel approach that combines artificial ecosystem-based optimization with an improved DL model to facilitate sustainable waste management within the IoT context. The technique leverages IoT-based camera sensors to capture waste images, which are then processed by a microcontroller and classified using a trained CNN module for different waste types (cardboard, glass, metal, paper, plastic, and trash). The waste classification process is enhanced through an improved Residual Network (ResNet) model-based feature extractor, optimized using an AEO-based hyperparameter optimizer. Furthermore, the technique incorporates the Sparse Autoencoder (SAE) algorithm for efficient waste classification.
Overall, researchers that examined waste management have devised several methods; however, e-waste management is still an unresolved issue, with the current focus primarily on monitoring the condition of e-waste bins, such as the e-waste level. A modest number of articles proposed ideas for e-waste management. The remaining section will highly concentrate on what has been published in the literature on smart e-waste management systems.
Kang et al. [19] developed a smart collection system for the Malaysian e-waste management and recycling sector. They designed a smart e-waste collection box for households equipped with ultrasonic sensors to measure the e-waste level. They recorded it in a cloud-based database system called Google Firebase. A backend server was developed that schedules e-waste collectors to pick up e-waste once the box’s volume reaches a specific threshold. In addition, they developed a mobile application for the public end-users to use when they want to dispose of their household e-waste.
Singh et al. [32] presented an e-waste management solution using an IoT-based collection vendor machine (CVM). To use the system, the customer must register and receive a QR code that contains all relevant information about the customer. The customer then attaches the QR code to their e-waste object and deposits it into the CVM. The prototype uses ultrasonic sensors to measure the CVM’s capacity and alert the authorities when it reaches a certain threshold. The e-waste items are collected by a collector and transported to a warehouse for recycling and billing. The project uses the Arduino Uno platform to connect the sensors and gather sensor data.
Ali et al. [3] developed an IoT-based smart e-waste monitoring system that utilizes a DS18B20 temperature sensor and a KY-026 flame sensor to monitor the condition of the e-waste bin. The system also uses an HC-SR04 Ultrasonic sensor to measure the waste level. A Raspberry Pi 3 was employed as a microcontroller to process the input signals and generate the desired output. Additionally, ThingSpeak was utilized as an IoT web platform to enable system administrators to analyze and visualize the collected data.
Ramya et al. [26] present an E-waste management approach designed for classifying e-waste in the IoT-cloud platform. Within the IoT-cloud platform, E-waste images are collected by IoT nodes and stored in cloud data storage. The images are transmitted from the cloud to the base station for e-waste classification utilizing the Fractional Horse Herd Gas Optimization (FrHHGO) algorithm for the routing process. The classification process involves extracting effective features, augmenting them, and combining Fractional Henry Gas Optimization (FHGO) and Horse Herd Optimization Algorithm (HOA)-based Shepherd Convolutional Neural Network (ShCNN) for E-waste classification.
Farjana et al. [9] presented an IoT-based system featuring ultrasonic sensors for real-time e-waste level monitoring. They utilized Machine learning, particularly the Generative Adversarial Network (GAN) algorithm, to distinguish e-waste. Then they applied magnetic field separation on the shredded e-waste to separate metallic and plastic elements. This approach enables efficient recycling, including producing bio-fuel with biochar as a by-product from plastics and solar batteries from metals. The system also utilizes cloud-based platforms for data analysis, utilizing the Autoregressive Integrated Moving Average (ARIMA) to predict future garbage levels, leading to improved waste collection schedules.
Madhav et al. [31] proposed a mobile robot that utilizes transfer learning to identify household electronic waste. As an attachment to existing municipality garbage trucks, it moves autonomously and captures individual photographs of waste materials at collection points. The robot employs deep learning, specifically a Modified ResNet 50 network, to identify e-waste. It then uses its arm-based lift and storage mechanism to segregate them. At the end of the collection, the robot moves back into the truck and stores the collected waste in a designated isolated space.
Sampedro et al. [29] proposed a smart e-waste bin that utilizes YOLOv4, an object detection model, and Raspberry Pi 3 to identify the types of e-waste, including cellphones, chargers, batteries, and others. The bin segregates the waste and provides e-wallet credit to the user. All transactions are logged in a server, which enables operators to monitor usage and determine when e-waste collection is necessary via an admin dashboard. The bin’s crediting and monitoring functionalities are facilitated through GSM and WIFI modules.
Rani et al. [27] suggested an IoT-based mobile e-waste management system for smart campuses. The system involves using a Raspberry Pi 3 microcontroller to identify e-waste objects in an image by employing a Single Shot Multibox Detector Lite-MobileNet-v2 model that was trained on the Microsoft Common Objects in Context dataset. Additionally, the system keeps track of the e-waste count and bin percentage level. The monitoring data is stored on a cloud platform, and an interactive Android-based mobile user interface was created to display the monitored data.
Table 1 summarizes the mentioned studies related to e-waste management systems based on provided functionalities, hardware and software components used, and the role of the cloud server.
Table 1
Summary of e-waste management systems found in literature: provided functionalities, components used, and cloud server role
| Provided functionalities | Used components (Software/Hardware) | Cloud servers | |
| [19] | - E-waste level measurement. - Collector notification via email to dispatch the e-waste when the volume reaches a certain threshold. - End-user mobile app to 1) send the disposed e-waste data (e.g., image) and 2) show the nearest e-waste collection box. | [Arduino, Wi-Fi module, HC-SR04 ultrasonic sensor, Portable power bank] | - Google Firebase cloud database server stores monitoring data. - Administrative server calculates the level of disposed e-waste. |
| [32] | - A platform for users who want to sell their e-waste. - Measure the capacity of CVM. - Send an alert message to the authorized collector at a certain threshold point. - User can locate the nearby vending machines via mobile app. | [SR04 ultrasonic sensors, Arduino Uno, HC-05 Bluetooth Module, Motor and Motor Driver, Obsolete mobile] | - Amazon web services (AWS) cloud processes and stores all incoming data from various CVM and send alert message to Admin, and Collector. |
| [3] | - Provides up-to-date information on the waste level and bin’s current temperature. - Notify admin whenever a bin has filled up to a certain level or in case of fire via a dashboard. | [HC – SR04 Ultrasonic sensor, DS18B20 temperature sensor, KY- 026 flame sensor, Raspberry Pi 3, Wi-Fi module] | - ThingSpeak: 1) stores data for future use and 2) provides a dashboard for instant visualizations of data. |
| [26] | - IoT nodes sense and collect the E-waste images and send them to the cloud. - Base station performs the process of E-waste classification on images fetched from the cloud. | [FrHHGO-based ShCNN approach, IoT nodes senses (cameras)] | - A cloud data storage that stores E-waste images. |
| [9] | - Image processing using GAN algorithms for classifying waste as e-waste or not. - E-waste level in the trash bin are continuously monitored. - Generates a message alerting the collectors when the bin reaches its maximum capacity. - Forecasting e-waste level using ARIMA algorithm. - Provides a web or mobile application to visualize the data. - E-waste is separated into plastic and metallic parts using a magnetic field. | [Microcontroller, ultrasonic sensor, ESP-8266 Wi-Fi Module, SIM900A GSM module, FPGA, Camera, GAN, ARIMA] | - A cloud-based technology that 1) monitors and updates the garbage level automatically (time series database) and 2) generates insights and predictions. |
| [31] | - Mobile robot 1) takes photographs of waste materials within a collection point, identifies e-waste, and categorizes them using CNN and transfer learning and 2) collects e-waste and sends them into a collection truck. | [Bluetooth-enabled webcam, Modified ResNet 50 network] | - On-device processing only |
| [29] | - Perform e-waste type identification based on the captured image (i.e., cellphone, battery, charger, or others). - A servo motor drops e-waste to its correct bin. - Points are sent into the user’s e-wallet after each e-waste deposit. - The system records all transactions for the operator to view through an admin dashboard. | [Raspberry Pi 3 Model B, Raspberry Pi Camera, servo motor, YOLO4, TFT LCD module, GSM900, ESP8266 WiFi module] | - A cloud server stores the summary of the e-waste deposit process. |
| [27] | - E-waste object detection in an image. - Monitoring e-waste count and bin percentage level. - Sends an automatic e-mail notification to the waste collector whenever e-waste bin percentage level exceeds the predetermined threshold value. - E-waste collectors can track the condition and location of bins from a website. | [Raspberry Pi 3, 5 MP Pi camera, (SSD)Lite-MobileNet-v2 model trained on MSCOCO dataset, IR sensor] | - ThingSpeak cloud platform stores all monitoring data and provides instant visualizations. |
Nonetheless, the e-waste management systems reported in the literature do not fully explore the integration of object detection with thorough and detailed monitoring aspects of the e-waste bin; the majority only focus on one of those in their systems. In fact, object detection is not well explored in the e-waste management domain. By utilizing Tables 1 and 2, a comparison can be drawn between the proposed system and other related works, highlighting the unique contributions and advancements of the proposed approach in bridging the gap by integrating state-of-the-art object detection techniques, such as YOLOv8, with comprehensive monitoring of e-waste bins.
In this paper, we propose a smart e-waste management system that integrates various sensors for monitoring the current condition of bins and a TensorFlow Lite framework to train a deep learning model to perform real-time e-waste object detection, providing a more comprehensive view of the e-waste management process. By combining object detection and detailed monitoring, the system will not only improve the efficiency of e-waste collection and management but also provide valuable data for policymakers and researchers to understand better and address the issue of e-waste. Overall, the proposed system has immense potential to contribute to the sustainable management of e-waste significantly.
3.The proposed system
3.1.System architecture
Figure 1 illustrates the overall architecture of our proposed system. It uses 1) a Raspberry Pi 4 microcontroller for performing e-waste object detection and identification, 2) an Electron Particle kit with 3-G cellular connectivity that is responsible for: a) continuously monitoring the condition of the e-waste bin, such as the temperature, and humidity inside the bin, to detect and prevent fires from happening, b) providing up-to-date real-time information to different stakeholders (i.e., municipalities, service waste manager, system administrator) regarding e-waste count, e-waste weight/volume, and the filling level of the bin.
Fig. 1.
Proposed smart e-waste management system architecture.
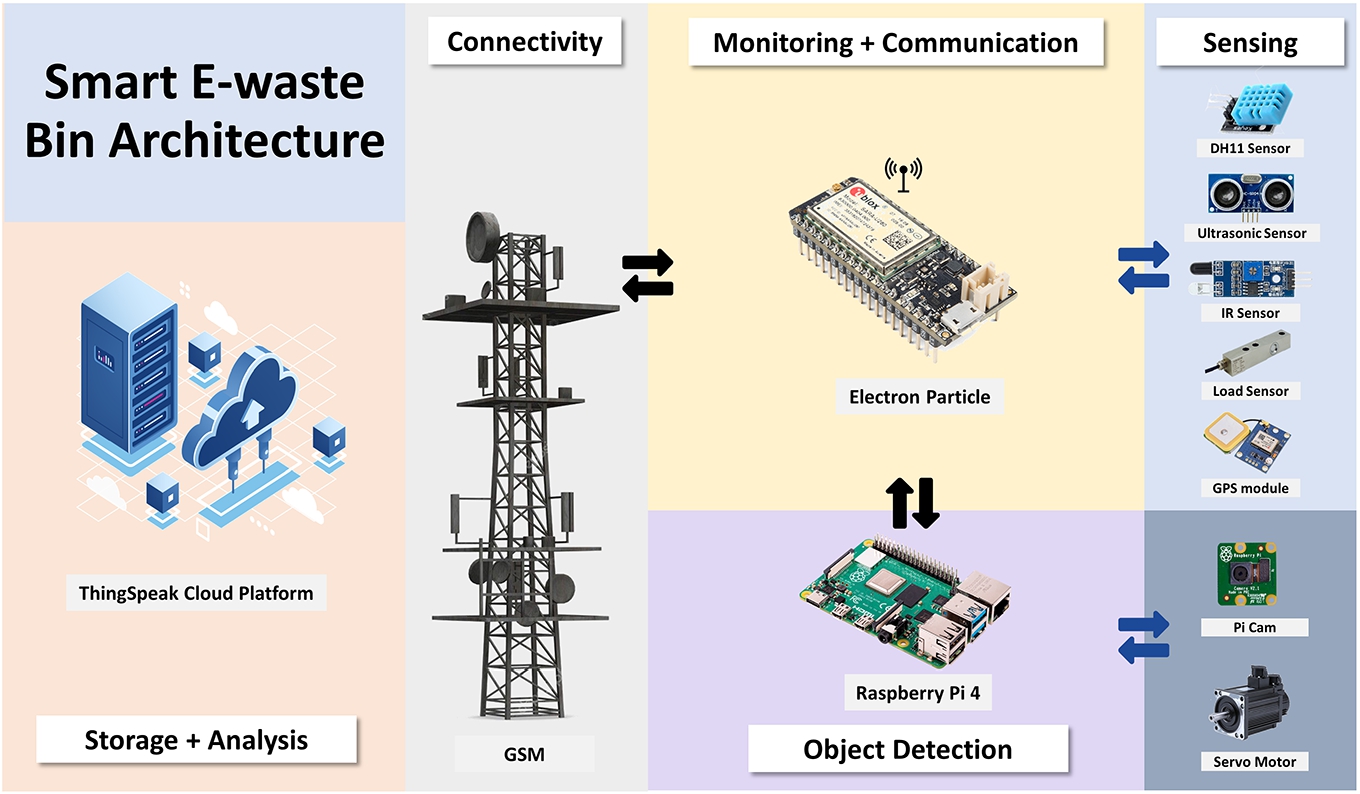
This project uses the TensorFlow Lite application programming interface (API) to run the model trained on an electronic object dataset for image e-waste object detection. In addition, we utilized the ThingSpeak cloud platform to store and retrieve all the monitoring data using two main protocols: Hypertext Transfer Protocol (HTTP) and Message Queuing Telemetry Transport (MQTT) protocol over the Internet. An interactive Web-based interface displays stored data to system administrators.
3.2.System components
Table 2 lists all the components and modules used in our project, with their corresponding functionalities. These components work together to form an integrated system to achieve smart, green, healthy, and sustainable environments and cities. Regarding the interactive mobile applications for collector trucks and users, we will defer their development for future implementation.
Table 2
System components with their corresponding functionalities in the smart e-waste bin
| Components | Functions | |
| Sensors / Modules | Ultrasonic sensor | Measures the percentage filling level of e-waste within a bin. |
| Flame sensor module | Detects fire inside the e-waste bin. | |
| Temperature / Humidity sensor | Measures the temperature and humidity within a bin. | |
| Predicts an upcoming fire or non-favorable events. | ||
| Gas sensor | Identifies the presence of harmful gas. | |
| Load sensor | Measures the actual weight of collected e-waste. | |
| Infrared sensors | Counts e-waste objects being thrown in a bin. | |
| GPS module | Provides location identification of waste bin (latitude, longitude) and real-time of the bin from the satellite. | |
| Ensures the physical security of the bin. | ||
| Camera module | Captures real-time images of e-waste object → an input data for pre-trained e-waste object detection model. | |
| Microcontrollers | Raspberry Pi | Connectivity control over devices (camera + servo motor). |
| Perform real-time e-waste object detection. | ||
| Particle Electron | Provides connectivity control over devices (sensors + GPS module + DC motor). | |
| Forwards sensed data to the cloud server for further processing and analysis via 3-G communication. | ||
| Actuators | Servo motor | Actuates the opening and closing of the e-waste cap. |
| Water pump dc motor | Works as a water sprinkler when a fire is detected. | |
| Network | GSM module | A communication technology to perform data transmission to the cloud server. |
| Power model | Solar panel-based power bank | Operates the smart bin anywhere. |
| E-waste object detection model | A deep learning model trained on electronic object images dataset using YOLOv8s and TensorFlow Lite framework. | |
| User module | LCD display unit | Notifies user of bin status (working/damaged/under maintenance, filling level, and available capacity). |
| If the current bin is full → it directs the user to the next bin that has the required capacity, works properly, and satisfies the shortest path. | ||
| Mobile App for collector trucks/authorizes | Displays the Optimized route for collecting e-waste bins. | |
| Notifies for any upcoming fires or non-favorable events. | ||
| Mobile App for users | Visualizes bin locations on a map and bin status. | |
| Displays the shortest path to the nearest empty e-waste bin. | ||
| Cloud server module | ThingSpeak | Storing received bins data (location, status). |
| Enables authorities for real-time monitoring. | ||
| Database and web servers | Predicting filling levels of bins. | |
| Forecasting of the future waste generation (i.e., the total volume of e-waste in different areas on a different period basis). |
3.3.System workflow
This subsection describes the working mechanisms of the proposed smart e-waste bin as follows:
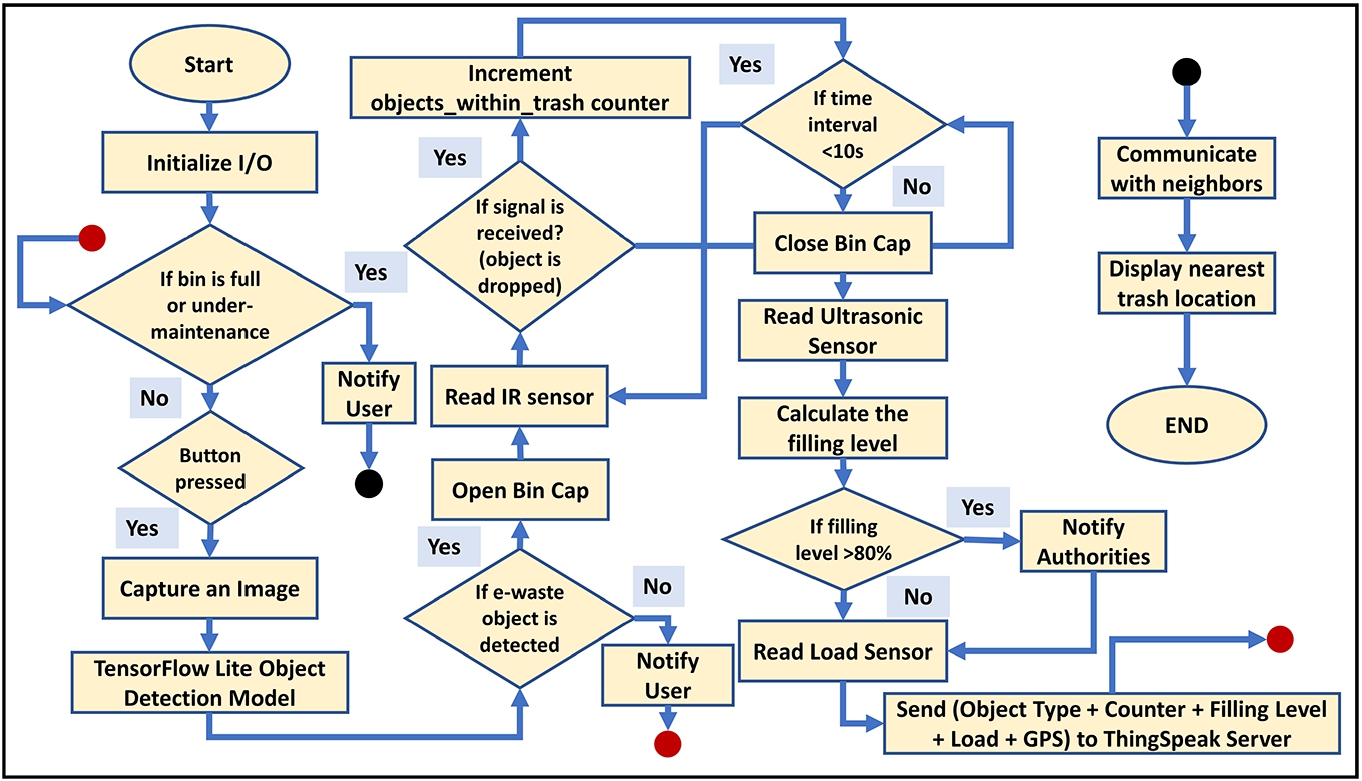
1) The system starts by checking if every component (i.e., sensors) is working correctly and examines the filling level of the trash bin. Suppose the system needs maintenance or the trash bin is full. In that case, it will communicate with its neighbors (trash bins in the neighborhood) via a GSM module embedded within Particle Electron Kit and try to retrieve different information, such as their locations, working status, filling level, etc. This information will be used to find the trash bin that satisfies the shortest path to the user and holds the required capacity. Then the system will display all the information regarding the nearest trash bin to the user through an LCD. The purpose of doing this is to provide convenience and accessibility to the user when disposing of e-waste. The system ensures that individuals avoid traveling long distances or searching for disposal locations with available space. Consequently, this saves the user time and effort, making the e-waste disposal process more convenient and user-friendly.
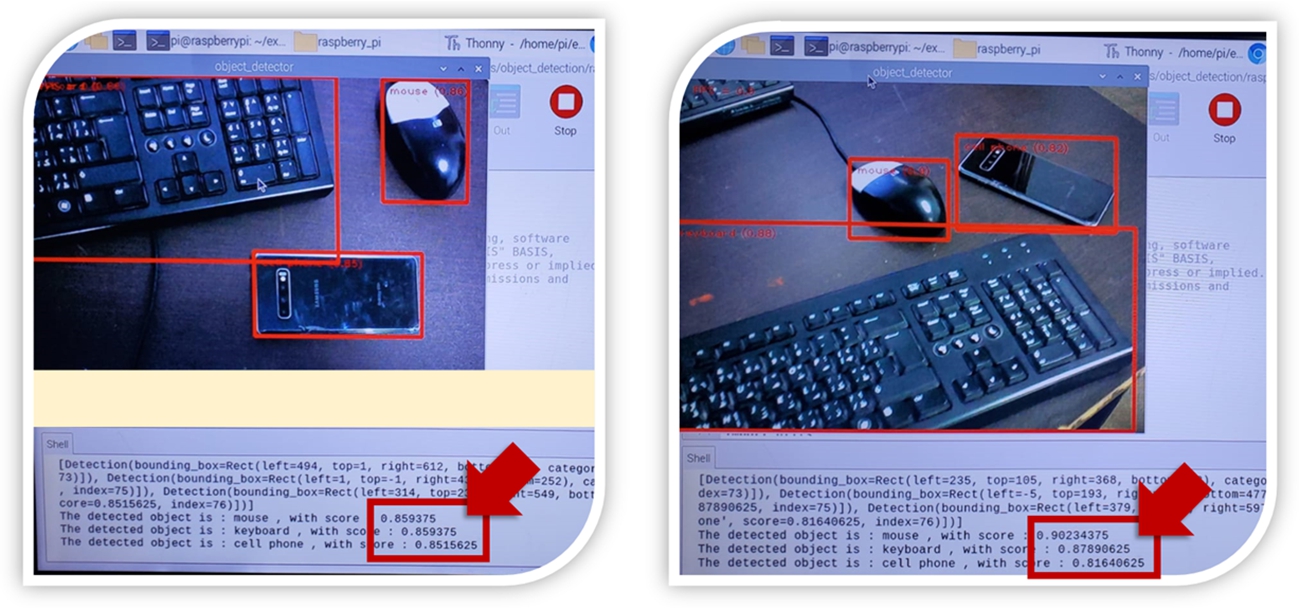
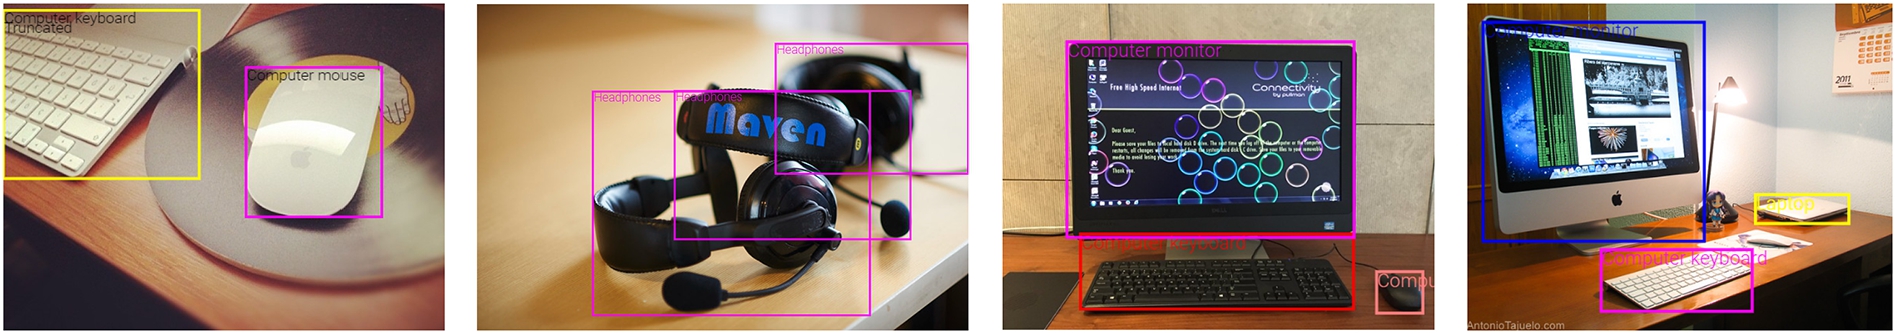
2) If the system works properly and the filling level does not exceed a predefined threshold, it will accept waste in its compartment. Suppose the user presses the ‘run’ button. In that case, the system begins by capturing an image of the waste object using a five-megapixel (5 MP) Pi camera connected to the Raspberry Pi and located above the trash bin. Then the TensorFlow Lite API will take the waste object image as input and run the object detection model for object detection and identification. If e-waste is detected, a servo motor controlled by the Raspberry Pi will actuate the opening container lid. Figure 2 shows the results of e-waste object detection for some electronic devices, based on the quantized object detection model, run by TensorFlow Lite API. In Fig. 2b, the keyboard is detected with a score of 87%. The mouse is detected with a score of 90%, and the smartphone is detected with a score of 81%, respectively. The score indicates confidence that the object was genuinely detected.
Fig. 2.
E-waste object detection results on mouse, keyboard, and smartphone.
3) An infrared sensor will count the number of e-waste objects thrown in the trash bin (refer to Fig. 3). The basic concept of an IR Sensor is to transmit an infrared signal by an IR light-emitting diode; if an obstacle appears in front of the LED, this infrared signal bounces from the surface of an object and is received at the infrared receiver (photodiodes or phototransistors). In this project, we gave 10 seconds duration to this process to ensure the counting of every e-waste object thrown. Then, the same servo motor will actuate the closing of the container lid.
Fig. 3.
Amount of e-waste being thrown inside the bin and the bin’s filling level.
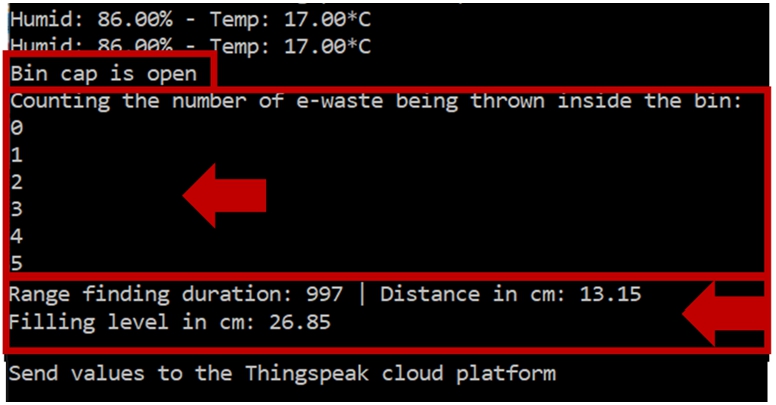
Fig. 4.
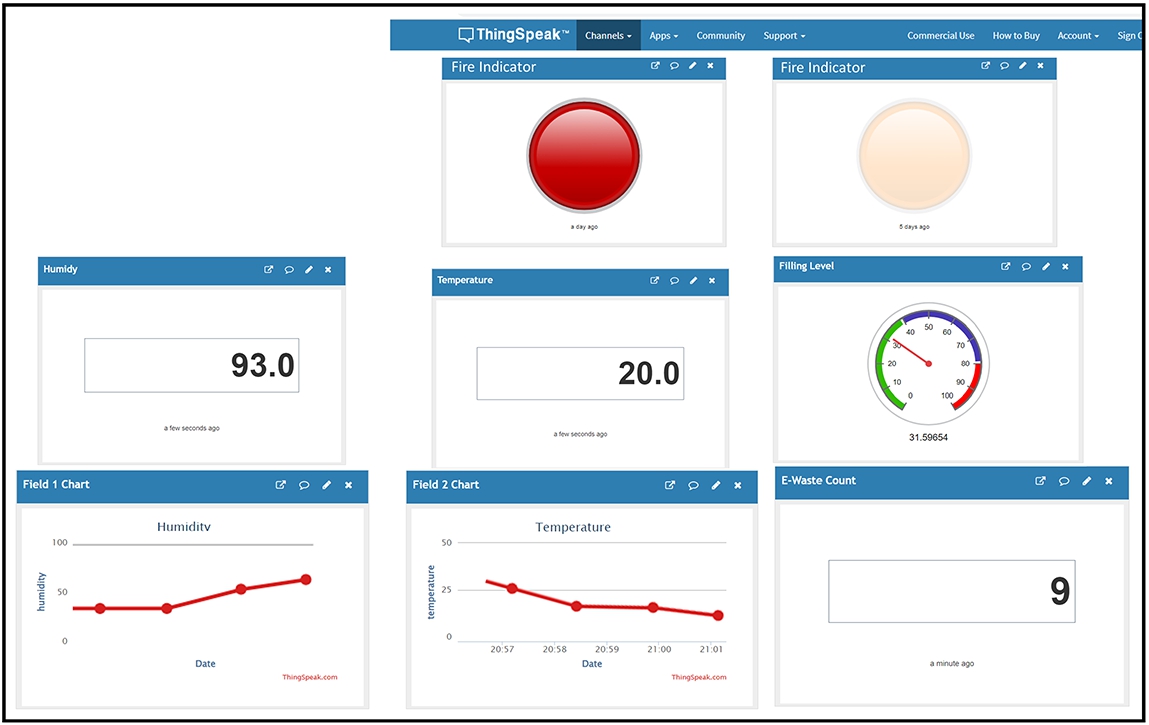
ThingSpeak dashboard showing various monitored data, such as e-waste count, filling level, fire indicator, temperature, and humidity.
4) Once the container lid is closed, an ultrasonic sensor (HC-SR04) will calculate the filling level of e-waste inside the trash bin (refer to Fig. 3). This data is utilized to determine when the bin needs to be emptied, ensuring timely waste collection and preventing overflow situations. In addition, it can be used to optimize waste collection schedules, enabling efficient and effective waste disposal practices. The filling level is determined based on the distance between the sensor and the e-waste objects. In this aspect, the ultrasonic sensor works by emitting eight ultrasonic wave bursts at a frequency of 40 kHz, which are then reflected back to the sensor’s receiver. The travel time of the signal is calculated, along with the speed of sound, to determine the filling level of waste inside the bin.
5) The waste status inside the bin is defined into three fill-up levels (low 0–40, medium 40–80, and high 80–100). If the filling level exceeds a certain level (threshold value of 80% full), the system will notify the system administrator through an SMS and an automatic email notification via SMTP. Thus, we can guarantee prompt collection of e-waste when the waste level reaches its maximum fill.
6) Afterward, the load sensor converts the load or force acting on it into an electrical signal representing the actual weight of e-waste.
7) Finally, the e-waste types (i.e., keyboard, mouse, etc.), e-waste count, bin filling level, e-waste weight, and bins location through the GPS module will be sent to the ThingSpeak cloud platform using HTTP and MQTT protocols over the Internet via a GSM cellular module as a network interface, which is embedded within the Electron Particle kit. These collected pieces of information can be used to predict bins level and forecast total e-waste volume from the specific area on different time bases (i.e., monthly, yearly); this enables municipalities to make smart decisions when planning to handle future waste management for the smart city. Figure 4 presents ThingSpeak Dashboard showing various monitored data, such as e-waste count, filling level, fire indicator, temperature, and humidity. Figure 5 depicts the processes outlined in steps 1 through 7.
Fig. 5.
General workflow of the proposed smart e-waste bin (steps 1 to 7).
8) In the background, a flame sensor is utilized to detect heat flame in the range of 760–1100 nanometer wavelength, with a detection range of up to 100 cm, thus, detecting and preventing any fire that could lead to an explosion. This introduced capability may save significant losses of economy and life. When a heated flame is detected, the system will run water sparkling and send an emergency alert to the system administrator.
9) In addition, a temperature and humidity sensor (DH11) is used as a fire prevention mechanism, which helps in predicting an upcoming fire or non-favorable events. When the system notices an increase in temperature, it will send an immediate indication that will be displayed on the ThingSpeak webpage or dashboard. The system will promptly notify the administrator to address the designated e-waste bin (Fig. 4). Figure 6 depicts the processes outlined in steps 8 through 9.
Fig. 6.
General workflow of the proposed smart e-waste bin (steps 8 and 9).
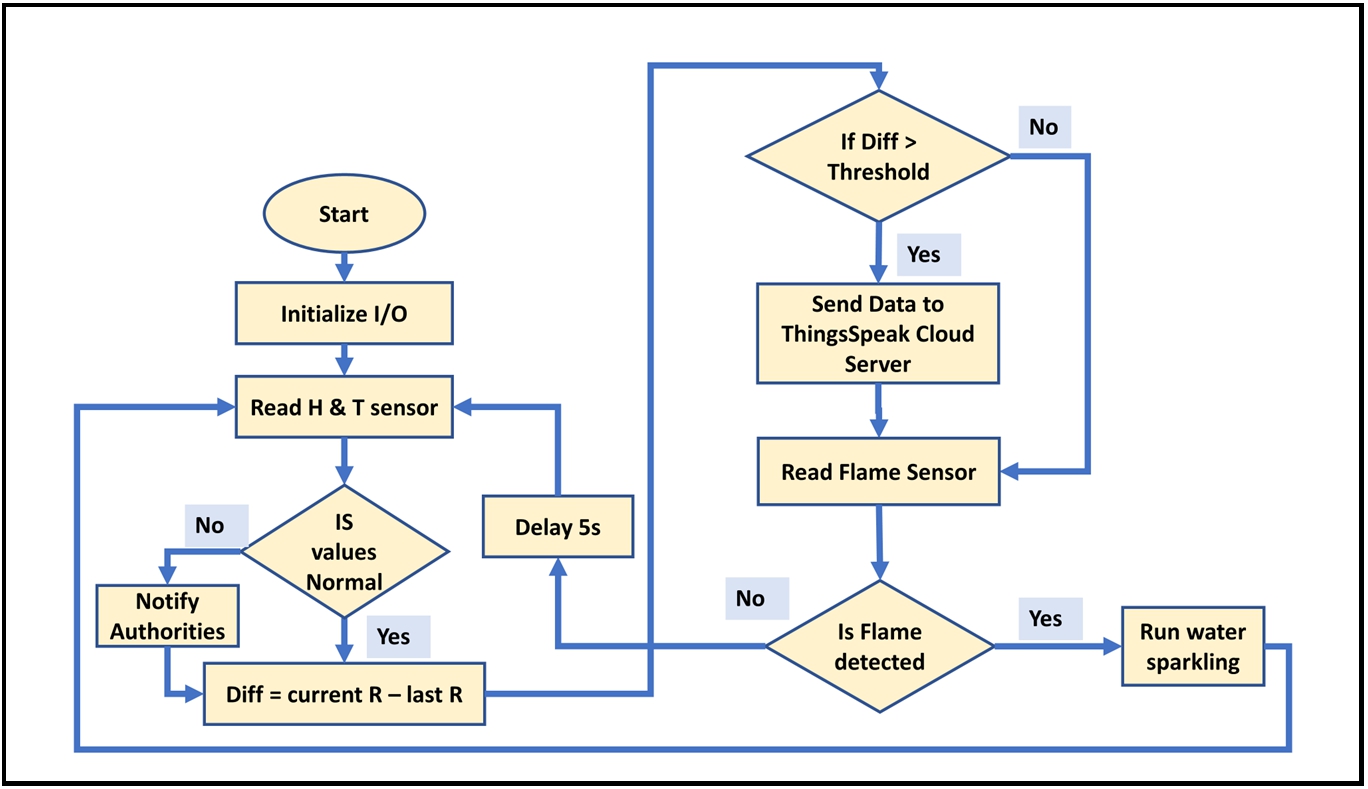
The ultrasonic, infrared, and load sensors will only work when e-waste is disposed of. In addition, we will send the values of humidity and temperature sensors to the ThingSpeak platform only when the difference between the current and the last reading increases above a threshold value. The utilized approach mimics an energy-efficient way to operate the smart e-waste bin.
3.4.Prototype implementation (hardware)
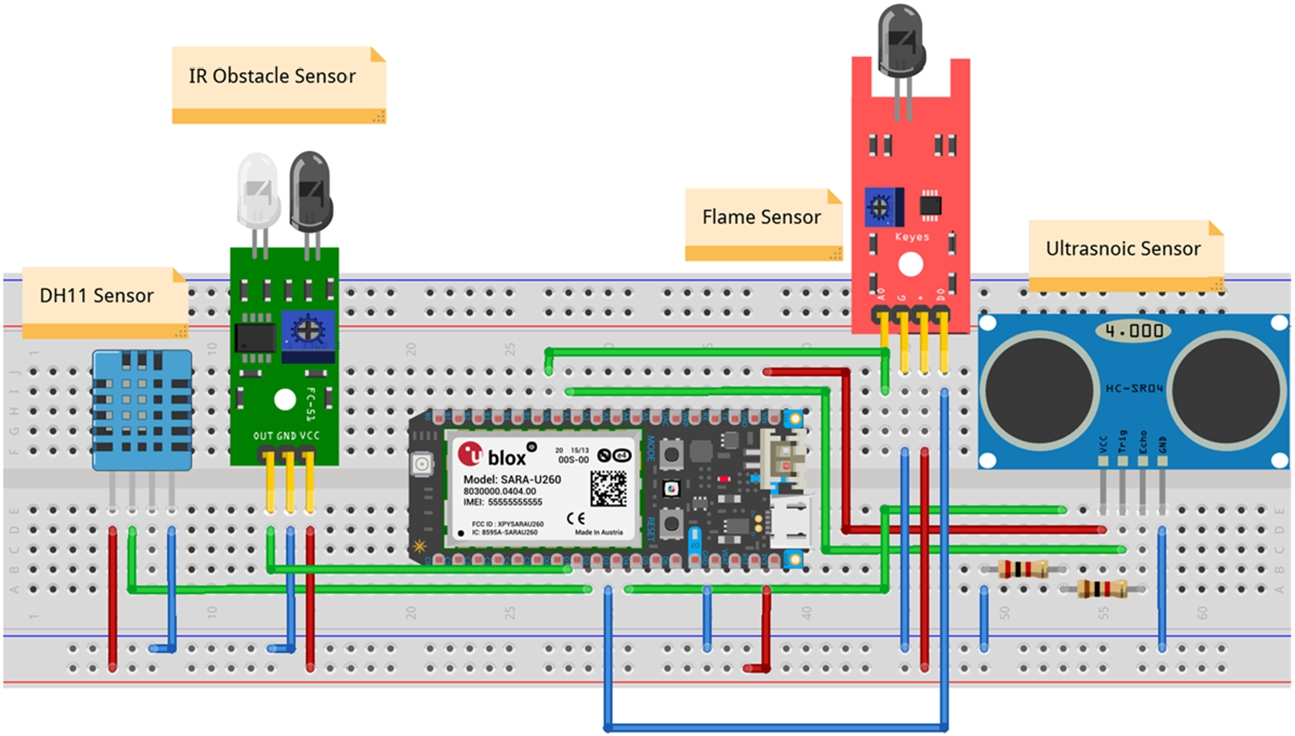
The smart system was successfully developed as a proof-of-concept in this work, and it could be a promising step toward enhancing e-waste management. Figure 7 shows a schematic diagram for a part of the proposed smart e-waste bin. The diagram presents some hardware used to operate the smart e-waste system, a Particle Electron Kit with four main sensors, namely HC-SR04 ultrasonic sensor, DH11 humidity and temperature sensor, IR Flame module, and Infrared obstacle sensor. The main aim of this part is to measure the filling level of the trash bin and keep track of the amount of e-waste being deposited. In addition, predicting potential fire incidents or unfavorable events, such as a significant increase in the temperature within the bins.
Fig. 7.
Schematic diagram for a part of the proposed smart e-waste bin, which shows a Particle Electron Kit with four main sensors.
3.5.System cost
Table 3 outlines the total cost of developing the proposed system. This cost is reasonable given that the system reduces the need for manual labor in traditional waste management practices, resulting in decreased overall waste management costs.
Table 3
Overall system development cost
| Components (amount = 1) | Cost |
| Ultrasonic Sensor – HC-SR04 | 4$ |
| IR Obstacle Sensor | 3$ |
| IR Flame Sensor Module | 2$ |
| Grove – Temperature and Humidity Sensor (DHT11) | 7$ |
| GPS Module | 12$ |
| PARTICLE Electron with Cellular 2G Connectivity Kit | 110$ |
| Raspberry Pi 4 | 60$ |
| Solar Panel with power bank | 44$ |
| Pi Camera | 20$ |
| Servo Motor | 8$ |
| Overall System Cost | ∼270$ |
4.Object detection model
The present study outlines six key stages for developing object detection, namely: determining the computing paradigm (cloud, fog, or local) for object detection; selecting the deep learning framework (TensorFlow Lite); choosing the model and architecture for object detection; selecting the method for obtaining the dataset; training the object detection model and determining the method for exporting the trained model to a hardware application.
4.1.Cloud, fog, or local computing
Recently, various IoT projects utilized cloud computing and fog computing due to the limitation of computing power and the battery life faced by current technologies. Both approaches can shift the vast amount of data and computation previously processed locally in the device to the fog or remote cloud nodes. Compared to cloud computing, fog computing achieves superior latency and faster response time in IoT systems [37].
However, performing fog computing by transmitting images for e-waste object detection to the fog node is not suitable for our project for the following reasons: For our proposed approach, we will utilize GSM communication for data transmissions, which has the desirable range characteristics (i.e., several kilometers between the GSM module and the tower) suitable to be implemented in the e-waste trash bin since these bins will be scattered along with the city. However, since the Pi camera in our project will capture a 5MP image of e-waste objects with a file size of 15 MB, fog computing will not be suitable in our case since GSM has limited data rates per channel. Consequently, this will result in higher latency and reduce the response time compared with the processing on the device. Table 4 illustrates the typical transfer time to upload an image of 15 MB in size via different GSM standards, further emphasizing the inefficiency of offloading processing tasks to external fog nodes.
Table 4
Transfer time of 15 MB image via different GSM network types when considering a 15% amount of overhead attached to the payload packet
| Network type | Typical upload speed (Mbps) [30] | Transfer time [10] (hh:mm:ss) |
| 3G | 0.4 | 00:04:41 |
| 3G HSPA+ | 3 | 00:01:00 |
| 4G LTE | 5 | 00:00:28 |
| 4G LTE-Advanced | 10 | 00:00:14 |
In contrast, on-device processing offers numerous efficiency and cost-effectiveness advantages. It reduces latency and increases response time, lowers data usage with limited bandwidths, enhances privacy and security by keeping data locally, and ensures better offline functionality in areas with limited connectivity. Moreover, on-device processing can lead to significant cost savings, as it eliminates the need for costly server infrastructure and cloud services, making it a compelling approach for our objectives [5].
In addition, with the development of TensorFlow Lite (TFLite), we can convert and optimize any object detection model for deployment on mobile devices such as raspberry pi and Android. Thus, processing object detection on the local device is more resource-efficient and assists in making data-driven decisions faster.
We will use the cloud platform mainly to store the collected data (i.e., filling level, e-waste object count, e-waste object type, bin weight, humidity, temperature, etc.) and perform further analysis (e.g., predictive models).
4.2.Choosing a deep-learning framework
In our project, we have chosen TensorFlow Lite for one main reason. A typical object detection model typically requires a powerful Graphical Processing Unit (GPU) to perform efficiently. However, such a requirement is unsuitable for a smart e-waste management system that utilizes a low-power embedded mobile device like a Raspberry Pi. Fortunately, TensorFlow Lite enables the use of object detection models on these constrained resources.
TensorFlow Lite is a deep learning framework that is open-source and can be used across different platforms. It transforms pre-trained models into an optimized portable format called FlatBuffers, identifiable by the .tflite file extension, that can be tailored for speed or storage [24]. In essence, TensorFlow Lite is a collection of tools that facilitates on-device machine learning, particularly on devices with limited computational and memory resources. Consequently, developers can execute their models on mobile, embedded, and IoT devices, including Linux-based embedded devices like Raspberry Pi or microcontrollers. Since models at resource-constrained devices need to be lightweight and have low latency, the amount of computation required for prediction must be reduced. TensorFlow Lite addresses this challenge by employing two optimization methods: quantization and weight pruning. Quantization involves reducing the precision of the numbers used to represent various TensorFlow model parameters, thereby reducing the model’s weight (e.g., 32-bit floating points weights can be converted to 8-bit floating or integer points). On the other hand, weight pruning involves removing parameters within a model that have minimal impact on the model’s performance [21].
TensorFlow Lite model addresses five key constraints: 1) low latency by eliminating the round-trip from the device to the server, 2) privacy protection by ensuring that personal data is not shared across the network, 3) no need for permanent internet connectivity, 4) reduced model and smaller binary size, 5) efficient power consumption as the inference is made locally irrespective of network connectivity [15].
4.3.Choosing an architecture for object detection
To identify the most effective model architecture for detecting e-waste, three latest cutting-edge, single-stage object detection deep learning models are deployed and compared, YOLOv5s, YOLOv7-tiny and YOLOv8s.
The authors of YOLO [28] have introduced a novel approach to object detection by reframing the problem as a regression task rather than a classification task. They utilize a convolutional neural network to simultaneously predict both the bounding boxes and class probabilities for all objects present in an image, hence they have named it as You Only Look Once (YOLO). Compared to other single-shot detectors, YOLO generally achieves superior performance in terms of both speed and accuracy [7]. YOLO has undergone several revisions (YOLOv2 through YOLOv8) that have resulted in improvements in various areas, including modifications to the loss function, changes to network design, scaling of input resolution, and adaptations to anchor boxes [34].
YOLOv5 represents an evolutionary step within the YOLO family of object detection models. This updated version incorporates a Cross Stage Partial Network (CSPNet) backbone and integrates a path-aggregation neck (PANet). Unlike previous YOLO iterations that were modifications of the original Darknet framework, YOLOv5 is built entirely from scratch using PyTorch. Furthermore, it incorporates mosaic data augmentation and automatic learning of bounding box (BB) anchors to enhance the speed and accuracy compared to previous versions [23].
YOLOv7 is a recent YOLO version that was released in July 2022. According to the official YOLOv7 article [36], it is the fastest and most accurate real-time object detection model for computer vision tasks. YOLOv7 surpasses all known object detectors in both speed and accuracy in the range from 5 FPS to 160 FPS and has the highest accuracy 56.8% AP among all known real-time object detectors with 30 FPS or higher on GPU V100.
YOLOv8 is the newest state-of-the-art YOLO model that can be used for object detection, image classification, and instance segmentation tasks [33]. It was developed by Ultralytics, who also created the influential and industry-defining YOLOv5 model. YOLOv8 features a new backbone network and a design that makes it easy to compare model performance with older models in the YOLO family. It is designed to be fast, accurate, and easy to use, making it an excellent choice for a wide range of object detection and tracking, instance segmentation, image classification and pose estimation tasks [18].
4.4.Dataset collection and preparation
To train the pre-trained object detection model, we have collected around 4000 images along with their .txt label files of four electronic object types, namely Monitor, Keyboard, Mouse, and Headphone, from the Open Images Dataset V7 [25]. Open Images Dataset is a collaborative release that comprises around nine million images annotated with image-level labels, object bounding boxes, object segmentation masks, localized narratives and visual relationships. Regarding the .txt label files, they contain the coordinates of objects bounding boxes with their associated classes.
To ensure equal e-waste class coverage, we collected one thousand images per e-waste type with different backgrounds, orientations, and lighting conditions. In this study, we randomly selected 75% of the original images as the training set (3000 images), 15% as the validation set (600 images), and 10% as the test set (400 images). Additionally, we used stratified sampling to preserve the percentage of samples for each class in the training, testing and validation data.
In order to prepare the images for model training, some pre-processing steps are needed. First, auto-orientation is applied to straighten out any tilted or off-axis images. Second, the images are resized to meet the
Fig. 8.
Some annotated images from the Open Images Dataset v7.
4.5.Training phase
Experimental setup In this study, we carried out model training on Google Colab. Google Colab is a cloud-based service that utilizes Jupyter Notebook for machine learning tasks. It offers a runtime environment specifically tailored for deep learning and provides free access to powerful GPU resources. We used the concept of transfer learning to simplify training YOLOv5s, YOLOv7-tiny and YOLOv8s models using a custom dataset.
Transfer learning is a technique that takes an already trained model for a related task as input and uses it as the starting point to create a new custom model [14]. Retraining a model with a custom dataset reduces the required training data and will shorten the training time. In addition, transfer learning enables object detection even if the dataset is small.
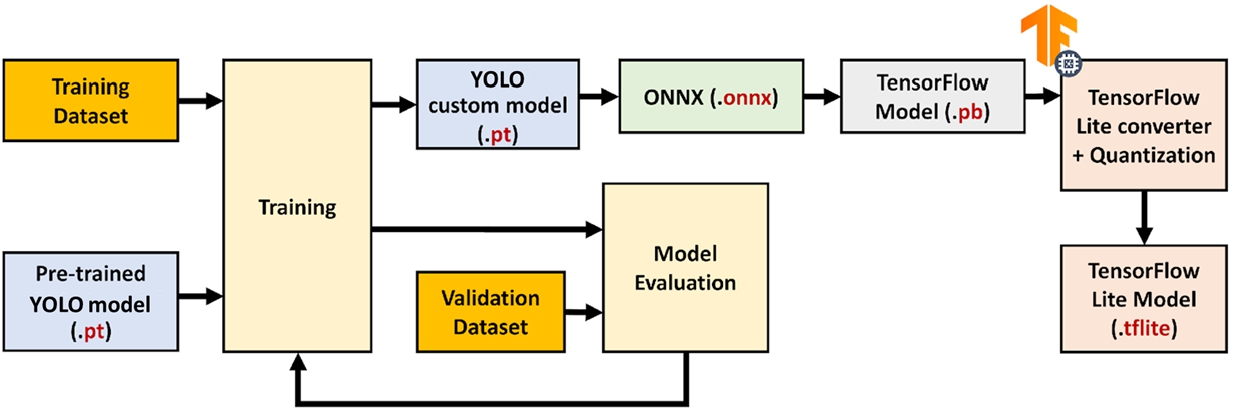
Before training, the image size is set to 640, and a batch size of 16 is configured. The model is initialized with pre-trained weights from YOLOv5s, YOLOv7-tiny and YOLOv8s. The training process is conducted for a total of 100 epochs. After training, the YOLO model is optimized for Raspberry Pi usage through a conversion process. Initially, the model is converted to TensorFlow format using ONNX (Open Neural Network Exchange), and subsequently, it is further converted to TensorFlow Lite (TFLite). This ensures compatibility and efficient deployment on Raspberry Pi for use in object detection. Figure 9 shows the pipeline for developing the TensorFlow Lite object detection model needed for the proposed system.
Fig. 9.
Pipeline for developing the e-waste TensorFlow Lite object detection model.
Evaluation metrics The evaluation of object detection models involves various metrics to assess their performance. We utilized the following metrics in our evaluation:
1- Precision: refers to the ratio of true positives (objects correctly identified) to the total number of objects predicted by the model. It measures how accurate the model’s predictions are.
2- Recall: quantifies how well the model can detect all objects of a particular class by calculating the fraction of true positives of all objects in that class. It represents the model’s ability to identify relevant objects.
3- F1-score: a harmonic mean of precision and recall, and it is a way of balancing the two metrics and providing an overall measure of the model’s performance.
4- mAP@50: The mAP@50 (mean Average Precision at an Intersection over Union (IoU) threshold of 0.5) is a commonly used metric in object detection tasks. It calculates the average precision across different object categories by computing the area under the precision-recall curve for each category and then taking the mean across all categories.
5- mAP@50-95: This metric provides a more comprehensive evaluation of the model’s performance by considering multiple IoU thresholds. It involves varying the IoU threshold from 0.5 to 0.9 with a step size of 0.05 and calculating the average precision for each threshold. The mAP@50-95 is then obtained by averaging the AP values across all the IoU thresholds.
These metrics collectively assess the accuracy, detection capability, and overall performance of object detection models, enabling a comprehensive evaluation of their effectiveness in identifying and classifying objects.
Furthermore, loss functions such as box loss and classification loss are employed to assess the model’s utilization and retention of data.
4.6.Training / object detection results
Loss functions In the analysis of YOLOv5s, YOLOv7-tiny and YOLOv8s models, the behavior of box loss and classification loss for the training set as the number of epochs increases is examined. All algorithms show a decreasing pattern, indicating that they effectively model the training dataset.
Fig. 10.
The loss functions over 100 epochs of YOLOV7 and YOLOV8 models.
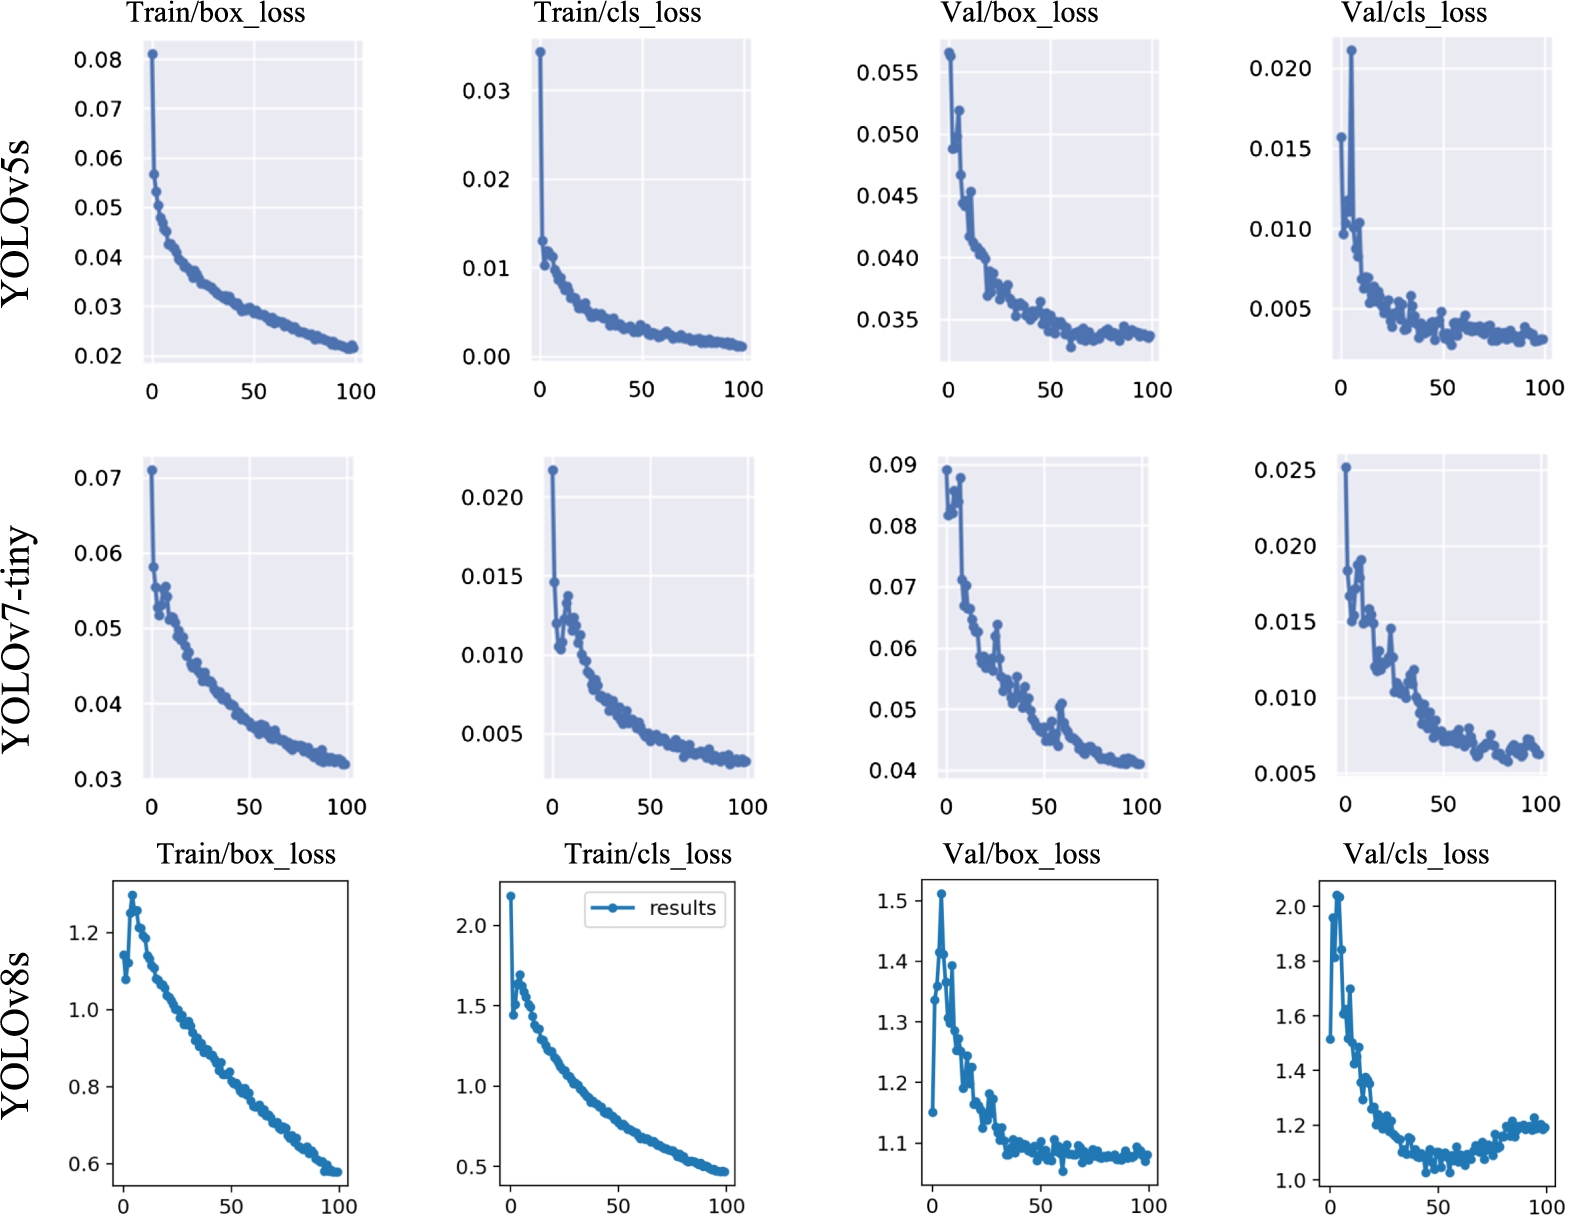
The box and classification losses for the validation set also demonstrate a similar decreasing trend in YOLOv5s and YOLOv7-tiny, suggesting that the model improves its ability to predict bounding boxes and classify objects accurately. This positive trend signifies the model’s learning process. By extending the number of epochs, there is potential for further refinement and fine-tuning of the model. However, in the case of YOLOv8s, it is observed that the loss functions reach a point where they either stabilize or gradually increase during training, indicating the presence of an overfitting problem. With epoch = 100, the loss functions are summarized in Fig. 10. Fortunately, in YOLOv5s, YOLOv7-tiny and YOLOv8, we can access the best-performing version (model weighs with the highest performance) for later use in evaluation or deployment.
Performance metrics With each epoch, as the loss parameters of the model gradually decrease towards their minimum values, there is generally a corresponding improvement in precision, recall, and evaluation metrics such as mAP@50 and mAP@50-95 scores. This relationship is depicted in Fig. 11, where the upward trend of these metrics demonstrates the model’s increasing performance and ability to accurately detect objects.
Fig. 11.
The performance metrics over 100 epochs of YOLOv5s, YOLOv7-tiny and YOLOv8s models.
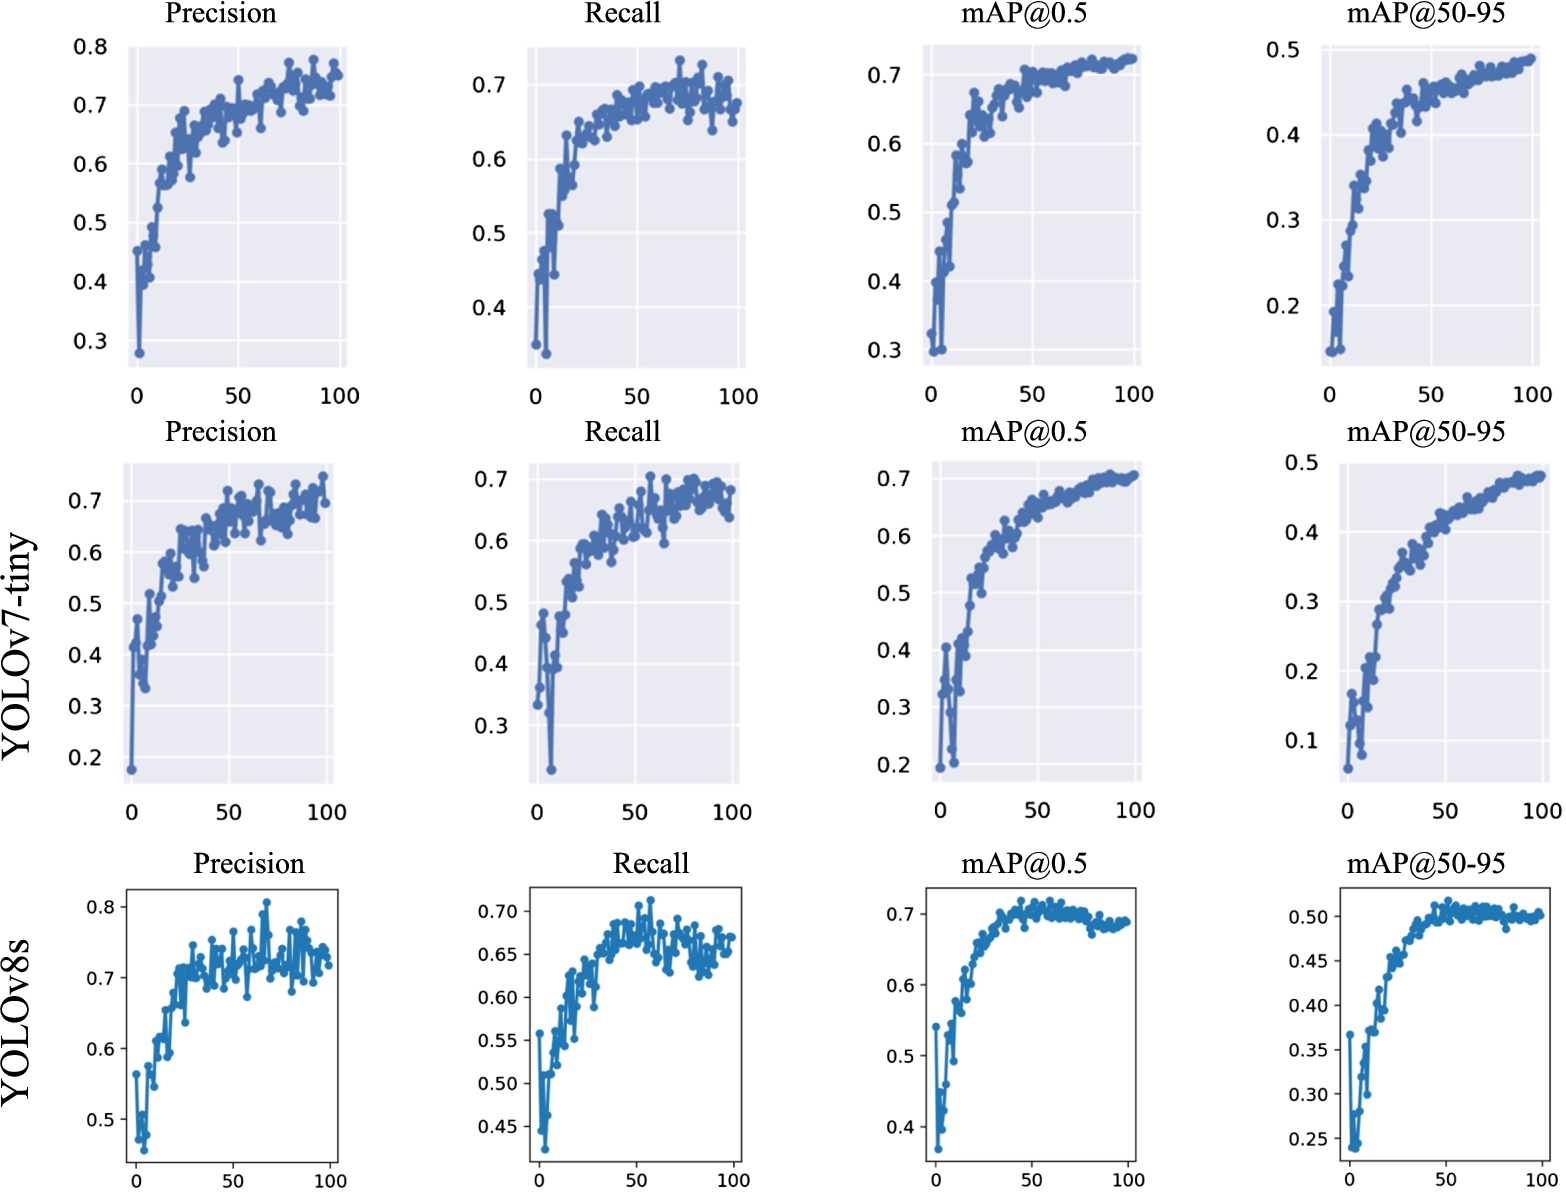
Table 5 summarizes the overall performance metrics of YOLOv5s, YOLOv7-tiny and YOLOv8s, as well as the performance of specific classes for each model on the validation set.
Table 5
Performance metrics of YOLOv5s, YOLOv7-tiny and YOLOv8s models on validation set
| Class | Precision | Recall | F1-score | mAP@50 | mAP@50-95 | |
| YOLOv5s | All | 0.748 | 0.679 | 0.712 | 0.723 | 0.49 |
| keyboard | 0.756 | 0.737 | 0.746 | 0.735 | 0.536 | |
| monitor | 0.719 | 0.663 | 0.690 | 0.675 | 0.404 | |
| mouse | 0.855 | 0.687 | 0.762 | 0.799 | 0.641 | |
| Headphones | 0.663 | 0.63 | 0.646 | 0.683 | 0.378 | |
| YOLOv7 | All | 0.696 | 0.682 | 0.689 | 0.705 | 0.481 |
| keyboard | 0.697 | 0.767 | 0.730 | 0.731 | 0.516 | |
| monitor | 0.668 | 0.655 | 0.661 | 0.664 | 0.416 | |
| mouse | 0.712 | 0.752 | 0.731 | 0.775 | 0.636 | |
| Headphones | 0.708 | 0.556 | 0.623 | 0.652 | 0.356 | |
| YOLOv8s | All | 0.706 | 0.71 | 0.708 | 0.720 | 0.518 |
| keyboard | 0.707 | 0.796 | 0.726 | 0.749 | 0.562 | |
| monitor | 0.676 | 0.682 | 0.679 | 0.683 | 0.562 | |
| mouse | 0.772 | 0.775 | 0.773 | 0.809 | 0.697 | |
| Headphones | 0.67 | 0.599 | 0.633 | 0.637 | 0.386 |
According to Table 5, YOLOv5s got the highest precision and lowest recall. Having the highest precision means that the model has a low rate of false positives; It is cautious in making predictions and tends to be more accurate when identifying an object. On the other hand, having the lowest recall means that the model may miss some objects or have a high rate of false negatives; It is more likely to overlook particular objects or fail to include them in its predictions. On the other hand, YOLOv8s achieved a good balance between both metrics with the highest recall; This signifies that the model can accurately identify many objects while minimizing the number of missed detections.
Comparing the mAP@50 values, YOLOv8s and YOLOv5s achieved a comparable score of 0.72 and 0.723, respectively, whereas YOLOv7-tiny attained a value of 0.705. Similarly, when considering the mAP@50:95 values, YOLOv5s and YOLOv7-tiny achieved 0.49 and 0.481, respectively, while YOLOv8s achieved a higher score of 0.518. These results highlight that YOLOv8s outperforms others in terms of both metrics, which indicates that YOLOv8s demonstrates an improved ability to detect objects accurately across a broader range of IoU (Intersection over Union) thresholds. Similar performance results are achieved on the test set (refer to Table 6).
Table 6
Performance metrics of YOLOv5, YOLOv7 and YOLOv8s models on test set
| Precision | Recall | F1-score | mAP@50 | mAP@50-95 | |
| YOLOv5s | 0.752 | 0.679 | 0.714 | 0.722 | 0.514 |
| YOLOv7-tiny | 0.755 | 0.709 | 0.731 | 0.659 | 0.469 |
| YOLOv8s | 0.742 | 0.708 | 0.725 | 0.735 | 0.529 |
Confusion matrix In order to gain a detailed understanding of the model’s predictions for different classes, we can visualize the confusion matrix. Figures 12 to 14 display the confusion matrices for YOLOv5s, YOLOv7-tiny, and YOLOv8s, which provide a distribution of all predictions during the validation stage of each model.
Fig. 12.
Confusion matrix of YOLOv5s model.
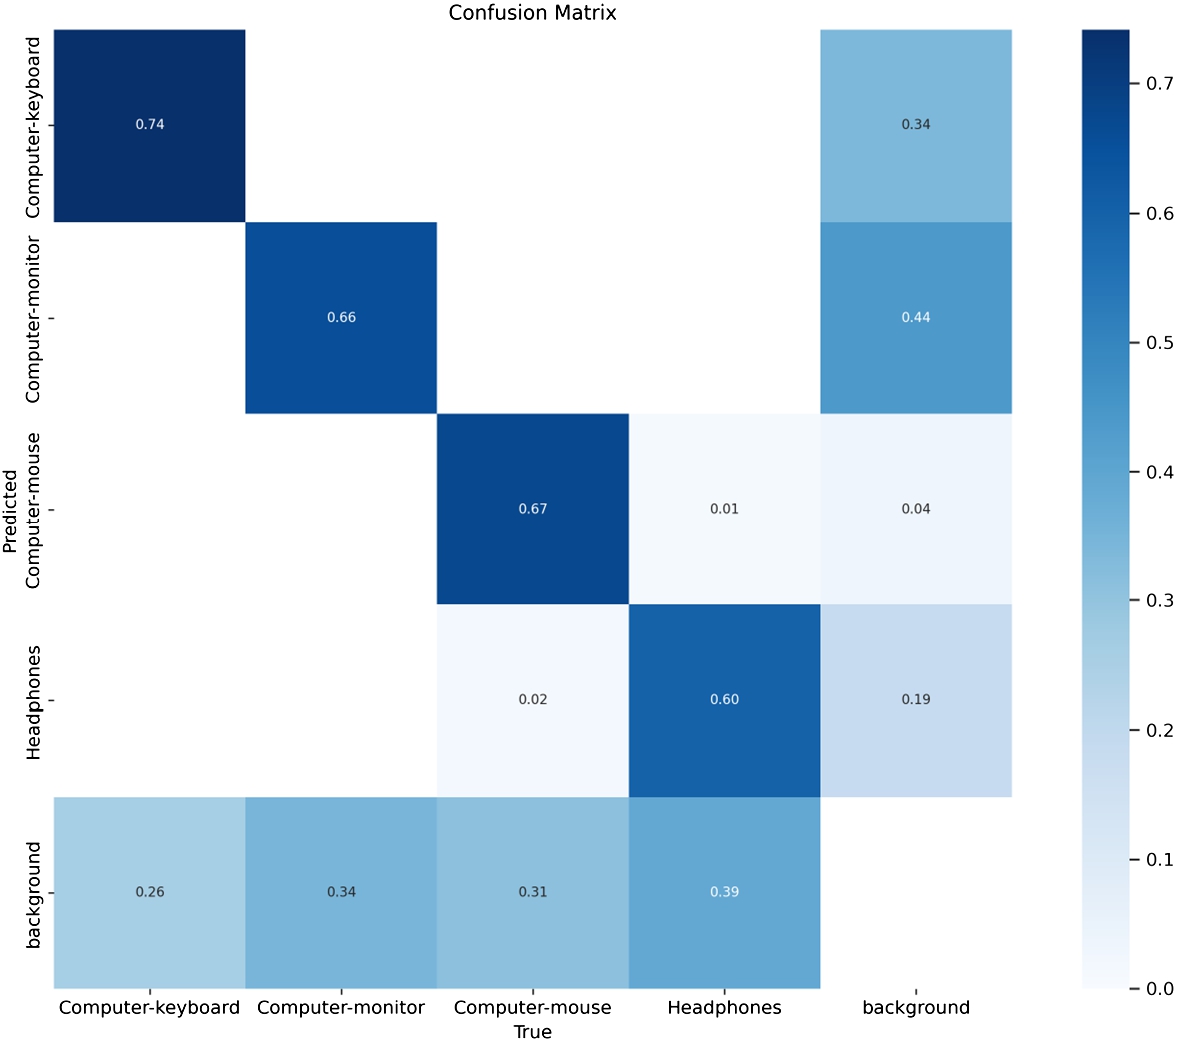
Fig. 13.
Confusion matrix of YOLOv7-tiny model.
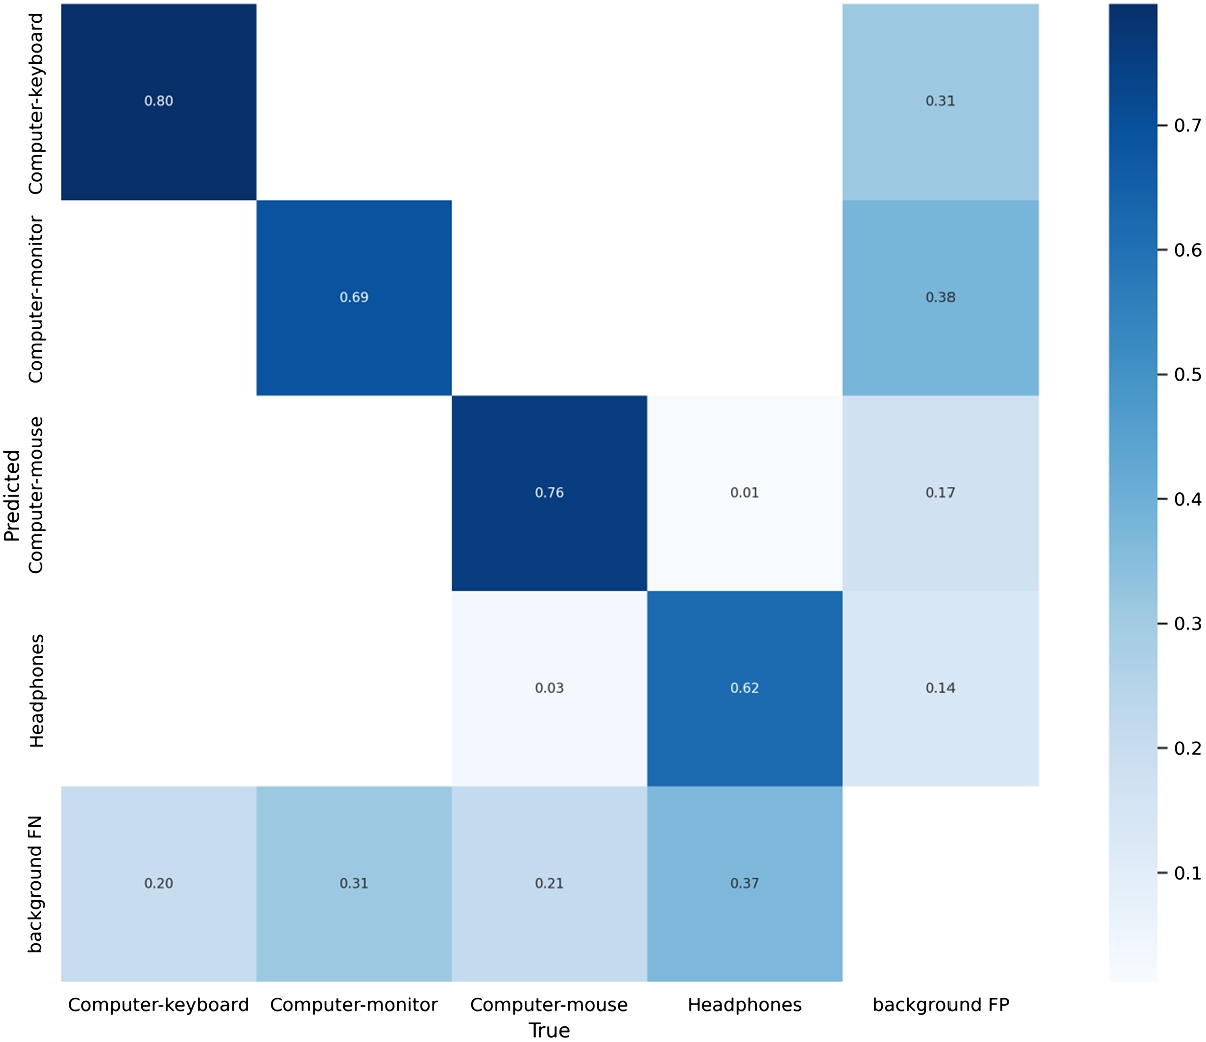
Fig. 14.
Confusion matrix of YOLOv8s model.
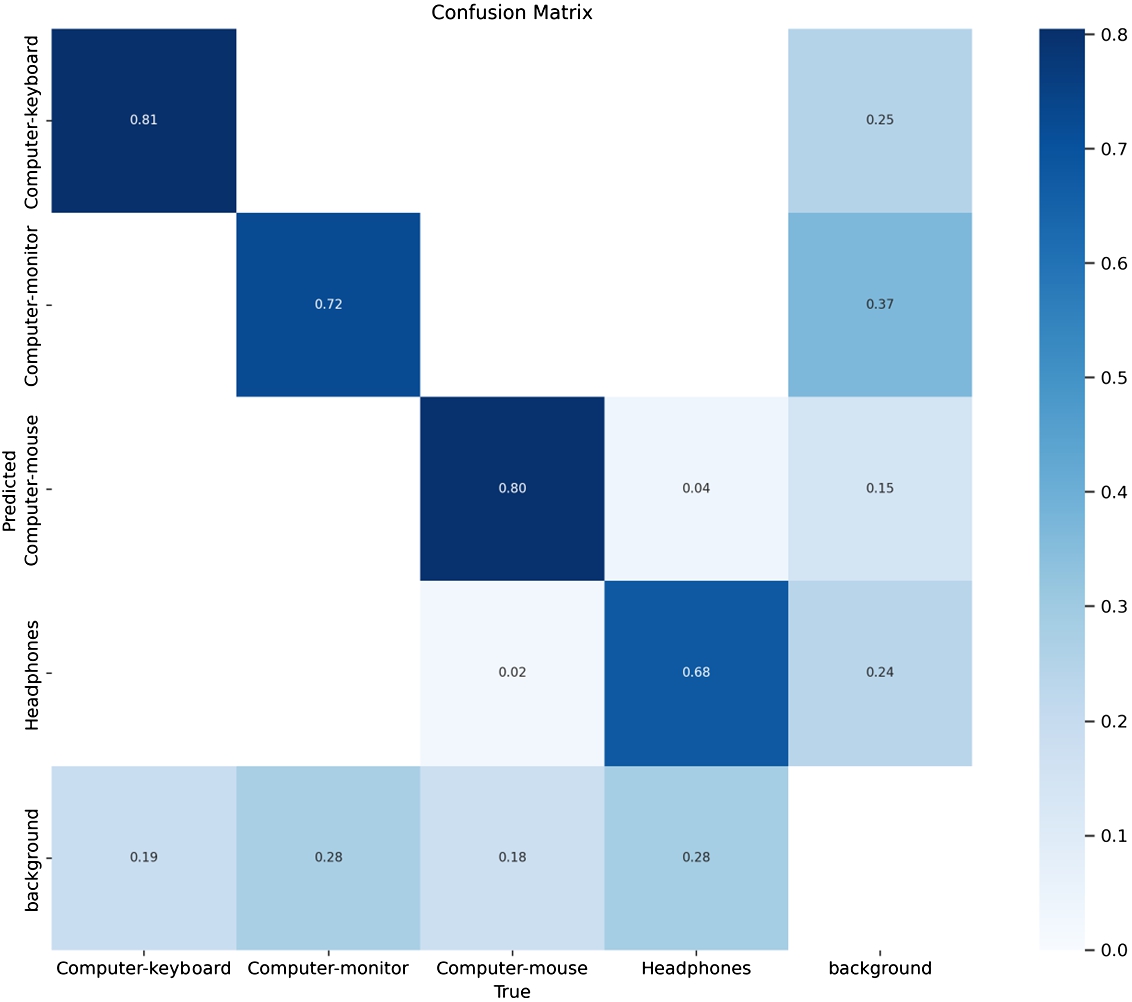
By examining the confusion matrices, we can observe that the majority of predictions fall along the main diagonal, which indicates that the models have successfully classified the ground truth objects and their corresponding predicted counterparts for e-waste classes. Interestingly, as we progress to the subsequent versions of YOLO, namely YOLOv5s, YOLOv7-tiny, and YOLOv8s, we observe improvements along the main diagonal of the confusion matrices. This improvement indicates enhanced accuracy and effectiveness in correctly detecting e-waste objects across these successive versions of YOLO.
However, there are a few instances where predictions deviate from the matrix’s main diagonal, suggesting misclassifications. These outliers indicate cases where the model may have incorrectly assigned a different class label to particular objects or misjudged the localization of the bounding boxes.
In particular, our object detection models sometimes incorrectly predict the presence of an object (e.g., a monitor) where there is only background or vice versa, which can arise from variations in object appearances and complexities in the background. Moreover, there are minor misclassifications between the computer mouse and headphone classes, which can be attributed to some similarities in appearance or contextual factors. Therefore, we may need to collect more diverse training images or apply various data augmentation techniques to diversify the training dataset, which will be left for future work.
Figure 15 shows some predictions made by YOLOv5s, YOLOv7-tiny and YOLOv8s on the test dataset. According to the results, YOLOv8s demonstrated a higher prediction accuracy than others. This observation suggests that YOLOv8s has successfully learned the visual features and patterns specific to electronic objects, allowing it to make more precise predictions.
Fig. 15.
The detection results of YOLOv5, YOLOv7 and YOLOv8s on some samples of the test set.
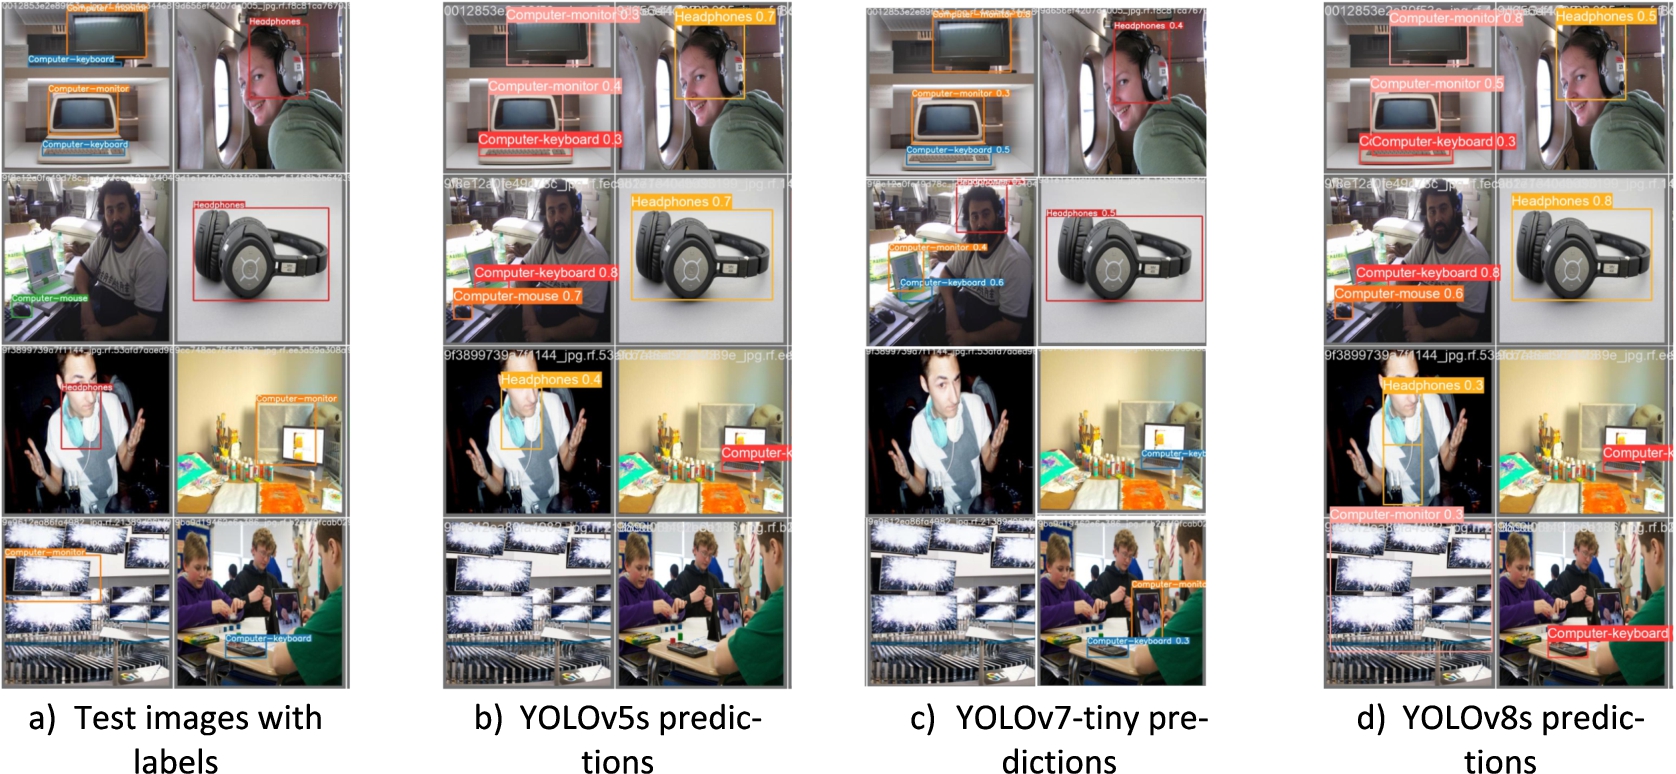
Table 7 summarizes the training time and the obtained size for each model. It is observed that YOLOv7-tiny has the smallest model size, whereas YOLOv8s has the largest model size. Conversely, YOLOv5s demonstrates the shortest training time, while YOLOv7-tiny exhibits the longest training time.
Table 7
Comparison of YOLOv5s, YOLOv7-tiny, and YOLOv8s in terms of model layers, parameters, size, and training time
| Model | YOLOv5s | YOLOv7-tiny | YOLOv8s |
| Layers | 157 | 200 | 168 |
| Parameters | 7020913 | 6022129 | 11127132 |
| Size | 14.5MB | 12.3 MB | 22.5MB |
| Training Time | 1.121 hours | 3.268 hours | 2.369 hours |
Based on the previous observations, the study selected YOLOv8s as the baseline object detection model and used it for subsequent experiments. The YOLOv8s model underwent a conversion process to make it compatible with a Raspberry Pi device. The process involved translating the PyTorch model weights into the ONNX format using PyTorch’s ONNX export function. Once converted to the ONNX format, the model was further transformed into the TensorFlow Lite (TFLite) format. TFLite is specifically designed and optimized for mobile and embedded devices, ensuring improved speed and efficiency. This conversion process allowed the YOLOv8s model to be seamlessly integrated into the Raspberry Pi, enabling efficient object detection on the device. According to Table 8, we got a minor reduction in the performance metrics.
Table 8
The performance metrics of the TFLite version YOLOv8s model
| Precision | Recall | F1-score | mAP@50 | mAP@50-95 | |
| Validation set | 0.728 | 0.665 | 0.695 | 0.702 | 0.504 |
| Test set | 0.716 | 0.671 | 0.693 | 0.71 | 0.504 |
5.Conclusion and future work
This study proposes a comprehensive smart e-waste management system by integrating various sensors (i.e., ultrasonic sensor, IR sensor, flame sensor, temperature, and humidity sensor, load sensor, etc.) to monitor the current condition of the bin and e-waste object detection model that performs real-time e-waste detection and classification. The model is based on Yolov8s and TensorFlow lite framework. The lightweight nature of the obtained model makes it the perfect match with Raspberry Pi 4. Compared to its alternatives for e-waste object detection, YOLOv8s achieves the highest mAP@50 of 72% and map@50-95 of 52%. The model successfully identified e-waste objects and classified them according to their respective categories, such as keyboards, monitors, headphones, and mouse.
In the future, we aim to improve the e-waste detection model by adding other classes, increasing the number of e-waste images per class, and increasing the training time to improve the model’s accuracy and enhance the model’s flexibility in identifying waste. Moreover, we aim to build an interactive mobile application that end-users will use to find the nearest e-waste bin from the current GPS location of the user. The implementation of such a system has the potential to lead society toward a safer, greener, more sustainable, and healthier life.
Conflict of interest
None to report.
References
[1] | S. Abba and C.I. Light, IoT-based framework for smart waste monitoring and control system: A case study for smart cities, in: 7th International Electronic Conference on Sensors and Applications, MDPI, (2020) , p. 90. doi:10.3390/ecsa-7-08224. |
[2] | M. Al Duhayyim, H.G. Mohamed, M. Aljebreen et al., Artificial ecosystem-based optimization with an improved deep learning model for IoT-assisted sustainable waste management. Sustainability 14: ((2022) ), 11704. doi:10.3390/su141811704. |
[3] | N.A.L. Ali, R. Ramly, A.A.B. Sajak and R. Alrawashdeh, IoT e-waste monitoring system to support smart city initiatives, International Journal of Integrated Engineering 13: ((2021) ), 1–9. |
[4] | C. Anjanappa, S. Parameshwara, M.K. Vishwanath et al., AI and IoT based garbage classification for the smart city using ESP32 cam, IJHS 6: ((2022) ), 4575–4585. doi:10.53730/ijhs.v6nS3.6905. |
[5] | Y.-H. Chen, R. Sarokin, J. Lee et al., Speed is all you need: On-device acceleration of large diffusion models via GPU-aware optimizations, in: Proceedings of the IEEE/CVF Conference on Computer Vision and Pattern Recognition, (2023) , pp. 4650–4654. |
[6] | U. Cisco, Cisco annual internet report (2018–2023) white paper, 2021. 2020. Acessado em 10. |
[7] | T. Diwan, G. Anirudh and J.V. Tembhurne, Object detection using YOLO: Challenges, architectural successors, datasets and applications, Multimed Tools Appl 82: ((2023) ), 9243–9275. doi:10.1007/s11042-022-13644-y. |
[8] | B. Dorsemaine, J.-P. Gaulier, J.-P. Wary et al., Internet of Things: A definition & taxonomy, in: 2015 9th International Conference on Next Generation Mobile Applications, Services and Technologies, IEEE, Cambridge, United Kingdom, (2015) , pp. 72–77. doi:10.1109/NGMAST.2015.71. |
[9] | M. Farjana, A.B. Fahad, S.E. Alam and M.M. Islam, An IoT- and cloud-based e-waste management system for resource reclamation with a data-driven decision-making process, IoT 4: ((2023) ), 202–220. doi:10.3390/iot4030011. |
[10] | File download/data transfer time calculator. https://www.meridianoutpost.com/resources/etools/calculators/calculator-file-download-time.php. Accessed 18 Feb 2022. |
[11] | V. Forti, C.P. Baldé, R. Kuehr and G. Bel, The global e-waste monitor 2020. United Nations University (UNU), International Telecommunication Union (ITU) & International Solid Waste Association (ISWA), Bonn/Geneva/Rotterdam, 2020, pp. 1–120. |
[12] | J. Gubbi, R. Buyya, S. Marusic and M. Palaniswami, Internet of Things (IoT): A vision, architectural elements, and future directions, Future Generation Computer Systems 29: ((2013) ), 1645–1660. doi:10.1016/j.future.2013.01.010. |
[13] | S. Han, F. Ren, C. Wu et al., Using the TensorFlow deep neural network to classify mainland China visitor behaviours in Hong Kong from check-in data, IJGI 7: ((2018) ), 158. doi:10.3390/ijgi7040158. |
[14] | K.F. Haque, R. Zabin, K. Yelamarthi et al., An IoT based efficient waste collection system with smart bins, in: 2020 IEEE 6th World Forum on Internet of Things (WF-IoT), IEEE, New Orleans, LA, USA, (2020) , pp. 1–5. |
[15] | Y. Huang, H. Hu and C. Chen, Robustness of on-device models: Adversarial attack to deep learning models on Android apps, in: 2021 IEEE/ACM 43rd International Conference on Software Engineering: Software Engineering in Practice (ICSE-SEIP), IEEE, Madrid, ES, (2021) , pp. 101–110. |
[16] | I.M.S.K. Ilankoon, Y. Ghorbani, M.N. Chong et al., E-waste in the international context – A review of trade flows, regulations, hazards, waste management strategies and technologies for value recovery, Waste Management 82: ((2018) ), 258–275. doi:10.1016/j.wasman.2018.10.018. |
[17] | International e-waste day: 57.4M tonnes expected in 2021 | WEEE Forum, 2021. https://weee-forum.org/ws_news/international-e-waste-day-2021/. Accessed 15 Feb 2022. |
[18] | G. Jocher, A. Chaurasia and J. Qiu, YOLO by Ultralytics, 2023. |
[19] | K.D. Kang, H. Kang, I.M.S.K. Ilankoon and C.Y. Chong, Electronic waste collection systems using Internet of Things (IoT): Household electronic waste management in Malaysia, Journal of Cleaner Production 252: ((2020) ), 119801. doi:10.1016/j.jclepro.2019.119801. |
[20] | R. Kunst, L. Avila, E. Pignaton et al., Improving network resources allocation in smart cities video surveillance, Computer Networks 134: ((2018) ), 228–244. doi:10.1016/j.comnet.2018.01.042. |
[21] | T. Liang, J. Glossner, L. Wang et al., Pruning and quantization for deep neural network acceleration: A survey, Neurocomputing 461: ((2021) ), 370–403. doi:10.1016/j.neucom.2021.07.045. |
[22] | Y. Mehmood, F. Ahmad, I. Yaqoob et al., Internet-of-Things-based smart cities: Recent advances and challenges, IEEE Commun Mag 55: ((2017) ), 16–24. doi:10.1109/MCOM.2017.1600514. |
[23] | P. Moral, Á. García-Martín, M. Escudero-Viñolo et al., Towards automatic waste containers management in cities via computer vision: Containers localization and geo-positioning in city maps, Waste Management 152: ((2022) ), 59–68. doi:10.1016/j.wasman.2022.08.007. |
[24] | G. Nguyen, S. Dlugolinsky, M. Bobák et al., Machine learning and deep learning frameworks and libraries for large-scale data mining: A survey, Artif Intell Rev 52: ((2019) ), 77–124. doi:10.1007/s10462-018-09679-z. |
[25] | K. O’Shea and R. Nash, An introduction to convolutional neural networks, 2015. doi:10.48550/ARXIV.1511.08458. |
[26] | P. Ramya, R. V and B.R. M, E-waste management using hybrid optimization-enabled deep learning in IoT-cloud platform, Advances in Engineering Software 176: ((2023) ), 103353. doi:10.1016/j.advengsoft.2022.103353. |
[27] | K.N.A. Rani, H.A. Rahim, B.T. Ong et al., Mobile green e-waste management systems using IoT for smart campus, J Phys: Conf Ser 1962: ((2021) ), 012056. doi:10.1088/1742-6596/1962/1/012056. |
[28] | J. Redmon, S. Divvala, R. Girshick and A. Farhadi, You only look once: Unified, real-time object detection, in: Proceedings of the IEEE Conference on Computer Vision and Pattern Recognition, (2016) , pp. 779–788. |
[29] | G.A. Sampedro, R.G.C. Kim, Y.J. Aruan et al., Smart e-waste bin development based on YOLOv4 model, in: 2021 1st International Conference in Information and Computing Research (iCORE), IEEE, Manila, Philippines, (2021) , pp. 125–128. doi:10.1109/iCORE54267.2021.00041. |
[30] | M. Sauter, 3G, 4G and Beyond: Bringing Networks, Devices and the Web Together, John Wiley & Sons, (2013) . |
[31] | A. Shreyas Madhav, R. Rajaraman, S. Harini and C.C. Kiliroor, Application of artificial intelligence to enhance collection of e-waste: A potential solution for household WEEE collection and segregation in India, Waste Manag Res 40: ((2022) ), 1047–1053. doi:10.1177/0734242X211052846. |
[32] | K. Singh, G. Arora, P. Singh and A. Gupta, IoT-based collection vendor machine (CVM) for e-waste management, J Reliable Intell Environ 7: ((2021) ), 35–47. doi:10.1007/s40860-020-00124-z. |
[33] | J. Solawetz, JAN 11 F, read 2023 10 min (2023) what is YOLOv8? The ultimate guide, in: Roboflow Blog. https://blog.roboflow.com/whats-new-in-yolov8/. Accessed 15 May 2023. |
[34] | J. Terven and D. Cordova-Esparza, A comprehensive review of YOLO: From YOLOv1 to YOLOv8 and beyond, 2023. |
[35] | A.K. Verma, E-wastes and their impact on environment and public health, International Journal of Applied Research (2020). |
[36] | C.-Y. Wang, A. Bochkovskiy and H.-Y.M. Liao, YOLOv7: Trainable bag-of-freebies sets new state-of-the-art for real-time object detectors, 2022. |
[37] | S. Yi, C. Li and Q. Li, A survey of fog computing: Concepts, applications and issues, in: Proceedings of the 2015 Workshop on Mobile Big Data, ACM, Hangzhou China, (2015) , pp. 37–42. doi:10.1145/2757384.2757397. |


