
eHealth in the time of smart ecosystems and pandemics
Abstract
In the recent decade, many technological innovations have increasingly been incorporated into smart city architectures. Our modern and rushing lifestyle implies at least one fitness tracker or wearable device in most households. Usually, devices are equipped with a set of biosensors, thus producing valuable time series that can be used to track selected areas. The use of bio-sensory time series is not limited to private purposes; data can also be used to improve services in our everyday life. The data generated by bio-sensory devices primarily infiltrate into smart home solutions. However, comprehensive smart home solutions also allow improvements for smart city solutions. The critical factor is the consecutive change in the subject technologies that form the smart city and smart home architectures, including the sensitivity aspects of data originating from confidential sources. Vendors must keep up with this continuous change and release newer and newer solutions, but information systems like HIS (Hospital Information System) or DSS (Decision Support Systems) are not following up at the same speed. This research will demonstrate developments that can make the services of smart ecosystems more valuable by using data collection and analyzing services based on bio-sensory data. Based on the presented research results, smart ecosystems can act considerably more effectively during an epidemic or a pandemic. The research paper focuses on how bio-sensory time series data can be collected and used, how the data can be integrated into smart ecosystems, and how it can be integrated into smart healthcare solutions.
1.Introduction
Recent research is dealing increasingly with the general-purpose use of sensor data, which is meant to make everyday life easier for ordinary people. The idea of modern smart cities equipped with artificial intelligence and sensors is becoming progressively popular, and projects dealing with this topic are evolving more and more widely in practice as well. The biggest actual challenge of smart cities supported by sensors is how to efficiently deliver huge amounts of data produced by the sensors to the place of processing and how to build and maintain so many active connections for physical devices. Nowadays, most countries are launching their own 5G networks, with which many more devices can be connected to the network compared to before, giving room for the spread of sensor-based solutions, which seems to solve one of the main problems of sensor-based smart cities [20].
With technology evolution, cities will become more and more complex. In every improving city, digital services play an increasingly important role in all areas of life. Related to this paper’s topic, eHealth services have also improved a lot in the past. With the introduction of mobile networks, people have the opportunity to ask for help without having to meet the parties like doctors or administration staff. Monitoring devices are used in healthcare that sends lots of collected data directly to the healthcare system via networks. The current level of technological development makes it possible to connect areas of life that were not possible until now or only with great difficulty. The systems connected in this way can support each other’s operation with data and services from external sources.
2.Smart ecosystems
Not just cities are evolving into more complex integrated systems, but modern buildings are participating in this transformation. Houses equipped with many sensors can serve as a base for certain well-care applications. With the support of sensors, we could collect (and further analyze) data that can describe interesting aspects of how individuals live. A modern home builds infrastructure not only for its operation but also for other comfort services as well. These interfaces also could offer or connect public interfaces, supporting (easily) integration into other environments operating on a similar principle [11]. When a connection is established between two smart home systems, their operations create lots of data that can support the operation of smart cities, like the publish/subscribe architectural pattern where clients use value-added services by the system, which is driven by the data originating from the clients themselves. Translating this to the smart cities and smart homes’ level of services could result in a convenient environment for residents. On the other side, the residents of the smart homes will supply their data to make the city’s services more efficient [10,27].
2.1.Smart home solutions
A smart home is a complex (computer) system that can sense its environment and internal conditions with the help of sensors and is able to control various (electrical) systems of the house in order to work as efficiently as possible. A smart home could coordinate all of these technical solutions in the house. This could be, e.g., cooling and heating systems, shading, garage doors, security equipment, household appliances, and lots more. This works with the help of integrated electronics and sensors embedded in the devices. The sensors and the subsystems are connected in a system and can be controlled from anywhere with the help of the Internet and a smart device, for example, a smartphone.
In addition to being comfortable and practical, it can also be energy-saving. A smart home can detect the state of the house’s devices and harmonize the environment and their entire operation. It should no longer happen that the room you don’t even use is the warmest or that you have to come home to a cold apartment. In addition to the operation of the building, there is a lot of raw data produced by the residents within the smart homes. Smart homes can access this data, as many IoT devices in their area share their sensor data with their environments. One good example could be a monitoring service for PM2.5 air pollution in a city to create forecasts in an hourly or daily manner to support ventilation [1]. If bio-sensory devices are also available among the sensory tools, the raw measurement data can also be used for health purposes. Smart home solutions can extend the raw measurement bio-sensory data with other metadata, e.g. current temperature or air pressure, as well [14].
2.2.Extended smart city solutions
A smart city is a settlement or group of settlements that develops its natural and built environment, digital infrastructure, as well as the quality and economic efficiency of the services available in its area, using modern and innovative information technologies, sustainably, with increased involvement of its residents.
Today, smart cities and smart homes are still mostly separate facilities; they do not communicate with each other or only just a little bit. Both facilities do not require the other to function. However, if we consider smart homes as a data source or subsystem of smart cities that are unnecessary for operational functioning, then the two facilities can complement each other.
In addition to the many advantages of connecting facilities, the most important aspect from the point of view of this research is the ongoing development of health services. The bio-sensor data transmitted by smart homes to smart cities can be delivered to the city’s smart healthcare facilities [2]. If the raw measurement data reaches the health care system, the quality of the service can be significantly increased through the use of the data [8]. Many types of bio-sensor data can be used during medical examinations or even for remote monitoring of patients. Historical bio-sensory data of this type can also help in one of today’s extremely important struggles. Namely, in monitoring pandemics, the early detection and isolation of cases, and the easier detection of contacts [9].
3.Smart ecosystems against pandemic disease
Several studies deal with the topic of the COVID-19 epidemic. Many of them seek the answer to the possibility of early detection [5,21]. It is very promising that the COVID-19 infection can be predicted with great confidence even before symptoms appear [13]. The search for contacts is greatly simplified if location data is available in a smart ecosystem. The quarantine can also be ordered largely more confidently.
Answering questions that arise during a pandemic can be easier in a properly designed smart ecosystem. With the help of raw measurement data, cases became easier to recognize [24]. Of course, these data are sensitive personal data. Their protection is extremely important; data management contracts and information sheets cannot be avoided either. This research does not intend to deal with this area in depth; it focuses on using the data.
Naturally, applied data is not exclusively produced in smart homes only; it is necessary to think in terms of a smart ecosystem. People are at home, at work, on public transport, or on the street. For the data to be sufficiently detailed, it is very practical to use data generated by activity monitoring devices, which are increasingly common today [7]. Most activity monitoring devices can perform several types of measurements. They track the heart rate and the number of steps; some could add GPS coordinates to the measurement data. Supplementing the raw measurement data with other data makes the measurement much more usable, which is usually interpreted as a number. Still, the measurement result can be interpreted in context when supplemented with other data [3].
3.1.Med-i-hub system
The collection and interpretation of sensor data are not easy; in most cases, the interpretation of the data is extremely resource-demanding. Such specific processes do not fit specifically into the operational structure of smart cities or smart homes. These systems cannot be expected to incorporate this kind of domain knowledge into their everyday operation. However, data accessibility is the easiest to implement for these systems. It is, therefore, logical to extend these systems so that they communicate via a predefined interface and forward the data to other systems, where they can interpret the measurement and the context of the measurement. The research group created a prototype system based on the hub operating principle, which was named Med-i-hub.
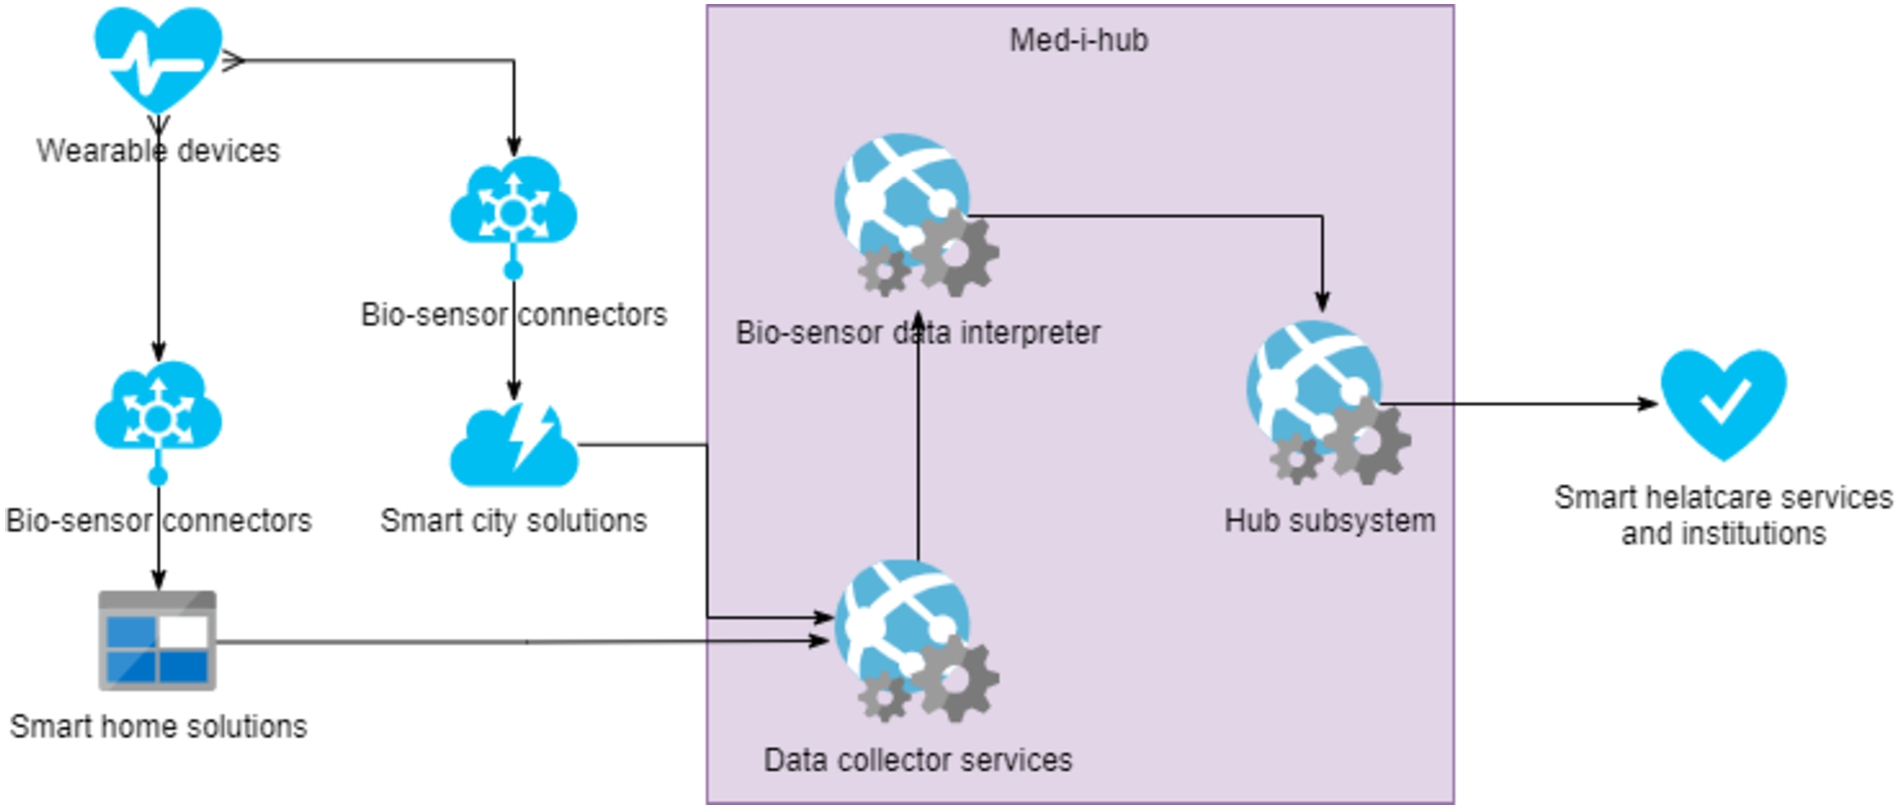
Med-i-hub is a public cloud-based, scalable, partially localizable system working with biosensor data. It facilitates the integration of everyday activity monitoring and portable biosensor devices into traditional healthcare IT systems. It removes the burden of device integration from the developers of other systems and supports the integration of devices and external systems through well-defined interfaces. The most basic function of the Med-i-hub system is to collect and transmit measurement data to external systems. Still, the system analyzes and classifies the data to help integrated systems interpret and use the data. Figure 1 illustrates the reference architecture of the Med-i-hub infrastructure. Med-i-hub is not only an individual system but an extension framework for smart solutions, e.g., smart cities and smart homes.
Fig. 1.
Logical placement of the Med-i-hub system in smart ecosystems.
The Med-i-hub system receives data via an open programming interface. It cleans the received data, supplies it with the appropriate descriptive data, and in addition to storing it, forwards it to the integrated external systems. From the system’s point of view, the most important step is classifying the data and filtering errors so that the integrated systems can interpret the received measurement data with the appropriate information. Handling and processing large amounts of incoming data requires using solutions that provide the most accurate classification possible with as few resources as possible [18,19]. That is why the system works with a multi-layered architecture and applies classification algorithms that do not cause an unnecessarily high load. Figure 2 shows the layered architecture of the Med-i-hub system.
Fig. 2.
Reference architecture of Med-i-hub system.
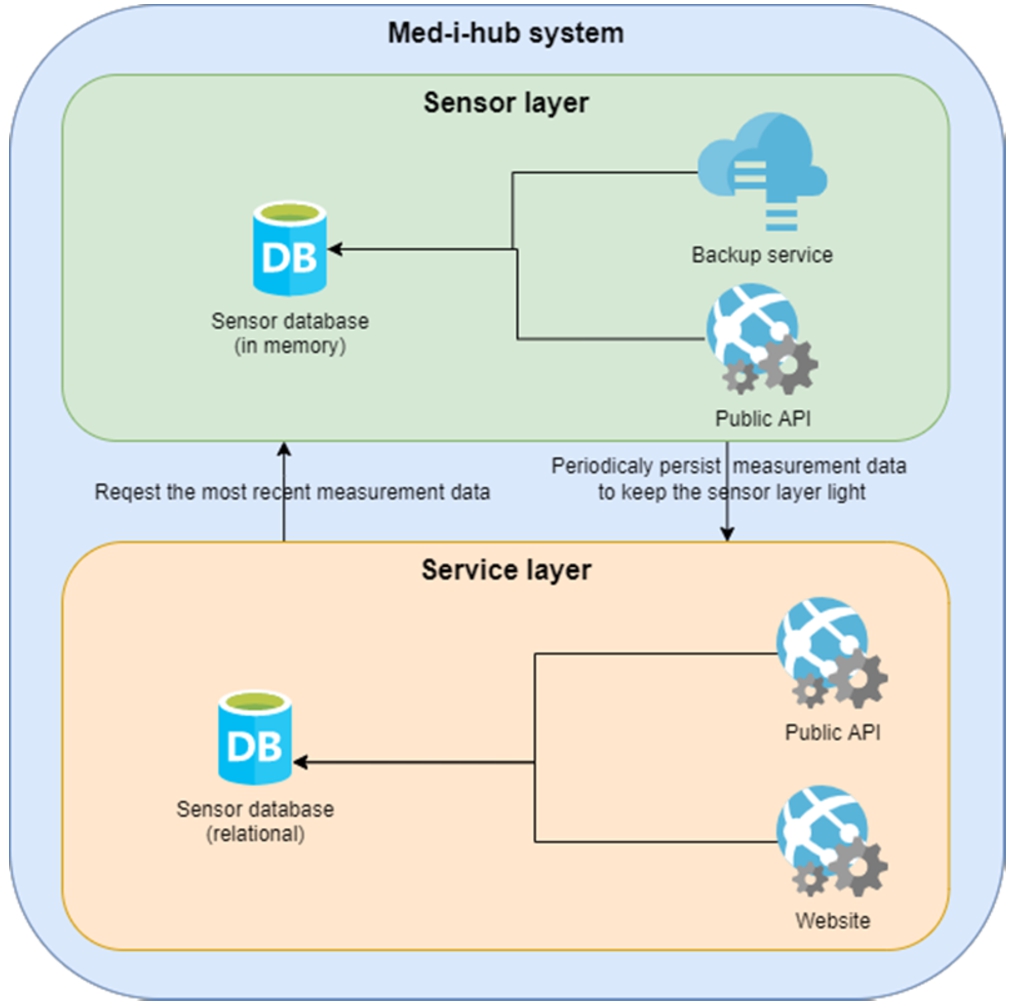
The architecture can be divided into two loosely connected layers: the sensor and service layers. Sensor data is received and classified in the sensor layer. The layered architecture means the data is first sent to a technologically optimized layer to process large amounts of data in almost real time. In this layer, the data is stored in a memory database until it is transferred to permanent storage. The sensor layer is particularly optimal because the context of measurement data is important, so knowledge of previous measurement results. If this had to be extracted from a relational database, it would greatly impair processing efficiency. The sensor layer operates with a memory-based database. Memory-based databases do not work on the hard disk but persist the content directly in memory. Data can be accessed orders of magnitude faster from the memory than from the hard drive, and this type of database is built on this [17]. The data is accessed from the memory, and processing requires computing power. When scaling this layer, we can therefore speak of memory-intensive scaling. In order to be able to keep the memory usage of the sensor layer under control, the measurement data must be placed in permanent storage at specific intervals. That is why the sensor layer transfers older measurements to the service layer at pre-configured intervals. The two layers are therefore interconnected. The sensor layer passes the cleaned and transformed measurement results to the service layer, and the service layer requests information according to the incoming requests in order to generate the answer.
In addition to the sensor layer, the architecture has a service layer whose task is to serve web requests in the classical sense over the Internet. This layer can also be scaled horizontally depending on the load. The task of the service layer is to maintain contact with the integrated systems and to serve the data requests of the external systems and users. The following logical services are located in this layer:
– Analytical services: operates with the data collected by the sensor layer and supports various analyses.
– Monitoring services: interprets and analyzes the data collected by the sensor layer. This service enables the operation of various notifications and warnings.
– Data visualization services: displays the data collected by the sensor layer via a web user interface.
Both layers are able to format the messages used during communication according to several standards. When placing the call, the integrated system must indicate which standard-formatted messages are suitable for which system.
3.1.1.Clients of the architecture
The Med-i-hub system is a prototype system. The research group created this system with the aim of easily integrating the data generated by wearable devices, which are increasingly common nowadays, into healthcare systems and services. The Med-i-hub system is a proxy system with several predefined processes, filtering methods, and data analysis services. For the system to work with health data in proxy mode, it is necessary to have well-defined interfaces through which it communicates with its environment. Communication with the system can be implemented in a number of ways. The system provides well-defined programming interfaces (API) and can also receive data via HTTP sockets.
Thinking in terms of a smart ecosystem, the Med-i-hub system can act as a proxy between the data owners of wearable devices and healthcare institutions and services. In this sense, the proxy system acts as both a consumer and a producer. It receives the raw measurement data from the entities that produce it and forwards it according to a predefined set of rules. During communication, the format of the messages is dynamic. Data is mostly sent and received using a REST API, but in the case of time series, it is recommended to use a pre-built HTTP socket. With the help of the socket, the transfer of a large amount of measurement data that is constantly generated is much more efficient than using the REST API, but this data transfer method is sensitive to network errors.
Early smart home systems were limited to controlling heating, lighting, and shutter systems. However, as a result of the development in this area, modern smart home systems can now be extended in a plug-and-play manner. Most systems can be extended not only with hardware but also with software. The connection to the Med-i-hub system can be implemented in several ways, as detailed above, so there are several options for extending smart home systems. The most obvious expansion option is the integration of a custom software module into the smart home ecosystem, which collects data within the scope of the building using a hardware component of the smart home ecosystem (e.g., Bluetooth or WiFi) and then transmits the collected data over the network to the Med-i-hub system.
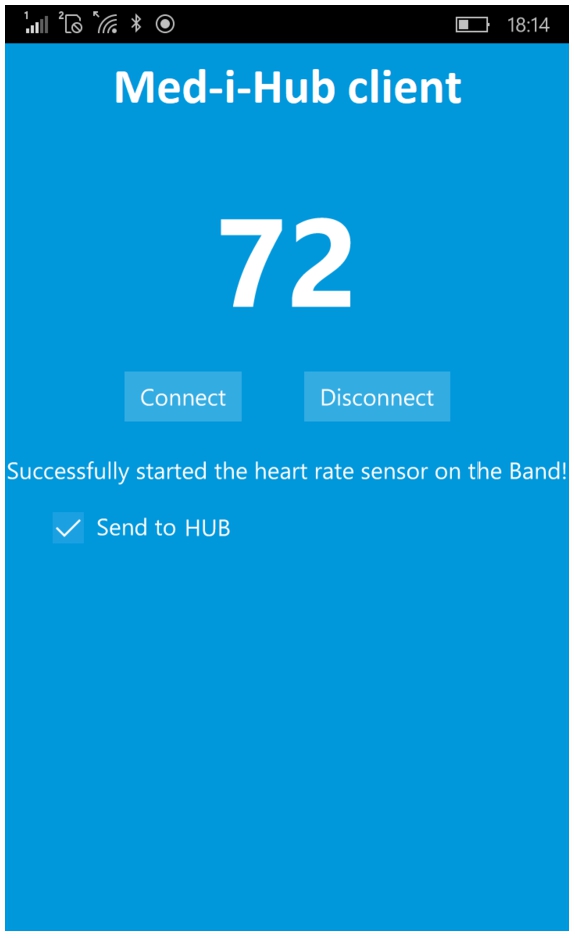
Data from portable devices is published in many formats by device manufacturers. To ease the development difficulty posed by the variety between formats, the research group created an application called Smart Personal Assistant, which is a mobile application (Fig. 3). Installing this application near the mobile device allows the raw measurement data to be continuously collected. The application transmits the collected data to the Med-i-hub system using the module built into the smart home. The Smart Personal Assistant application can access the calendar entries, so the raw measurement data can be evaluated even more accurately, knowing the measurement environment. For example, in the case of a sports calendar entry, abnormal heart rate data can be considered normal. With the help of the module built into the smart home, additional data can be added to the raw measurement data, such as temperature and humidity at the measurement location. The module can collect this data through the other smart home modules and connect it to the measurement.
Fig. 3.
Smart personal assistant mobile application.
3.1.2.Performance of the architecture
As a proxy system, the components of the Med-i-hub system must be sized so that the throughput of the system is not significantly reduced, even in the case of a large amount of data. If raw measurement data and its environment can be represented with 128 bytes of data and the server has a 10 Gbps (bits per second) data connection, which can be considered common on an industrial scale, then the throughput of the system can be easily calculated. Other elements used during network communication, such as the HTTP request header, are now omitted from the calculation. The data format with 128 bytes should consist of the following parts:
– User id: 32 bytes
– Raw measurement data: 2 bytes
– GPS coordinates: 8 bytes
– Temperature: 2 bytes
– Humidity: 8 bytes
– Age: 2 bytes
– Weight: 4 bytes
– Body temperature: 4 bytes
– Calendar event enum: 32 bytes
– Reserved for future use: 34 bytes
For the sake of simplicity, all incoming data is forwarded exactly to one integrated system. A 10 Gbps data connection has a performance of 1.25 GBps (gigabyte per second). This means that in theory, 1.25 GB (gigabyte) of data can be transferred over the network per second. Of course, this raw number is theoretical; it is not guaranteed that this nominal power will always be available. Staying with the example, the given network’s throughput is 10,485,760. This is the number of raw measurement data that can be transmitted in one second. If we transmit all measurement data to an integrated system, the received data can be half of this number so that the system can process and transmit 5,242,880 data per second. The other components of the system must therefore be sized and made scalable in such a way that they can process this amount of data. The prototype system works in the following virtual environment:
– 8 vCPUs
– 16 GB of virtual memory
– 8192 GB storage space (SSD), 6400/550 IOPS/MBps, with 8 physical disks in the background
– 1 Gbps network interface
– Intel® Xeon® 8171M 2.1 GHz (Skylake), Intel® Xeon® E5-2673 v4 2.3 GHz (Broadwell) or Intel® Xeon® E5-2673 v3 2.4 GHz (Haswell) processor, Intel Turbo Boost Technology 2.0 with support
With the virtual machine detailed above, the prototype system was able to receive and transmit nearly 500,000 raw measurement data. The bottleneck was not the network but the overwork of virtualization and the undersized system components such as processor cores. The system can be scaled horizontally, and the throughput of the system can be significantly increased by involving additional virtual machines.
3.2.Standards for data interchange
There are several standards in the field of healthcare. Some of these standards are widely used. One such commonly used standard is Health Level 7 (HL7). HL7 is a widely used international standard for exchanging health data and data describing electronic patient records. The name of the standard refers to the seven layers of the well-known OSI model. In the definition of HL7, the topmost layer, i.e. the seventh layer, is the application layer responsible for the exchange of health data, which regulates how systems can interpret the electronic data sent or received. The HL7 standard is the result of a private project run by the Health Level Seven consortium. The consortium is also an organization recognized by the American National Standards Institute (ANSI). The initial objective of the standard was to lay the foundations of a widely accepted health standard. At the time of research, the most common version is v2, but the v3 version has already been finalized and released. The HL7 v3 standard is backward compatible and supports the terms defined in v2. The v3 version includes some important changes that can help spread the standard. The message format of v2 was a proprietary text solution [6]. This made understanding and development difficult, which hindered the spread of the standard. In the v3 version, data is already exchanged with XML format messages. However, the widespread adoption of the new version is hampered by the fact that healthcare systems usually change slowly. These types of systems adapt to changes much more slowly than other types of systems, and the transition to newer standards and technologies is also costly.
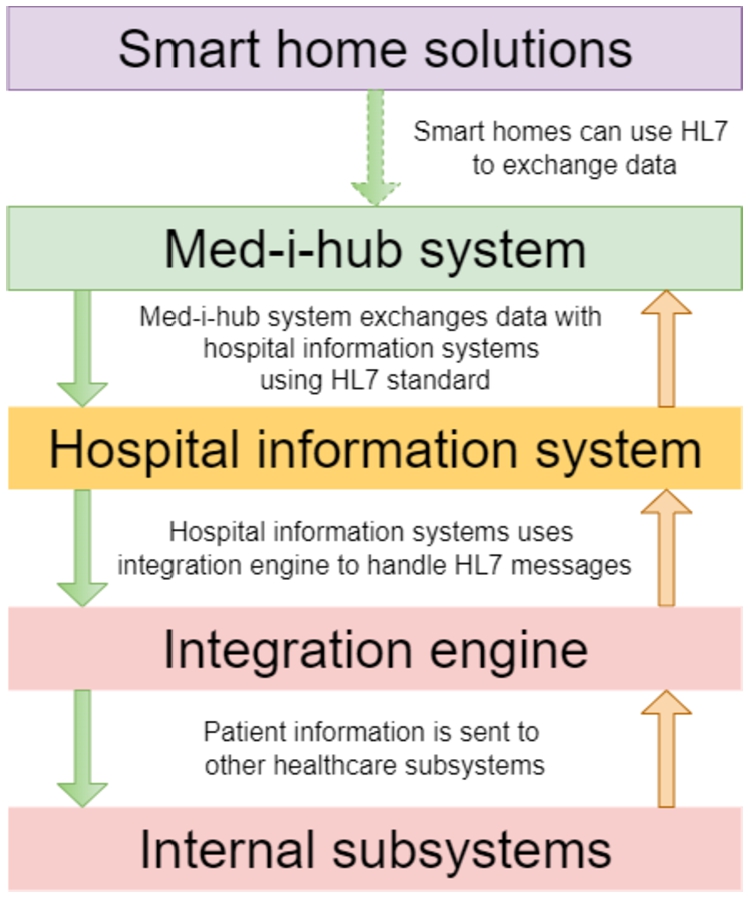
The HL7 standard uses the Systematized Nomenclature of MEDicine (SNOMED) categorization system. SNOMED is one of the most complete medical coding systems that allows detailed medical descriptions of patients. It is based on the Systematized Nomenclature of Pathology (SNOP), created in the 1960s, which was originally designed to represent pathological concepts in a multidimensional system [4]. Fast Healthcare Interoperability Resources (FHIR) is another popular standard in healthcare that builds on the HL7 standard. FHIR uses the data format of the HL7 standard, but it is much more modern than HL7 and easier to use. FHIR enables the use of modern web technologies such as Representational State Transfer (REST) and Hypertext Markup Language (HTML). Related systems may use Javascript Object Notation (JSON) or Extensible Markup Language (XML) message formats to exchange electronic health records [22]. The primary objective of the FHIR standard is to establish cooperation between healthcare systems in a standardized manner and to standardize data exchange. Thanks to the HL7 and FHIR standards, healthcare providers and individuals can easily access data from a variety of devices, such as portable devices, mobile devices, or personal computers. Since HL7 is a widely supported standard that is used in more and more countries as the default healthcare standard, it is advisable to take this into account when designing and developing new systems. If the system exchanges electronic health records with other systems, it should be standardized, and the standards used in the given country should be prioritized in this case. By using the HL7 standard, national regulations can be applied in a standardized way. In this research, we relied on the HL7 standard when designing and implementing the Med-i-hub prototype system. Figure 4 illustrates the common HL7 data stream using the Med-i-hub system.
Fig. 4.
HL7 data flow using Med-i-hub system.
The FHIR specification includes a number of solutions that can help healthcare systems monitor patients even in real-time; for example, it defines the format of messages describing monitoring data, which can be used to distribute simple measurement or monitoring data over the network. It is important to mention that due to the XML format, the volume of distributed data is larger. If we describe the observations with FHIR messages, the throughput of the system decreases, as a significant part of the available bandwidth is wasted due to the size of the XML format.
Listing 1.
Captured data as a FHIR message
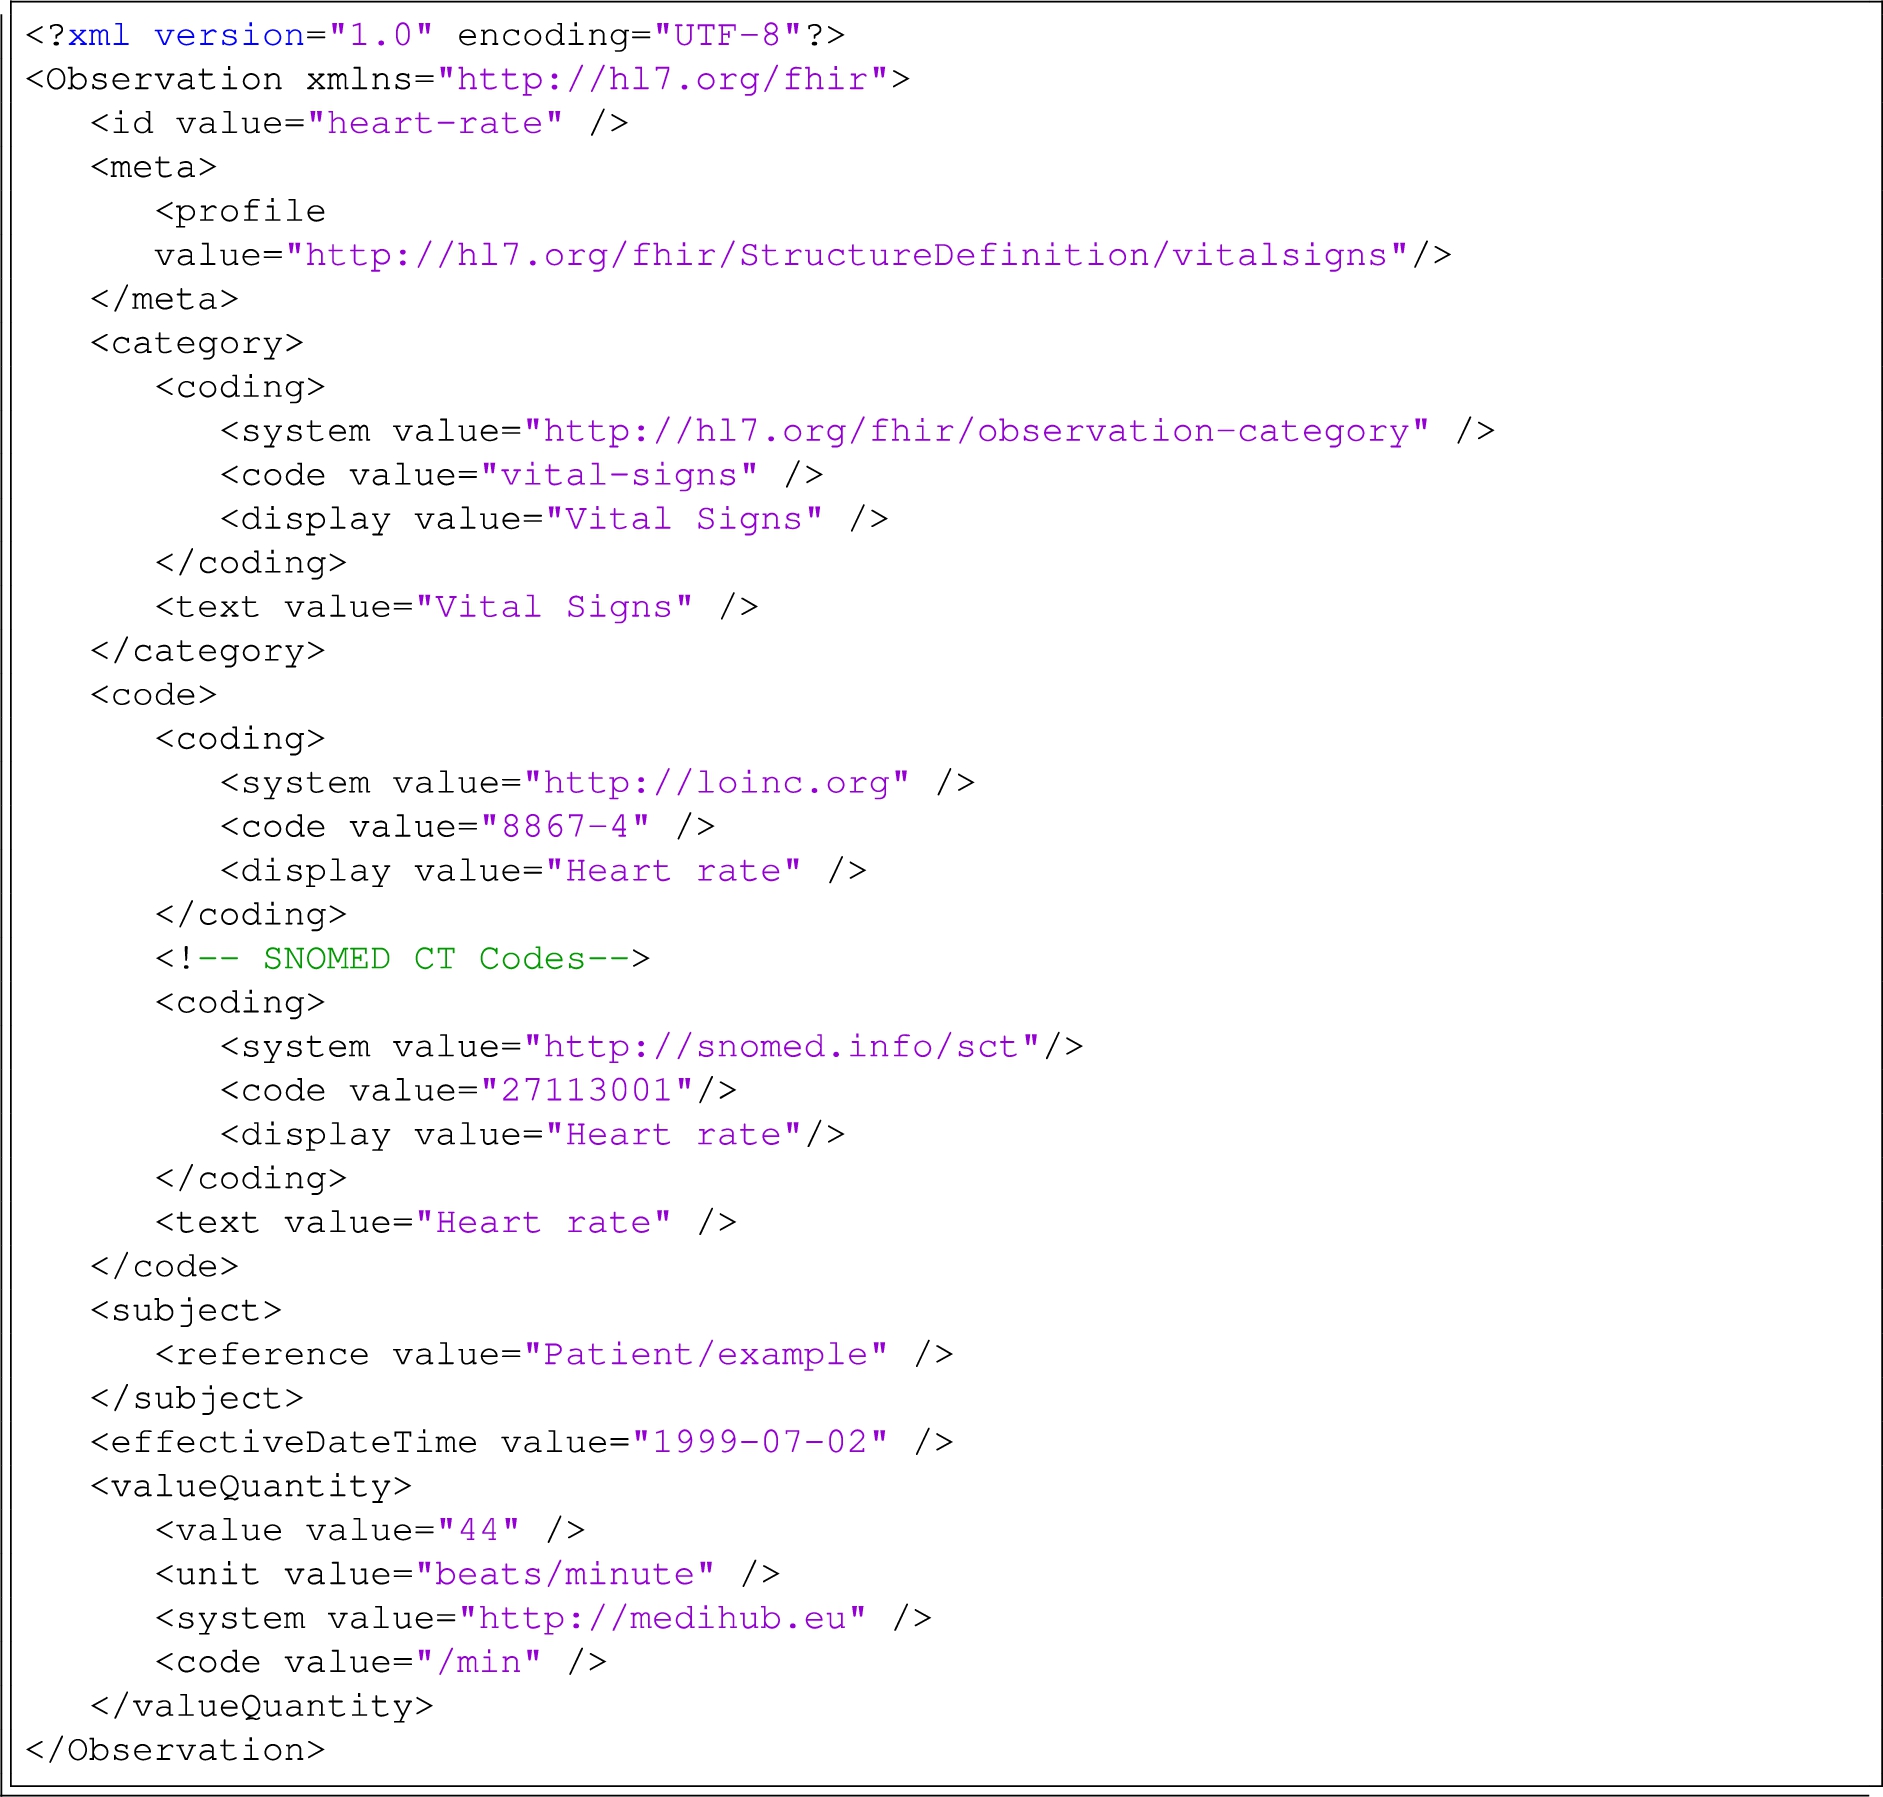
The XML code shown in Listing 1 is an FHIR message that represents monitoring data. In the message, the observation describes the result of a pulse measurement.
3.3.Measured indicators for detecting signs of infections
The Med-i-hub prototype system was successfully tested by our research group with the help of several volunteer participants. During the COVID-19 epidemic, the research group conducted tests in several stages. Measurement data were recorded from portable devices used by small groups during the test runs.
Based on these tests, a significant amount of time series was collected and supported the data analysis module of the Med-i-hub system. The research team analyzed the data series using this historical data from the test periods, looking for a correlation between the measured factors, like heart rate and infection. Results from the analysis and look-ups for research papers in connection with the global epidemic, we can confirm the assumptions that there is a correlation between increased heart rate and the infection of COVID-19 [26].
The Med-i-hub system was tested with 65 participants. The involved individuals were all Hungarian natural persons. We made a comparison between the test group’s infection ratio and the data on the epidemic between September 2021 and February 2022 in Hungary. Naturally, the participants provided all the data voluntarily. Measurements recorded by the smart bracelets were received and analyzed by the Med-i-hub system.
Each participant received a dedicated application on their mobile phone, which collected and transmitted raw measurement data to the Med-i-hub system. The participants agreed to perform a rapid test for infection as soon as possible if any of the applicants showed symptoms of COVID-19. The results and the date of the test were shared with the research team.
Several positive cases were reported during the test period:
– 2021 October – 2 cases
– 2021 November – 3 cases
– 2021 December – 2 cases
– 2022 January – 5 cases
– 2022 February – 2 cases
As several participants produced positive tests for the coronavirus, we compared that tendency with the number of cases revealed as infected in Hungary. During the research, we can confirm the correlation between the pulse rate and the number of infections in Hungary.
Fig. 5.
Number of positive cases for Covid-19 in Hungary.
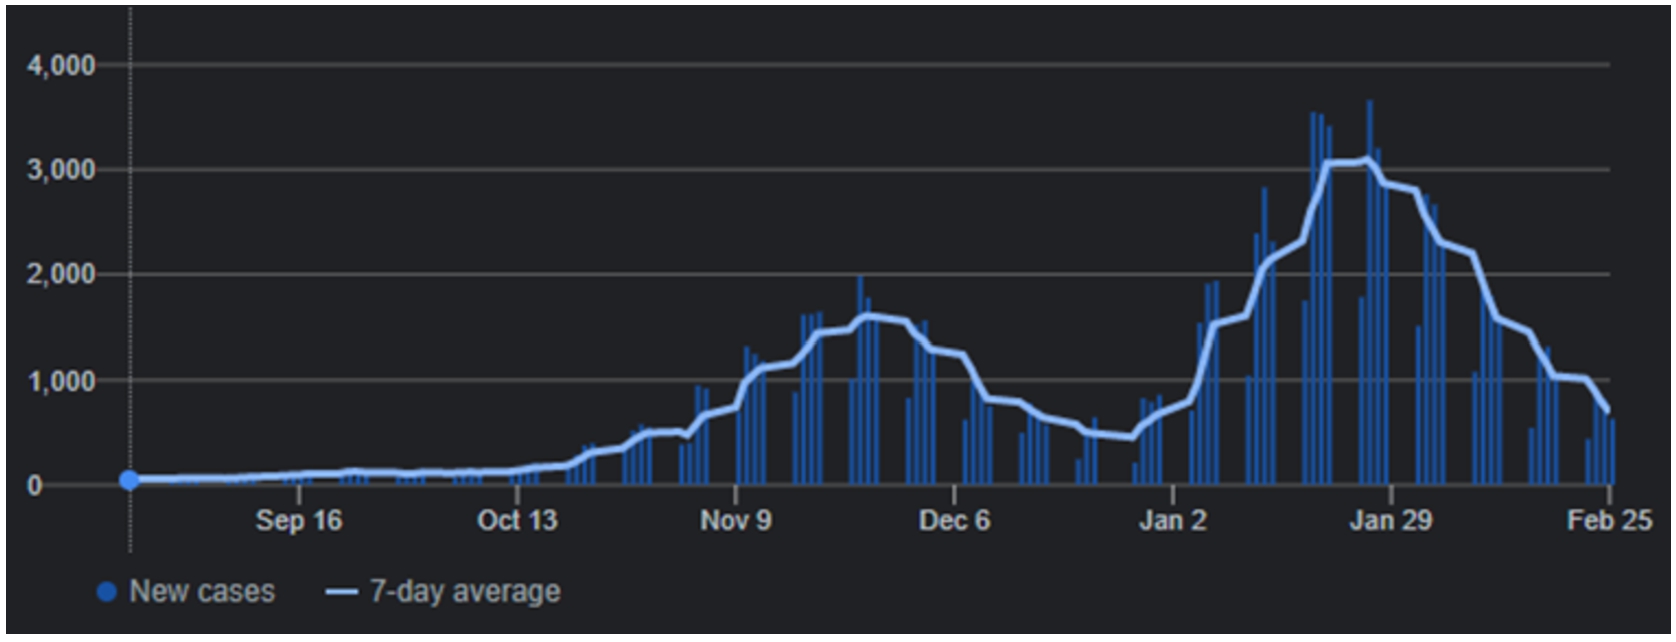
Fig. 6.
The average heart rate for each infected person.
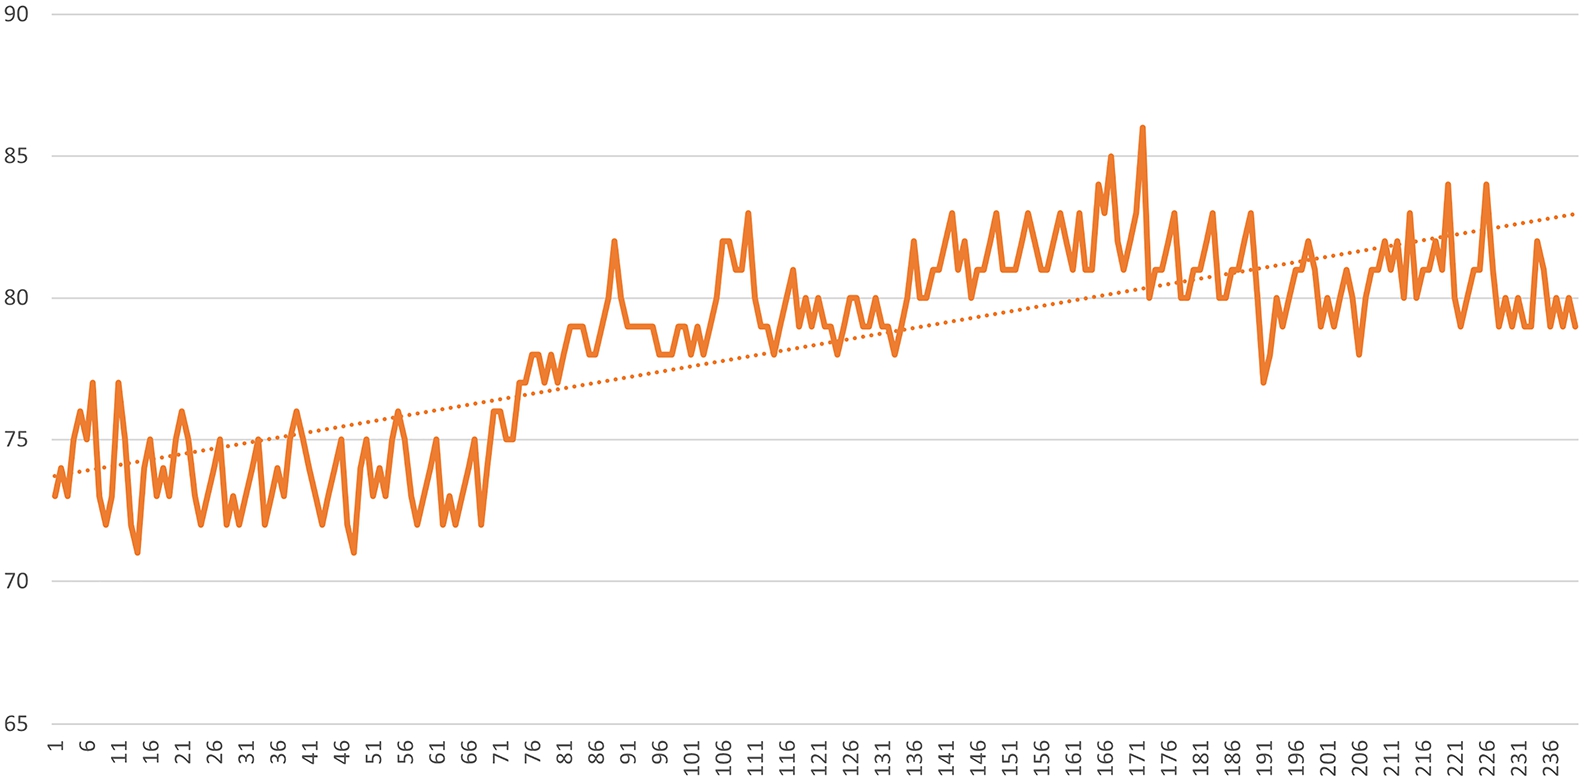
Figure 5 shows the Hungarian infection data for the given period. Figure 6 shows a highlighted case where the correlation between the appearance of infection symptoms and heart rate can be seen. In all cases, based on the measurements, it can be stated that the heart rate fluctuated before the infection, and even after a positive test result, it was higher than the previously measured personal average since all the participants wore their activity monitoring devices at all times covering periods before the infection.
Moreover, we have collected data about the concentration of the genetic material of the SARS-CoV-2 virus measured in the wastewater (in the city where all the participants live). It still showed a correlation with it since when the concentration began to rise, the number of positive cases followed it in a short period. A total of 14 of the 65 participants became infected during the test period and were tested with positive results for the coronavirus.
4.Simple mathematical methods to find errors
The layered architecture of the Med-i-hub system, as described above, has therefore been optimized so that even computationally intensive tasks can be performed resource-efficiently and in near real-time. For this, the computing-intensive tasks must be of a nature that is still appropriate from the point of view of the architecture. The classification of measurements and the filtering of errors is not a trivial process, a lot of information is needed to express an opinion about raw measurement data, which is mostly a number. Regardless of this, simple mathematical solutions can be applied that can effectively classify and filter the measurement data without the use of complicated artificial intelligence algorithms.
During the research, the research group primarily aimed to increase the reliability of the measurements. This is particularly important because generally available bio-sensory devices for household and private use are not officially certified medical tools.
Devices can record incorrect measurements for several reasons:
– the device moved during the measurement
– the device is used in inappropriate conditions
– the measurement data is below the error limit of the device, and thus, the device published it as a valid measurement
4.1.Zone method
There is no expected value for heart rate. The heart rate is usually divided into zones and the maximum heart rate also changes with age [25]. All of these must be taken into account when evaluating the measurements. The maximum heart rate changes with age, we can calculate the maximum by using the Karvonen formula:
If we have calculated the theoretical maximum heart rate based on age, then all we have to do is create zones according to each activity. When creating the zones, you can also rely on the above Karvonen formula and it is advisable to define the zones as follows:
– at rest 30–40%
– 40–50% in the case of effortless movement
– 50–60% at moderate effort
– 60–70% in the case of fat-burning training
– 70–80% in the case of strenuous exercise
– Over 80% in case of very high use.
Using this method, we calculate the reliability of the measurement in such a way that we take the known activity and age. A zone can already be defined with these two data. If our measurement is in the expected zone, then its reliability value is 1, if it is not in the zone if the measured value:
– higher than the maximum of the zone, then the reliability of the measurement is 0
– is lower than the minimum of the zone, then the reliability of the measurement is 0
– in all other cases, the reliability value is 1.
The reliability of the measurement in this approach is binary, which makes it easier for the user to interpret the values.
4.2.Moving average
In the case of a pulse data series, the temporal order of the measurements is important so that we can filter out exceptionally high or low values. Such values can be easily filtered from the data series using a moving average. If given measurements are a time-continuous series
–
– n is the number of all measurements in the examined time series,
– and
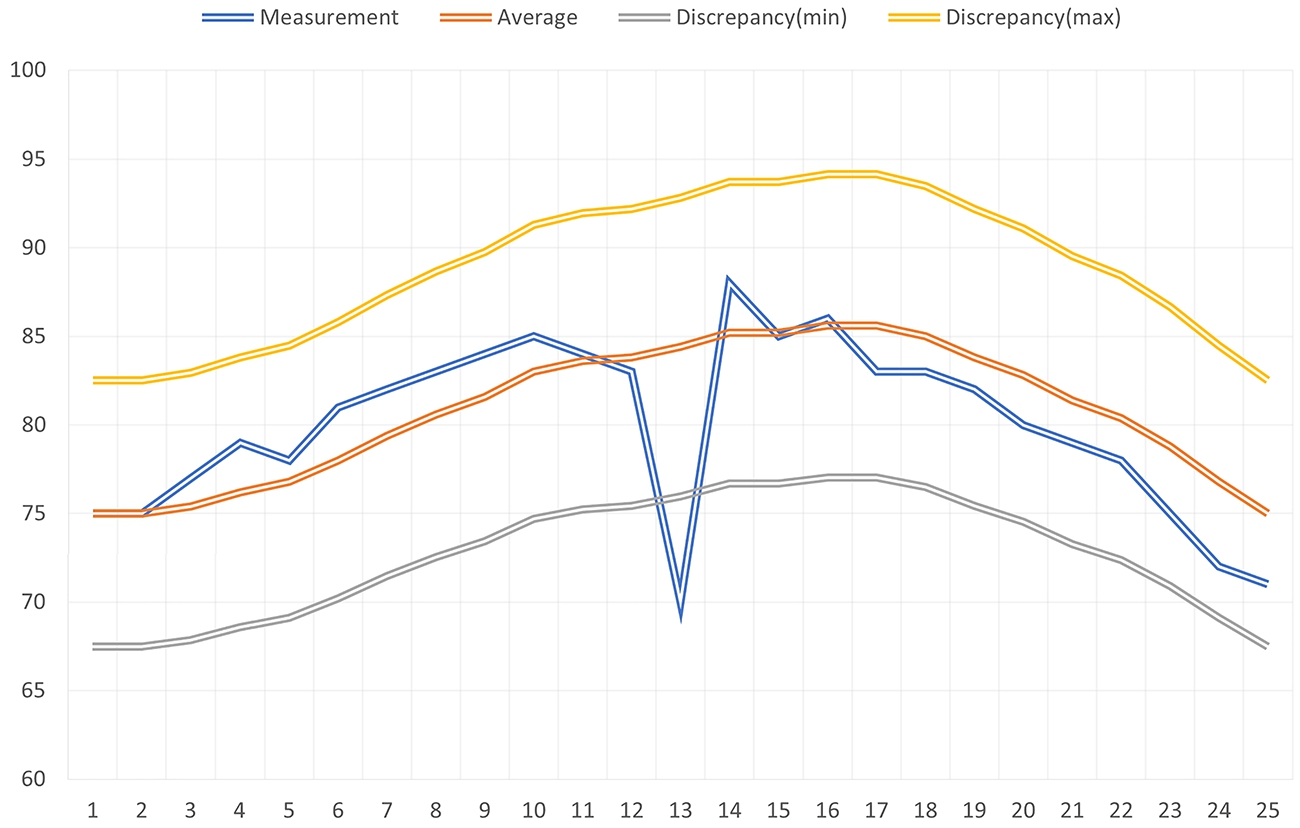
During the classification and pre-filtering of measurement data with a moving average, it is also necessary to know the previous measurement results in order to be able to calculate the average. The essence of the method is that we attach a number recorded in absolute value to the continuously updated moving average value, which symbolizes the deviation from the average. This value can be a static number or a value set as a percentage. Measurement results that deviate from the moving average by a value greater than the specified value can be marked as suspicious by the system, or this information can be used during classification (Fig. 7, Fig. 8).
Fig. 7.
Moving average without outliers.
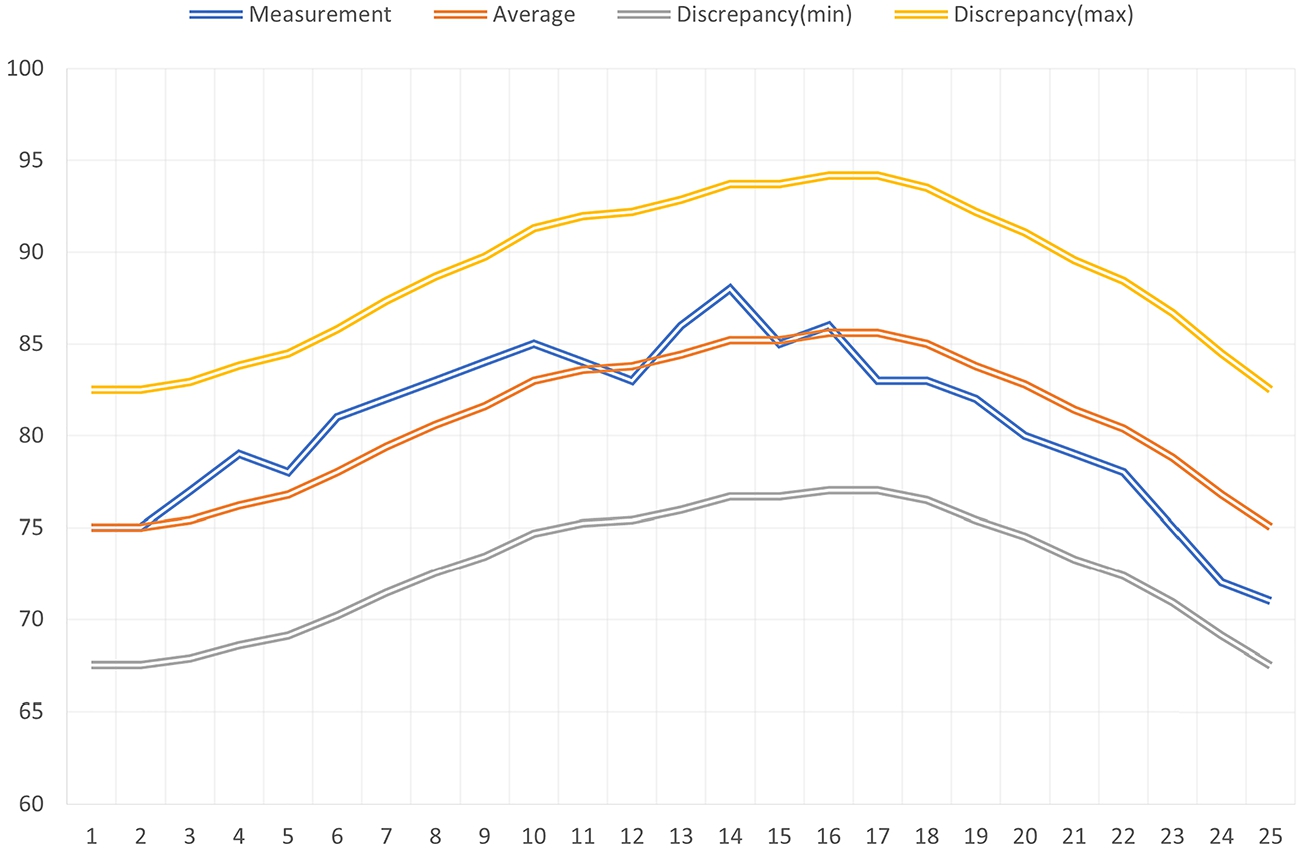
Fig. 8.
Moving average with outliers.
When using a moving average, the deviation from the average shapes the reliability as follows:
–
– and v is the value of the current measurement.
During the evaluation of the deviation based on the average, it is also necessary to examine other attributes as well. Measurement errors or results indicating possible health problems can be effectively filtered out. For example, it is important to be aware of the measurement environment, the individual’s activity, and previous health problems during the measurement. Therefore, the deviation from the average is not an exact number but an adaptive value that changes based on the above-mentioned manner. The Med-i-hub prototype system evaluates the deviation from the average with a number between 0 and 1 and transmits that measurement data together with this reliability number to the integrated external systems. Value 1 means that the measurement data is the most reliable compared to the known conditions.
4.3.Compare methods
To be able to compare the methods in real-world scenarios, we created a mobile application that collects pulse data from a portable smart bracelet and transmits it to the Med-i-hub application. The Med-i-hub prototype system processes the incoming data and defines the reliability numbers for each measurement according to the two methods. With the help of the mobile application, measurements were taken every 5 seconds, which were immediately transmitted to the server application. The evaluation is easy with the zone method because reliability is binary. With the moving average method, however, it is necessary to determine how much deviation from the average is still considered reliable. Based on the zone method, it can be seen that a zone gives 10 percent room for the tendency based on the calculated
The problem with the zone method is that individual activities cannot be classified into a single zone. The user can perform an activity that should be classified in a higher zone for a longer or shorter period. It is difficult to programmatically decide whether we are dealing with an outlier or whether the measurement environment has changed. On the other hand, the mathematical method is somewhat adaptive, and if we choose the parameters of the moving average well, we get a good model for evaluating the values. During the practical measurements, several-minute spikes could only be interpreted and correctly classified with the moving average and were classified as outliers using the zones. Apart from the weaknesses in the methods, both approaches can also be applied to classify blood pressure measurement data based on other blood pressure observations.
To compare the methods, let’s examine a 33-year-old man who does not do a strenuous but continuous movement, e.g., walking at a normal pace. The age-corrected heart rate zones are as presented in Table 1.
Table 1
Heart rate zones for people at age 33
| Min | Max | |
| Rest | 56.1 | 74.8 |
| Effortless movement | 74.8 | 93.5 |
| Moderate effort | 93.5 | 112.2 |
| Fat burning training | 112.2 | 130.9 |
| Strenuous exercise | 130.9 | 149.6 |
| Other | 149.6 | 187 |
Fig. 9.
Comparison of the two methods.
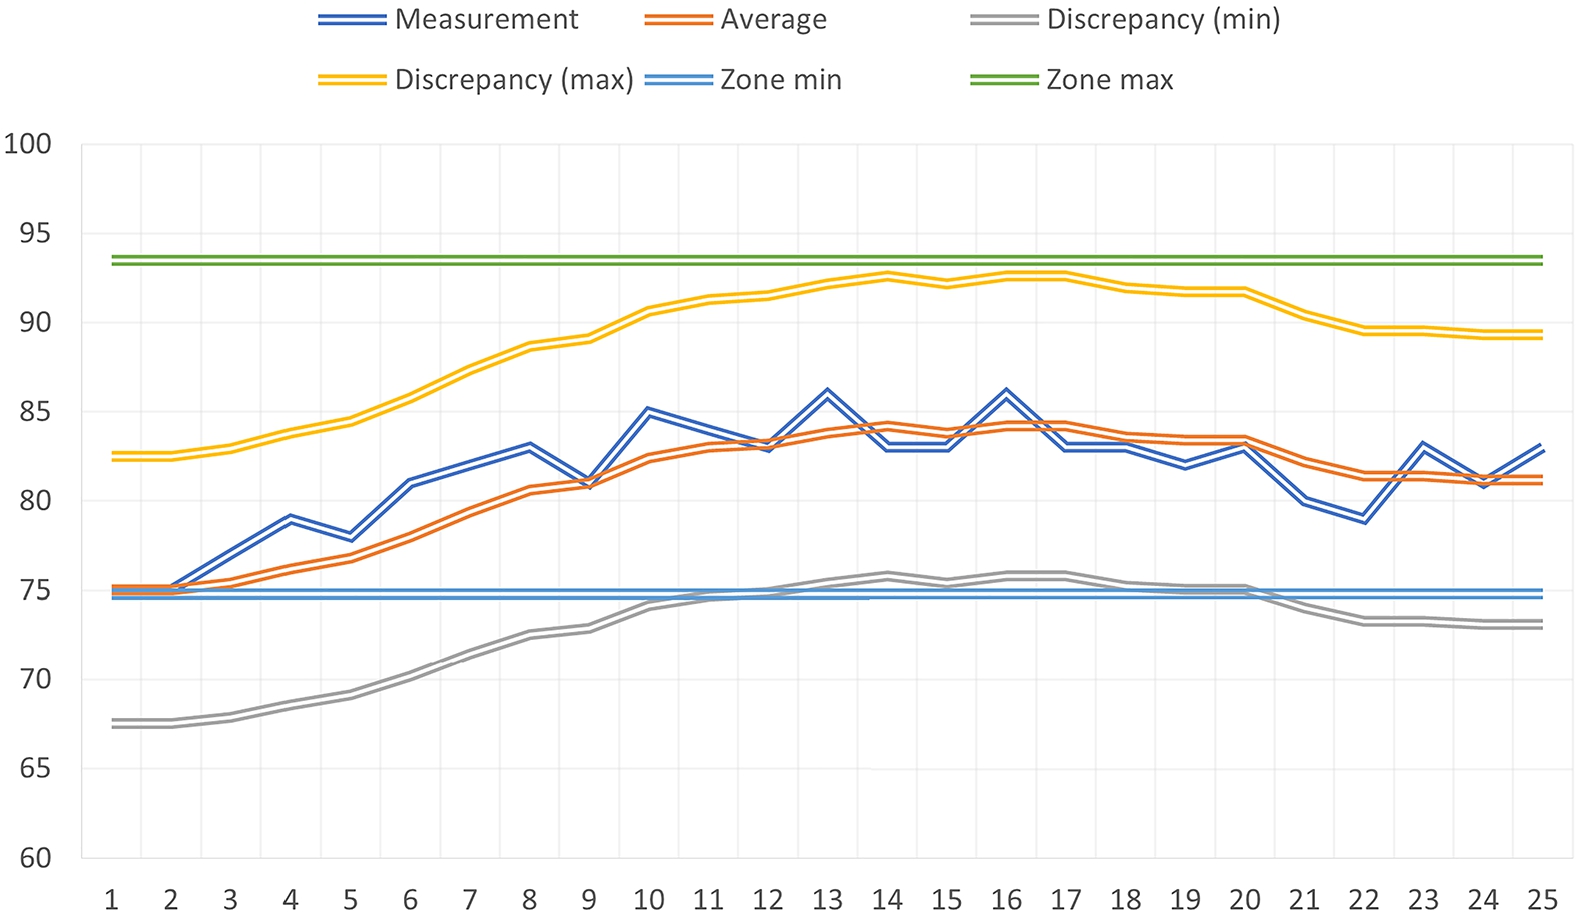
Figure 9 shows the comparison of the two methods.
For the zone method, knowing the early measurement results is unnecessary, so the classification according to the zone method is extremely resource efficient. For the moving average, the last N measurements must be known to be able to calculate. For this, the described layered architecture of Med-i-hub helps to ensure that the calculation takes place in near real-time and that accessing the data does not cause an unreasonably high load.
5.Summary
The classification of measurement data with the help of formalized knowledge can be considerably more accurate and reliable, provided that the revealed knowledge is correct. Using the additional information they possess, the external systems can extract additional useful information from the data, for which the Med-i-hub system would not have sufficient information because it does not store or cannot store the data it needs.
Actually, the biggest challenge for smart cities supported by sensors is how to efficiently deliver a huge amount of data produced by the sensors to the place of processing and how to build and maintain so many active connections for physical devices. At the time of this research, most countries are launching their own 5G networks, with which many more devices can be connected to the network compared to before, giving room for the spread of sensor-based solutions, which seems to solve the main problem of sensor-based smart cities.
To process a large amount of available sensor data, it is necessary to rethink architectures and data processing algorithms that can receive and analyze the data in real-time and extract information from the processed data and draw conclusions. During our research, we developed a two-layer architecture that aggregates data from wearable biosensor IoT devices and makes them available to external systems through open programming interfaces. With the help of a simple and less computationally demanding mathematical method. The moving average was implemented to classify the measurement data and filter out outliers or measurement errors. We combined this mathematical method with a so-called zone method, further improving the classification quality. With this combined classification method, the processing of large amounts of data can also be efficiently implemented relatively cost-effectively. The interpretation of measurement errors or outliers filtered by the described methods requires knowledge of the measurement environment, which can be provided by other system elements available in the smart ecosystem.
The data collected during the test sessions of the prototype system confirmed that the described mathematical methods can be used effectively to evaluate the measurement data. All of the positive cases were indicated by the data analysis algorithms implemented by the Med-i-hub system. At the same time, during the investigation of the measurements, the research team often had to interpret the environment of the measurement in order to be able to effectively filter out the possible outliers.
In the future, it may become possible to follow pandemics and detect their formation and progression with ordinary tools that people are using in their daily activities anyway. This requires investments in existing smart systems to extend their functionality with publishing capability for appropriate data to services that can use them effectively [15,23]. Nowadays, these systems mainly operate in isolation, strictly separated from other parties. In this paper, we have demonstrated a way that can be used to collect a large amount of data that can help eHealth systems to broaden their operation. When bio-sensory data can be collected in smart homes or smart cities and can reach healthcare systems in a proper form, it can be a life changer.
Our described prototype for the Med-i-hub system is an early demonstration of a suitable solution for creating some not-so-strict connection between isolated and closed healthcare systems operated as island systems and smart ecosystems. Sensor data integrated from the outside into these systems can be achieved by internationally recognized healthcare standards that these systems are already used. In this way, systems that are still primarily independent of each other can be connected to form a smart ecosystem where they complement each other and improve the quality of their services.
Conflict of interest
None to report.
References
[1] | O.A. Adenuga, R.M. Kekwaletswe and A. Coleman, eHealth integration and interoperability issues: Towards a solution through enterprise architecture, Health information science and systems 3: ((2015) ), 1–8. doi:10.1186/s13755-015-0009-7. |
[2] | F. Adib, H. Mao, Z. Kabelac, D. Katabi and R.C. Miller, Smart homes that monitor breathing and heart rate, in: Proceedings of the 33rd Annual ACM Conference on Human Factors in Computing Systems, (2015) , pp. 837–846. doi:10.1145/2702123.2702200. |
[3] | S. Berryhill, C.J. Morton, A. Dean, A. Berryhill, N. Provencio-Dean, S.I. Patel, L. Estep, D. Combs, S. Mashaqi, L.B. Gerald et al., Effect of wearables on sleep in healthy individuals: A randomized crossover trial and validation study, Journal of Clinical Sleep Medicine 16: (5) ((2020) ), 775–783. doi:10.5664/jcsm.8356. |
[4] | R. Cornet and N. de Keizer, Forty years of SNOMED: A literature review, BMC medical informatics and decision making 8: (1) ((2008) ), 1–6. doi:10.1186/1472-6947-8-1. |
[5] | B. Davy, Social distancing and cultural bias: On the spatiality of Covid-19, Journal of the American Planning Association 87: (2) ((2021) ), 159–166. doi:10.1080/01944363.2020.1824617. |
[6] | R.H. Dolin, L. Alschuler, S. Boyer, C. Beebe and Kona Editorial Group, An update on HL7’s XML-based document representation standards, in: Proceedings of the AMIA Symposium, American Medical Informatics Association, (2000) , p. 190. |
[7] | W. Gao, S. Emaminejad, H.Y.Y. Nyein, S. Challa, K. Chen, A. Peck, H.M. Fahad, H. Ota, H. Shiraki, D. Kiriya et al., Fully integrated wearable sensor arrays for multiplexed in situ perspiration analysis, Nature 529: (7587) ((2016) ), 509–514. doi:10.1038/nature16521. |
[8] | Á. Garai and I. Péntek, Adaptive services with cloud architecture for telemedicine, in: 2015 6th IEEE International Conference on Cognitive Infocommunications (CogInfoCom), IEEE, (2015) , pp. 369–374. doi:10.1109/CogInfoCom.2015.7390621. |
[9] | Á. Garai and I. Péntek, Common open telemedicine hub and interface standard recommendation, in: The 10th Jubilee Conference of, PhD Students in Computer Science, (2016) , p. 24. |
[10] | Á. Garai, I. Péntek, A. Adamkó and Á. Németh, Methodology for clinical integration of e-Health sensor-based smart device technology with cloud architecture, Pollack Periodica 12: (1) ((2017) ), 69–80. doi:10.1556/606.2017.12.1.6. |
[11] | D.-M. Han and J.-H. Lim, Design and implementation of smart home energy management systems based on zigbee, IEEE Transactions on Consumer Electronics 56: (3) ((2010) ), 1417–1425. doi:10.1109/TCE.2010.5606278. |
[12] | S. Hansun, A new approach of moving average method in time series analysis, in: 2013 Conference on New Media Studies (CoNMedia), IEEE, (2013) , pp. 1–4. |
[13] | X. He, E.H. Lau, P. Wu, X. Deng, J. Wang, X. Hao, Y.C. Lau, J.Y. Wong, Y. Guan, X. Tan et al., Temporal dynamics in viral shedding and transmissibility of Covid-19, Nature medicine 26: (5) ((2020) ), 672–675. doi:10.1038/s41591-020-0869-5. |
[14] | A. Hideg, L. Blázovics, K. Csorba and M. Gotzy, Data collection for widely distributed mass of sensors, in: 2016 7th IEEE International Conference on Cognitive Infocommunications (CogInfoCom), IEEE, (2016) , pp. 000193–000198. doi:10.1109/CogInfoCom.2016.7804548. |
[15] | C. Huang, Y. Wang, X. Li, L. Ren, J. Zhao, Y. Hu, L. Zhang, G. Fan, J. Xu, X. Gu et al., Clinical features of patients infected with 2019 novel coronavirus in Wuhan, China, The lancet 395: (10223) ((2020) ), 497–506. doi:10.1016/S0140-6736(20)30183-5. |
[16] | R.J. Hyndman, Moving Averages, (2011) . |
[17] | A.T. Kabakus and R. Kara, A performance evaluation of in-memory databases, Journal of King Saud University – Computer and Information Sciences 29: (4) ((2017) ), 520–525. doi:10.1016/j.jksuci.2016.06.007. |
[18] | A. Kadadi, R. Agrawal, C. Nyamful and R. Atiq, Challenges of data integration and interoperability in big data, in: 2014 IEEE International Conference on Big Data (Big Data), IEEE, (2014) , pp. 38–40. doi:10.1109/BigData.2014.7004486. |
[19] | A.A. Khaleq and I. Ra, Agnostic approach for microservices autoscaling in cloud applications, in: 2019 International Conference on Computational Science and Computational Intelligence (CSCI), IEEE, (2019) , pp. 1411–1415. doi:10.1109/CSCI49370.2019.00264. |
[20] | T.-H. Kim, C. Ramos and S. Mohammed, Smart City and IoT, Vol. 76: , Elsevier, (2017) , pp. 159–162. |
[21] | S.A. Lauer, K.H. Grantz, Q. Bi, F.K. Jones, Q. Zheng, H.R. Meredith, A.S. Azman, N.G. Reich and J. Lessler, The incubation period of coronavirus disease 2019 (Covid-19) from publicly reported confirmed cases: Estimation and application, Annals of internal medicine 172: (9) ((2020) ), 577–582. doi:10.7326/M20-0504. |
[22] | M. Lehne, S. Luijten, P.V.F. Genannt Imbusch and S. Thun, The use of FHIR in digital health – a review of the scientific literature, GMDS 267: ((2019) ), 52–58. |
[23] | D.J. Miller, J.V. Capodilupo, M. Lastella, C. Sargent, G.D. Roach, V.H. Lee and E.R. Capodilupo, Analyzing changes in respiratory rate to predict the risk of Covid-19 infection, PloS one 15: (12) ((2020) ), e0243693. doi:10.1371/journal.pone.0243693. |
[24] | T. Mishra, M. Wang, A.A. Metwally, G.K. Bogu, A.W. Brooks, A. Bahmani, A. Alavi, A. Celli, E. Higgs, O. Dagan-Rosenfeld et al., Pre-symptomatic detection of Covid-19 from smartwatch data, Nature biomedical engineering 4: (12) ((2020) ), 1208–1220. doi:10.1038/s41551-020-00640-6. |
[25] | S. Muangsrinoon and P. Boonbrahm, Burn in zone: Real time heart rate monitoring for physical activity, in: 2017 14th International Joint Conference on Computer Science and Software Engineering (JCSSE), IEEE, (2017) , pp. 1–6. |
[26] | S. Platto, T. Xue and E. Carafoli, COVID19: An announced pandemic, Cell Death & Disease 11: (9) ((2020) ), 799. doi:10.1038/s41419-020-02995-9. |
[27] | Q. Xue, Smart healthcare: Applications of the Internet of things in medical treatment and health, Information Construction 5: ((2010) ), 56–58. |


