
Parent/caregiver’s role in nutrition, physical activity, and food access among children diagnosed with spina bifida
Abstract
PURPOSE:
This pilot study aimed to determine the parent/caregiver’s role in nutrition/eating habits, physical activity behaviors, and food access among children diagnosed with spina bifida (SB).
METHODS:
Parents/caregivers of children with SB were asked to participate at a single, outpatient SB clinic. Demographic, biomedical data, parent/caregiver nutrition knowledge, family nutrition and physical activity (FNPA), and food security survey scores were compared. Descriptive, regression, and correlational statistics were conducted for analysis via SPSS 29.
RESULTS:
Of the 117 parents/caregivers surveyed, completed data suggested most were overweight/obese (average body mass index [BMI] of 30.63 kg/m2±8.40; n = 99) with an average nutrition knowledge score of 71% (17.83±3.33). As FNPA scores decreased, the patient/child’s maximum BMI z scores increased (β= –0.043; confidence interval –0.079, –0.007; p = 0.020), suggesting the less active and/or less healthy eating habits, the higher body mass was noted for the child. Forty four percent of children (n = 99) were in the overweight/obese weight range based on maximum BMI z score.
CONCLUSION:
These findings suggest there is a need for parental/caregiver nutrition education to assist children with SB with meal and activity planning to achieve optimal health.
1Introduction
Obesity is a significant issue affecting children in the United States (US). Children with disabilities, including spina bifida (SB), have an even higher incidence of obesity at some point in their developmental process and into adulthood [1]. The negative consequences of obesity are extensive and include cardiovascular disease, diabetes mellitus, mental health disease, weight stigmas, and more [2]. SB, a neural tube defect (NTD), occurs when there is lack of closure of the neural tube during embryonic development [3]. It is a general term that includes open and closed defects of myelomeningoceles and can occur from the sacrum to cervical regions of the spine [4]. As a result, individuals often have limited mobility and may experience alterations in lean body mass, thereby exacerbating the risk of obesity [5, 6].
Approximately 1 in 1200 live births are impacted by NTDs in the US, with the second most predominant form being spina bifida [3]. The International Myelodysplasia Study Group (IMSG) has labeled levels of lesions among the functional neuro-segmental groups including sacral, low lumbar, mid lumbar, and above (thoracic and cervical) [6, 7]. The classification of levels tends to correlate with ambulation and muscle function, with a higher level of the lesion portending a lower degree of mobility [5]. Some studies support the observation that children with SB are more likely to have excessive amounts of total body fat in lower extremities compared to typically developing children; however these results vary depending on ambulation or non-ambulation in other studies [6, 8, 9].
Obesity is diagnosed using the percentile level of body mass index (BMI) according to data collected by the Centers for Disease Control and Prevention (CDC) and the World Health Organization for children, with equal to or greater than the 85th percentile signifying overweight and at the 95th percentile and above as obese [10]. Additionally, BMI z-scores are calculated to account for the child’s age, gender, and deviation from the mean or average weight for age at the 50th percentile [11–13]. Classification of weight status correlates with BMI z scores of < –1.644 as underweight, –1.6449–1.034 as normal/healthy weight, 1.0364–1.6449 as overweight, and ≥1.6449 as obese [14–16].
Accuracy of measuring weight and height and assessment of BMI present many challenges in children with SB due to their varying ability to outstretch fully and other compounding factors [17]. For example, children with SB are more likely to have shorter stature, orthopedic complexities, and altered muscle mass that makes it necessary to use measurements such as arm span, recumbent length, or knee-height in clinic settings [18]. However, clinics may not be able to obtain measurements due to staff limitations and instead often use standing or recumbent tape measured lengths [19].
Treatment of obesity for children, regardless of measurement accuracy, is complicated as well due to a myriad of factors, including food choices, parental role in meal planning, overall physical activity, and SB-related side effects including treatment of urological, neurological, and musculoskeletal conditions [4]. Furthermore, psychosocial aspects of weight management are important to consider as disordered eating, depression, anxiety, self-esteem, and quality of life are typically affected [20].
Caregivers and families of children with disabilities are at higher risks for added stressors that might complicate care implementation, especially related to weight management [21]. Researchers have observed that direct parental concern for their child’s weight, increased pressure to eat/avoid certain foods, and concerns with physical ability have negatively impacted the rates of overweight and obesity in children with disabilities [22, 23]. In typically developing peers, it is widely established in the literature that the higher the parent’s weight, the more likely the child is also to be overweight or obese [24]. Therefore, the issues of poor weight management remain a significant concern for the health care team. Nonetheless, several questions including parental self-feeding behaviors and knowledge related to healthy eating have not been fully explored, especially among pediatric populations with knowndisabilities.
The primary aim of this pilot cohort study was to determine the parent/caregiver nutrition knowledge (PCNK), family nutrition and physical activity (FNPA), and food security (FS) averages to understand the relationship between parental BMI and the child with SB. The secondary aim was to observe any relationships with parental/caregiver demographics and impact on the BMI level of the child with and without considering the ambulation status of the child diagnosed with SB.
2Methods
A convenience sample of parents/caregivers of patients from a single Midwest SB clinic were asked to participate if they were over the age of 18 years, able to read/write in English, and cared for a child diagnosed with SB. Inclusion eligibility was confirmed by an institutional staff member with specific access to privileged information in the medical record. Parent/caregiver exclusion criteria included caregivers below the age of 18 or if they did not read/write in English. The SB clinic provides care for approximately 300 pediatric patients and families from birth to the age of 21 years that have a diagnosis of SB with a range of ambulation statuses. Parent/caregiver informed consent was obtained through an online Qualtrics (Qualtrics Version 1.0.0, Provo, UT) survey approved by the Institutional Review Board (IRB #10559) [25]. Parental/caregiver permission was also obtained to review HIPAA protected medical data from the child’s chart for nutritional measures, including anthropometric and SB diagnostic parameters.
Validated, modified surveys were used to measure demographic information, PCNK, FNPA, and FS. Demographic information included parent/caregiver’s self-reported gender, height, weight, health self-assessment, marital status, ethnicity, highest level of education, nutrition qualifications (to substantiate level of nutrition knowledge), and confirmation of visit to the SB clinic.
The PCNK was pared down to 23 questions from the original General Nutrition Knowledge Questionnaire developed in the 1990 s [26]. The questionnaire presented knowledge questions under the sub-headings of dietary recommendations (four questions), food group identification (two questions), overall healthy food choices, nutrition and diseases including weight management (five questions), and demographics (10 questions). Questions were not altered for this study, only reduced in number in each section to ease the burden of time on respondents. Two questions were added to ask for open ended information on nutrition qualifications and the reason why the child was brought to the health clinic. The PCNK was graded for accuracy. Percentages were compared and a letter grade was assigned to the score based on a tiered academic grading scale of 90–100 = A, 80–89 = B, 70–79 = C, 60–69 = D, and 50–59 = F [27]. The mean and standard deviation (SD) were compared.
The FNPA screening tool was included for this study. It contains two Likert-style questions for each of the 10 sub-topics: family meals, family eating practices, food choices, beverage choices, restrictions/rewards, screen time, healthy environment, family activity, child activity, and family schedule/sleep routine [28]. Items were scored according to the highest level of response compared to the lowest level, except for a reverse score for six constructs that were negative in nature due to the question design (reverse scoring for questions: two family eating practices, one food choices, one beverage choices, one restriction/reward, and one healthy environment) [29].
The adapted US Department of Agriculture household FS questionnaire contains questions that ask about availability of foods wanted and/or needed, sufficient funds to obtain these foods, and ability to obtain balanced meals throughout a 12-month time period (19 questions) [30]. The questions were altered from verbal to written form for this study, as they were originally created to be asked in a face-to-face interview format. The context remained the same. Questions were scored with a number value based on responses of highest FS down to the lowest level for each question within the questionnaire. The maximum score possible was 56, indicating a high level of FS. Of note, this study took place during the nationwide COVID-19 pandemic and some foods were hard to obtain as a result.
One open-ended question was asked to identify how often the nationwide COVID-19 pandemic impacted the families’ eating in the past year. Results were tallied for frequency and percentages of responses based on: (1) No impact; (2) Increased eating at home; (3) Increased consumption of food; (4) Consumed foods outside of the home more often; (5) Not able to find foods desired; or (6) Some impact; non-specified.
Demographic information completed by the parent/caregiver was used to assess the population that cared for children with SB. The parent/caregiver’s BMI was calculated from the self-reported height and weight and assigned a level according to the CDC classification of underweight (BMI 18.5 or less), normal weight (BMI 18.5–24.9), overweight (BMI 25–29.9), or obese (BMI 30 or above) [31]. The percentage, mean, and SD were determined for parent/caregiver’s gender, BMI level, marital status, self-reported health status (1 = poor; 2 = fair; 3 = good; 4 = excellent), ethnicity, and the highest level of education completed.
Demographic information of the child with SB was obtained from the child’s Cerner electronic medical record (EMR) and included gender, age, height, weight, ambulatory status (ambulatory as defined as primarily walking or assisted walking with crutches or impaired ambulation as defined by primarily using a wheelchair), and BMI over a three-year period. The maximum BMI z score was also included [32] to adjust for differences in measurements across separate clinics and clinic visits within a similar time frame. If wide variability existed in BMI z scores (greater than two SDs), the number was investigated and only included if it was supported by height and weight measures in the health record. This occurred in eight (8.08%) cases. The higher BMI z score was included compared to the lower level when the child was in the underweight category and had a recorded BMI z score in the normal category; this was the case for four patients. The higher BMI z score was included when measures were in both the overweight and normal categories (one patient); and the obese category was included when BMI z scores were both in the overweight and obese categories (three patients). The inclusion/exclusion of outlier BMIs for these small number of cases did not significantly impact the overall categorization of the overweight/obese population (44% maximum BMI z score vs 40.4% actual SB clinic visit). Height or length measurement obtainment procedures were not recorded in the EMR. However, the typical clinic procedure is to measure a standing height if the child/patient can stand unassisted against a wall-mounted stadiometer or measured with a tape measure in a supine position if unable to stand erect. The child’s functional neuro-segmental levels according to the IMSG criteria were evaluated and noted. Since some crossover in the diagnosis of distinct categories existed, ambulation status was evaluated post-study to capture the impact of mobility on weight status.
Multivariable linear regression was performed to estimate the association between survey results and child/patient maximum BMI z scores when accounting for child/patient gender, age, PCNK, FNPA, and FS on maximum BMI z scores. Significance was set at p < 0.05. All statistical analyses were performed with IBM SPSS 29 software [33] and reviewed with a biostatistician.
3Results
3.1Parent/caregiver demographic results
The study participants comprised of parents/caregivers (n = 117) of children (n = 118) aged 2–18 years with SB (one parent cared for two children with SB). Only complete data for all variables were used in the analysis (n = 99; 77.8% White, 10.1% African American, 9.1% Latino, 3.0% other). Self-reported height and weight indicated 68.7% of the parent/caregivers were overweight/obese. The mean BMI was 30.63 kg/m2±8.40. Most parents/caregivers were married or living with a partner (67.6%) compared to those that were single, widowed, separated, or divorced (35.3%). For the highest education level completed, almost a third of the respondents had some high school credits or completed high school (30.3%), a third had completed some college credits or associate degree (33.3%), and just over a third completed a bachelor’s degree or higher (36.4%). Most parents/caregivers reported their health to be “Good” or “Very Good” (∼68%) versus “Fair” (∼26%) or “Poor” (5%). See Table 1.
Table 1
Parent/caregiver (n = 99) reported demographic information for gender, calculated body mass index (BMI) level, marital status, self-reported health status, ethnicity, and highest educational level completed
| Parent/Caregiver Descriptive Statistics (n = 99) | ||
| Frequency | Percent (%) | |
| Gender | ||
| Male | 15 | 15.2 |
| Female | 84 | 84.8 |
| Calculated BMI Level | ||
| Underweight | 3 | 3.0 |
| Normal Weight | 28 | 28.3 |
| Overweight | 20 | 20.2 |
| Obese | 48 | 48.5 |
| Marital Status | ||
| Married/Living as Married | 67 | 67.6 |
| Single | 22 | 22.2 |
| Separated | 1 | 1.0 |
| Divorced | 7 | 7.1 |
| Widowed | 2 | 2.0 |
| Self-Reported Health Status | ||
| Poor | 5 | 5.1 |
| Fair | 26 | 26.3 |
| Good | 49 | 49.5 |
| Very Good | 19 | 19.2 |
| Ethnicity | ||
| White | 77 | 77.8 |
| African American | 10 | 10.1 |
| Latino | 9 | 9.1 |
| Other | 3 | 3.0 |
| Highest Education Level Completed | ||
| Some High School/High School | 30 | 30.3 |
| Some College/Associate Degree | 33 | 33.3 |
| Bachelor’s Degree | 19 | 19.2 |
| Some Graduate/Master’s Degree | 14 | 14.2 |
| Advanced Degree | 3 | 3.0 |
3.2Patient demographic results
All patients were between the ages of two and 18 years (mean 8.74 years±4.741 SD) with 50.5% males and 49.5% females. The maximum BMI z scores recorded during the three-year chart review were included for analysis mean (0.073±1.23 SD), and 44.4% of children had a BMI z score in the overweight/obese range. Comparatively, 51% of the children included had normal BMI levels and 5% were underweight. Impaired mobility was documented for 41.4% of the children while 58.6% were able to ambulate. See Table 2.
Table 2
Patient/child (n = 99) demographic results for gender, age, maximum body mass index (BMI) z score and corresponding classification, and ambulation status
| Patient/Child Descriptive Statistics (n = 99) | |||
| Frequency | Percentage (%) | Mean±Standard Deviation | |
| Gender | |||
| Male | 50 | 50.5 | |
| Female | 49 | 49.5 | |
| Patient Age (years) | |||
| 2–4 | 25 | 25 | |
| 5–8 | 24 | 24 | |
| 9–12 | 24 | 24 | |
| 13–15 | 15 | 15 | |
| 16–18 | 11 | 11 | |
| Patient Maximum BMI Z Score | |||
| < –1.6449 (Underweight) | 5 | 5 | |
| –1.6449 –1.034 (Normal Weight) | 50 | 51 | 0.73±1.23 |
| 1.0364 –1.6449 (Overweight) | 23 | 23 | |
| ≥1.6449 (Obese) | 21 | 21 | |
| Ambulation Status | |||
| Impaired Mobility | 41 | 41.4 | |
| Ambulatory | 58 | 58.6 | |
3.3Parent/caregiver results
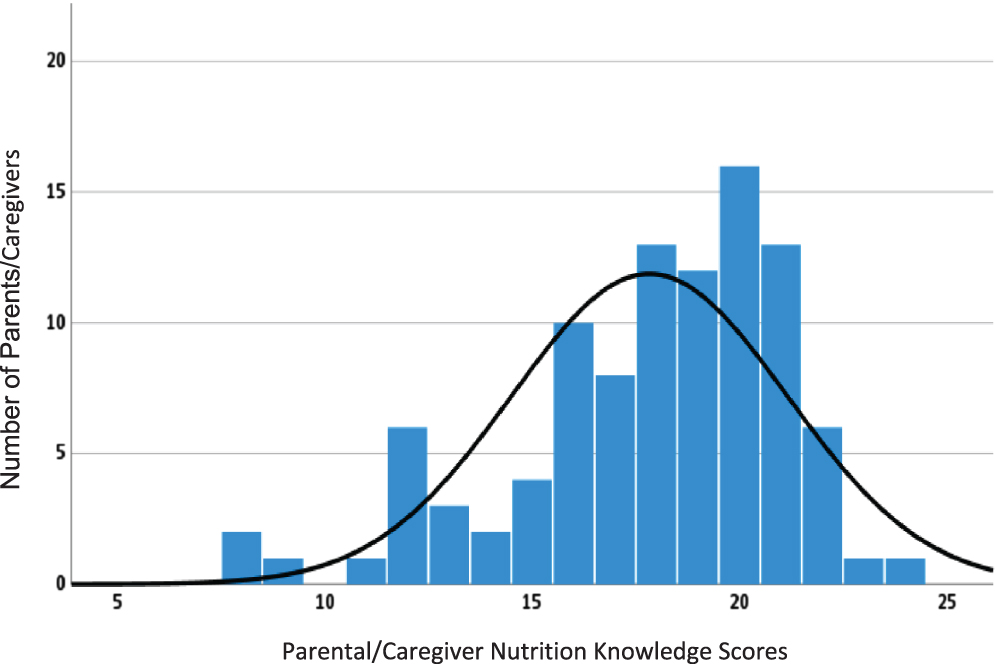
PCNK results showed a mean score of 17.83±3.326 SD out of 25 questions. This equated to a 70% average, or “C” grade when converted to an academic grading scale. The median score was 18 with a range of 8–24 (maximum 25). See Fig. 1.
Fig. 1
Frequency and tabulated parental/caregiver nutrition knowledge (PCNK) survey scores. The mean PCNK score was 17.83±3.326 (n = 99) within this population.
The FNPA scores indicated a mean of 58.91±7.53 SD. The range was 40–77 with a median score of 59, suggesting an average of about 76% adequacy of healthy family habits for eating and activity for the entire group. FS scores ranged from 36 to 56 with an overall mean of 54.64±3.196 SD (median 56), suggesting there was rarely an issue with FS among this population; most families identified as food secure.
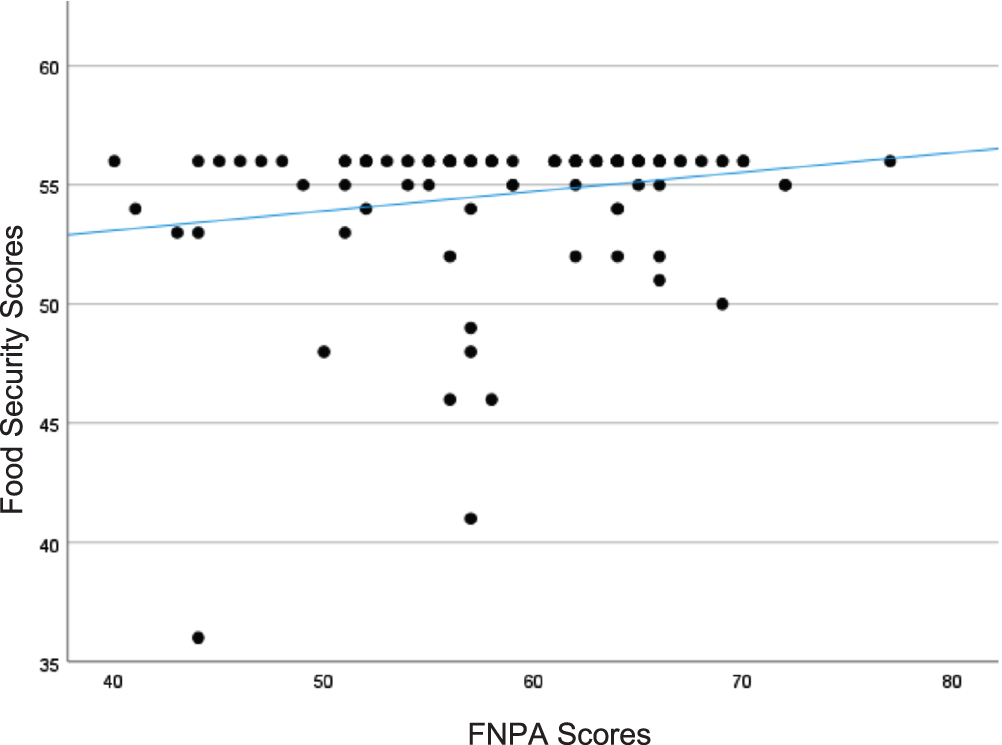
FNPA scores were compared to the child’s maximum BMI z scores when accounting for PCNK, FS, child’s gender, and child’s age and a significant negative relationship was identified (β = –0.043, confidence interval [CI] –0.079, –0.007; p =.020). See Fig. 2. As FNPA scores decreased, BMI levels increased in children, suggesting there was less activity or fewer positive eating habits within the family. The relationship between FS and FNPA was explored, and a significant trend was noted with FNPA scores in this population; however, a limited range of FS scores may have affected this finding (β = 0.534, CI 0.126, 0.941; p = .011). See Fig. 3.
Fig. 2
Family nutrition and physical activity (FNPA) scores reported and demonstrated a significant negative trend with the child’s maximum body mass index (BMI) z score when accounting for parent/caregiver nutrition knowledge (PCNK), food security (FS), patient age, and patient gender within families with children diagnosed with spina bifida in this population (p≤0.05).
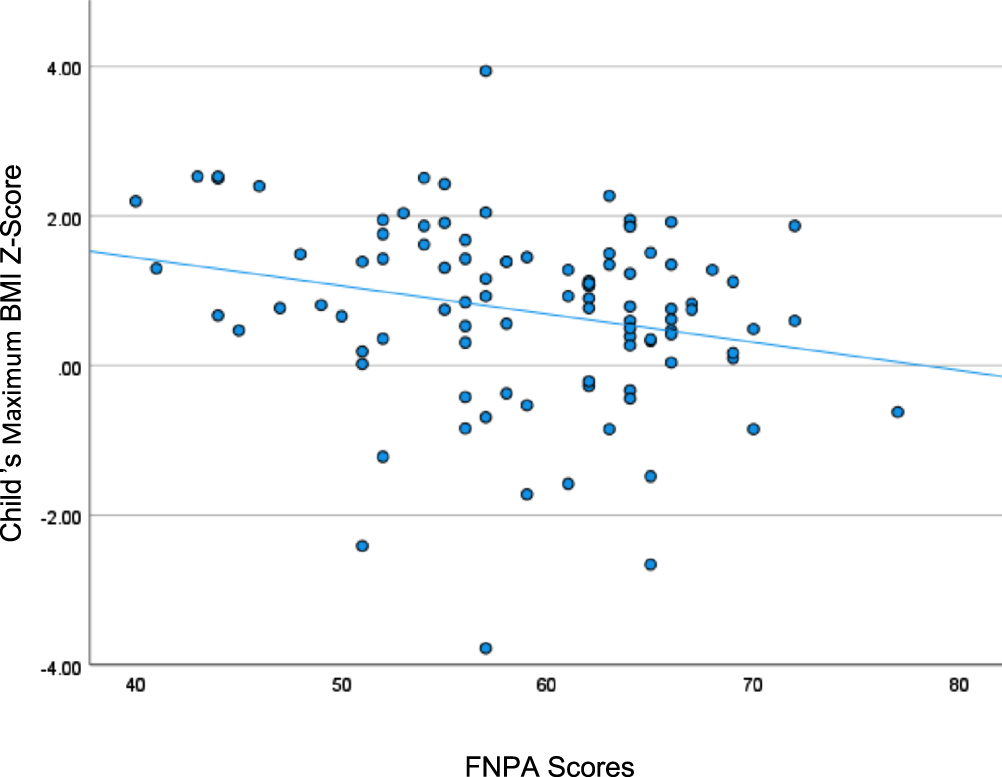
Fig. 3
Food security (FS) scores and family nutrition and physical activity (FNPA) scores demonstrated a positive relationship trend in families with children with spina bifida, suggesting few low security scores were present, while FNPA scores trended upward within this population; however, a limited range of FS scores may have affected this finding (p≤0.05).
When assessing self-reported parent/caregiver BMI and health status, average BMI levels were in the obese category (mean 30.63±8.398) and the average perception of overall health status was fair-good (mean 2.83±0.796). This suggests there may be factors parents/caregivers consider other than weight that equate to generalized health in this group, but more information is needed.
3.4Impact of COVID-19
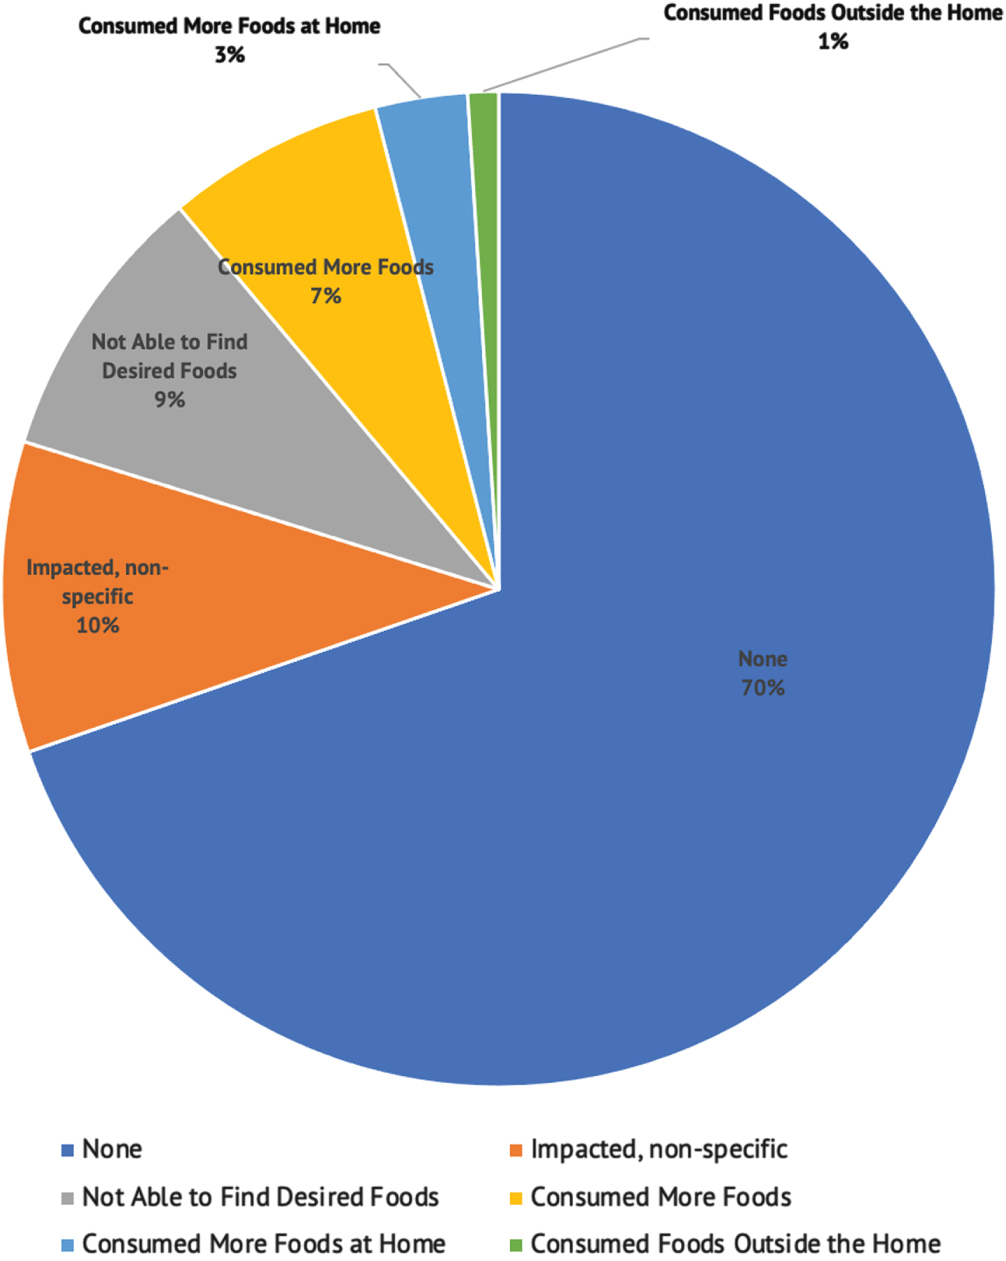
One open-ended question related to COVID-19 asked how often eating was impacted. Most respondents (69%) reported COVID-19 had no impact on eating during the one year the study was conducted. Of those that reported an impact, most were not specified (10%), while others suggested not being able to find desired foods (9%), along with increased food consumption (7%), transition to eating more foods at home (3%), and eating more outside of the home (1%). See Fig. 4.
Fig. 4
Descriptions and responses of the impact the nationwide COVID-19 pandemic presented for families with children with spina bifida, including percentages of responses from one open-ended question regarding how often eating was impacted during the past year in this population.
4Discussion
Caring for children with special needs presents many challenges. Other researchers have found there are significant stressors that exist more often for parents/caregivers caring for children with disabilities compared to typically developing peers [34]. Significant data support that children with disabilities, including SB, are at greater risk of obesity long term, and the confounding factors coincide with higher weight levels for stature [35]. When considering the risks associated with obesity, it is evident the care team must provide adequate treatment focused on reducing incidences of overweight and obesity in this pediatric population.
It is largely unknown how the parent/caregiver’s knowledge of nutrition, family activity and eating behaviors, and access to food impact the BMI levels of children with SB. Based on the results of this study, approximately 30% of parents/caregivers had a good understanding of nutrition while approximately 70% scored at a “C” level or below. Therefore, it seems apparent there is room for improvement in nutrition education access and delivery for the parent/caregivers.
The family activity and eating behavior scores suggested a wide range of positive to negative behaviors. As the FNPA scores decreased in this group, BMI levels increased in children. This suggests obesity may be reduced in this population if higher levels of physical activity could be achieved and positive eating behaviors incorporated. Since 40% of the patients/children were noted to have impaired mobility, considering adaptive movement goals would be more inclusive. Additionally, the parental/caregiver perception of their own health status suggested they may not be considering weight status as a health risk factor since the majority were obese and viewed their health as fair-good. However, only one measurement was included in this study, and more validated variables and tools need to be considered in order to further investigate this relationship.
Many studies suggest that poor food access, poverty, or living in food deserts may significantly relate to obesity [36, 37]. However, FS was not reported as a significant factor in this study. FS did not appear to contribute to the obesity levels noted in parent/caregivers or children, although the results suggested that the more FS a parent/caregiver reported, the higher the likelihood that the FNPA would be higher and therefore more positive. However, more information is needed.
The knowledge of healthy nutrition practices combined with positive activity and family eating behaviors appear to be key components of controlling obesity, potentially among parents/caregivers and children alike [38]. Education in the form of prescriptive dietary intake and physical activity implementation within the family unit may ultimately help reduce levels of obesity on a significant level [39, 40]. Creating targeted education materials (paper, digital, etc.) may be the next step in encouraging health practices that include both adaptive movement goals and food intake recommendations that are more tailored to the SB pediatric population.
Several limitations existed in this study. Approximately 16% of the data was not used in the analysis due to incomplete variables, primarily parent/caregiver’s not reporting their weight and highest educational level completed. The remaining subjects (parents/caregivers and children) represented roughly a third of the patient population treated at this specific clinic. More inquiries could have been made in the data collection phase; however, survey data collection can disrupt clinic procedures. Only participants that could read/write in English were incorporated for this preliminary data collection as alternative language translational surveys were not feasible for the research team due to time constraints. This may have inadvertently contributed to selection bias but was not intended to exclude any participants. Approximately 5% of the clinic families require an interpreter for a language other than English, a relatively low subset of this population.
The surveys used in this pilot study were adjusted for ease of use and to be in written format. The PCNK questionnaire was shortened in length to allow for more total surveys to be included in the overall data collection. The FNPA survey was not changed from the validated format and scoring completion was noted. The FS tool was changed to be in a written format instead of verbal questions completed by an interviewer; this was done to allow for completion in a manner that was less intrusive for the family member and that could be recorded in the online survey. This may have altered the validation but was not intended to skew the findings or deter from previously validated questionnaires. Further, the FS survey included questions about “well-balanced” meals. No definition of a “well-balanced” meal was given and this may have prevented the responder from understanding this question.
The maximum BMI and BMI z scores found in the EMR were included over a three-year period, which may not necessarily represent the current BMI level nor account for improvements with weight management that could have occurred during that time. If a discrepancy of greater than two SDs was listed, a health care professional reviewed the numbers more thoroughly and verified the height and weight for inclusion in the analysis. Since this population of patients often had multiple providers, it was possible for different weights and heights to be recorded on different scales in different clinics. An effort was made to include the measurements from the SB clinic visit to assure the accuracy of measurement. This method impacted 8% of cases presented and this was adjusted to capture the scope of growth changes. However, the SB clinic obtains standing heights if patients are able to stand and segmented lengths in a supine position if patients are not able to stand unassisted.
Use of parent/caregiver self-reported BMI was another limitation in this study. Actual measurements collected in the clinic would have been more accurate, but self-reported data can be helpful for descriptive inquiry of the population. Several parents/caregivers did not report this information which resulted in loss of data collection for analysis. However, some relationships could be noted from this preliminary study and may serve as evidence to support the need to obtain families/caregivers’ actual biomedical data in future studies. Furthermore, use of only one Likert-style question for assessment of health status was not enough to determine a full assessment of parent/caregiver’s health perceptions. More information is needed to determine these relationships.
5Conclusions
Obesity risk in the pediatric SB population is very real and was apparent within this subset of patients. The connection between parent/caregiver and child BMI levels suggests a relationship that occurs possibly genetically or environmentally. Despite a wide range of functional and physical mobility, there is still room for more nutrition and diet education to promote healthy eating and weight management to prevent long-term health complications (e.g., cardiovascular disease, psychosocial difficulties) even though all families included in this study met with a registered dietitian nutritionist in this clinic for various reasons.
The next step is to explore the development of nutrition materials that would further support the entire family’s educational needs while clearly emphasizing the risks and benefits of obesity as well as knowledge of eating and activity practices within families with a child with SB. Consideration of a specified protocol for nutrition education initiation related to substantial risk of obesity in this population may be necessary, beginning at the age of four years, since nutrition macro- and micronutrient needs change during this time of development. Providing education that supports inclusion of healthy meals for patients/children that are at considerable risk of obesity would be most beneficial, along with guidance on physical movement goals adapted for this population.
Acknowledgments
The authors would like to thank the outpatient Spina Bifida Care Team for allowing this research to be conducted. Also, special thanks to George Eckert, biostatistician, for extensive review. No outside funding source was utilized.
Conflicts of interest
The authors have no conflicts of interest to report.
References
[1] | McPherson AC , Swift JA , Yung E , Lyons J , Church P . The assessment of weight status in children and young people attending a spina bifida outpatient clinic: a retrospective medical record review. Disabil Rehabil. (2013) ;35: (25):2123–31. doi: 10.3109/09638288.2013.771705. |
[2] | Browne NT . Obesity and Children. Nurs Clin North Am. (2021) ;56: (4):583–97. doi: 10.1016/j.cnur.2021.07.006. |
[3] | Avagliano L , Massa V , George TM , Quereshy S , Bulfamante GP , Finnell RH . Overview on neural tube defects: From development to physical characteristics. Birth Defects Res. (2019) ;111: (19):1455–67. doi: 10.1002/bdr2.1380. |
[4] | Philips LA , Burton JM , Evans SH . Spina Bifida Management. Curr Probl in Pediatr Adolesc Health Care. (2017) ;47: (7):173–7. doi: 10.1016/j.cppeds.2017.06.007. |
[5] | Pauly M , Cremer R . Levels of mobility in children and adolescents with spina bifida-clinical parameters predicting mobility and maintenance of these skills. Eur J Pediatr Surg. (2013) ;23: (2):110–4. doi: 10.1055/s-0032-1324689. |
[6] | Mueske NM , Ryan DD , Van Speybroeck AL , Chan LS , Wren TAL . Fat distribution in children and adolescents with myelomeningocele. Dev Med Child Neurol. (2015) ;57: (3):273–8. doi: 10.1111/dmcn.12591. |
[7] | Rethlefsen SA , Bent MA , Mueske NM , Wren TAL . Relationships among classifications of impairment and measures of ambulatory function for children with spina bifida. Disabil Rehabil. (2021) ;43: (25):3696–700. doi: 10.1080/09638288.2020.1746845. |
[8] | Mita K , Akataki K , Itoh K , Ono Y , Ishida N , Oki T . Assessment of obesity of children with spina bifida. Dev Med Child Neurol. (1993) ;35: (4):305–11. doi: 10.1111/j.1469-8749.1993.tb11642.x. |
[9] | Shepherd K , Roberts D , Golding S , Thomas BJ , Shepherd RW . Body composition in myelomeningocele. Am J Clin Nutr. (1991) ;53: (1):1–6. doi: 10.1093/ajcn/53.1.1. |
[10] | Hurvitz EA , Green LB , Hornyak JE , Khurana SR , Koch LG . Body mass index measures in children with cerebral palsy related to gross motor function classification: a clinic-based study. Am J Phys Med Rehabil. (2008) ;87: (5):395–403. doi: 10.1097/PHM.0b013e3181617736. |
[11] | Monasor-Ortolá D , Quesada-Rico JA , Nso-Roca AP , et al. Degree of Accuracy of the BMI Z-Score to Determine Excess Fat Mass Using DXA in Children and Adolescents. Int J Environ Res Public Health. (2021) ;18: (22):12114. doi: 10.3390/ijerph182212114. |
[12] | Mears R , Salway R , Sharp D , Shield JPH , Jago R . A longitudinal study investigating change in BMI z-score in primary school-aged children and the association of child BMI z-score with parent BMI. BMC Public Health. (2020) ;20: (1):1902. doi: 10.1186/s12889-020-10001-2. |
[13] | Martinez-Millana A , Hulst JM , Boon M , et al. Optimisation of children z-score calculation based on new statistical techniques. PLoS One. (2018) ;13: (12):e0208362. doi: 10.1371/journal.pone.0208362. |
[14] | Vanderwall C , Eickhoff J , Randall Clark R , Carrel AL . BMI z-score in obese children is a poor predictor of adiposity changes over time. BMC Pediatrics. (2018) ;18: (1):187. doi: 10.1186/s12887-018-1160-5. |
[15] | Iijima M , Stall M , Wang L , et al. Changes in body mass index, weight, and height in children with acute myeloid leukemia and the associations with outcome. Blood Adv. (2022) ;6: (9):2824–34. doi: 10.1182/bloodadvances.2021006090. |
[16] | Kuczmarski RJ , Ogden CL , Guo SS , et al. CDC Growth Charts for the United States: methods and development. Vital Health Stat. (2002) ;11(246):1–190. |
[17] | Liu JS , Dong C , Vo AX , et al. Obesity and anthropometry in spina bifida: What is the best measure. J Spinal Cord Med. (2018) ;41: (1):55–62. doi: 10.1080/10790268.2016.1195071. |
[18] | Froehlich-Grobe K , Nary DE , Van Sciver A , Lee J , Little TD . Measuring Height Without a Stadiometer: Empirical Investigation of Four Height Estimates Among Wheelchair Users. Am J Phys Med Rehabil. (2011) ;90: (8):658–66. doi: 10.1097/PHM.0b013e31821f6eb2. |
[19] | Modrcin AC , Luce J , Abdel-Rahman SM . Mercy TAPE for Calculation-Free Height Estimation in Pediatric Rehabilitation Patients. PM&R. (2020) ;12: (6):538–45. doi: 10.1002/pmrj.12317. |
[20] | Sarwer DB , Polonsky HM . The Psychosocial Burden of Obesity. Endocrinol Metab Clin North Am. (2016) ;45: (3):677–88. doi: 10.1037/amp0000610. |
[21] | Polfuss M , Marston E , Pridham K , Brown R , McPherson AC . Relationship between Stress and Feeding Behaviors in Parents of Children with Developmental Disabilities. Child Obes. (2021) ;17: (7):457–66. doi: 10.1089/chi.2020.0356. |
[22] | Eow SY , Gan WY , Lim PY , Awang H , Mohd Shariff Z . Parental Feeding Practices and Child-Related Factors are Associated with Overweight and Obesity in Children and Adolescents with Autism Spectrum Disorder. J Autism Dev Disord. (2022) ;52: (8):3655–67. doi: 10.1007/s10803-021-05247-7. |
[23] | Polfuss M , Simpson P , Neff Greenley R , Zhang L , Sawin KJ . Parental Feeding Behaviors and Weight-Related Concerns in Children With Special Needs. West J Nurs Res. (2017) ;39: (8):1070–93. doi: 10.1177/0193945916687994. |
[24] | Karmali S , Ng V , Battram D , et al. Coaching and/or education intervention for parents with overweight/obesity and their children: study protocol of a single-centre randomized controlled trial. BMC Public Health. (2019) ;19: (1):345. doi: 10.1186/s12889-019-6640-5. |
[25] | Provo City + Qualtrics. Provo, UT: Qualtrics; 2020. Available from: https://www.qualtrics.com/customers/provo/ |
[26] | Kliemann N , Wardle J , Johnson F , Croker H . Reliability and validity of a revised version of the General Nutrition Knowledge Questionnaire. Eur J Clin Nutr. (2016) ;70: (10):1174–80. doi: 10.1038/ejcn.2016.87. |
[27] | Ange B , Wood EA , Thomas A , Wallach PM . Differences in Medical Students’ Academic Performance between a Pass/Fail and Tiered Grading System. South Med J. (2018) ;111: (11):683–7. doi: 10.14423/SMJ.0000000000000884. |
[28] | Ihmels MA , Welk GJ , Eisenmann JC , Nusser SM . Development and preliminary validation of a Family Nutrition and Physical Activity (FNPA) screening tool. Int J Behav Nutr Phys Act. (2009) ;6: :14. doi: 10.1186/1479-5868-6-14. |
[29] | Welk G . The Family Nutrition & Physical Activity Screening Tool! Ames, IA: Iowa State University; 2017. Available from: http://www.myfnpa.org/ |
[30] | Rabbitt MP , Hales LJ , Reed-Jones M , Coleman-Jensen A . Measurement. USDA: Economic Research Service; 2022 [cited 2022 Nov 21]. Available from: https://www.ers.usda.gov/topics/food-nutrition-assistance/food-security-in-the-u-s/measurement/ |
[31] | Prevalence of Childhood Obesity in the United States. Centers for Disease Control and Prevention; 2022 [updated 17 May 2022]. Available from: https://www.cdc.gov/obesity/data/childhood.html |
[32] | Health systems. Oracle Cerner; 2023. Available from: https://www.cerner.com/solutions/health-systems |
[33] | IBM SPSS Statistics forWindows (Version 27.0). Armonk, NY: IBM Corp; 2020. Available from: https://www.ibm.com/support/pages/downloading-ibm-spss-statistics-27 |
[34] | Scherer N , Verhey I , Kuper H . Depression and anxiety in parents of children with intellectual and developmental disabilities: A systematic review and meta-analysis. PLoS One. (2019) ;14: (7):e0219888. doi: 10.1371/journal.pone.0219888. |
[35] | McPherson AC , Chen L , O’Neil J , Vanderbom KA . Nutrition, metabolic syndrome, and obesity: Guidelines for the care of people with spina bifida. J Pediatr Rehabil Med. (2020) ;13: (4):637–53. doi: 10.3233/PRM-200753. |
[36] | Gordon-Larsen P . Food availability/convenience and obesity. Adv Nutr. (2014) ;5: (6):809–17. doi: 10.3945/an.114.007070. |
[37] | Mattes R , Foster GD . Food environment and obesity. Obesity (Silver Spring). (2014) ;22: (12):2459–61. doi: 10.1002/oby.20922. |
[38] | Balani R , Herrington H , Bryant E , Lucas C , Kim SC . Nutrition knowledge, attitudes, and self-regulation as predictors of overweight and obesity. J Am Assoc Nurse Pract. (2019) ;31: (9):502–10. doi: 10.1097/JXX.0000000000000169. |
[39] | Fock KM , Khoo J . Diet and exercise in management of obesity and overweight. J Gastroenterol Hepatol. (2013) ;28: (Suppl 4):59–63. doi: 10.1111/jgh.12407. |
[40] | Carbone S , Del Buono MG , Ozemek C , Lavie CJ . Obesity, risk of diabetes and role of physical activity, exercise training and cardiorespiratory fitness. Prog Cardiovasc Dis. (2019) ;62: (4):327–33. doi: 10.1016/j.pcad.2019.08.004. |


