
Association Between Body Mass Index Changes and All-Cause Mortality in Parkinson’s Disease
Abstract
Background:
Whether body weight changes are associated with Parkinson’s disease (PD) mortality remains uncertain.
Objective:
To investigate the association between changes in body mass index (BMI) and all-cause mortality in patients with PD.
Methods:
This nationwide cohort study enrolled 20,703 individuals with new-onset PD (ICD-10 code: G20 and a rare intractable disease registration code: V124) who underwent health screening program by the Korean National Health Insurance Service within two years from pre- and post-PD diagnosis. We identified nine BMI change groups based on three BMI status: underweight (BMI < 18.5 kg/m2), normal or overweight (18.5 kg/m2≤BMI < 25 kg/m2), and obese (BMI≥25 kg/m2).
Results:
Of 20,703 individuals, 3,789 (18.0%) died during the follow-up period. Excessive weight loss to underweight in the obese group (hazard ratio [HR] = 3.36, 95% CI:1.60–7.08), weight loss in the normal to overweight group (HR = 2.04, 95% CI:1.75–2.39), sustained underweight status (HR = 2.05, 95% CI:1.67–2.52), and weight gain from underweight to normal or overweight (HR = 1.52, 95% CI:1.15–2.02) were associated with increased mortality. Sustained obese status (HR = 0.80, 95% CI:0.74–0.87) and weight gain in the normal to overweight group (HR = 0.82, 95% CI:0.71–0.95) were associated with reduced mortality.
Conclusions:
We found that BMI change at diagnosis was associated with mortality in patients with PD. Specifically, being underweight either before or after diagnosis as well as experiencing weight loss, were associated with increased mortality. These findings provide valuable insights for weight management planning in PD, highlighting the importance of individualized approach that consider pre-diagnosis BMI.
Plain Language Summary
Whether body weight changes are associated with Parkinson’s disease (PD) mortality remains uncertain. This study looked at how changes in body weight affect the chances of survival in people who have recently been diagnosed with PD. We followed 20,703 individuals who were newly diagnosed with this condition and checked their weight changes before and after their diagnosis. We found that people with PD who lost a lot of weight to become underweight had a higher risk of dying during our study. Similarly, those who were already underweight and remained so also had a higher mortality risk. On the other hand, people who maintained a weight or gained a small amount of weight after their diagnosis had the lowest risk of dying. Our research found that weight changes at diagnosis were associated with mortality in PD, with underweight or weight loss being linked to increased risk of death. Each person’s situation is different, so weight management should be tailored to each individual, considering their weight before they were diagnosed with PD.
INTRODUCTION
Parkinson’s disease (PD) is the second most common neurodegenerative disorder and is characterized by cardinal motor symptoms, such as bradykinesia, resting tremor, rigidity, and postural instability. PD is also associated with a complex range of non-motor symptoms, including cognitive impairment, mood or sleep disorders, autonomic dysfunction, gastrointestinal symptoms, and weight loss.1,2 Patients with PD have significantly lower body weight or body mass index (BMI) than controls.3–9 Several factors such as the levodopa use, dysphagia, anosmia, rigidity, and dyskinesia have been suggested as possible causes of weight loss.10
The relationship between incident PD and body weight as a risk factor remains unclear, with conflicting results in previous observational studies.11–15 In recent meta-analysis and cohort studies, low BMI or underweight status has been associated with higher risk of PD.11,13,16 In a prospective study that included 10,812 men in the United States, BMI was unrelated to PD risk, but a decrease of BMI by 0.5 per decade was significantly associated with a subsequent two-fold risk of developing PD compared with participants maintaining stable BMI.13 Another study reported higher prevalence of overweight BMI status and central obesity in the early disease stages of PD.17 However, the association between weight or BMI changes (including gain and loss) and PD mortality has been investigated in few studies, which have reported inconsistent results.18–22 Some studies have suggested that low BMI or BMI decrease was associated with increased mortality in PD,18,19,22 whereas one study reported no association between weight loss by 5% and 10% and PD mortality.21 Some studies have even identified that obesity may play a protective role in disease development and mortality in PD.15
Obesity is a well-established risk factor for various chronic diseases, including diabetes and cardiovascular diseases, all of which contribute to elevated mortality risk.23 Hence, the question arises whether maintaining a high BMI status is good for mortality in obese patients with PD and whether weight loss is associated with an increase in mortality in this group. One possible reason for the inconsistent results of previous studies on the association between weight change and PD mortality may be the different baseline BMI in patients with PD, which influenced the association between weight change and mortality Our hypothesis is that BMI change at PD diagnosis is associated with mortality in individuals with PD, and that this association may vary depending on the baseline BMI of each individual. Therefore, this study aimed to investigate the association between changes in BMI, stratified by baseline BMI, and all-cause mortality in individuals with PD using data from the Korean National Health Insurance Service (NHIS).
METHODS
Data source
In this cohort study, we used the data from Korean NHIS, a single, mandatory, and universal health insurance system launched in 2000, which covers approximately 97% of the Korean population, approximately 3% of whom are Medical Aid beneficiaries. Therefore, the NHIS contains almost all information regarding healthcare utilization in Korea. Information such as diagnosis based on the International Classification of Diseases, 10th Revision (ICD-10), prescribed medication, procedural codes, and use of medical clinics were included without personal identification.
Standard protocol approvals, registrations, and patient consents
This research was approved by the Institutional Review Board at Korea University Guro Hospital (No. 2022GR0325) and the requirement for informed consent was waived. This study was conducted in accordance with the guidelines for Strengthening the Reporting of Observational Studies in Epidemiology-Cohort study.
Study participants
Initially, we selected individuals newly diagnosed with PD between 2010 and 2016. PD was identified using the ICD-10 code for PD (G20) and PD registration code (V124) in the registry of rare and intractable diseases according to previous studies.24–26 Since 2006, the Korean government has implemented a rare and intractable disease registry for co-payment reduction by providing financial support to reduce the burden on patients’ medical expenses. To be registered in the program with PD, the physician must confirm the patient meets the strict criteria (Supplementary Material 1), which are almost the same as the those of the UK PD brain bank. In addition, the NHIS program conducts regular cross-checking by reviewing chart records to prevent miscoding or inaccurate medical claims; therefore, the rare intractable diseases registry data are considered valid and reliable. Among individuals with new-onset PD, we included those who underwent health screening examinations, within 2 years before and after the diagnosis of PD. We then excluded individuals (1) younger than 40 years, (2) with missing data, and (3) who died within 1 year after the diagnosis of PD (lag).
Study endpoint
All-cause mortality up to December 31, 2019, was evaluated based on nationwide death certificate data from the Korea National Statistical Office. The mean follow-up duration was 3.8±1.9 years.
Changes in BMI status
The NHIS offers a free biannual National Health Screening Program for all recipients. Anthropometric data, including height and weight, were obtained from health screening data, and BMI was calculated as weight (kg) divided by height in meters squared (m2). Based on the World Health Organization recommendations for Asian populations, we defined three BMI status groups: underweight (BMI < 18.5 kg/m2), normal or overweight (18.5 kg/m2≤BMI<25 kg/m2), and obese (BMI≥25 kg/m2).27 To evaluate changes in BMI status, we used health screening data obtained both before and after PD diagnosis within two years. Data from the nearest health screening examination before and after the onset of PD was used. Nine BMI status change groups were identified: underweight → underweight, underweight → normal or overweight, underweight → obese, normal or overweight → underweight, normal or overweight → normal or overweight, normal or overweight → obese, obese → underweight, obese → normal or overweight, and obese → obese. In addition, BMI change status, irrespective of BMI status at pre-diagnosis of PD, was classified into three groups (decrease, maintenance, and increase).
Other variables
The NHI premium was used as a proxy for income level, and individuals in the lowest quartile group or those receiving Medical Aid were defined as the low-income group. Ever smokers were defined as those who had smoked ≥100 cigarettes in their lifetime. Alcohol consumption was classified as drinkers (>0 g/day) and non-drinkers. Participants who reported performing vigorous physical activity ≥3 times or moderate physical activity ≥5 times a week were considered physically active according to the American College of Sports Medicine guidelines. Systolic and diastolic blood pressures were measured using a standard mercury sphygmomanometer. Laboratory data, including serum levels of fasting glucose, total cholesterol, and creatinine, were measured after fasting for at least 8 h. The presence of comorbidities, such as hypertension, type 2 diabetes, dyslipidemia, and chronic kidney disease, was defined based on a combination of health examination results, ICD-10 codes for disease diagnosis, and medical claims for medication prescriptions. Disability registration from brain impairment was used as a proxy for PD severity.
Statistical analyses
Demographic and medical data were presented as mean±standard deviation (SD) for continuous variables and as number (percentage) for categorical variables depending on whether death occurred during the follow-up period for individuals with PD. The variables in the two groups were compared using the independent t-test for continuous variables or the chi-square test for categorical variables. The mortality rate was calculated as the number of deaths divided by person-years of follow-up and reported per 1,000 person-years. Cox proportional hazards models were employed to identify mortality risk according to BMI change status using the three models, and hazard ratios (HRs) and 95% confidence intervals (CIs) were calculated. Model 1 was unadjusted. Model 2 was adjusted for age, sex, income level, and lifestyle factors (smoking, drinking, and physical activity). Model 3 was additionally adjusted for comorbidities (hypertension, type 2 diabetes, dyslipidemia, and chronic kidney disease) and disability grades. We performed sensitivity analyses that further adjusted for confounding variables and took into account the weight measurement duration. Harrell’s concordance statistic (C-statistic) was calculated to estimate the predictive performance of each model for all-cause mortality in individuals with PD. A C-statistic value closer to 1 indicates a model that better discriminates between individuals who did or did not experience the outcome (mortality). Kaplan–Meier curves for all-cause mortality were constructed and the survival distributions between the nine BMI change groups were compared using log-rank tests. Deviations from linearity of BMI as a continuous variable were assessed using restricted cubic regression splines. Subgroup analyses were performed according to sex and age to evaluate whether the association between changes in BMI and mortality remained consistent. All statistical analyses were performed using SAS for Windows (version 9.4; SAS Institute Inc., Cary, NC, USA), and statistical significance was defined as a two-tailed p-value of <0.05.
RESULTS
Study participant characteristics
Table 1 presents the baseline characteristics of patients with PD according to whether death occurred during the follow-up period. Among the 20,703 patients with PD, 18.0% (n = 3,789) died. A significantly increased mortality was observed among male or older patients with PD. Among deceased patients with PD, the proportion of ever smokers was higher, whereas the proportions of alcohol drinkers and physically active individuals were lower. Deceased patients with PD had lower mean BMI and higher comorbidity prevalence, such as hypertension, type 2 diabetes, and chronic kidney disease. The median duration between the two health screening examinations was 1.99 (IQR, 1.75–2.18) years. The median duration from the 1st health screening to the onset of PD was 0.99 (0.56–1.42) years and the median duration from the onset of PD to the 2nd health screening was 0.94 (0.54–1.39) years. Patient characteristics in relation to BMI are shown in Supplementary Table 1.
Table 1
Characteristics of Individuals with Parkinson’s Disease
| Variables | Total | Mortality | P | |
| No | Yes | |||
| N | 20,703 | 16,914 | 3,789 | |
| Sex (men) | 9,799 (47.3) | 7,498 (44.3) | 2,301 (60.7) | <0.001 |
| Age (y) | 69.2±8.9 | 68.3±9.0 | 73.3±7.7 | <0.001 |
| Low income level | 3,522 (17.0) | 2,952 (17.5) | 570 (15.0) | <0.001 |
| Ever smoker | 4,916 (23.8) | 3,854 (22.8) | 1,062 (28.0) | <0.001 |
| Drinker | 3,040 (14.7) | 2,605 (15.4) | 435 (11.5) | <0.001 |
| Physically active | 4,618 (22.3) | 4,032 (23.8) | 586 (15.5) | <0.001 |
| Height (cm) | 158.4±9.1 | 158.2±9.1 | 159.0±9.1 | <0.001 |
| Weight (kg) | 60.2±10.3 | 60.5±10.2 | 58.8±10.7 | <0.001 |
| Body mass index (kg/m2) | 23.9±3.2 | 24.1±3.1 | 23.2±3.3 | <0.001 |
| Waist circumference (cm) | 83.1±8.9 | 83.2±8.9 | 82.9±9.2 | 0.111 |
| Fasting glucose (mg/dL) | 105.2±26.3 | 104.7±25.3 | 107.1±30.3 | <0.001 |
| Systolic blood pressure (mmHg) | 126.5±15.5 | 126.4±15.2 | 126.8±16.5 | 0.156 |
| Diastolic blood pressure (mmHg) | 76.3±9.8 | 76.4±9.7 | 76.2±10.3 | 0.517 |
| Total cholesterol (mg/dL) | 182.8±39.1 | 183.6±38.8 | 179.5±40.1 | <0.001 |
| eGFR (mL/min/1.73m2) | 81.3±41.4 | 81.9±40.5 | 78.6±45.1 | <0.001 |
| Hypertension | 12,518 (60.5) | 10,052 (59.4) | 2,466 (65.1) | <0.001 |
| Type 2 diabetes | 5,176 (25.0) | 4,027 (23.8) | 1,149 (30.3) | <0.001 |
| Dyslipidemia | 8,824 (42.6) | 7,398 (43.7) | 1,426 (37.6) | <0.001 |
| Chronic kidney disease | 3,304 (16.0) | 2,509 (14.8) | 795 (21.0) | <0.001 |
Values are presented as numbers (percentages) or means±standard deviations. eGFR, estimated glomerular filtration rate.
All-cause mortality risk according to changes in BMI among PD patients
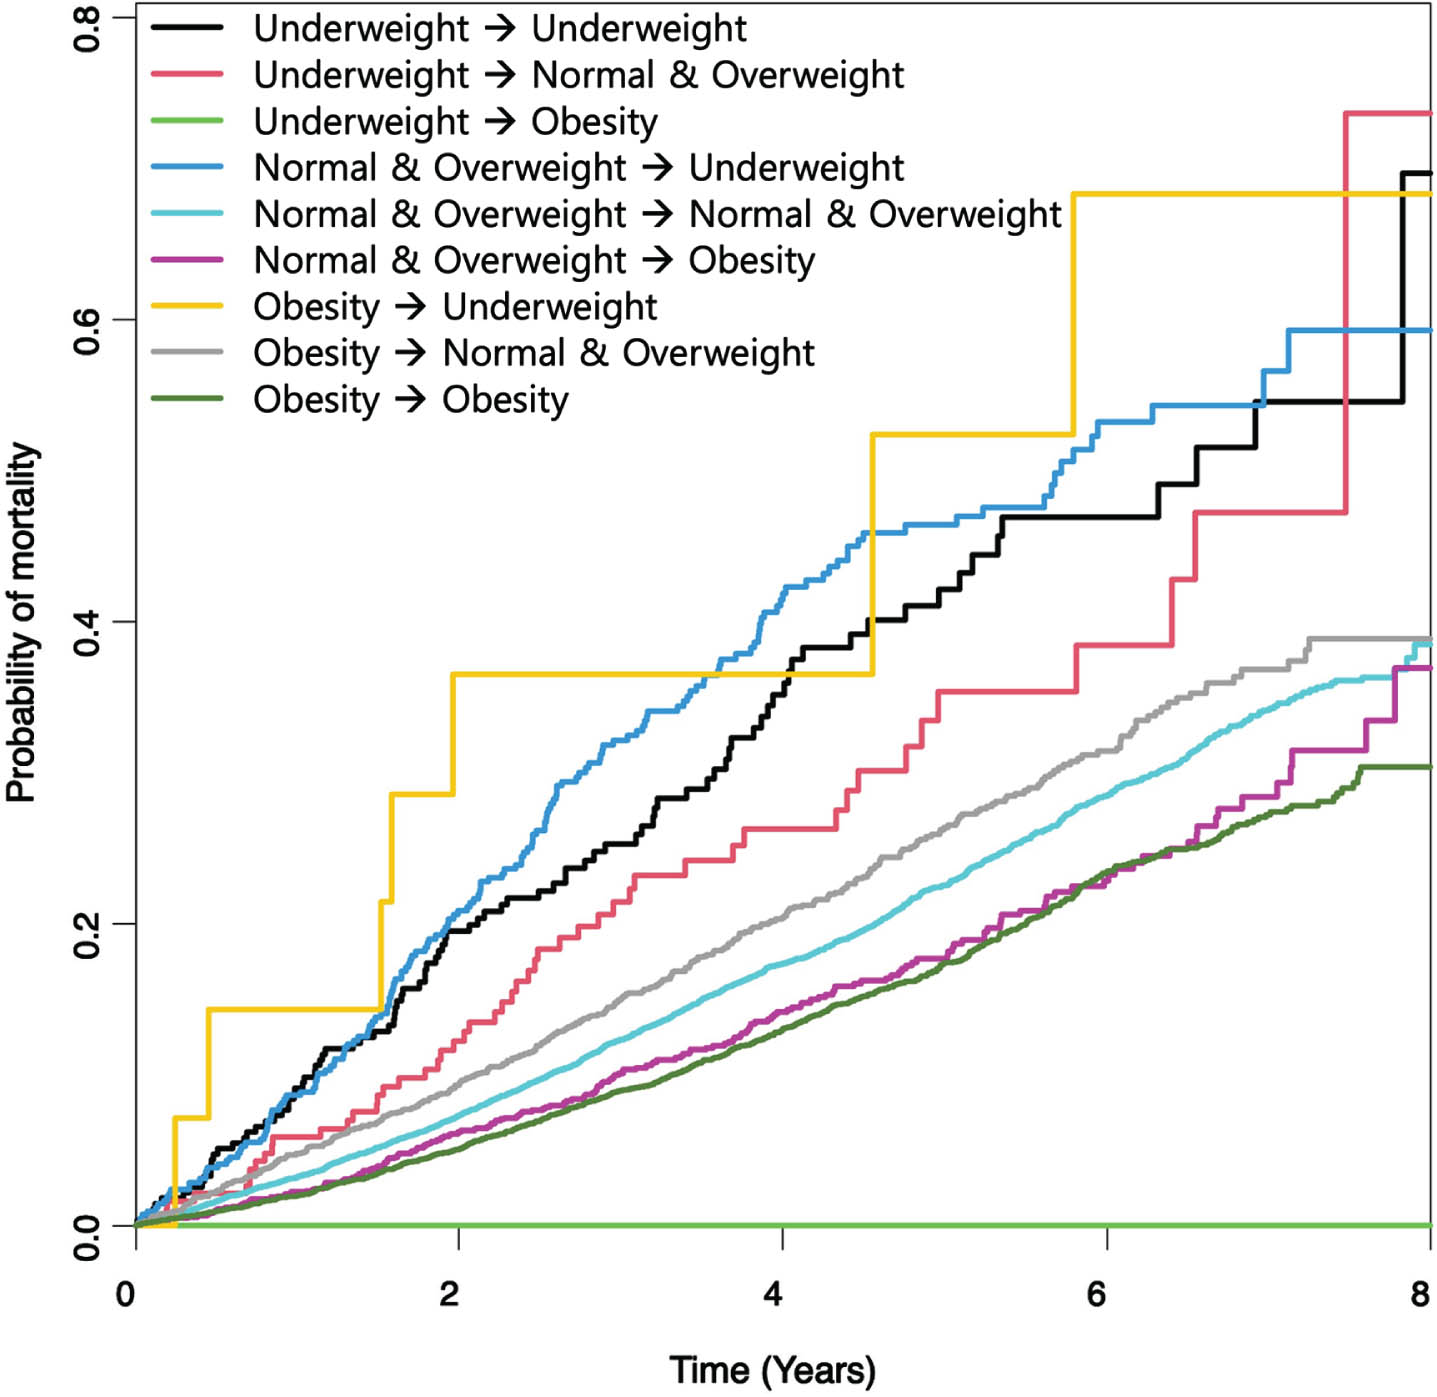
Table 2 shows the incidence and all-cause mortality risk among patients with PD according to changes in BMI. The C-statistic value was highest for the final model (model 3), indicating the best predictive performance for mortality prediction. Patients with PD who maintained a normal BMI or were overweight before and after PD diagnosis were considered the reference group. The association between BMI change status and all-cause mortality differed according to pre-diagnosis BMI status. In patients with PD who were underweight at pre-diagnosis, both the maintenance (HR = 2.05, 95% CI, 1.67–2.52) and weight gain to normal or overweight (HR = 1.52, 95% CI, 1.15–2.02) at post-diagnosis were associated with increased mortality risk. In the normal BMI or overweight group, weight loss to underweight was associated with increased mortality (HR = 2.04, 95% CI, 1.75–2.39), whereas weight gain to obesity was associated with reduced mortality (HR = 0.82, 95% CI, 0.71–0.95). In patients with PD who were obese at pre-diagnosis, excessive weight loss to underweight showed a significant association with mortality risk (HR = 3.36, 95% CI, 1.60–7.08), whereas weight loss to normal or overweight was not significantly associated with mortality (HR = 1.10, 95% CI, 0.99–1.23). Patients with PD who were obese before and after PD diagnosis had a significantly reduced mortality risk (HR = 0.80, 95% CI, 0.74–0.87). As shown in Fig. 1, the log-rank test revealed a significantly different cumulative probability of mortality among patients with PD stratified by BMI change (p < 0.001).
Table 2
Risk of Mortality in Individuals with Parkinson’s Disease According to Nine Groups by Changes in Body Mass Index Status
| Changes in body mass index status | PD (n) | Mortality (n) | Person-years | Mortality ratea | HR (95% CI) | ||
| Model 1b | Model 2c | Model 3d | |||||
| Underweight → Underweight | 274 | 94 | 887 | 106.0 | 2.18 (1.78–2.69) | 1.98 (1.61–2.43) | 2.05 (1.67–2.52) |
| Underweight → Normal or overweight | 187 | 50 | 628 | 79.6 | 1.65 (1.24–2.18) | 1.57 (1.18–2.08) | 1.52 (1.15–2.02) |
| Underweight → Obesity | 6 | 0 | 23 | 0.00 | |||
| Normal or overweight → Underweight | 418 | 172 | 1,412 | 121.8 | 2.48 (2.12–2.90) | 2.06 (1.76–2.41) | 2.04 (1.75–2.39) |
| Normal or overweight → Normal or overweight | 10,709 | 2,020 | 40,358 | 50.1 | 1.00 (reference) | 1.00 (reference) | 1.00 (reference) |
| Normal or overweight → Obesity | 1,339 | 197 | 4,938 | 39.9 | 0.80 (0.69–0.93) | 0.84 (0.73–0.98) | 0.82 (0.71–0.95) |
| Obesity → Underweight | 14 | 7 | 42 | 168.0 | 3.49 (1.66–7.33) | 4.08 (1.94–8.58) | 3.36 (1.60–7.08) |
| Obesity → Normal or overweight | 1,793 | 397 | 6,722 | 59.1 | 1.18 (1.06–1.31) | 1.13 (1.02–1.26) | 1.10 (0.99–1.23) |
| Obesity → Obesity | 5,963 | 852 | 22,775 | 37.4 | 0.75 (0.69–0.81) | 0.81 (0.74–0.87) | 0.80 (0.74–0.87) |
| p value | <0.001 | <0.001 | <0.001 | ||||
| C-statistic* | 0.5675 | 0.7074 | 0.7184 | ||||
HR, hazard ratio; CI, confidence interval. aMortality rate is the mortality per 1,000 person-year. bModel 1: unadjusted. cModel 2: adjusted for age, sex, income level, and lifestyle factors (smoking, drinking, and physical activity). dModel 3: adjusted for age, sex, income level, lifestyle factors (smoking, drinking, and physical activity), comorbidities (hypertension, type 2 diabetes, dyslipidemia, and chronic kidney disease), and disability grade. *Harrell’s Concordance Statistic.
Fig. 1
Kaplan–Meier Curves of All-Cause Mortality Stratified by Body Mass Index Change Status in Individuals with Parkinson’s Disease.
Additionally, we evaluated the associations between the overall BMI change status (decrease, maintenance, and increase) and mortality risk in patients with PD (Table 3). In a multivariable Cox proportional hazards model further adjusted for baseline BMI (Model 4), an increased mortality risk was observed in PD patients whose BMI decreased (HR = 1.24, 95% CI, 1.13–0.35); however, there was no significant association between an increase in BMI and mortality (HR = 1.05, 95% CI, 0.92–1.20).
Table 3
Risk of Mortality in Individuals with Parkinson’s Disease According to Weight Change
| Weight change status | PD (n) | Mortality (n) | Person-years | Mortality ratea | HR (95% CI) | |||
| Model 1b | Model 2c | Model 3d | Model 4e | |||||
| Weight loss | 2,225 | 576 | 8,176 | 70.5 | 1.53 (1.40–1.67) | 1.39 (1.27–1.52) | 1.36 (1.24–1.49) | 1.24 (1.13–1.35) |
| Weight maintenance | 16,946 | 2,966 | 64,021 | 46.3 | 1.00 (reference) | 1.00 (reference) | 1.00 (reference) | 1.00 (reference) |
| Weight gain | 1,532 | 247 | 5,590 | 44.2 | 0.96 (0.85–1.10) | 0.97 (0.86–1.11) | 0.96 (0.84–1.09) | 1.05 (0.92–1.20) |
| C-statistic* | 0.5293 | 0.6994 | 0.7135 | 0.7194 | ||||
HR, hazard ratio; CI, confidence interval. aMortality rate is the mortality per 1,000 person-year. bModel 1: unadjusted. cModel 2: adjusted for age, sex, income, and lifestyle factors (smoking, drinking, and physical activity). dModel 3: adjusted for age, sex, income, lifestyle factors (smoking, drinking, and physical activity), comorbidities (hypertension, type 2 diabetes, dyslipidemia, and chronic kidney disease), and disability grade. eModel 4: adjusted for age, sex, income, lifestyle factors (smoking, drinking, and physical activity), comorbidities (hypertension, type 2 diabetes, dyslipidemia, and chronic kidney disease), disability grade, and body mass index. *Harrell’s Concordance Statistic.
Sensitivity analysis further adjusting for blood pressure and additional laboratory data and comorbidities are presented in Supplementary Tables 2 and 3, and the results were consistent with those of our main analyses. In addition, sensitivity analysis was conducted in 11,254 individuals with a duration of more than two years between the two health screening examinations and a duration of more than six months between the onset of PD and the health screening examination, showing consistent results (Supplementary Tables 4 and 5).
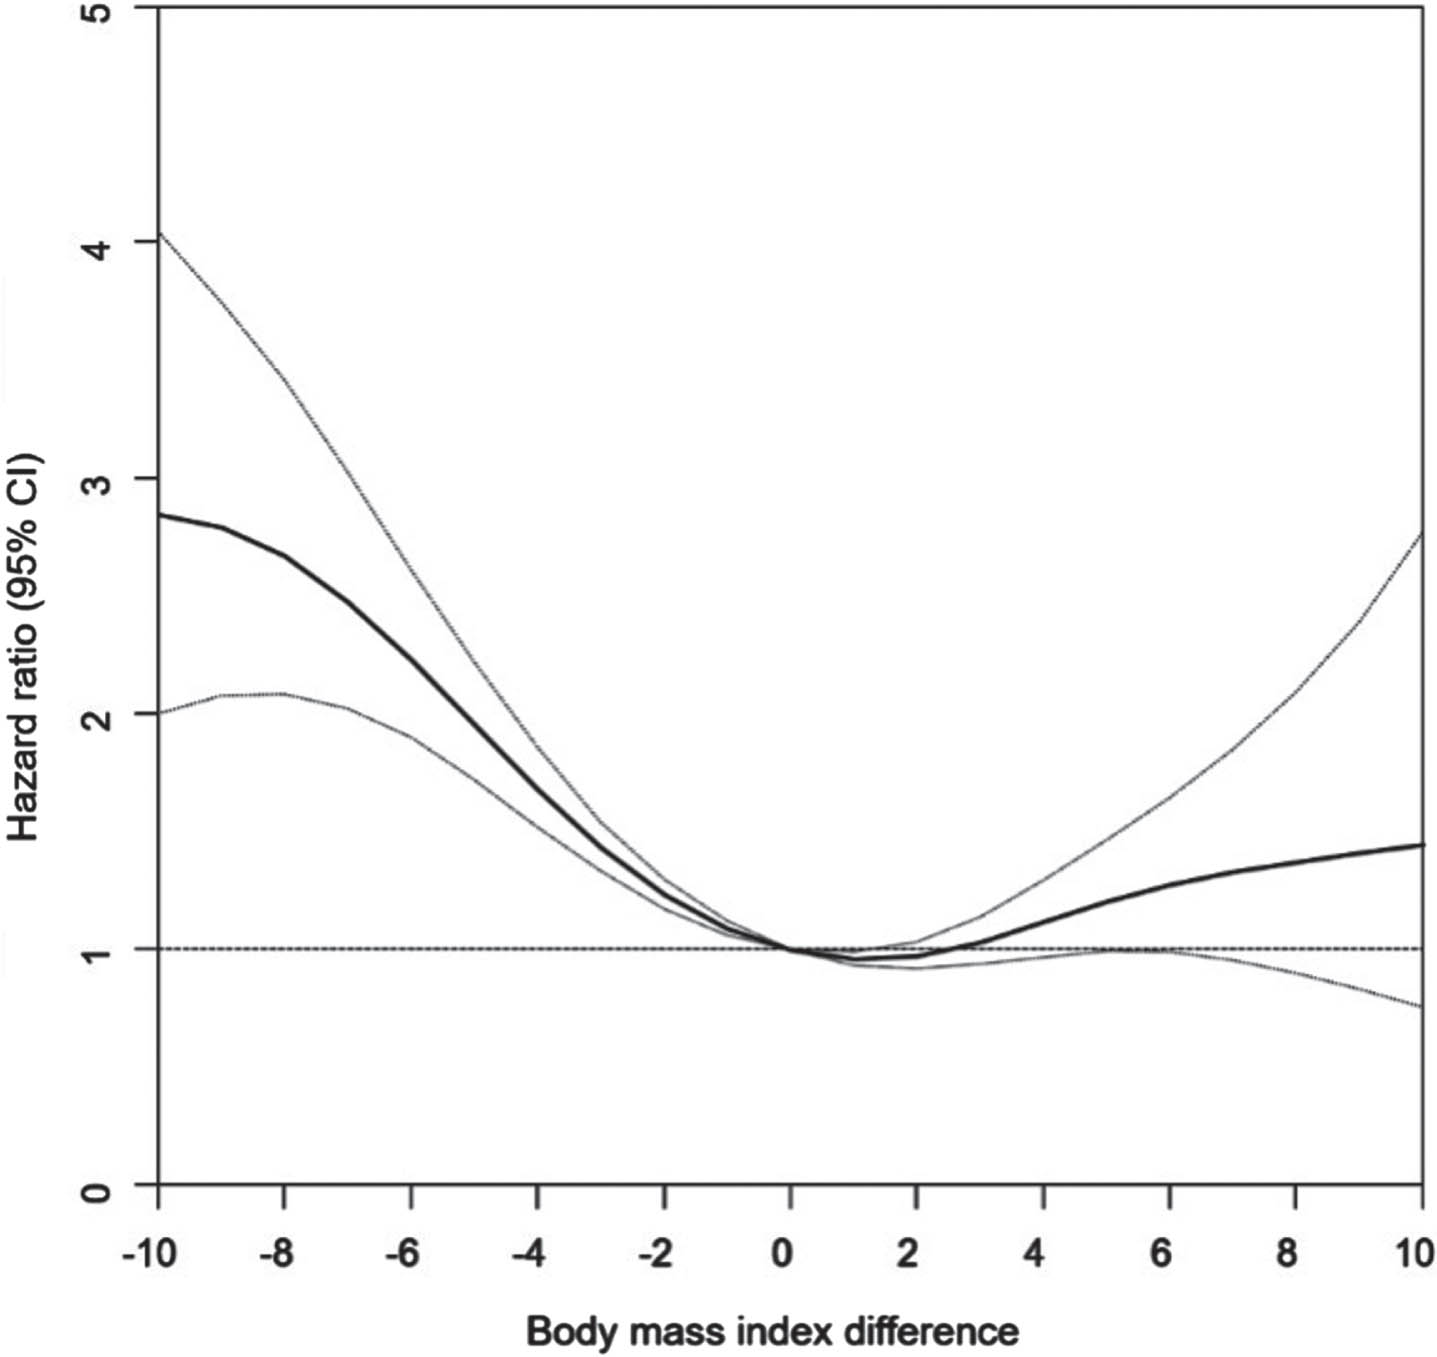
Multivariable Cox regression models with restricted cubic splines showed a reverse J-shaped association between BMI changes and all-cause mortality risk. The HRs for mortality increased according to the degree of BMI difference between PD patients with decreased BMI and those with BMI > 2 kg/m2. An increase in BMI of within 2 kg/m2 was associated with a slightly reduced mortality risk (Fig. 2).
Fig. 2
Restricted Cubic Spline Plots of Association between Body Mass Index Difference and All-Cause Mortality in Individuals with Parkinson’s Disease.
Subgroup analyses
The results of sex- and age-stratified analyses of mortality risk among patients with PD according to changes in BMI are presented in Supplementary Table 6. The association between changes in BMI and mortality risk did not differ between men and women (p for interaction = 0.668). There was a significant interaction between age group and mortality risk in patients with PD according to changes in BMI (p for interaction = 0.032). Overall, the association between changes in BMI and mortality only remained significant in individuals with PD aged ≥65 years.
DISCUSSION
In this nationwide cohort study, 20,703 patients with new-onset PD were analyzed to evaluate the association between changes in BMI and all-cause mortality. Notably, we analyzed the association between BMI change stratified by BMI status at pre-diagnosis of PD and mortality risk to reveal potential associations in underweight and obese individuals. Compared to sustained normal BMI or overweight status, sustained underweight status, decreased BMI to underweight, and weight gain from underweight to normal or overweight were associated with an increased mortality risk. However, sustained obesity and an increase in BMI from normal or overweight to obese were associated with reduced mortality. Restricted cubic splines for BMI differences and all-cause mortality showed that both decreased and increased BMI were associated with increased mortality, exhibiting a reverse J-shaped association with nadir, at an increase in BMI of 0–2 kg/m2. Our results revealed that BMI change at PD diagnosis was associated with mortality in individuals with PD, and this association varied depending on baseline BMI of each individual. This could provide valuable insights for weight management planning related to mortality at the time of PD diagnosis, taking into account the pre-diagnosis BMI of individuals with PD.
Although previous studies demonstrated that low BMI is an important predictor for disease progression in PD, the impact of BMI change on mortality has not been fully clarified.18–21 One study including 1673 patients with PD has reported an association between weight loss, not baseline BMI, and PD progression.18 In another previous report, an early loss of >5% total body weight within the first year of diagnosis was independently associated with increased mortality rate by >2 times; however, the study had included some atypical parkinsonism.19 Another study investigating the relationship between weight loss by 5% and 10% and mortality showed nonsignificant results.21 In our previous study, the association between change in BMI and mortality was not significant.22 Inconsistencies in the relationship between weight change and mortality risk in PD may arise from variations in study design, such as timing of weight measurement, definition of weight change, follow-up duration, and the joint consideration of baseline weight and weight change. In addition, the heterogeneity in associations between body weight and clinical manifestations of PD may be attributed to ethnicity; Asians have been suggested to have a lower BMI but a higher percentage of body fat compared to other ethnicity.28 In this large-scale Asian cohort study, we evaluated the association between BMI change and PD mortality with consideration of BMI at pre-diagnosis of PD.
Overall, our results indicated that being underweight before or after PD diagnosis, or experiencing weight loss, was associated with an increased risk of mortality. This finding aligns with the majority of previous studies.18,19 Excessive weight loss from obese to underweight was associated with more than 3-fold increased mortality risk in PD, which is a somewhat higher value than that of the general population.29 Frailty has been suggested to be common in PD and associated with disease progression and mortality.30,31 The shared mechanisms between frailty and PD have been suggested as inflammation, oxidative stress, and mitochondrial dysfunction.32 Based on our results, it appears that both weight loss and frailty have a significant influence on mortality in patients with PD. We also revealed a reverse J-shaped association between changes in BMI and mortality in patients with PD, with and the lowest rate at a BMI increase of 0–2 kg/m2. This suggests that maintaining an appropriate BMI may be an important factor in relation with reduced mortality risk in PD. A recent study suggested that even a 3% weight change was sensitively related to the severity of PD and disability,33 which is in line with our findings and suggests the importance of body weight homeostasis for PD management. However, the association between BMI change and mortality varied according to baseline BMI. Therefore, an individualized approach for weight management that considers BMI before and after PD diagnosis is needed.
Generally, compared to individuals with underweight-to-normal BMI, obese people have been reported to have a lower risk of all-cause mortality in PD. Obese patients may have some protective effects against neurodegeneration.34 A recent study using single-positron emission computed tomography (SPECT) demonstrated longitudinal associations of BMI loss with striatal dopaminergic degeneration.35 More recently, it has been reported that neuropeptide function such as leptin and ghrelin signaling, which are essential for regulating energy balance, were implicated in the pathogenesis of PD.36,37 Leptin, which is produced by adipose tissue, has been reported to prevent dopaminergic neuron degeneration.38 Ghrelin also provides neuroprotective effects by activating adenosine monophosphate-activated protein kinase and regulated mitochondrial function.37 However, the precise mechanism for the association between BMI status and mortality remains uncertain, which might be the result of reverse causation, produced by the confounding effects of disease-related weight loss.
In community-dwelling older adults, weight loss, fluctuation, and gain were all associated with an increased risk of all-cause mortality.29 A recent Chinese cohort study of the general population showed U-shape associations of weight changes with risk of all-cause mortality.39 In this study, we presented a similar trend in the PD patient group. Although PD patients with a higher BMI or BMI increase seemed to have a better prognosis than their counterparts in previous studies,18,19,22 we found that excessive weight gain negatively influenced mortality in PD patients, as in the general population. In a previous study, impaired energy homeostasis may be associated with striatal dopaminergic degeneration.35 From a homeostatic perspective, further investigations are needed to elucidate the underlying mechanism involved in the association between weight change and mortality in PD patients.
Associations between changes in BMI and all-cause mortality persisted among patients with PD stratified by sex. Recently, sex-related differences, including the diagnosis, clinical symptoms, and outcomes of PD, have suggested that pathogenic mechanisms, including environmental, hormonal, and genetic factors, may differ according to patient sex.40,41 Thus, future studies are needed to confirm the sex-specific associations between weight change and PD mortality and related mechanisms. As for age, the association between changes in BMI and all-cause mortality was less significant in individuals aged <65 years than those aged ≥65 years. This suggests that not only weight loss but also associated frailty in older individuals with PD may be important factors in their association with mortality. In addition, a relatively small number of PD patients aged <65 years need to be considered when interpreting the results.
Our study had several limitations. First, we could not ascertain the intentionality of weight change. Second, there were only six patients in the underweight → obese group, in which no deaths occurred. Although this is due to the progressive nature of the disease, the analyses for this group were limited by the small number of subjects. Third, this was a nationwide data-based study, and clinical information, such as motor symptoms or PD subtype, related to PD severity was unavailable. Therefore, we only included individuals newly diagnosed PD and used disability grades as a proxy for PD severity. Fourth, although we used both ICD codes and registration code (V124) in the rare and intractable diseases registration program to define PD, misclassification of secondary or atypical parkinsonism as PD cannot be ruled out. Finally, this study only included a Korean population, which limits the generalizability of our results to patients of other ethnicities.
This study has the following strengths: A large sample size of >20,000 patients with new-onset PD was considered. We prospectively collected health screening data, thus limiting potential recall bias. We performed analyses after adjusting for substantial confounding variables, including comorbidities and socioeconomic status, which may have affected mortality rate. Additionally, we divided the groups into nine BMI change categories based on anthropometric measurements before and after PD diagnosis.
In conclusion, among patients with PD, sustained underweight status, weight loss to underweight, and weight gain from underweight to normal BMI or overweight were associated with an increased mortality risk. Sustainedly obese status and weight gain from normal or overweight to obesity were associated with reduced mortality risk. Differences in BMI between pre- and post-PD diagnosis showed a reverse J-shaped association with PD mortality. Overall, maintaining weight as normal to obese or slight weight gain within 2 kg/m2 of BMI is recommended for patients with PD. Our findings emphasize individualized approaches considering body weight at the time of PD diagnosis to establish the weight management plan for reducing mortality risk in PD. Additional studies are required to reveal the mechanisms underlying the association between body weight changes and PD mortality.
ACKNOWLEDGMENTS
The authors have no acknowledgments to report.
FUNDING
This study was supported by Basic Science Research Program through the National Research Foundation of Korea (NRF) funded by the Ministry of Education (2019R1I1A1A01061757) and also supported by the Korea University grant.
CONFLICT OF INTERESTS
The authors have no conflict of interest to report.
DATA AVAILABILITY
The source NHIS data do not belong to the researchers, and we are not allowed to transfer data file to a third party under Korean law. The data can be used after approval of the Institutional Review Board and the Korea NHIS Big Data Operations Department (https://nhiss.nhis.or.kr/bd/ay/bdaya 001 iv.do).
SUPPLEMENTARY MATERIAL
[1] The supplementary material is available in the electronic version of this article: https://dx.doi.org/10.3233/JPD-240181.
REFERENCES
[1] | Chaudhuri KR , Healy DG and Schapira AH. Non-motor symptoms of Parkinson’s disease: diagnosis and management. Lancet Neurol (2006) ; 5: : 235–245. |
[2] | Titova N , Qamar MA and Chaudhuri KR. The nonmotor features of Parkinson’s disease. Int Rev Neurobiol (2017) ; 132: : 33–54. |
[3] | Wu Q , Liu M , Yu M , et al. Sex differences in underweight and body mass index in Chinese early de novo patients with Parkinson’s disease. Brain Behav (2020) ; 10: : e01893. |
[4] | van der Marck MA , Dicke HC , Uc EY , et al. Body mass index in Parkinson’s disease: a meta-analysis. Parkinsonism Relat Disord (2012) ; 18: : 263–267. |
[5] | De Lucia N , Peluso S , Esposito M , et al. Frontal defect contribution to decreasing of body mass index in Parkinson’s disease patients. J Clin Neurosci (2020) ; 72: : 229–232. |
[6] | Beyer PL , Palarino MY , Michalek D , et al. Weight change and body composition in patients with Parkinson’s disease. J Am Diet Assoc (1995) ; 95: : 979–983. |
[7] | Suzuki K , Okuma Y , Uchiyama T , et al. Determinants of low body mass index in patients with Parkinson’s disease: a multicenter case-control study. J Parkinsons Dis (2020) ; 10: : 213–221. |
[8] | Barichella M , Cereda E , Cassani E , et al. Dietary habits and neurological features of Parkinson’s disease patients: Implications for practice. Clin Nutr (2017) ; 36: : 1054–1061. |
[9] | Davies KN , King D and Davies H. A study of the nutritional status of elderly patients with Parkinson’s disease. Age Ageing (1994) ; 23: : 142–145. |
[10] | Kistner A , Lhommee E and Krack P. Mechanisms of body weight fluctuations in Parkinson’s disease. Front Neurol (2014) ; 5: : 84. |
[11] | Jeong SM , Han K , Kim D , et al. Body mass index, diabetes, and the risk of Parkinson’s disease. Mov Disord (2020) ; 35: : 236–244. |
[12] | Wang YL , Wang YT , Li JF , et al. Body mass index and risk of Parkinson’s disease: a dose-response meta-analysis of prospective studies. PLoS One (2015) ; 10: : e0131778. |
[13] | Logroscino G , Sesso HD , Paffenbarger RS Jr. , Body mass index and risk of Parkinson’s disease: a prospective cohort study. Am J Epidemiol (2007) ; 166: : 1186–1190. |
[14] | Roos E , Grotta A , Yang F , et al. Body mass index, sitting time, and risk of Parkinson disease. Neurology (2018) ; 90: : e1413–e1417. |
[15] | Hu G , Jousilahti P , Nissinen A , et al. Body mass index and the risk of Parkinson disease. Neurology (2006) ; 67: : 1955–1959. |
[16] | Rahmani J , Roudsari AH , Bawadi H , et al. Body mass index and risk of Parkinson, Alzheimer, dementia, and dementia mortality: a systematic review and dose-response meta-analysis of cohort studies among 5 million participants. Nutr Neurosci (2022) ; 25: : 423–431. |
[17] | Vikdahl M , Carlsson M , Linder J , et al. Weight gain and increased central obesity in the early phase of Parkinson’s disease. Clin Nutr (2014) ; 33: : 1132–1139. |
[18] | Wills AM , Pérez A , Wang J , et al. Association between change in body mass index, Unified Parkinson’s Disease Rating Scale scores, and survival among persons with Parkinson disease: secondary analysis of longitudinal data from NINDS Exploratory Trials in Parkinson Disease Long-term Study. JAMA Neurol (2016) ; 73: : 321–328. |
[19] | Cumming K , Macleod AD , Myint PK , et al. Early weight loss in parkinsonism predicts poor outcomes: Evidence from an incident cohort study. Neurology (2017) ; 89: : 2254–2261. |
[20] | Park K , Oeda T , Kohsaka M , et al. Low body mass index and life prognosis in Parkinson’s disease. Parkinsonism Relat Disord (2018) ; 55: : 81–85. |
[21] | Walker R , Davidson M and Gray W. Gender differences in 1-year survival rates after weight loss in people with idiopathic Parkinson’s disease. Int J Palliat Nurs (2012) ; 18: : 35–39. |
[22] | Yoon SY , Heo SJ , Lee HJ , et al. Initial BMI and weight loss over time predict mortality in Parkinson disease. J Am Med Dir Assoc (2022) ; 23: : 1719.e1711–1719.e1717. |
[23] | Whitlock G , Lewington S , Sherliker P , et al. Body-mass index and cause-specific mortality in 900 000 adults: collaborative analyses of 57 prospective studies. Lancet (2009) ; 373: : 1083–1096. |
[24] | Yoon SY , Suh JH , Yang SN , et al. Association of physical activity, including amount and maintenance, with all-cause mortality in Parkinson disease. JAMA Neurol (2021) ; 78: : 1446–1453. |
[25] | Jo S , Kim YJ , Park KW , et al. Association of NO2 and other air pollution exposures with the risk of Parkinson disease. JAMA Neurol (2021) ; 78: : 800–808. |
[26] | Park KY , Jung JH , Hwang HS , et al. Bone mineral density and the risk of Parkinson’s disease in postmenopausal women. Mov Disord (2023) ; 38: : 1606–1614. |
[27] | WHO Expert Consultation. Appropriate body-mass index for Asian populations and its implications for policy and intervention strategies. Lancet (2004) ; 363: : 157–163. |
[28] | Wang J , Thornton JC , Russell M , et al. Asians have lower body mass index (BMI) but higher percent body fat than do whites: comparisons of anthropometric measurements. Am J Clin Nutr (1994) ; 60: : 23–28. |
[29] | Alharbi TA , Paudel S , Gasevic D , et al. The association of weight change and all-cause mortality in older adults: a systematic review and meta-analysis. Age Ageing (2021) ; 50: : 697–704. |
[30] | Abraham DS , Pham Nguyen TP and Willis AW. Claims-based frailty and outcomes: applying an aging measure to older adults with Parkinson’s disease. Mov Disord (2021) ; 36: : 1871–1878. |
[31] | Ahmed NN , Sherman SJ and Vanwyck D. Frailty in Parkinson’s disease and its clinical implications. Parkinsonism Relat Disord (2008) ; 14: : 334–337. |
[32] | Ntanasi E , Maraki M , Yannakoulia M , et al. Frailty and prodromal Parkinson’s disease: results from the HELIAD Study. J Gerontol A Biol Sci Med Sci (2021) ; 76: : 622–629. |
[33] | Ghourchian S , Gruber-Baldini AL , Shakya S , et al. Weight loss and weight gain in Parkinson disease. Parkinsonism Relat Disord (2021) ; 83: : 31–36. |
[34] | Rauchhaus M , Coats AJ and Anker SD. The endotoxin-lipoprotein hypothesis. Lancet (2000) ; 356: : 930–933. |
[35] | Pak K , Shin HK , Kim EJ , et al. Weight loss is associated with rapid striatal dopaminergic degeneration in Parkinson’s disease. Parkinsonism Relat Disord (2018) ; 51: : 67–72. |
[36] | Andrews ZB , Erion D , Beiler R , et al. Ghrelin promotes and protects nigrostriatal dopamine function via a UCP2-dependent mitochondrial mechanism. J Neurosci (2009) ; 29: : 14057–14065. |
[37] | Bayliss JA and Andrews ZB. Ghrelin is neuroprotective in Parkinson’s disease: molecular mechanisms of metabolic neuroprotection. Ther Adv Endocrinol Metab (2013) ; 4: : 25–36. |
[38] | Weng Z , Signore AP , Gao Y , et al. Leptin protects against 6-hydroxydopamine-induced dopaminergic cell death via mitogen-activated protein kinase signaling. J Biol Chem (2007) ; 282: : 34479–34491. |
[39] | Yuan Y , Liu K , Zheng M , et al. Analysis of changes in weight, waist circumference, or both, and all-cause mortality in Chinese adults. JAMA Netw Open (2022) ; 5: : e2225876. |
[40] | Cerri S , Mus L and Blandini F. Parkinson’s disease in women and men: what’s the difference? J Parkinsons Dis (2019) ; 9: : 501–515. |
[41] | Jurado-Coronel JC , Cabezas R , Ávila Rodríguez MF , et al. Sex differences in Parkinson’s disease: Features on clinical symptoms, treatment outcome, sexual hormones and genetics. Front Neuroendocrinol (2018) ; 50: : 18–30. |


