
Data-Driven Subtypes of Multiple System Atrophy and Their Implications for Prognosis
Abstract
Background:
While multiple system atrophy (MSA) presents with high heterogeneous motor and nonmotor symptoms, the associations between clinical phenotypes and prognosis are unclear.
Objective:
We aimed to evaluate clinical phenotypes of MSA using data-driven approach and measure the impact of phenotypes on survival and bedbound status.
Methods:
193 MSA patients were recruited from Xuanwu Hospital Capital Medical University, whose history, motor and non-motor symptoms were examined using cluster analysis. Ninety-five participants were followed-up via telephone after a mean of 31.87 months. We employed Kaplan– Meier analysis to examine survival and performed Cox and logistic regression analyses to identify factors associated with survival and bedbound status.
Results:
We identified four clinical profiles of MSA: cerebellar symptom-dominant, sleep and mood disorder-dominant, rigid akinetic-dominant, and malignant diffuse. The overall median survival was 7.75 years (95% CI 7.19–8.31). After adjusting for years from symptom onset to diagnosis, age and sex, patients in the malignant diffuse and rigid akinetic-dominant clusters had greater risk of death than sleep and mood disorder-dominant cluster. Furthermore, patients in the malignant diffuse and rigid akinetic-dominant clusters had higher risk of being bedbound than cerebellar symptom-dominant cluster.
Conclusions:
The malignant diffuse and sleep and mood disorder-dominant were identified besides the two classical subtypes, parkinsonism, and cerebellar symptom-variant. Patients with rigid-akinetic motor profiles have a worse prognosis than cerebellar symptom-dominant profiles in general. Diffuse symptoms, especially postural instability, and cognitive alterations at diagnosis, indicate rapid functional loss and disease progression. The different profiles and prognoses might indicate varied underlying pathological mechanisms.
Plain Language Summary
Multiple system atrophy (MSA) is a complex disease that can affect both movement and non-movement functions of patients. However, we do not know much about how these different symptoms relate to how the patient’s health might change over time. In this study, we looked at 193 MSA patients to learn more about if the patients can be distinguished into different subgroups at diagnosis and if the subgroups might be associated with their survival and ability to move in the future. We found four main subgroups of patients: group 1 characterized by the dysfunction of cerebellum (a part of the brain), group 2 characterized by sleep and mood problems, group 3 characterized by rigidity and slow movements, and group 4 with diffuse symptoms mentioned above. After tracking 95 patients for nearly 32 months, we found that those characterized by rigidity and slow movements, and those with diffuse symptoms had a higher chance of dying compared to those characterized by sleep and mood problems. Group 3 and 4 also had a higher chance of becoming unable to move out of bed. This suggests that patients with severe symptoms of rigidity and slowness at diagnosis tend to have a worse outlook than those without. And if multiple MSA symptoms are found when the patient is diagnosed, especially trouble with thinking, are also signs that the disease is getting worse quickly. By understanding these disease patterns, we can better tailor treatments and provide better support for people with MSA.
INTRODUCTION
Multiple system atrophy (MSA) is an adult-onset and fatal neurodegenerative disorder that is highly heterogeneous and is characterized by combinations of the following symptoms: autonomic failure, poor levodopa responsive parkinsonism, cerebellar ataxia, and pyramidal signs.1 The overall median survival time from the onset of symptoms ranges from six to ten years.2–4 Based on its predominant motor symptoms, MSA can be categorized as parkinsonism variant (MSA-P) or cerebellar variant (MSA-C).5 A previous European cohort study reported that MSA-P exhibited a more malignant disease course and was associated with a shorter life expectancy than MSA-C.2 However, the results from other cohort studies of MSA patients showed that there was no difference in prognosis for MSA-P and MSA-C.3,6,7 Thus, while the current subtypes, which were identified based on motor symptoms, account for the main motor complaints of patients with MSA, the impact of clinical heterogeneity and phenotypes on the prognosis of MSA remains unclear.
Data-driven classification methods, such as cluster analysis and latent class analysis, have been widely used to differentiate phenotypes based on clinical manifestations of Parkinson’s disease and MSA.8–11 Two retrospective studies applied latent class analysis to identify MSA subtypes. Grimaldi et al.9 identified three distinct subtypes among eighty-five patients with MSA: “extrapyramidal, axial, laryngeal-pharyngeal involvement (LPI) and cerebellar symptoms”, “cerebellar and LPI symptoms”, and “cerebellar and cognitive symptoms”, and these subtypes can be distinguished based on brain metabolic abnormalities. Yang et al.10 also used latent class analysis to classify sixty-one probable or possible early-stage MSA patients into three new clusters that accounted for various symptom constellations of MSA: “moderate parkinsonism + extensive dysautonomia”, “predominant parkinsonism + limited dysautonomia” and “predominant cerebellar symptoms + limited dysautonomia”. However, previous studies that attempted to identify MSA subtypes used cross-sectional designs, and they did not include follow-up analyses to track the prognoses of the suggested subtypes. Thus, there is a lack of evidence regarding whether data-driven subtypes are associated with prognosis-related outcomes, such as survival and functional motility.
In the present study, we aimed to perform cluster analysis to investigate the clinical phenotypes of MSA using a relatively large dataset of MSA subjects. Additionally, we analyzed the clinical features of each MSA phenotype and compared the prognosis of the data-driven phenotypes to further explore the association between clinical phenotypes and prognosis.
METHODS
Patients and clinical evaluations
Patients clinically diagnosed with probable MSA were recruited from the Clinical and Research Center for Parkinson’s Disease at Xuanwu Hospital of Capital Medical University from July 2014 to January 2020. The diagnosis of MSA was made by two neurologists specializing in movement disorders and was based on the second consensus diagnostic criteria of probable MSA.5 The patients were classified as having MSA-P or MSA-C based on the predominant motor symptoms at diagnosis, which is also when the full examination occurred. The exclusion criteria were as follows: patients under 30 years of age or over 75 years of age at disease onset; secondary cause of parkinsonism and hereditary disorders; malignant tumor; serious damage to vital organs (lung, liver, kidney); or hematological system diseases. This study was part of the CHINA INTIATIVE on NEURODEGENERATION in AGING (CHINA) consortium on neurodegenerative disorders and was approved by the Institutional Review Board of Xuanwu Hospital of Capital University. Written informed consent was obtained from all participants.
In accordance with the consensus criteria for probable MSA, symptom onset was defined as the initial appearance of motor symptoms (such as parkinsonian or cerebellar symptoms) or autonomic symptoms (such as urinary incontinence, urinary retention, or orthostatic blood pressure decline).5 All of the clinical and neuropsychological assessments were conducted by clinicians specializing in movement disorders. The Movement Disorder Society-Unified Parkinson’s Disease Rating Scale-part III (MDS-UPDRS III)12 and Hoehn-Yahr staging13 were used to estimate the severity of motor dysfunction. The Non-Motor Symptoms Scale (NMSS), Mini-Mental State Examination (MMSE), Montreal Cognitive Assessment (MoCA), Hamilton Anxiety Rating Scale (HAMA), Hamilton Depression Rating Scale (HAMD), REM Sleep Behavior Disorder Questionnaire-Hong Kong (RBDQ-HK), Epworth Sleepiness Scale (ESS), Parkinson Disease Sleep Scale (PDSS), and Olfactory Questionnaire were used to evaluate nonmotor symptoms of MSA.
Orthostatic hypotension (OH) was defined as an orthostatic drop of 30 mmHg in systolic blood pressure or 15 mmHg in diastolic blood pressure upon moving from the supine position to the upright position.5 Blood pressure was recorded separately when patients were in the supine and upright positions. The beneficial levodopa response based on the experimental drug dosage was defined as the maximum improvement rate (MIR) over 15.5% after administering at least 0.125 g of compound levodopa in the form of a standard tablet, the MIR over 22.5% after administering 0.1875 g of compound levodopa in the form of a standard tablet, the MIR over 25.5% after administering 0.25 g of compound levodopa or the MIR over 33.5% after administering 0.375 g of compound levodopa in the form of a standard tablet.14 The MIR was calculated using the following formula: (baseline UPDRS-III scores before administration - lowest UPDRS-III score after administration)/baseline score*100%.
Constipation was assessed by item 21 on the NMSS (Does the patient suffer from constipation?). Sexual dysfunction was assessed by items 25 and 26 on the NMSS (Does the patient have altered interest in sex? Does the patient have problems having sex?). Pain was assessed by item 27 on the NMSS (Does the patient suffer from pain not explained by other known conditions?). Abnormal sweating was assessed by item 30 on the NMSS (Does the patient experience excessive sweating?). Urinary symptoms were assessed by items 22 and 23 on the NMSS (Does the patient have difficulty holding urine? Does the patient have to void within 2 hours of last voiding?). Three-dimensional ultrasound was used to measure bladder residual urine volume, and a volume greater than 50 milliliters was defined as urinary retention.
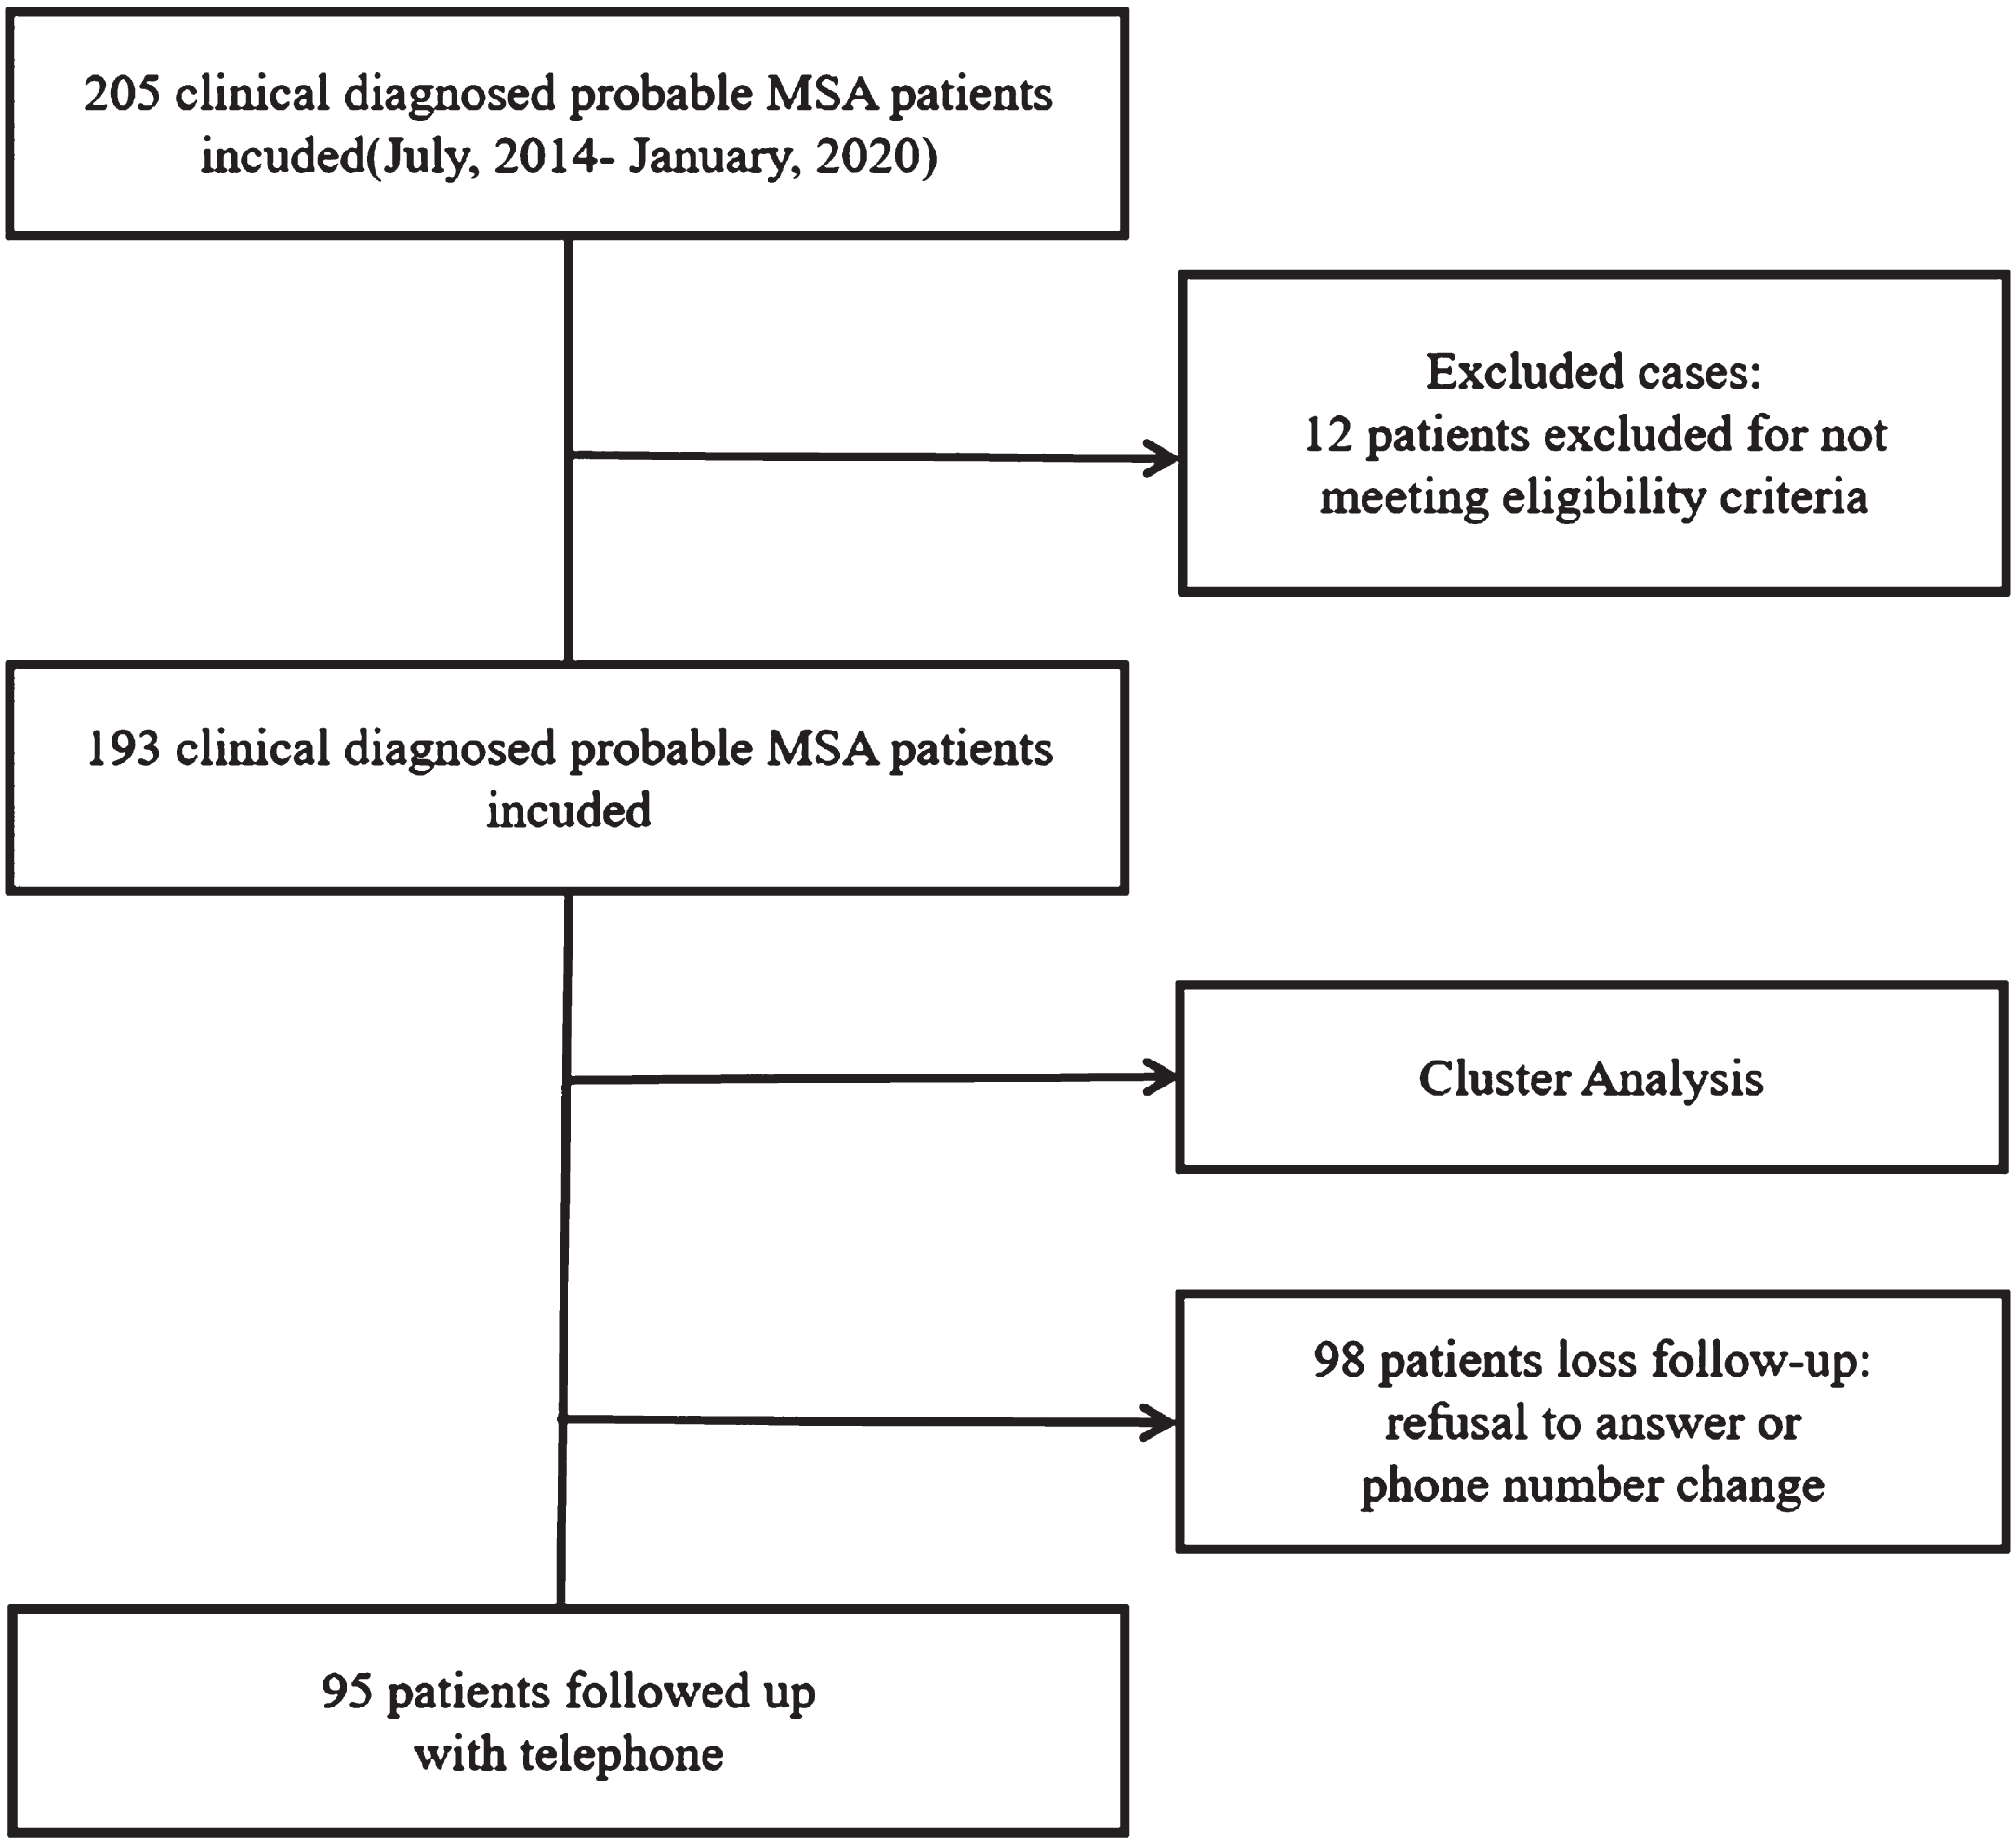
We have planned in-person follow-up assessments with participants. These assessments would have included evaluations of motor symptoms using the MDS-UPDRS-III, assessments of cerebellar symptoms using the SARA scale, cognitive evaluations using the MMS and MoCA scales, assessments of non-motor symptoms using the NMSS scale, and evaluation of functional abilities using Activity of Daily Living Scale (ADL). However, due to the pandemic of COVID-19, we can only conduct telephone interviews to follow up with MSA patients. During the telephone interview, we assessed the ADL, and we recorded their survival status and motility. The primary outcomes of the study were mortality and ADL scores, while the secondary outcome was bedbound status. Bedbound status was defined as the complete inability to move independently. Survival time was defined as the period from symptom onset to death or the end of follow-up, censored data included living patients at follow-up. The questionnaire took approximately 5 min to complete. A total of 95 patients in this study underwent follow-up at a mean period of 31.87 months. The main reasons for loss to follow-up were changes in the participant’s phone number and refusal to participate (Fig. 1).
Fig. 1
Flow diagram of the study.
Statistical analysis
Statistical analyses were performed using SPSS version 26.0 (IBM Corporation, Armonk, NY, USA) and R version 4.1.0 (R Foundation for Statistical Computing, Vienna, Austria). All data on demographic and clinical characteristics were subjected to descriptive analysis. Continuous variables conforming to a normal distribution were compared using Student’s t test, while nonnormally distributed variables were compared by nonparametric tests. Contingency tables were analyzed with the chi-square or Fisher exact test. The open-source R package version 1.4– 2 was employed for the cluster analysis, which was performed to group MSA patients with similar clinical characteristics. Optimal cluster numbers were determined based on the wssplot, which was generated using the open-source NbClust package in R software. After identifying subgroups of MSA via cluster analysis (CA), the patient characteristics of each subgroup were compared using the chi-square test or the Kruskal– Wallis test after adjusting for the duration from symptom onset to diagnosis (continuous variables were analyzed using linear regression, and categorical variables were analyzed using logistic regression).
Kaplan– Meier analysis was used to estimate survival from symptom onset. The log-rank test was employed to assess whether the Kaplan– Meier survival curves differed between distinct subtypes. Cox regression analysis was used to evaluate covariates. Given the number of events available in this analysis, the variables included in the model were carefully selected to establish the parsimony of the final model. The multivariate logistic regression models were constructed with the following baseline variables: age, years from symptom onset to diagnosis, sex, and CA clusters. The multivariate logistic regression analysis was evaluated using the Omnibus Test of Model Coefficients (p < 0.05) and the Hosmer– Lemeshow Test (p > 0.05). Statistically significant differences were indicated by p < 0.05.
RESULTS
Baseline characteristics
A total of 193 patients with MSA were included, comprising 101 men and 92 women. The mean age at onset was 58.29±7.58 years, and the mean years from symptom onset to diagnosis at baseline was 2.79±1.91 years. On the basis of the second consensus criteria for the diagnosis of MSA, 114 patients were diagnosed with MSA-P, and 79 were diagnosed with MSA-C. There was a significant difference in UPDRS-III scores between the MSA-P and MSA-C patients. For nonmotor symptoms, patients with MSA-P had higher frequencies of urinary retention and orthostatic hypertension, while patients with MSA-C higher frequencies of abnormal PDSS scores and sexual dysfunction. Detailed baseline clinical characteristics of the patients are shown inTable 1.
Table 1
Patient demographics and clinical characteristics
| MSA Total | MSA-P | MSA-C | p | |
| N (%) | 193 | 114 (59.07) | 79 (40.93) | – |
| Age (y) | 61.08±7.61 | 61.54±7.80 | 60.42±7.33 | 0.475 |
| Age of onset (y) | 58.29±7.58 | 58.51±7.68 | 57.98±7.49 | 0.881 |
| Symptom-onset to diagnosis (y) | 2.79±1.91 | 3.02±2.00 | 2.44±1.73 | 0.018 |
| Female (%) | 92 (47.67) | 63 (55.26) | 29 (36.71) | 0.017 |
| H-Y | 2.76±0.84 | 2.82±0.92 | 2.67±0.71 | 0.498 |
| UPDRS-III | 39.58±18.31 | 45.06±16.88 | 31.67±17.47 | <0.001 |
| Urinary retention (%) | 109 (56.50) | 74 (64.90) | 35 (44.30) | 0.005 |
| Orthostatic hypertension (%) | 80 (41.45) | 57 (50.00) | 23 (29.11) | 0.006 |
| PDSS (%) | 143 (74.09) | 75 (65.79) | 68 (86.08) | 0.003 |
| Sexual dysfunction (%) | 82 (42.71) | 41 (35.96) | 41 (52.56) | 0.033 |
The data are expressed as the mean±SD, and qualitative variables are shown as frequencies (%). H-Y, Hoehn & Yahr stage; UPDRS-III, The Movement Disorder Society-Unified Parkinson’s Disease Rating Scale-part III; Urinary retention evaluated by bladder residual urine volume more than 50 milliliters; Orthostatic hypertension evaluated by orthostatic drop of 30 mmHg in systolic blood pressure or 15 mmHg in diastolic blood pressure while moving from supine position to upright position; PDSS, Parkinson’s Disease Sleep Scale, score <90 was defined as abnormal; Sexual dysfunction evaluated by the Non-Motor Symptom Scale.
Cluster analysis based on baseline evaluation
Based on the optimal number of clusters identified by wssplot of R, k-means cluster analysis was performed to classify these patients into four clusters, as shown in Fig. 2. Detailed clinical characteristics of the four clusters are shown in Table 2.
Fig. 2
A) The inflection point chart shows that the optimal number of clusters is 4, calculated by the open-source factoextra package in R. B) shows the four clusters identified by k-means clustering visually.
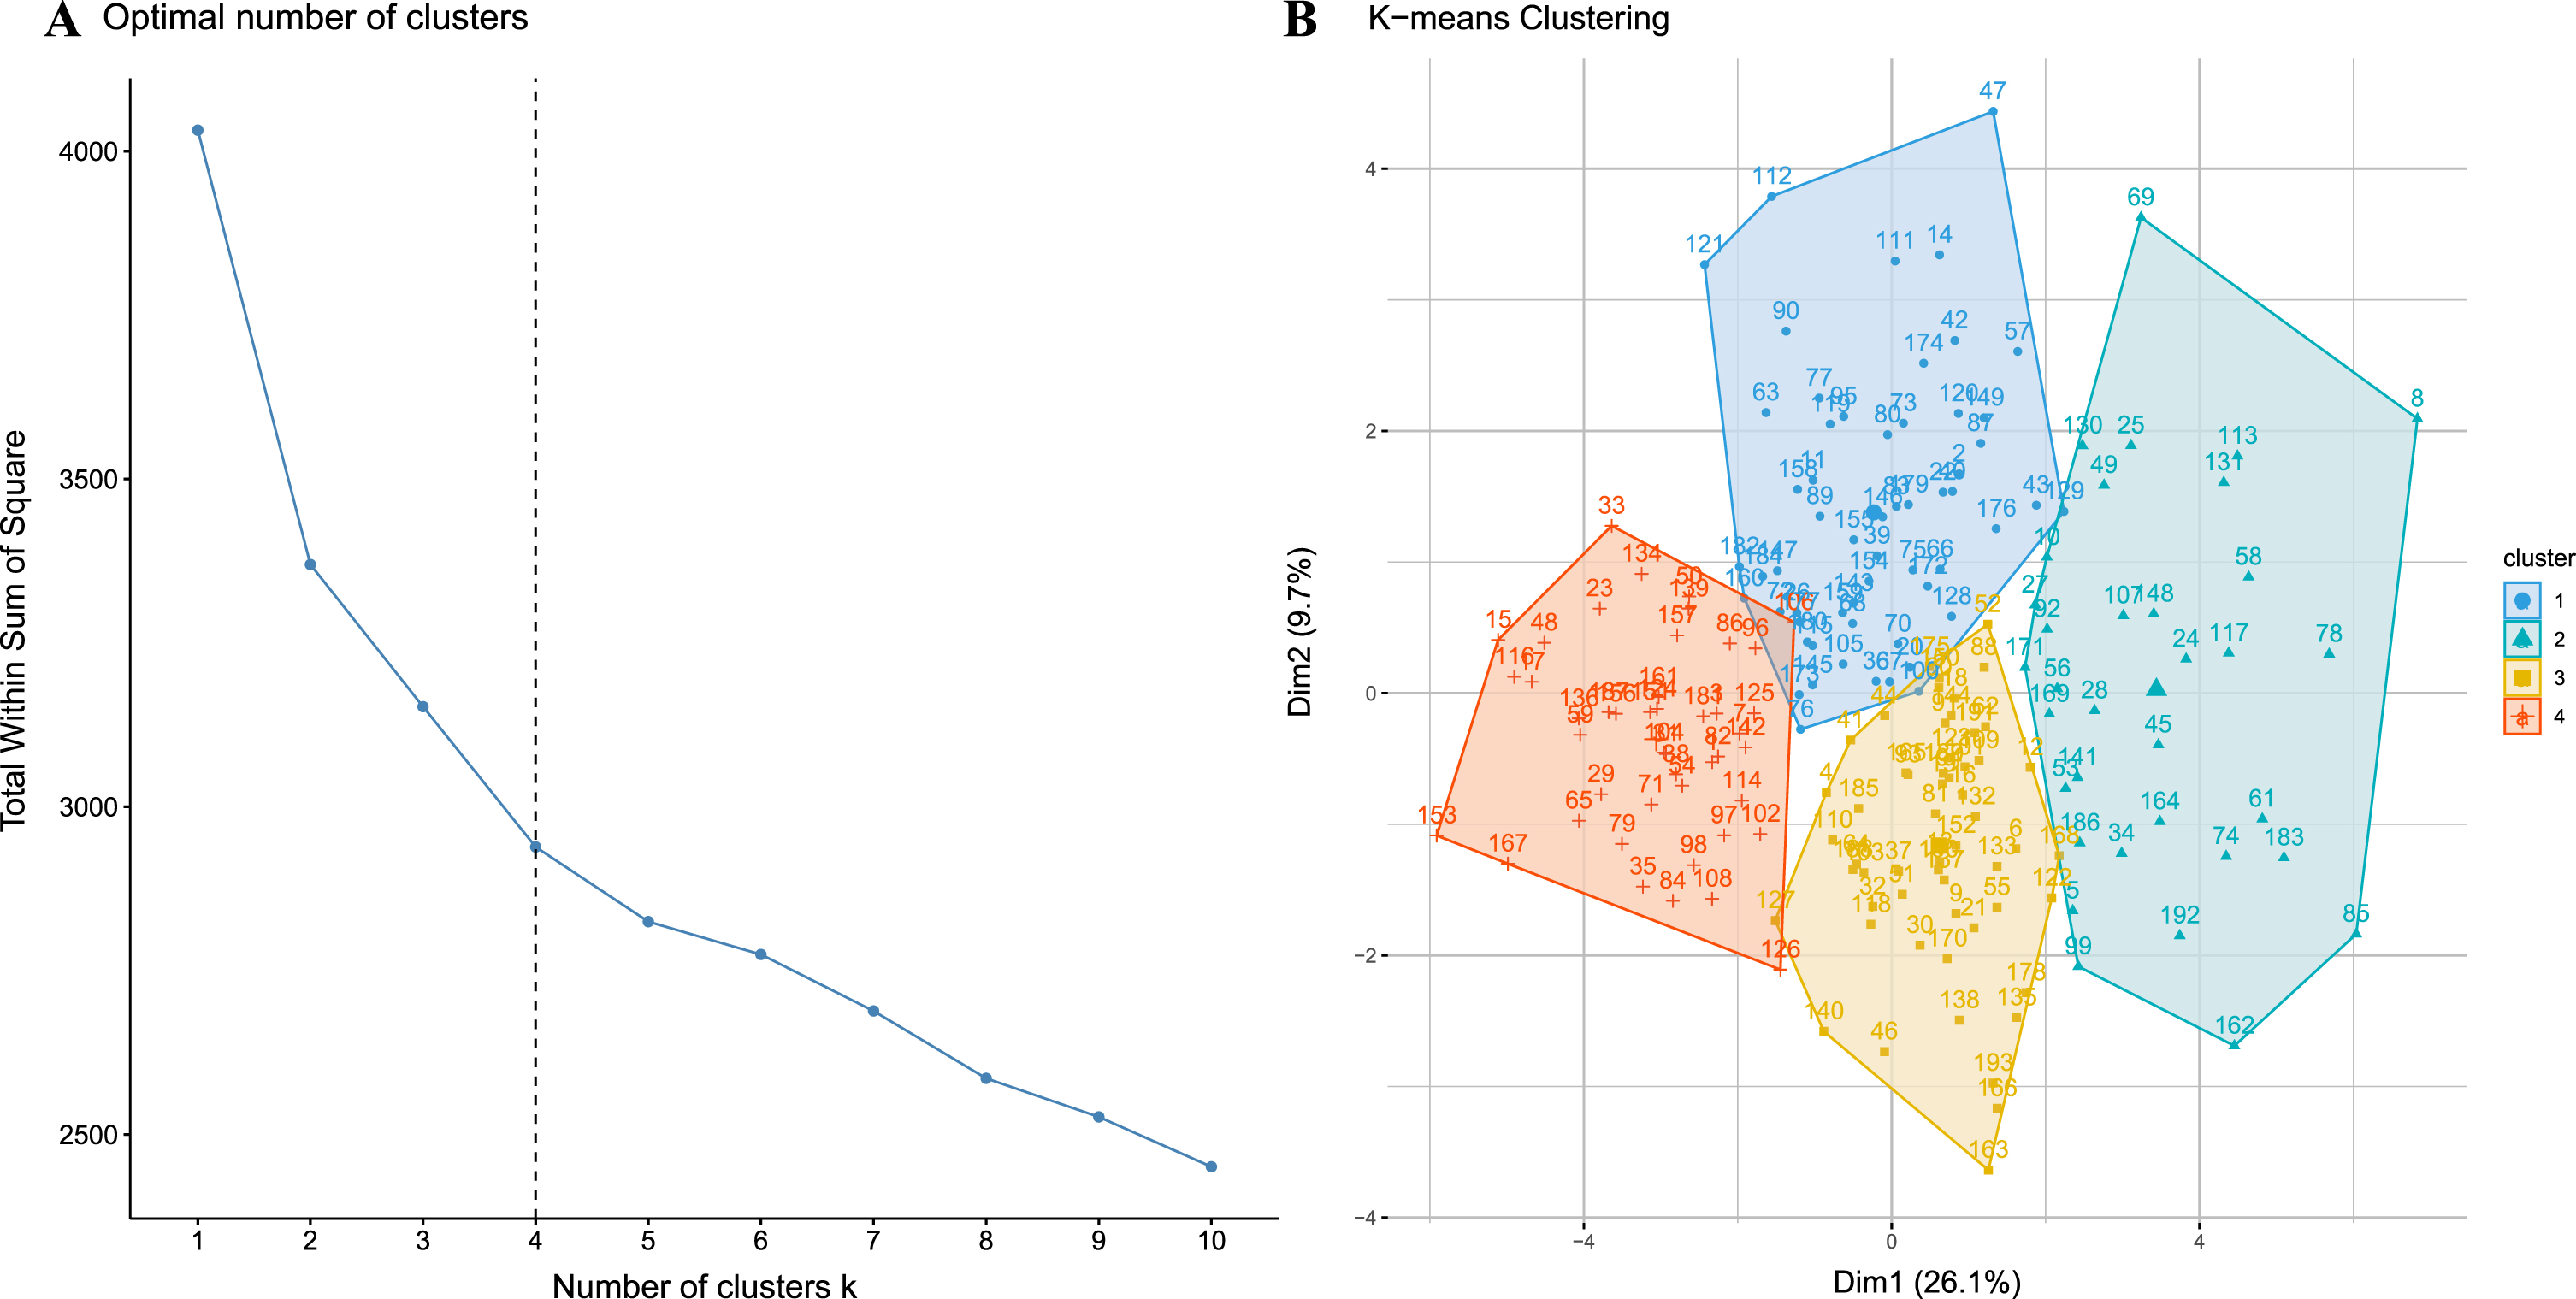
Table 2
Demographics and clinical characteristics of patients with CA classification
| CSD | SMD | RAD | MD | p* | Multiple comparisons** | Adjusted p*** | |
| N (%) | 45 (23.31) | 58 (30.05) | 56 (29.02) | 34 (17.62) | – | – | – |
| Age of onset (y) | 58.28±8.43 | 57.12±7.02 | 59.53±7.27 | 58.26±7.86 | 0.411 | – | – |
| Age (y) | 62.20±7.65 | 60.13±8.21 | 59.97±6.87 | 62.38±7.80 | 0.247 | – | – |
| Female sex (%) | 17 (37.78) | 26 (44.83) | 28 (50.00) | 21 (61.76) | 0.188 | – | – |
| Symptom onset to diagnosis (y) | 1.85±1.44 | 2.85±1.89 | 2.66±1.33 | 4.12±2.51 | <0.001 | CSD vs. SMD, RAD vs. MD | – |
| H-Y | 2.31±0.62 | 2.45±0.56 | 2.91±0.69 | 3.62±1.01 | <0.001 | RAD vs. MD | RAD vs. MD |
| Motor symptoms | |||||||
| UPDRS-III | 20.00±10.79 | 36.56±11.48 | 47.27±13.37 | 57.95±16.84 | <0.001 | CSD vs. SMD, RAD vs. MD | CSD vs. SMD, RAD vs. MD |
| Speech | 0.92±0.71 | 1.16±0.73 | 1.76±0.97 | 2.40±0.77 | <0.001 | RAD vs. MD | RAD vs. MD |
| Facial expression | 0.65±0.73 | 1.31±0.64 | 1.84±0.78 | 2.61±0.77 | <0.001 | CSD vs. SMD, RAD vs. MD | CSD vs. SMD, RAD vs. MD |
| Rigidity | 2.09±2.31 | 5.69±2.73 | 6.66±2.82 | 8.58±3.27 | <0.001 | CSD vs. SMD, RAD vs. MD | CSD vs. SMD, RAD vs. MD |
| Bradykinesia | 8.52±5.20 | 16.39±6.88 | 21.03±5.57 | 25.34±6.18 | <0.001 | CSD vs. SMD, RAD vs. MD | CSD vs. SMD, RAD vs. MD |
| Gait | 1.11±0.98 | 1.47±0.72 | 2.28±0.79 | 3.17±0.90 | <0.001 | CSD vs. SMD, RAD vs. MD | CSD vs. SMD, RAD vs. MD |
| Postural stability | 1.20±1.22 | 1.65±1.22 | 2.76±1.04 | 3.38±1.10 | <0.001 | RAD vs. MD | CSD vs. SMD, RAD vs. MD |
| Posture | 0.61±0.68 | 1.27±0.86 | 2.15±0.75 | 2.81±0.86 | <0.001 | CSD vs. SMD, RAD vs. MD | CSD vs. SMD, RAD vs. MD |
| Axial bradykinesia | 0.94±0.85 | 1.56±0.74 | 2.53±0.93 | 3.15±1.00 | <0.001 | CSD vs. SMD, RAD vs. MD | CSD vs. SMD, RAD vs. MD |
| Gait (%) | 12 (26.67) | 30 (51.72) | 51 (91.07) | 34 (100.00) | <0.001 | CSD vs. SMD | CSD vs. SMD |
| Postural stability (%) | 13 (28.89) | 25 (43.10) | 49 (87.50) | 31 (91.18) | <0.001 | – | – |
| Cerebellar dysfunction (%) | 28 (62.22) | 27 (46.55) | 14 (25.00) | 10 (29.41) | 0.001 | – | – |
| Nonmotor symptoms | |||||||
| MMSE | 27.16±2.84 | 25.15±3.60 | 26.16±3.14 | 21.86±4.83 | <0.001 | CSD vs. SMD, RAD vs. MD | CSD vs. SMD, RAD vs. MD |
| MoCA | 23.78±3.69 | 21.64±4.97 | 23.20±4.10 | 18.75±7.14 | 0.003 | CSD vs. SMD, RAD vs. MD | CSD vs. SMD, RAD vs. MD |
| HAMA | 6.54±3.89 | 15.73±6.79 | 8.30±4.24 | 16.56±7.13 | <0.001 | CSD vs. SMD, RAD vs. MD | CSD vs. SMD, RAD vs. MD |
| HAMD | 7.07±4.57 | 19.22±8.02 | 9.90±5.82 | 20.04±9.04 | <0.001 | CSD vs. SMD, RAD vs. MD | CSD vs. SMD, RAD vs. MD |
| PDSS | 28.58±33.78 | 60.35±40.08 | 69.06±38.49 | 69.21±33.22 | <0.001 | CSD vs. SMD | CSD vs. SMD |
| RBD | 22.60±15.06 | 40.07±14.81 | 22.73±14.10 | 39.93±12.45 | <0.001 | CSD vs. SMD, RAD vs. MD | CSD vs. SMD, RAD vs. MD |
| ESS | 2.58±2.32 | 6.60±3.89 | 5.32±4.45 | 6.67±4.64 | <0.001 | CSD vs. SMD | CSD vs. SMD, RAD vs. MD |
| Anxiety (%) | 1 (2.22) | 33 (56.90) | 6 (10.71) | 20 (58.82) | <0.001 | CSD vs. SMD, RAD vs. MD | CSD vs. SMD, RAD vs. MD |
| Depression (%) | 0 (0.00) | 25 (43.10) | 6 (10.71) | 18 (52.94) | <0.001 | CSD vs. SMD, RAD vs. MD | CSD vs. SMD, RAD vs. MD |
| RBD (%) | 26 (57.78) | 55 (94.83) | 34 (60.71) | 32 (94.12) | <0.001 | CSD vs. SMD, RAD vs. MD | CSD vs. SMD, RAD vs. MD |
| EDS (%) | 1 (2.22) | 22 (37.93) | 11 (19.64) | 13 (38.24) | <0.001 | CSD vs. SMD | CSD vs. SMD |
| Sexual dysfunction (%) | 19 (42.22) | 33 (57.89) | 14 (25.00) | 16 (47.06) | 0.005 | RAD vs. MD | RAD vs. MD |
| Constipation (%) | 35 (79.55) | 46 (79.31) | 50 (89.29) | 28 (82.35) | 0.455 | – | – |
| Urinary incontinence (%) | 19 (42.22) | 22 (37.93) | 33 (58.93) | 20 (58.82) | 0.066 | – | – |
| Urgency (%) | 33 (73.33) | 51 (87.93) | 46 (82.14) | 29 (85.29) | 0.265 | CSD vs. SMD | – |
| Urinary retention (%) | 27 (60.00) | 39 (67.24) | 46 (82.14) | 26 (76.47) | 0.073 | – | – |
| Orthostatic hypotension (%) | 15 (33.33) | 20 (34.48) | 29 (51.79) | 16 (47.06) | 0.152 | – | – |
| Levodopa responsiveness (%) | 13 (28.89) | 15 (25.86) | 8 (14.29) | 5 (14.71) | 0.187 | – | – |
*Compared among the four clusters. **Multiple comparisons were performed among CSD and SMD, RAD and MD. ***Adjusted P values were calculated for comparisons between groups by multivariable linear or logistic regression (controlling for baseline years from symptom onset to diagnosis). CSD, cerebellar symptom dominant; SMD, sleep and mood disorder dominant; RAD, rigid akinetic dominant; MD, malignant diffuse. The MMSE scores were defined as abnormal with the consideration of patients’ education level: <17 was considered as abnormal for the uneducated patients, <20 as abnormal for the patients with high school diplomas, <23 as abnormal for the patients with college diplomas; a MoCA score <26 was considered abnormal; a HAMA score ≥7 was considered abnormal; a HAMD score ≥8 was considered abnormal; a PDSS score ≥8 was considered abnormal; a RBDQ-HK score ≥19 was considered abnormal; a ESS score ≥8 was considered abnormal. Sexual dysfunction, constipation and urinary incontinence were evaluated by the Non-Motor Symptom Scale.
The first cluster accounted for 23.31% of the patients and had the highest frequency of cerebellar symptoms (62.22%). Patients in this cluster had the lowest levels of motor and nonmotor impairment compared with the other three profiles. This cluster was labeled “cerebellar symptom-dominant” (CSD).
The second and largest cluster, accounting for 30.05% of the patients, exhibited the highest prevalence of REM sleep behavior disorder (RBD) (94.83%) and the second-highest frequencies of anxiety (56.90%), depression (43.10%), and excessive daytime sleepiness (EDS) (37.93%) among the four subtypes. Moreover, this cluster displayed the highest incidence of sexual dysfunction (57.89%). Patients in this group presented with moderate levels of motor impairment and were characterized by both cerebellar dysfunction and parkinsonism. We designated this cluster “sleep and mood disorder-dominant” (SMD).
The third cluster accounted for 29.02% of the patients. Patients in this cluster exhibited the second-most severe parkinsonism symptoms but displayed a low frequency of nonmotor symptoms. Interestingly, this cluster presented with the highest level of constipation (89.29%). This cluster was described as “rigid akinetic-dominant” (RAD).
The fourth cluster accounted for 17.62% of the patients. All patients in this cluster presented with gait disorders and postural instability (91.18%). They had the highest UPDRS-III score (p < 0.05) among all clusters. In addition, they also had the worst score in nearly every domain of nonmotor symptoms, including cognition disorders (measured by the MMSE and MoCA), depression (measured by the HAMD), anxiety (measured by the HAMA), sleep disorders (measured by the RBD and ESS), and sexual and urinary symptoms. Therefore, this cluster was labeled “malignant diffuse” (MD).
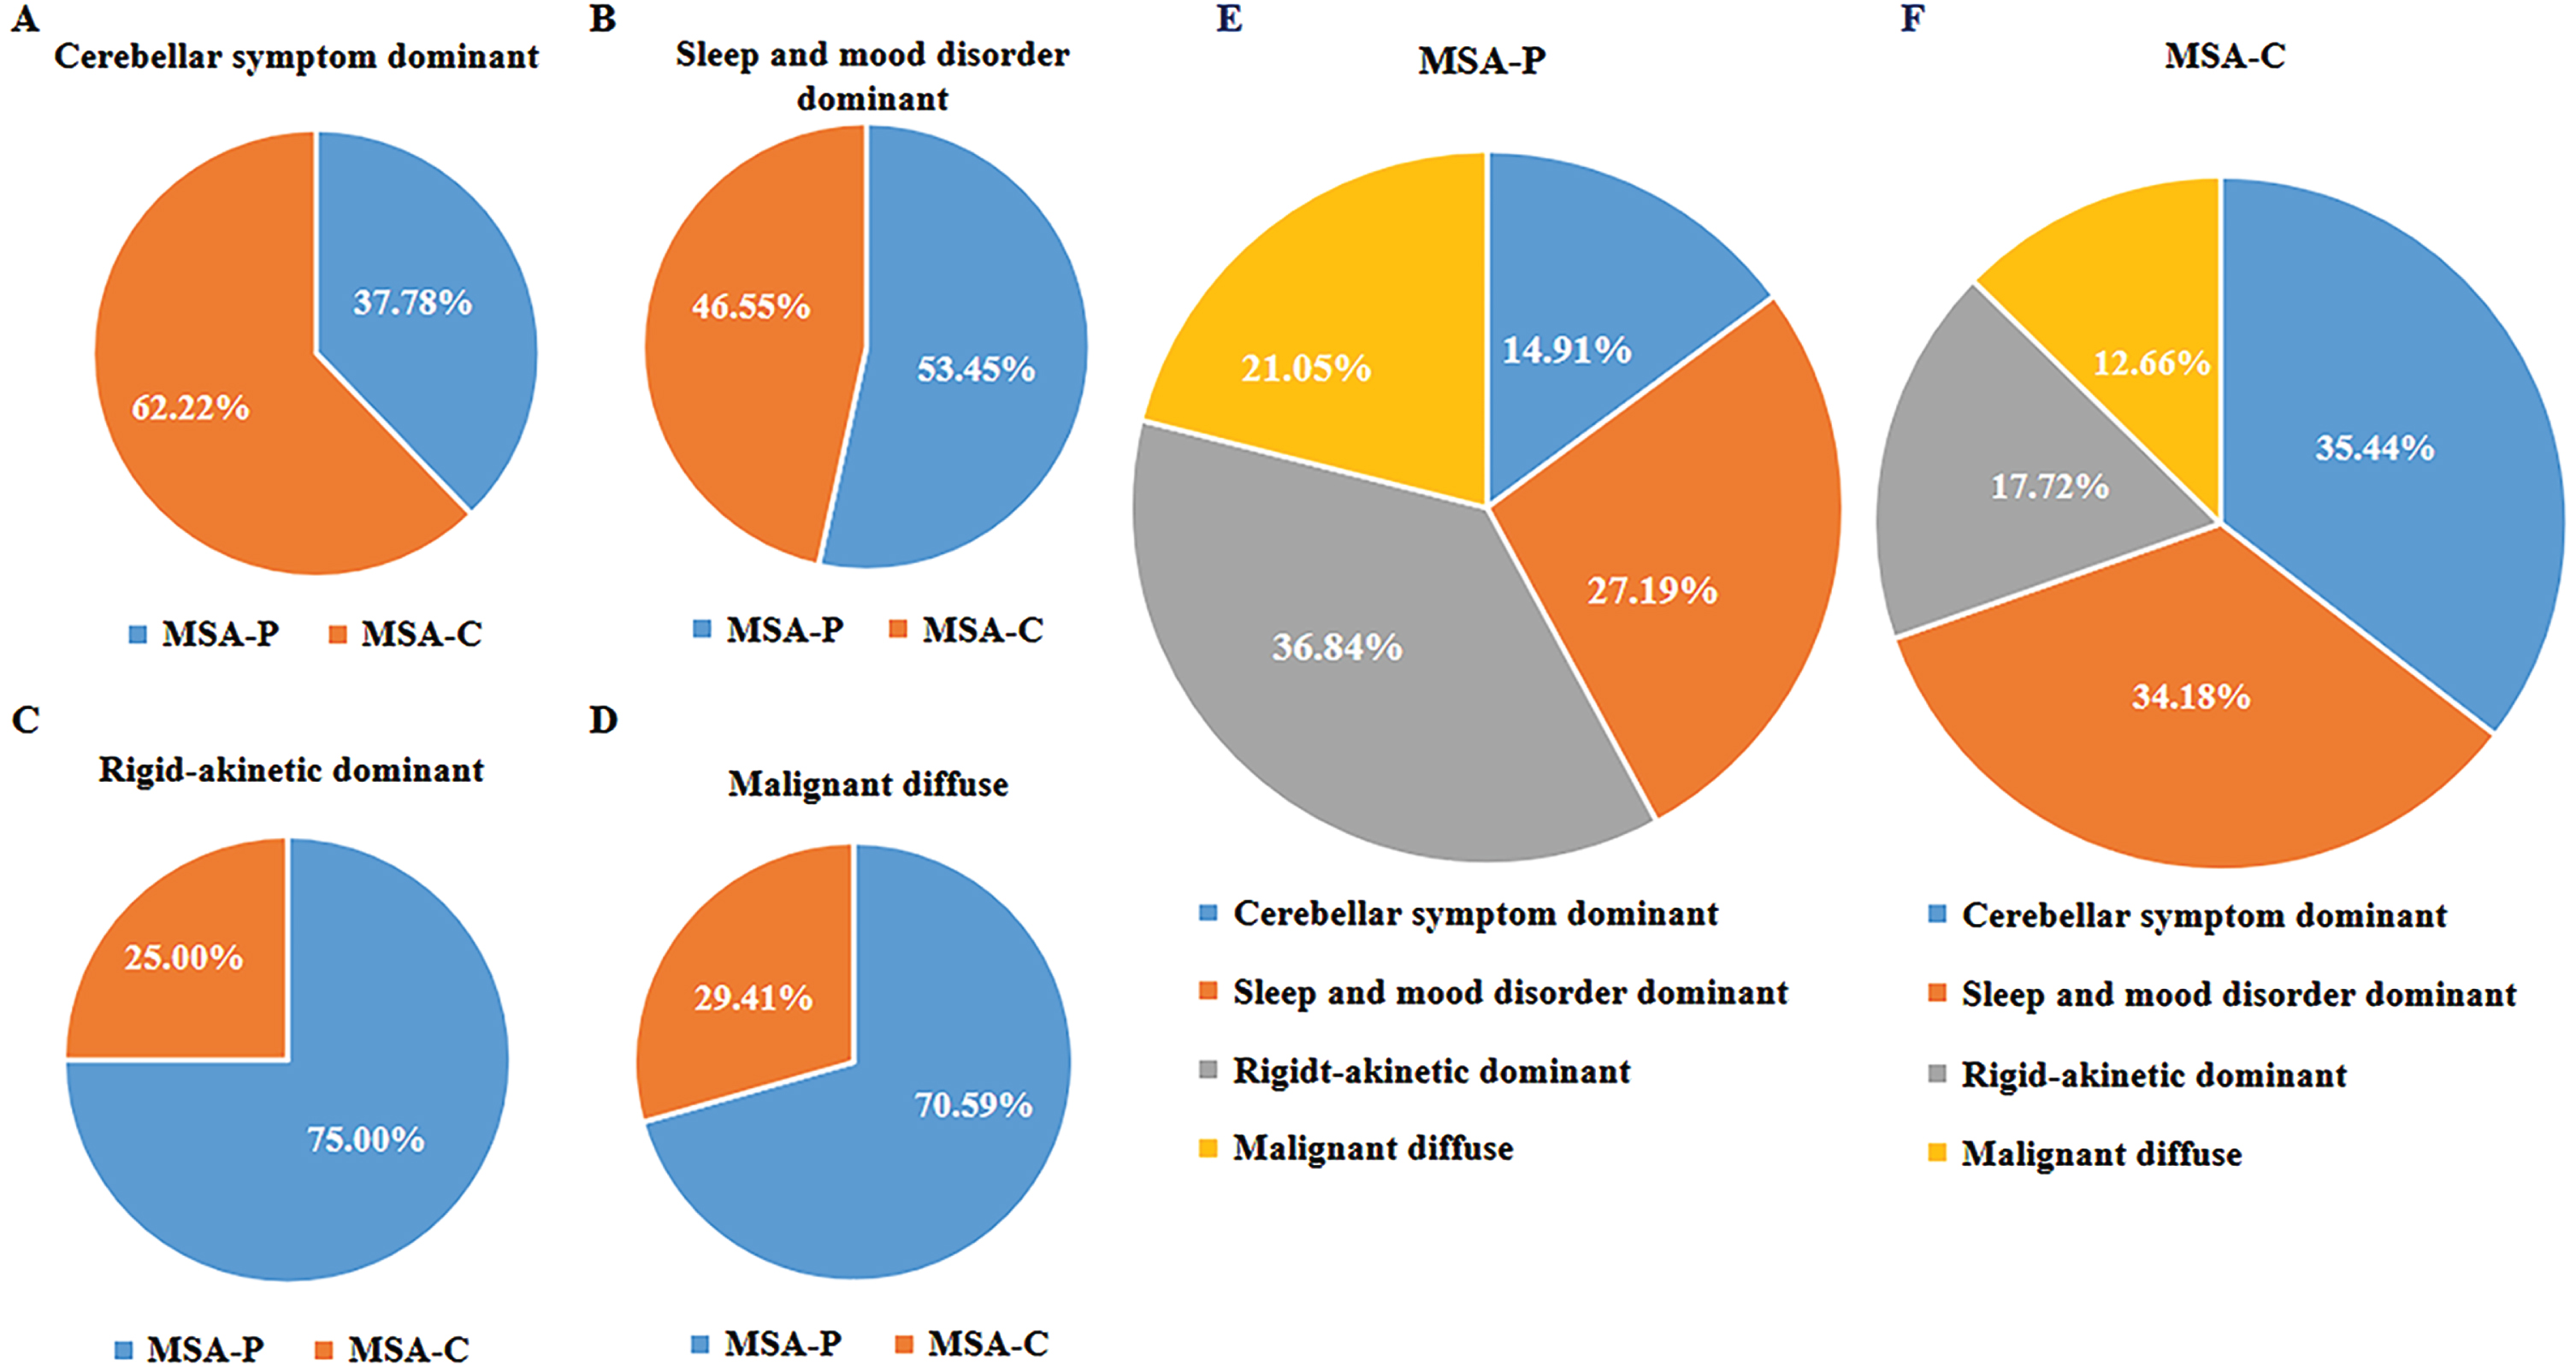
The proportions of motor subtypes based on the current second consensus criteria differed significantly among CA clusters. Based on the predominate motor manifestation, 28 patients (62.22%) in the cerebellar symptom-dominant cluster were diagnosed with MSA-C at baseline; the sleep and mood disorder-dominant cluster included 27 patients (46.55%) with MSA-C at baseline; 14 patients (25.00%) in the rigid akinetic-dominant cluster had MSA-C at baseline; and 10 patients (29.41%) in the diffuse malignant cluster had MSA-C at baseline (Fig. 3).
Fig. 3
Relationships between subtypes based on cluster analysis and motor classification. A– D) The proportion of patients with different motor classifications in relation to the four cluster analysis subtypes. E, F) The proportion of patients with cluster analysis subtypes in relation to motor subtypes.
Prognosis in follow-up
A total of 95 MSA patients were followed up with by telephone, and detailed information is shown in Table 3. At follow-up, 21 (32.8%) patients reported being bedbound, and 31 (32.6%) patients had died. The incidences of bedbound status and death were significantly different between the four data-driven subtypes. There was also a significant difference in ADL scores between the four clusters.
Table 3
The prognosis of patients with MSA classified based on motor-symptoms or data-driven approaches
| Outcomes | Motor Classification | CA Classification | |||||||
| MSA | MSA-P | MSA-C | p | CSD | SMD | RAD | MD | p | |
| (n = 95) | (n = 57) | (n = 38) | (n = 18) | (n = 29) | (n = 25) | (n = 23) | |||
| Bed-bound (%) | 21 (32.81) | 13 (36.11) | 8 (28.57) | 0.598 | 1 (6.67) | 9 (33.33) | 7 (58.33) | 4(40.00) | 0.034 |
| CSD vs. RAD* | |||||||||
| Death (%) | 31 (32.63) | 21 (36.84) | 10 (26.32) | 0.373 | 3 (16.67) | 2 (6.90) | 13 (52.0) | 13(56.52) | <0.001 |
| SMD vs. RAD* | |||||||||
| SMD vs. MD* | |||||||||
| ADL | 59.14±32.76 | 53.06±34.21 | 66.96±29.58 | 0.094 | 87.00±21.70 | 62.04±30.92 | 37.50±27.01 | 35.50±23.74 | <0.001 |
| CSD vs. RAD* | |||||||||
| CSD vs. MD* | |||||||||
*The p values were adjusted for multiple comparisons by Bonferroni correction. MSA-P, MSA with parkinsonism variant; MSA-C, MSA with cerebellar variant; CA Classification, K-means cluster analysis classification. CSD, cerebellar symptom dominant; SMD, sleep and mood disorder dominant; RAD, rigid akinetic dominant; MD, malignant diffuse.
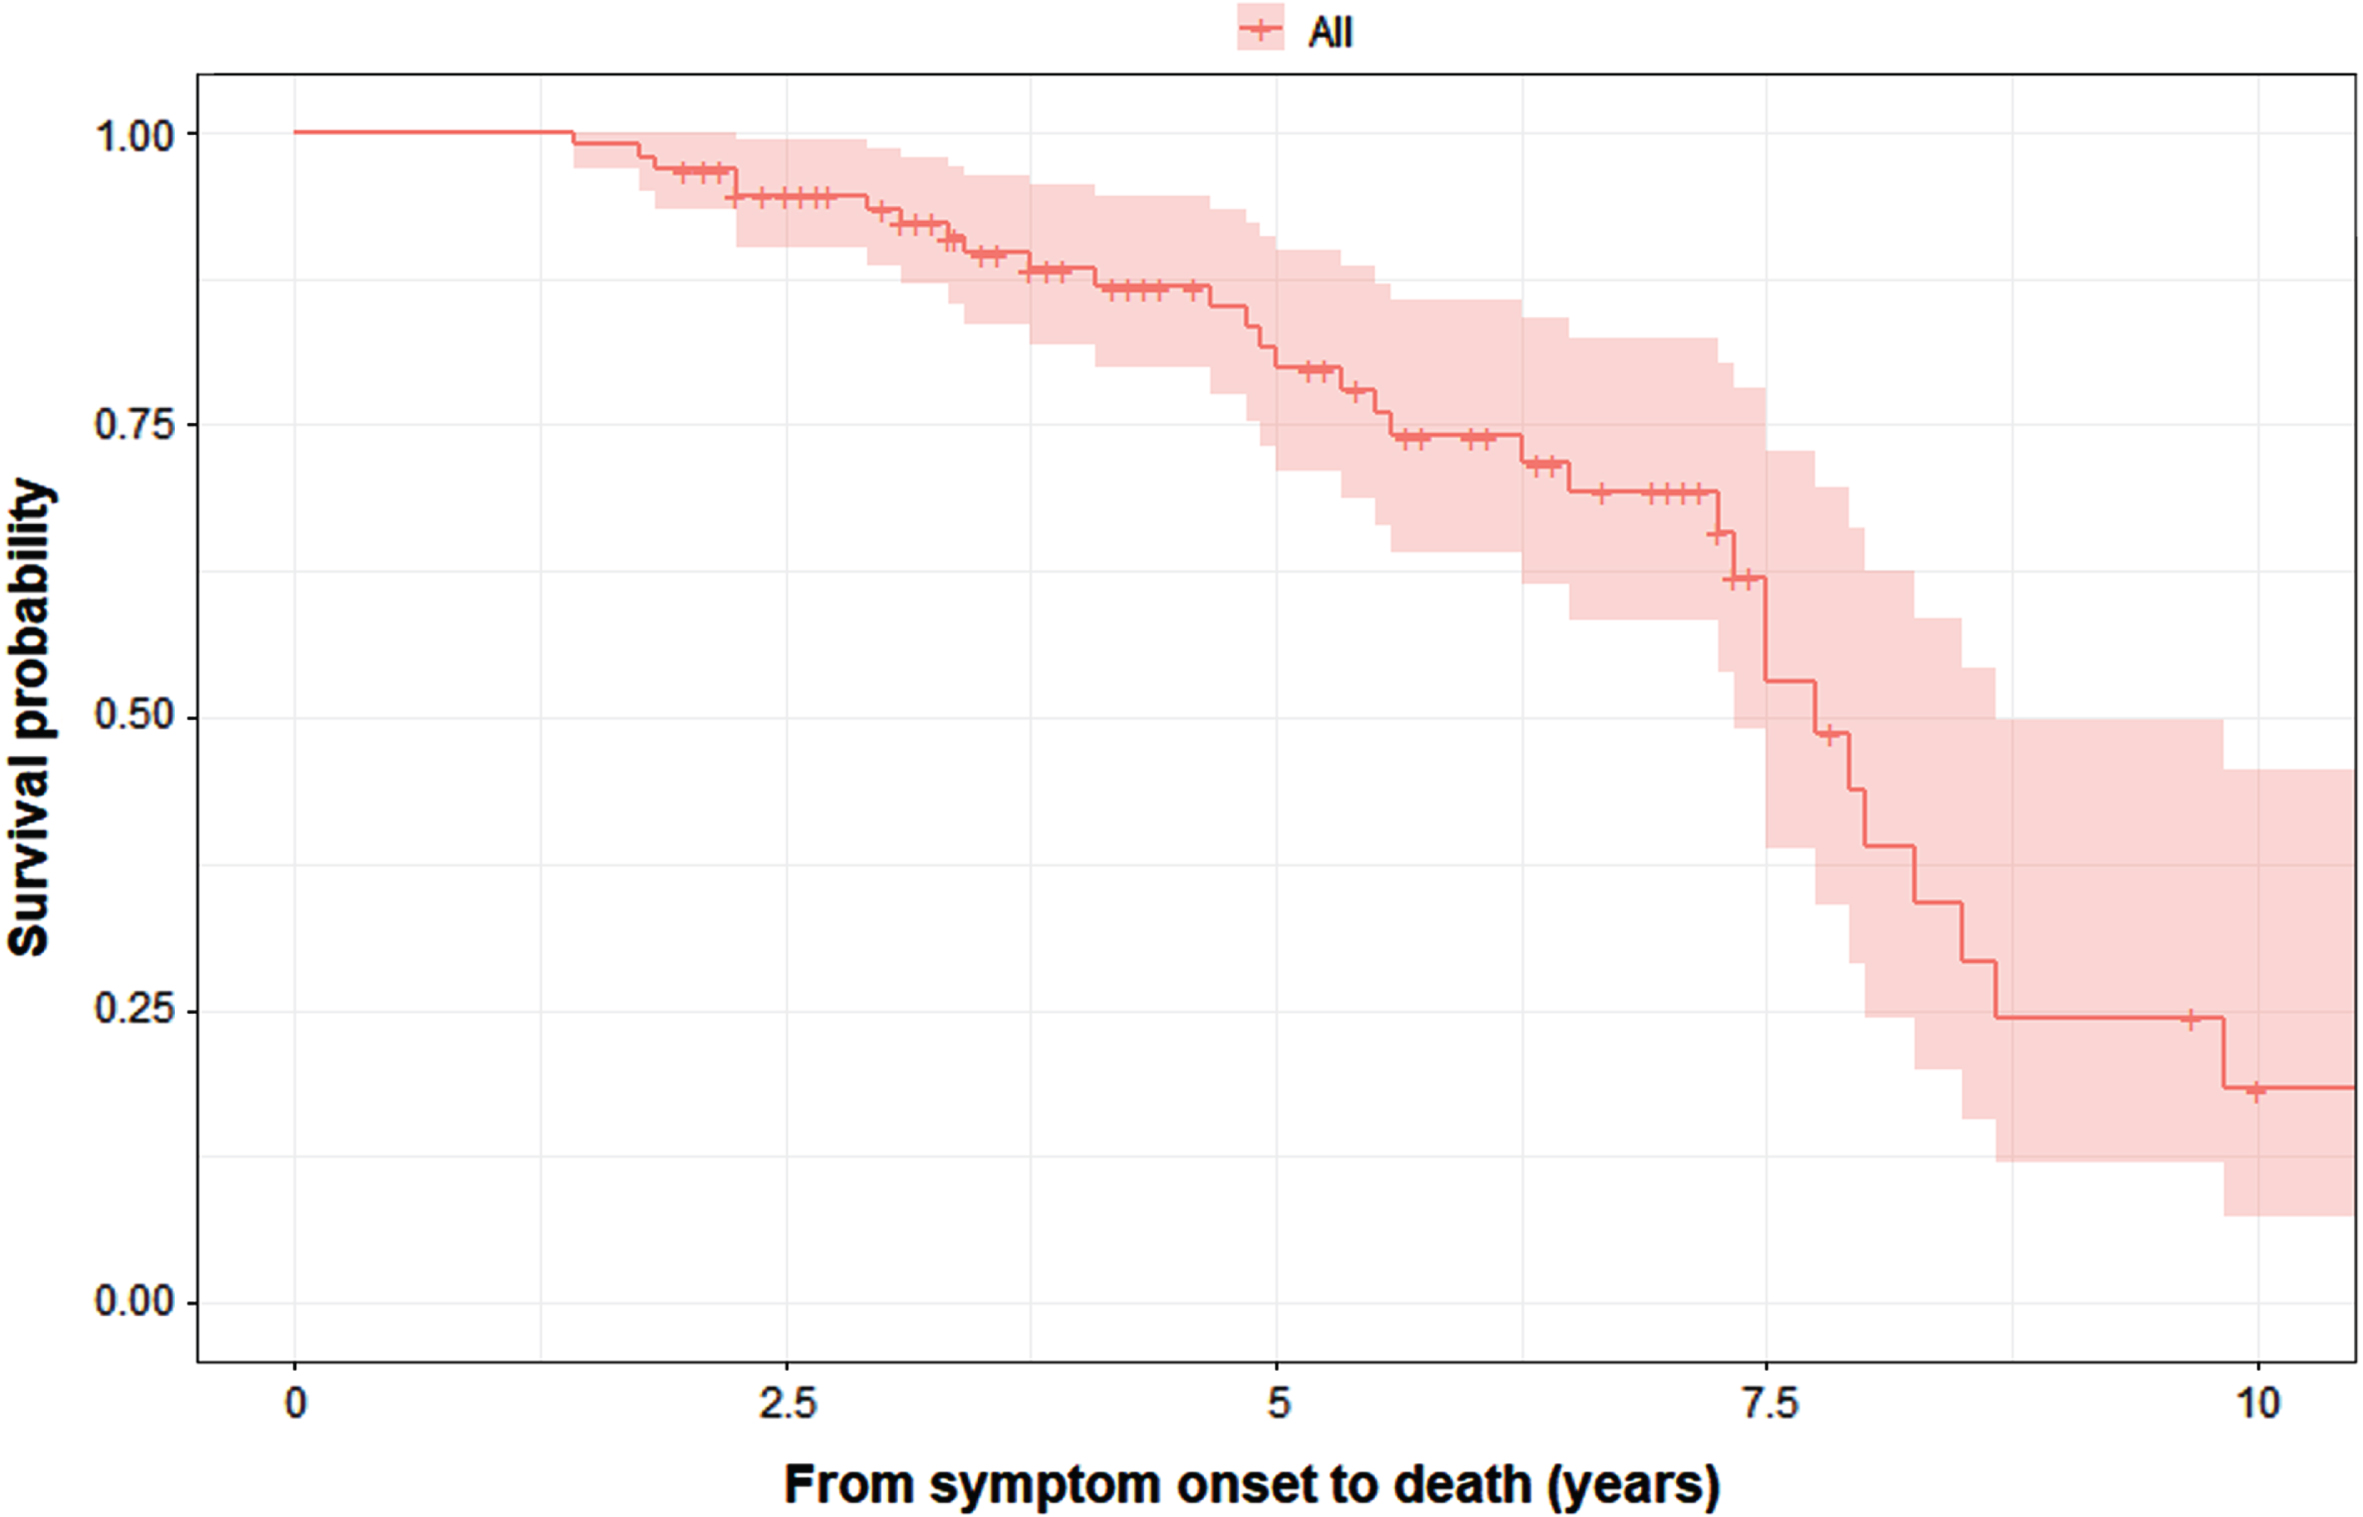
The results of Kaplan– Meier analysis revealed that the median survival from symptom onset to death was 7.75 (95% CI = 7.19–8.31) years (Fig. 4). The log-rank test showed that there were no significant difference in survival between the MSA-C with MSA-P patients (Supplementary Figure 1), while there was a difference in survival between the four data-driven clusters (Supplementary Figure 2). After adjusting for years from symptom onset to diagnosis, age, and sex, cox regression analysis showed that patients in the malignant diffuse (HR = 7.16, 95% CI 1.52–33.76; p = 0.013) and rigid akinetic-dominant (HR = 7.27, 95% CI 1.56–33.83; p = 0.011) clusters had a significantly greater risk of death than those in the sleep and mood disorder-dominant cluster. The duration from symptom onset to diagnosis also had an impact on death (p < 0.001). Age and sex did not affect the risk of death in the model (Supplementayr Table 1). The results of the multivariable logistic regression concerning bedbound status are summarized in Supplementary Table 1. Because of the small number of events available, years from symptom onset to diagnosis, age, sex, and data-driven clusters were included in the multivariate logistic regression model. The results showed that patients in the malignant diffuse (OR = 15.44, 95% CI 1.05–226.127; p = 0.046) and rigid akinetic-dominant clusters (OR = 17.83, 95% CI 1.60–198.75; p = 0.019) had a higher risk of being bedbound than patients in the cerebellar symptom-dominant cluster. Age had a significant impact on death, while sex and years from symptom onset to diagnosis had no significant effect on mortality.
Fig. 4
K– M survival curves for the probability of death in all patients with MSA (n = 95).
DISCUSSION
In this study, 193 patients with MSA were classified into four subtypes using the data-driven cluster analysis approach: cerebellar symptom-dominant (CSD), sleep and mood disorder-dominant (SMD), rigid akinetic-dominant (RAD), and malignant diffuse (MD). Our results showed that the subtypes differed substantially not only in clinical characteristics but also in disease prognosis. After adjusting for years from symptom onset to diagnosis, age, and sex, we found that patients in the RAD and MD clusters had poorer survival than patients in the SMD cluster. Patients in the RAD and MD clusters had a higher risk of being bedbound at follow-up than patients in the CSD cluster.
Classical MSA subtypes were defined based on motor symptoms.1 However, previous data-driven studies indicated that patients with MSA could be divided into at least three potential subgroups to emphasize the role of nonmotor features.9,10 As many as 75% of MSA patients have a prodromal phase characterized by nonmotor symptoms such as respiratory problems, RBD, orthostatic hypotension, urinary dysfunction, and sexual dysfunction.15 We found that diffuse symptoms at diagnosis— especially postural instability and mood and cognitive alterations— may indicate rapid functional loss and disease progression. Furthermore, there is evidence suggesting that it is important to stratify patients by motor predominance as well as by balance and nonmotor symptoms.
The different profiles and prognoses may be a result of nondopaminergic system involvement.15,16 Pathologically, the widespread distribution of glial cytoplasmic inclusions (GCIs) may cause multiple clinical features, as GCIs have been found in a wide range of areas, such as sacral visceral pathways, the peripheral nervous system, the locus coeruleus, the nucleus raphe, the dorsal vagal nuclei, the spinal cord, the striatum and the olivary pontine cerebellar system.17 This may cause the high heterogeneity between MSA profiles.
CSD: Patients in the CSD cluster had relatively modest levels of motor and nonmotor symptoms at baseline, and most patients in this cluster were classified as MSA-C. Patients in this cluster represent a portion of patients with MSA-C at an early stage; they experience severe sleep disturbance and autonomic dysfunction, in line with the “minimal change” MSA, which was recognized as MSA at an early stage.18,19
SMD: Patients in the SMD cluster have milder motor symptoms and a wide range of sleep-related and emotional symptoms. A previous study reported that RBD is quite common in these patients (prevalence of 88%), as determined by polysomnography.20 This cluster, however, accounts for 30% of MSA patients. Thus, while RBD is a prevalent occurrence, there are phenotypes in which RBD may be linked to daytime sleepiness and mood changes as well as less severe motor symptoms. Interestingly, this cluster appears to exhibit a more favorable motor prognosis and longer survival rates. Sleep disturbances in MSA may be related to the pontomedullary brainstem nuclei and abnormal transmitter synthesis.21 Emotional disturbances in MSA might be caused by the abnormal synthesis of various transmitters.22
RAD: Patients in this cluster had milder motor and nonmotor symptoms, thus indicating “restricted” presentations. Yang et al.10 also used a data-driven approach and found two clusters of MSA patients that exhibited remarkable motor symptoms with less dysautonomia at an early stage, consistent with previous findings indicating that early-stage MSA patients may experience isolated motor impairments.23 However, while patients in the RAD cluster exhibited fewer nonmotor symptoms, they also had a less favorable prognosis in terms of becoming bedbound and experiencing lower survival rates. Thus, these more “restricted” presentations are not more benign, especially if they involve parkinsonian motor symptoms.
MD: Patients in this cluster simultaneously suffered from severe motor and nonmotor features at baseline. All patients in this subgroup suffered from gait disturbance and postural instability. The causes of gait impairment in MSA are multifaceted, including cerebellar ataxia, bradykinesia, and hypertonia. The lesions of the pedunculopontine area might be responsible for gait disturbance.24 This subgroup exhibited widespread motor and nonmotor symptoms, which might be attributed to the dysfunction of a variety of distinct anatomical systems. Their simultaneous impairment may signify a relatively diffuse neurodegenerative process. Interestingly, this group also scored worse on cognitive scales, suggesting an association between postural instability and cognition as well as mood.
Prognostic factors
In our study, the median survival time of MSA patients was 7.75 years, and a previous study including 220 Chinese MSA patients reported that the median survival time of MSA patients was 6.4 years.25 In line with previous studies, the phenotypes of MSA-P and MSA-C did not affect the survival rate.3,6,7 Various factors have been proposed to predict progression and survival in MSA, including earlier autonomic failure,3 older age at onset,26 RBD,27 stridor,28 and dysphagia.29 Using multivariable Cox analysis, we found that there was no impact of age or sex on survival. The clinical profile was one of the most important factors in the prognosis of MSA according to the model. We found that the risk factors for being bedbound were predominant postural instability at baseline and rigid-akinetic predominance (MD and RAD clusters), and the restricted cerebellar cluster (CSD) had a better prognosis regarding bedbound status. Herein, patients with MSA-P and MSA-C showed similar incidences of being bedbound; however, previous studies have reported that patients with MSA-P experience a faster decline in function than MSA-C.4,30 The results from our study indicate that the classification of MSA-P and MSA-C may be a weaker prognostic factor than data-driven classification, which considered non-motor symptoms, specific instability and postural symptoms.
Most studies reported that higher age at onset is a risk factor for MSA.4,31 In our model, age had a significant impact on death in the current sample, with the 95% confidence interval for the odds ratio ranging from 0.828 to 0.998 and the upper limit including 1.0. These results suggest that the variable is likely to impact the outcome, although the precise magnitude of the effect remains uncertain due to the confidence interval. Future research with larger sample sizes is recommended to obtain more precise estimates of the effect size.
The Cox model also showed that patients with a longer duration from symptom onset to diagnosis had a lower risk of death, indicating a protective effect. The long interval between the initiation of notable symptoms and the patient visiting the hospital indicates the possibility of a relatively slow disease progression in which the onset of bothersome symptoms (i.e., symptoms requiring health care) occurs later in this group of patients, resulting in a later diagnosis time. Additionally, the duration between symptom onset and diagnosis is influenced by various factors, including healthcare access and other individual factors influencing disease progression.
Heterogeneity
Our results suggest that there is a high degree of overlap between the key symptoms of MSA-P/C subtypes.16 Approximately 75% of MSA-C patients present parkinsonism during the disease course, while approximately half of MSA-P patients have extra cerebellar symptoms.2,3 Previous studies using data-driven classification have successfully identified three distinct subtypes, implying heterogeneity within the MSA-P and MSA-C groups.9,10 In our study, we also identified an overlap of MSA-P and MSA-C groups in our data-driven classification. In our model, patients in the CSD and SMD clusters presented more cerebellar symptoms and were more likely to include MSA-C patients, while patients in the RAD and MD clusters had predominantly parkinsonian symptoms. CSD and SMD were identified as two subtypes of MSA-C, with one being more severe and the other being milder. Similarly, MD and RAD were found to be two subtypes of MSA-P. This suggests that the presence of distinct subtypes within the traditional classifications of MSA-P and MSA-C are associated with different prognoses. The features were consistent with the difference in the involvement of the basal ganglia and cerebellum in MSA patients.32 The pathogenic mechanism underlying the variations among MSA subtypes remains unclear, with the diversity in α-synuclein distribution or dissemination, the participation of nondopaminergic networks, the concomitant pathology, and the relative susceptibility of nigral neurons or other brain regions having been proposed.33 Additionally, genetic factors might contribute to the subtype specificity of MSA degeneration.34 In addition, prior studies have shown that DNA methylation in the brains of MSA patients is altered in a region-specific and MSA subtype-specific manner.35,36 To address these issues, further research is needed.
Limitations of the study
The Unified Multiple System Atrophy Rating Scale data were not available for MSA patients in the study who were evaluated between 2014 and 2020, thus, some non-motor symptoms such as the severity of autonomic dysfunction were measured with NMSS. We have evaluated the Unified Multiple System Atrophy Rating Scale in participants enrolled after 2020. In addition, because of the COVID-19 pandemic, we were unable to perform face-to-face follow-up examinations and have conducted the telephone interview instead, which might impact on the follow-up rate of our participants. Given the relatively rapid progression of MSA, it was possible that some of the patients who were unreachable might have passed away or experienced deteriorating health conditions, the possibility should be considered during the interpretation of the results regarding disease progression and prognosis. However, the patients who underwent telephone follow-up were evenly distributed among the four subtypes, thus the results of prognosis might not be biased in terms of subtypes.
Conclusions
Our results showed that the profiles differed substantially not only in terms of clinical characteristics but also in disease prognosis, suggesting that the identification of these profiles at baseline may help with predicting disease prognosis. Therefore, early identification of MSA profiles is important for the diagnosis and prognosis of the disease, especially for identifying early postural instability and severe parkinsonian variants.
ACKNOWLEDGMENTS
We thank Alexandra Pérez-Soriano for her kind and constructive comments on the manuscript. We would like to express our gratitude to all patients who participated in the study and their families.
FUNDING
Cheng-Cheng Fan, Xue-Mei Wang, Jagadish K. Chhetri, Wei Mao and Er-He Xu report no disclosures. Chao Han received funding from the National Natural Science Foundation of China (82201401) and Xuanwu Youth Development Project (QNPY2021011). Shu-Ying Liu received funding from the National Natural Science Foundation of China (81901285) and Beijing Hospitals Authority (QMS20210807). Piu Chan received funding from the Ministry of Science and Technology of China (2021YFC2501200; 2018YFC1312001).
CONFLICT OF INTEREST
The authors declare that they have no competing interests. Piu Chan is an Editorial Board Member of this journal but was not involved in the peer-review process of this article nor had access to any information regarding its peer-review.
DATA AVAILABILITY
The datasets generated and/or analyzed during the current study are not publicly available due to privacy or ethical restrictions, but are available from the corresponding author on reasonable request.
SUPPLEMENTARY MATERIAL
[1] The supplementary material is available in the electronic version of this article: https://dx.doi.org/10.3233/JPD-240040.
REFERENCES
1. | Fanciulli A and Wenning GK . Multiple-system atrophy. N Engl J Med (2015) ; 372: : 249–263. |
2. | Wenning GK , Geser F , Krismer F , et al. The natural history of multiple system atrophy: a prospective European cohort study. Lancet Neurol (2013) ; 12: : 264–274. |
3. | Low PA , Reich SG , Jankovic J , et al. Natural history of multiple system atrophy in the USA: a prospective cohort study. Lancet Neurol (2015) ; 14: : 710–719. |
4. | Watanabe H , Saito Y , Terao S , et al. Progression and prognosis in multiple system atrophy: an analysis of 230 Japanese patients. Brain (2002) ; 125: : 1070–1083. |
5. | Gilman S , Wenning GK , Low PA , et al. Second consensus statement on the diagnosis of multiple system atrophy. Neurology (2008) ; 71: : 670–676. |
6. | Foubert-Samier A , Pavy-Le Traon A , Guillet F , et al. Disease progression and prognostic factors in multiple system atrophy: A prospective cohort study. Neurobiol Dis (2020) ; 139: : 104813. |
7. | Kim H-J , Jeon BS , Lee J-Y , et al. Survival of Korean patients with multiple system atrophy. Mov Disord (2011) ; 26: : 909–912. |
8. | Fereshtehnejad S-M , Zeighami Y , Dagher A , et al. Clinical criteria for subtyping Parkinson’s disease: biomarkers and longitudinal progression. Brain (2017) ; 140: : 1959–1976. |
9. | Grimaldi S , Boucekine M , Witjas T , et al. Multiple system atrophy: phenotypic spectrum approach coupled with brain 18-FDG PET. Parkinsonism Relat Disord (2019) ; 67: : 3–9. |
10. | Yang H-J , Kim H-J , Jung YJ , et al. Data-driven subtype classification of patients with early-stage multiple system atrophy. Parkinsonism Relat Disord (2022) ; 95: : 92–97. |
11. | Ling-Yan Ma , Piu Chan , Zhu-Qin Gu , et al. Heterogeneity among patients with Parkinson’s disease: cluster analysis and genetic association. J Neurol Sci (2015) ; 351: : 41–45. |
12. | Goetz CG , Tilley BC , Shaftman SR , et al. Movement Disorder Society-sponsored revision of the Unified Parkinson’s Disease Rating Scale (MDS-UPDRS): scale presentation and clinimetric testing results. Mov Disord (2008) ; 23: : 2129–2170. |
13. | Hoehn MM and Yahr MD . Parkinsonism: onset, progression and mortality. Neurology (1967) ; 17: : 427–442. |
14. | Feng T , Li W , Lu L , et al. Acute stepwise challenge test with levodopa in treated patients with parkinsonism. Parkinsonism Relat Disord (2009) ; 15: : 354–358. |
15. | Chelban V , Catereniuc D , Aftene D , et al. An update on MSA: premotor and non-motor features open a window of opportunities for early diagnosis and intervention. J Neurol (2020) ; 267: : 2754–2770. |
16. | Stankovic I , Quinn N , Vignatelli L , et al. A critique of the second consensus criteria for multiple system atrophy. Mov Disord (2019) ; 34: : 975–984. |
17. | Benrud-Larson LM , Sandroni P , Schrag A , et al. Depressive symptoms and life satisfaction in patients with multiple system atrophy. Mov Disord (2005) ; 20: : 951–957. |
18. | Wakabayashi K , Mori F , Nishie M , et al. An autopsy case of early (‘minimal change’) olivopontocerebellar atrophy (multiple system atrophy-cerebellar). Acta Neuropathol (2005) ; 110: : 185–190. |
19. | Ahmed Z , Asi YT , Sailer A , et al. The neuropathology, pathophysiology and genetics of multiple system atrophy. Neuropathol Appl Neurobiol (2012) ; 38: : 4–24. |
20. | Schrag A , Sheikh S , Quinn NP , et al. A comparison of depression, anxiety, and health status in patients with progressive supranuclear palsy and multiple system atrophy. Mov Disord (2010) ; 25: : 1077–1081. |
21. | Benarroch EE , Schmeichel AM , Sandroni P , et al. Involvement of hypocretin neurons in multiple system atrophy. Acta Neuropathol (2007) ; 113: : 75–80. |
22. | Brigitta B . Pathophysiology of depression and mechanisms of treatment. Dialogues Clin Neurosci (2002) ; 4: : 7–20. |
23. | Watanabe H , Riku Y , Hara K , et al. Clinical and imaging features of multiple system atrophy: challenges for an early and clinically definitive diagnosis. J Mov Disord (2018) ; 11: : 107–120. |
24. | Masdeu JC , Alampur U , Cavaliere R , et al. Astasia and gait failure with damage of the pontomesencephalic locomotor region. Ann Neurol (1994) ; 35: : 619–621. |
25. | Cao B , Zhang L , Zou Y , et al. Survival analysis and prognostic nomogram model for multiple system atrophy. Parkinsonism Relat Disord (2018) ; 54: : 68–73. |
26. | O’Sullivan SS , Massey LA , Williams DR , et al. Clinical outcomes of progressive supranuclear palsy and multiple system atrophy. Brain (2008) ; 131: : 1362–1372. |
27. | Giannini G , Mastrangelo V , Provini F , et al. Progression and prognosis in multiple system atrophy presenting with REM behavior disorder. Neurology (2020) ; 94: : e1828–e1834. |
28. | Giannini G , Calandra-Buonaura G , Mastrolilli F , et al. Early stridor onset and stridor treatment predict survival in 136 patients with MSA. Neurology (2016) ; 87: : 1375–1383. |
29. | Calandra-Buonaura G , Alfonsi E , Vignatelli L , et al. Dysphagia in multiple system atrophy consensus statement on diagnosis, prognosis and treatment. Parkinsonism Relat Disord (2021) ; 86: : 124–132. |
30. | Pérez-Soriano A , Giraldo DM , Ríos J , et al. Progression of motor and non-motor symptoms in multiple system atrophy: a prospective study from the Catalan-MSA Registry. J Parkinsons Dis (2021) ; 11: : 685–694. |
31. | Figueroa JJ , Singer W , Parsaik A , et al. Multiple system atrophy: prognostic indicators of survival. Mov Disord (2014) ; 29: : 1151–1157. |
32. | Ozawa T , Paviour D , Quinn NP , et al. The spectrum of pathological involvement of the striatonigral and olivopontocerebellar systems in multiple system atrophy: clinicopathological correlations. Brain (2004) ; 127: : 2657–2671. |
33. | Jellinger KA . Multiple system atrophy: an oligodendroglioneural synucleinopathy. J Alzheimers Dis (2018) ; 62: : 1141–1179. |
34. | Poewe W , Stankovic I , Halliday G , et al. Multiple system atrophy. Nat Rev Dis Primers (2022) ; 8: : 56. |
35. | Rydbirk R , Folke J , Busato F , et al. Epigenetic modulation of AREL1 and increased HLA expression in brains of multiple system atrophy patients. Acta Neuropathol Commun (2020) ; 8: : 29. |
36. | Bettencourt C , Foti SC , Miki Y , et al. White matter DNA methylation profiling reveals deregulation of HIP1, LMAN2, MOBP, and other loci in multiple system atrophy. Acta Neuropathol (2020) ; 139: : 135–156. |


