
Parkinson’s Disease Risk Variant rs9638616 is Non-Specifically Associated with Altered Brain Structure and Function
Abstract
Background:
A genome-wide association study (GWAS) variant associated with Parkinson’s disease (PD) risk in Asians, rs9638616, was recently reported, and maps to WBSCR17/GALNT17, which is involved in synaptic transmission and neurite development.
Objective:
To test the association of the rs9638616 T allele with imaging-derived measures of brain microstructure and function.
Methods:
We analyzed 3-Tesla MRI and genotyping data from 116 early PD patients (aged 66.8±9.0 years; 39% female; disease duration 1.25±0.71 years) and 57 controls (aged 68.7±7.4 years; 54% female), of Chinese ethnicity. We performed voxelwise analyses for imaging-genetic association of rs9638616 T allele with white matter tract fractional anisotropy (FA), grey matter volume and resting-state network functional connectivity.
Results:
The rs9638616 T allele was associated with widespread lower white matter FA (t = –1.75, p = 0.042) and lower functional connectivity of the supplementary motor area (SMA) (t = –5.05, p = 0.001), in both PD and control groups. Interaction analysis comparing the association of rs9638616 and FA between PD and controls was non-significant. These imaging-derived phenotypes mediated the association of rs9638616 to digit span (indirect effect: β= –0.21 [–0.42,–0.05], p = 0.031) and motor severity (indirect effect: β= 0.15 [0.04,0.26], p = 0.045).
Conclusions:
We have shown that a novel GWAS variant which is biologically linked to synaptic transmission is associated with white matter tract and functional connectivity dysfunction in the SMA, supported by changes in clinical motor scores. This provides pathophysiologic clues linking rs9638616 to PD risk and might contribute to future risk stratification models.
INTRODUCTION
While 5–10% of Parkinson’s disease (PD) cases are inherited monogenic forms with identified causative genes, the majority of PD cases are idiopathic and are, instead, related to smaller risk contributions from a growing list of genetic variants [1]. There is a need to understand the brain changes associated with these genetic risk contributors [2], and to identify imaging biomarkers that may aid in PD risk stratification. This should be done in a race-specific context to align with personalized medicine approaches in PD [3], and to advance knowledge about under-represented PD populations, such as the Asian PD population, which is soon to be the largest worldwide [4].
We recently reported a multicenter genome-wide association studies (GWAS) of East-Asian PD (n = 31,575) in which two novel PD risk loci were identified [5]. One of which, the rs9638616 intronic variant, maps to the WBSCR17 gene (also known as GALNT17). WBSCR17/GALNT17 is highly expressed in cerebral and cerebellar brain tissue and is linked to synaptic transmission, neurite development and membrane trafficking [5]. rs9638616 may exert an intronic regulatory effect on WBSCR17/GALNT17, impairing neuronal development [6, 7]. Indeed, WBSCR17/GALNT17 knockout mice exhibit cerebellar pathology and general disruption of neuronal differentiation, axonal pathfinding and synaptic signaling pathways [8].
Such neurodegenerative changes may manifest in brain imaging. Fractional anisotropy (FA) is a sensitive but non-specific measure of white matter tract integrity which has been widely applied. FA is decreased in people with PD [9], including in early disease progression [10–13]. Secondly, connectivity of functional MRI (fMRI) networks has been studied extensively in PD, showing reorganization along the disease course [14], correlation with non-motor symptoms in early PD [14, 15], and relation to PD genetic markers [16–18]. Third, cortical grey matter volume is reduced beginning in the early stages of PD, in particular in those with cognitive impairment [19, 20], and is also related to PD genetic markers [21, 22].
Imaging-genetic studies of PD have analyzed individual candidate genes and single-nucleotide variants (SNVs) in sample sizes in the range of tens to hundreds [16–18, 21–27], finding varied associations to brain structure and function. Indeed, despite brain microstructure and function undergoing a complex regulation, these studies show that multiple different SNVs are individually penetrant for MRI-derived brain phenotypes [16–18, 21–27]. However, no study has evaluated rs9638616, no study has assessed a range of voxelwise measures of tract microstructure, functional connectivity or cortical morphology together in a candidate-SNV approach, and no study has investigated whether brain changes mediate the relationship between genotype and PD-associated symptoms, which could provide causal evidence for a pathophysiological mechanism [28].
If rs9638616 risk variant carriers are more likely to have certain imaging phenotypes than non-carriers, this information could be used for improved stratification and identification of at-risk individuals. This should take into account racial genetic variance. We tested whether the rs9638616 GWAS variant was associated with changes to intrinsic functional brain networks, white matter tract microstructure and brain morphology in an Asian cohort of PD patients and controls. We hypothesized that rs9638616 would correlate with voxelwise brain imaging measures, and that brain phenotypes would mediate the association of rs9638616 to cognitive and motor symptoms.
METHODS
Subjects
The study was approved by the Singapore Health Services Centralised Institutional Review Board, and was performed in accordance with the ethical standards of the 1964 Declaration of Helsinki. All individuals gave written, informed consent.
We recruited patients with early PD and healthy controls for the Parkinson’s Disease Longitudinal Study Singapore (PALS) prospective cohort study between 2014 and 2020. The PD group was recruited within one year of diagnosis and within two years of the first motor symptom onset from two tertiary hospitals. The PD group was diagnosed based on the National Institute of Neurological Disorders and Stroke (NINDS) diagnostic criteria [29]. Individuals were excluded if their diagnosis was subsequently changed, if they met the diagnostic criteria for dementia, if they did not speak English or Mandarin, if they had a history of stroke, active malignancy, end-organ failure or major orthopedic abnormalities, if they had other neurological and psychiatric conditions, or if they did not have complete MRI, clinical and genomic data. PD patients underwent regular follow-up for 5 years, with less-frequent follow-up still ongoing, and were excluded from this analysis if their PD diagnosis was subsequently changed. Healthy controls were recruited from the community and were free of significant neurological, psychiatric and systemic disease. Controls were excluded if they had family history of PD, dementia or other neurological diseases, or if they were diagnosed with any neurological disease during the on-going study follow-up. For this study we included only ethnically Chinese participants. Our study is powered for effects of a similar size as comparable imaging-genetic studies on individual PD risk variants and MRI derived phenotypes (Supplementary Material 1).
We recorded clinical and neuropsychological data, including the Hoehn & Yahr stage (clinical severity scale) [30], the Movement Disorders Society Unified Parkinson’s Disease Rating Scale Part 3 (MDS-UPDRS-III; as a measure of motor impairment) [31], the Mini-Mental State Exam (MMSE) [32] and the Montreal Cognitive Assessment (MoCA) [33] during the same single visit as the MRI.
Genotyping
Genotyping was performed for 759,993 SNVs using Infinium Global Screening Array 24 v2.0 (Illumina, San Diego, CA), as described previously [5]. rs9638616 is located in chromosome 7 at position 70,750,493, with “G” as its major/reference allele and “T” as the minor/effect/risk allele in the Asian population [5].
MRI acquisition
We acquired MRI data on a 3T Siemens Skyra MRI scanner (Siemens, Erlangen, Germany) equipped with a 32-channel head coil and the Syngo MR D13 software version, located at Singapore General Hospital, between September 2014 and present. No changes to the scanner software or hardware were made during the course of the study. Each participant’s MRI data were acquired in a single MRI session. For PD patients undergoing treatment with levodopa, MRI acquisitions were performed during the “OFF” medication state.
A sagittal T1-weighted MPRAGE sequence was acquired with the following parameters: TE = 0.002 s, TR = 1.9 s, TI = 900 ms, FA = 9°, in-plane voxel size = 1×1 mm, slice thickness = 1 mm, matrix = 256×256×256.
Multi-shell DTI was acquired with the following parameters: TE = 0.102 s, TR = 10.118 s, FA = 90°, in-plane voxel size = 1.8×1.8 mm, slice thickness = 2.5 mm, matrix = 112×112×55, anterior-posterior phase encoding, 60 diffusion-weighted volumes (30 at b = 1000 mm/s2 and 30 at 2000 mm/s2) with each shell evenly distributed on the unit sphere and 3 volumes with b = 0 mm/s2.
Resting-state fMRI data were acquired with the following parameters: TE = 0.030 s, TR = 3.0 s, FA = 90°, in-plane voxel size = 2.127×2.127 mm, slice thickness = 3.3 mm, matrix = 94×94×44, interleaved slice acquisition order, 150 volumes, scan time = 7 min 30 s. Subjects were instructed to lie still with their eyes open fixated on a small cross presented in front of them and to breathe normally. Afterward, subjects confirmed that they did not fall asleep.
fMRI processing, independent component analysis, and dual regression
fMRI data were processed using FSL version 6.0. The processing steps were: removal of first two volumes to allow the signal to stabilize, motion correction, removal of non-brain tissues, slice timing correction, spatial smoothing with a 5 mm Gaussian kernel, high pass filtering with a 100-s cut-off, and boundary-based registration to the high-resolution T1-weighted image. Processed images were inspected to confirm registration quality and extent of motion (average slice-to-slice motion upper threshold 0.5 mm). fMRI data were decomposed using MELODIC independent component analysis (ICA) [34] and independent spatial-temporal components representing noise were automatically classified and filtered from the data using the machine-learning based tool, FIX (version 1.06.15; “Standard” training data; retaining 20 components; [35]). Cleaned fMRI data were registered to the MNI152 standard brain [36].
We carried-out a group-level ICA to decompose the cleaned fMRI data into spatial maps and timecourses. Group-level ICA yielded 68 components, of which we excluded 36 components for reflecting less than 1% of total variance, and a further 12 for reflecting a white matter, CSF, pulse or respiratory signal, motion, or unstructured, diffuse appearance, thus retaining 20 components.
Dual regression was performed to map the group-level ICA components back onto individual subjects’ data [37]. First, multivariate spatial regression was performed to estimate subject-specific time-courses for each group-level ICA component. Then, subject-specific spatial maps were estimated using the subject-specific time-courses in a multivariate temporal regression.
A general linear model was used to test for an interaction effect of genotype×group on intrinsic resting functional networks while controlling for age, sex, and white matter hyperintensity burden, and correcting for multiple comparisons across the number of voxels and the number of ICA components (FSL PALM). This would show whether the impact of genotype on intrinsic networks differed between PD and HC groups. Threshold-free cluster enhancement was used to define significant clusters for each component. We excluded clusters comprising fewer than 10 voxels (20 mm3). Using the same approach, we investigated the network changes in relation to genotypes in the combined groups again controlling for age, gender, and white matter hyperintensity burden.
DTI processing and tract-based spatial statistics
DTI data were pre-processed using MRTrix 3.0 with the following steps: denoising, removal of Gibbs ringing artefact, motion and eddy current correction, and bias field correction. The FA data were analyzed using the TBSS (Tract-Based Spatial Statistics) voxelwise approach [38]. In short, the pre-processed FA images were brain-extracted, and aligned to a common space using non-linear registration. The mean FA image was created and thinned to create a mean FA skeleton, representing the tract centers. Individual subject FA data were projected onto the skeleton. FA was chosen as a high-level, sensitive yet nonspecific summary measure, closely correlated to other diffusion metrics, suitable to detect nonspecific diffusion changes in white matter and appropriate for this data-driven exploratory analysis to identify potential areas of interest.
Again, a general linear model was used to test for an interaction effect of genotype×group on tract FA while controlling for age, sex, and white matter hyperintensity burden, and controlling for multiple comparisons across voxels (FSL randomize). Threshold-free cluster enhancement was used to define significant clusters. We investigated the relationship between tract FA and genotype in both groups combined, controlling for the same confounds.
Structural MRI voxel based morphometry
T1-weighted MRI data were analyzed using an optimized voxel-based morphometry (VBM) protocol [39]. In short, images were brain-extracted and segmented to retrieve the grey matter before non-linearly registering them to the MNI 152 standard brain. Then, the images were averaged and flipped along the x-axis to form a symmetrical grey matter template. All individual subject grey matter images were non-linearly registered to the template and then a modulation was applied to correct for local expansion or contraction due to the non-linear part of the spatial transformation. These were smoothed using a 3 mm isotropic Gaussian kernel.
Voxelwise general linear model was applied using the same approach as above to first test the interaction effect of genotype×group on grey matter volume while controlling for age, sex, and white matter hyperintensity burden controlling for multiple comparisons across voxels (FSL randomise), with threshold-free cluster enhancement used to identify significant clusters. We investigated the relationship between grey matter volume and genotype in the combined groups, controlling for the same confounds.
Association with cognitive and motor function
Mediation by brain phenotype on the relationship between genotype and cognitive/motor symptoms was tested using the PROCESS macro (version 4.2) in SPSS. We used a bootstrapping procedure with 5,000 samples and applied MacKinnon’s criteria for mediation [40]. We entered rs9638616 as the independent variable, brain phenotype as mediator and, for the dependent variable, we tested (a) the MDS-UPDRS-III and (b) digit span (as a measure of short term, working verbal memory). The MDS-UPDRS-III and digit span were selected a priori from a wider set of tests available for two reasons: (1) to minimize multiple testing burden and avoid reducing sample size due to missing data, and (2) according to specific rationale based on the imaging-genetic findings from the previous analyses. The MDS-UPDRS-III is specific to motor function, and has been shown to associate with imaging changes in motor pathways in PD across a range of imaging modalities [41–45]. The digit span test is a fast and widely applied test of general memory performance, and is associated with widespread imaging changes including white matter diffusion [46–48]. Both dependent variables were tested for all mediators. Brain phenotypes were selected based on the significant volumes we identified in our voxelwise analysis as follows: a threshold for p≤0.05 was applied to the p-value map to generate a mask; this mask was used to isolate the “significant” voxels from (a) the FA images and (b) the network shape/amplitude map for the relevant ICA component; the extracted mean from within each mask was treated as the mediator in the mediation analysis.
RESULTS
Sample characteristics
We included data from 116 early PD patients and 57 healthy controls (Table 1). The groups did not differ on key demographic variables. Overall, the PD group represented mild, bilateral, early-stage disease. The sample was of Chinese ethnic background and included no immediate relatives. All PD patients were undergoing treatment with either levodopa (68.4%) or non-levodopa medications (69.6%). The LEDD for the levodopa-medicated part of the PD group was 267.8±138.5 mg. The non-levodopa medications included dopamine agonists (35.2%), muscle relaxants (33.4%) and beta-blockers (0.9%). rs9638616 carriers and non-carriers did not significantly differ in age, sex, disease duration, MMSE, MoCA, MDS-UPDRS-III, digit span, H&Y stage, or the 3- and 5-year change in MDS-UPDRS-III and H&Y stage (Supplementary Table 2).
Table 1
Subject demographics and key variables in the analysis. Data are reported as mean (standard deviation) and the group differences were tested by two-tailed independent samples t-tests, except where indicated by footnotes
| Parkinson’s disease (n = 116) | Healthy control (n = 57) | Combined (n = 173) | PD-control group difference, p | |
| Age, | 66.8 (9.0) | 68.7 (7.4) | 67.5 (8.7) | 0.201 |
| Sex, % femalea | 45 (39%) | 31 (54%) | 76 (44%) | 0.073 |
| Disease duration, years between diagnosis and MRI | 1.25 (0.71) | – | – | – |
| Age of first motor symptom onset, y | 61.21 (9.01) | – | – | – |
| MMSE | 28.10 (1.62) | 28.60 (1.14) | 28.17 (1.56) | 0.511 |
| MoCA | 26.37 (2.50) | 28.18 (1.17) | 26.85 (2.35) | 0.027 |
| MDS-UPDRS-IIIb | 18 (14–25) | 2 (0–3) | 14 (3–22) | <0.001 |
| H&Y stagea | 0 = 0 (0%) | – | – | – |
| 1 = 24 (21%) | ||||
| 2 = 91 (78%) | ||||
| 3 = 1 (1%) | ||||
| Digit span | 6.84 (1.44) | 7.00 (1.25) | 6.90 (1.38) | 0.468 |
| rs9638616, % T allelea | 31 (27%) | 19 (33%) | 50 (29%) | 0.378 |
| LEDD, mgc | 267.77 (138.50) | – | – | – |
MDS-UPDRS-III, Movement Disorders Society Unified Parkinson’s Disease Rating Scale Part 3 (Motor); H&Y, Hoehn and Yahr; LEDD, Levodopa equivalent daily dose; MMSE, Mini-Mental State Exam; MoCA, Montreal Cognitive Assessment. aFrequency (percent), group difference with Chi-square test. bMedian (inter-quartile range), group difference with Mann-Whitney U test. cFor only the levodopa-medicated part of the PD group.
Table 2
Significant clusters in the voxelwise analyses of rs9638616 for white matter tract microstructure and resting-state fMRI networks
| Clusters | Volume (mm3) | Peak t | Peak p | Peak MNI152 Coordinate (x, y, z) |
| FA –rs9638616 (WBSCR17/GALNT17) | ||||
| Widespread WM tracts | 65,898 | –1.75 | 0.042 | 0, 0, 14 |
| Occipital lobe rsfMRI network –rs9638616 (WBSCR17/GALNT17) | ||||
| Right SMA | 50 | –5.05 | 0.001 | 10, –8, 46 |
MNI152, Montreal Neurological Institute 152-average brain; SMA, supplementary motor area.
Voxelwise imaging-genetic associations
We detected no rs9638616×group interaction effects for grey matter volume, white matter tract microstructure or intrinsic brain network functional connectivity, suggesting no group-specific imaging-genetic associations. We also detected no significant differences when comparing PD and control groups (Supplementary Material 2). Thus, for the main analyses, we proceeded using the combined PD and control dataset.
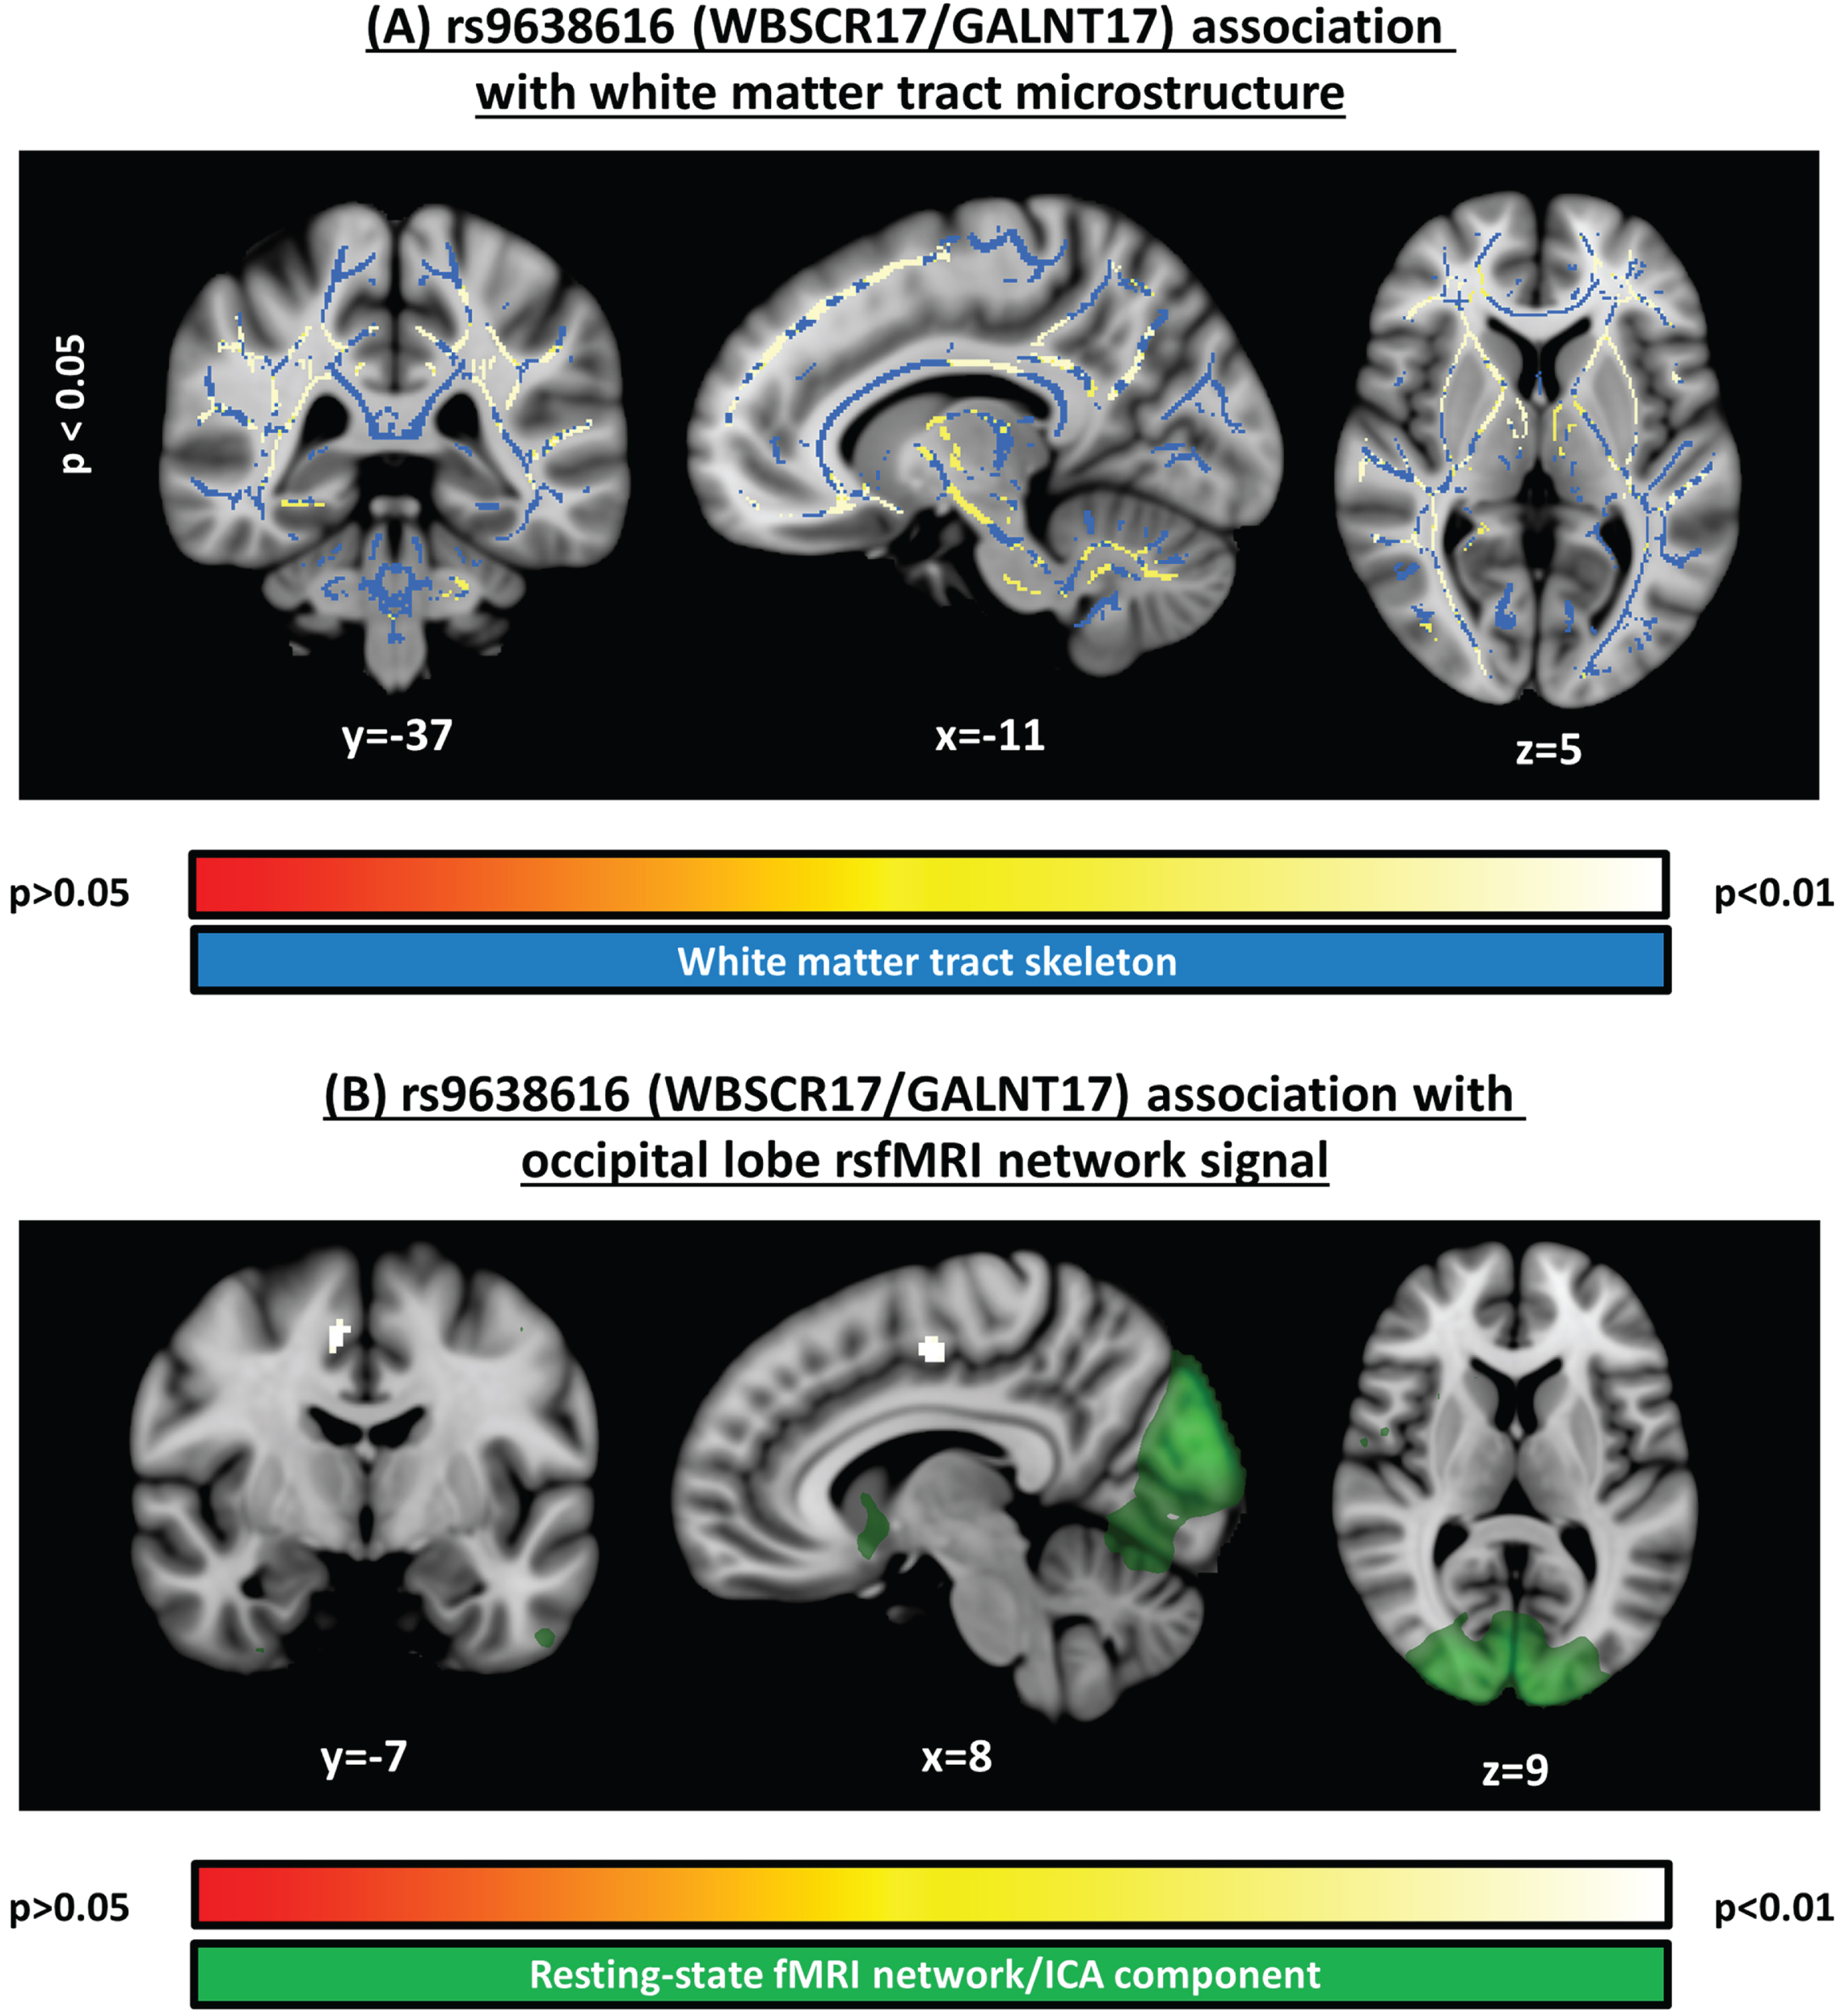
In our analysis of white matter tract microstructure, we detected significant negative association between FA and rs9638616 (i.e., increased risk associated with lower FA) in a widespread pattern distributed across the entire brain, comprising a single large but relatively small-effect contiguous cluster (peak t = –1.75; peak p = 0.042; Table 2; Fig. 1A). The significant cluster included tracts in the cerebellum, midbrain, internal/external capsules, and deep white matter in all lobes, and all were present bilaterally.
Fig. 1
Significant clusters identified in voxelwise analyses. A) Structural MRI voxelwise analysis of white matter microstructure (fractional anisotropy), testing the association to rs9638616, corrected for multiple comparisons across voxels. B) Resting-state functional MRI voxelwise analysis, testing the association to rs9638616, corrected for multiple comparisons across voxels and independent components. Position of each slice is given in MNI152 coordinates. All images are shown with the radiological right-left convention.
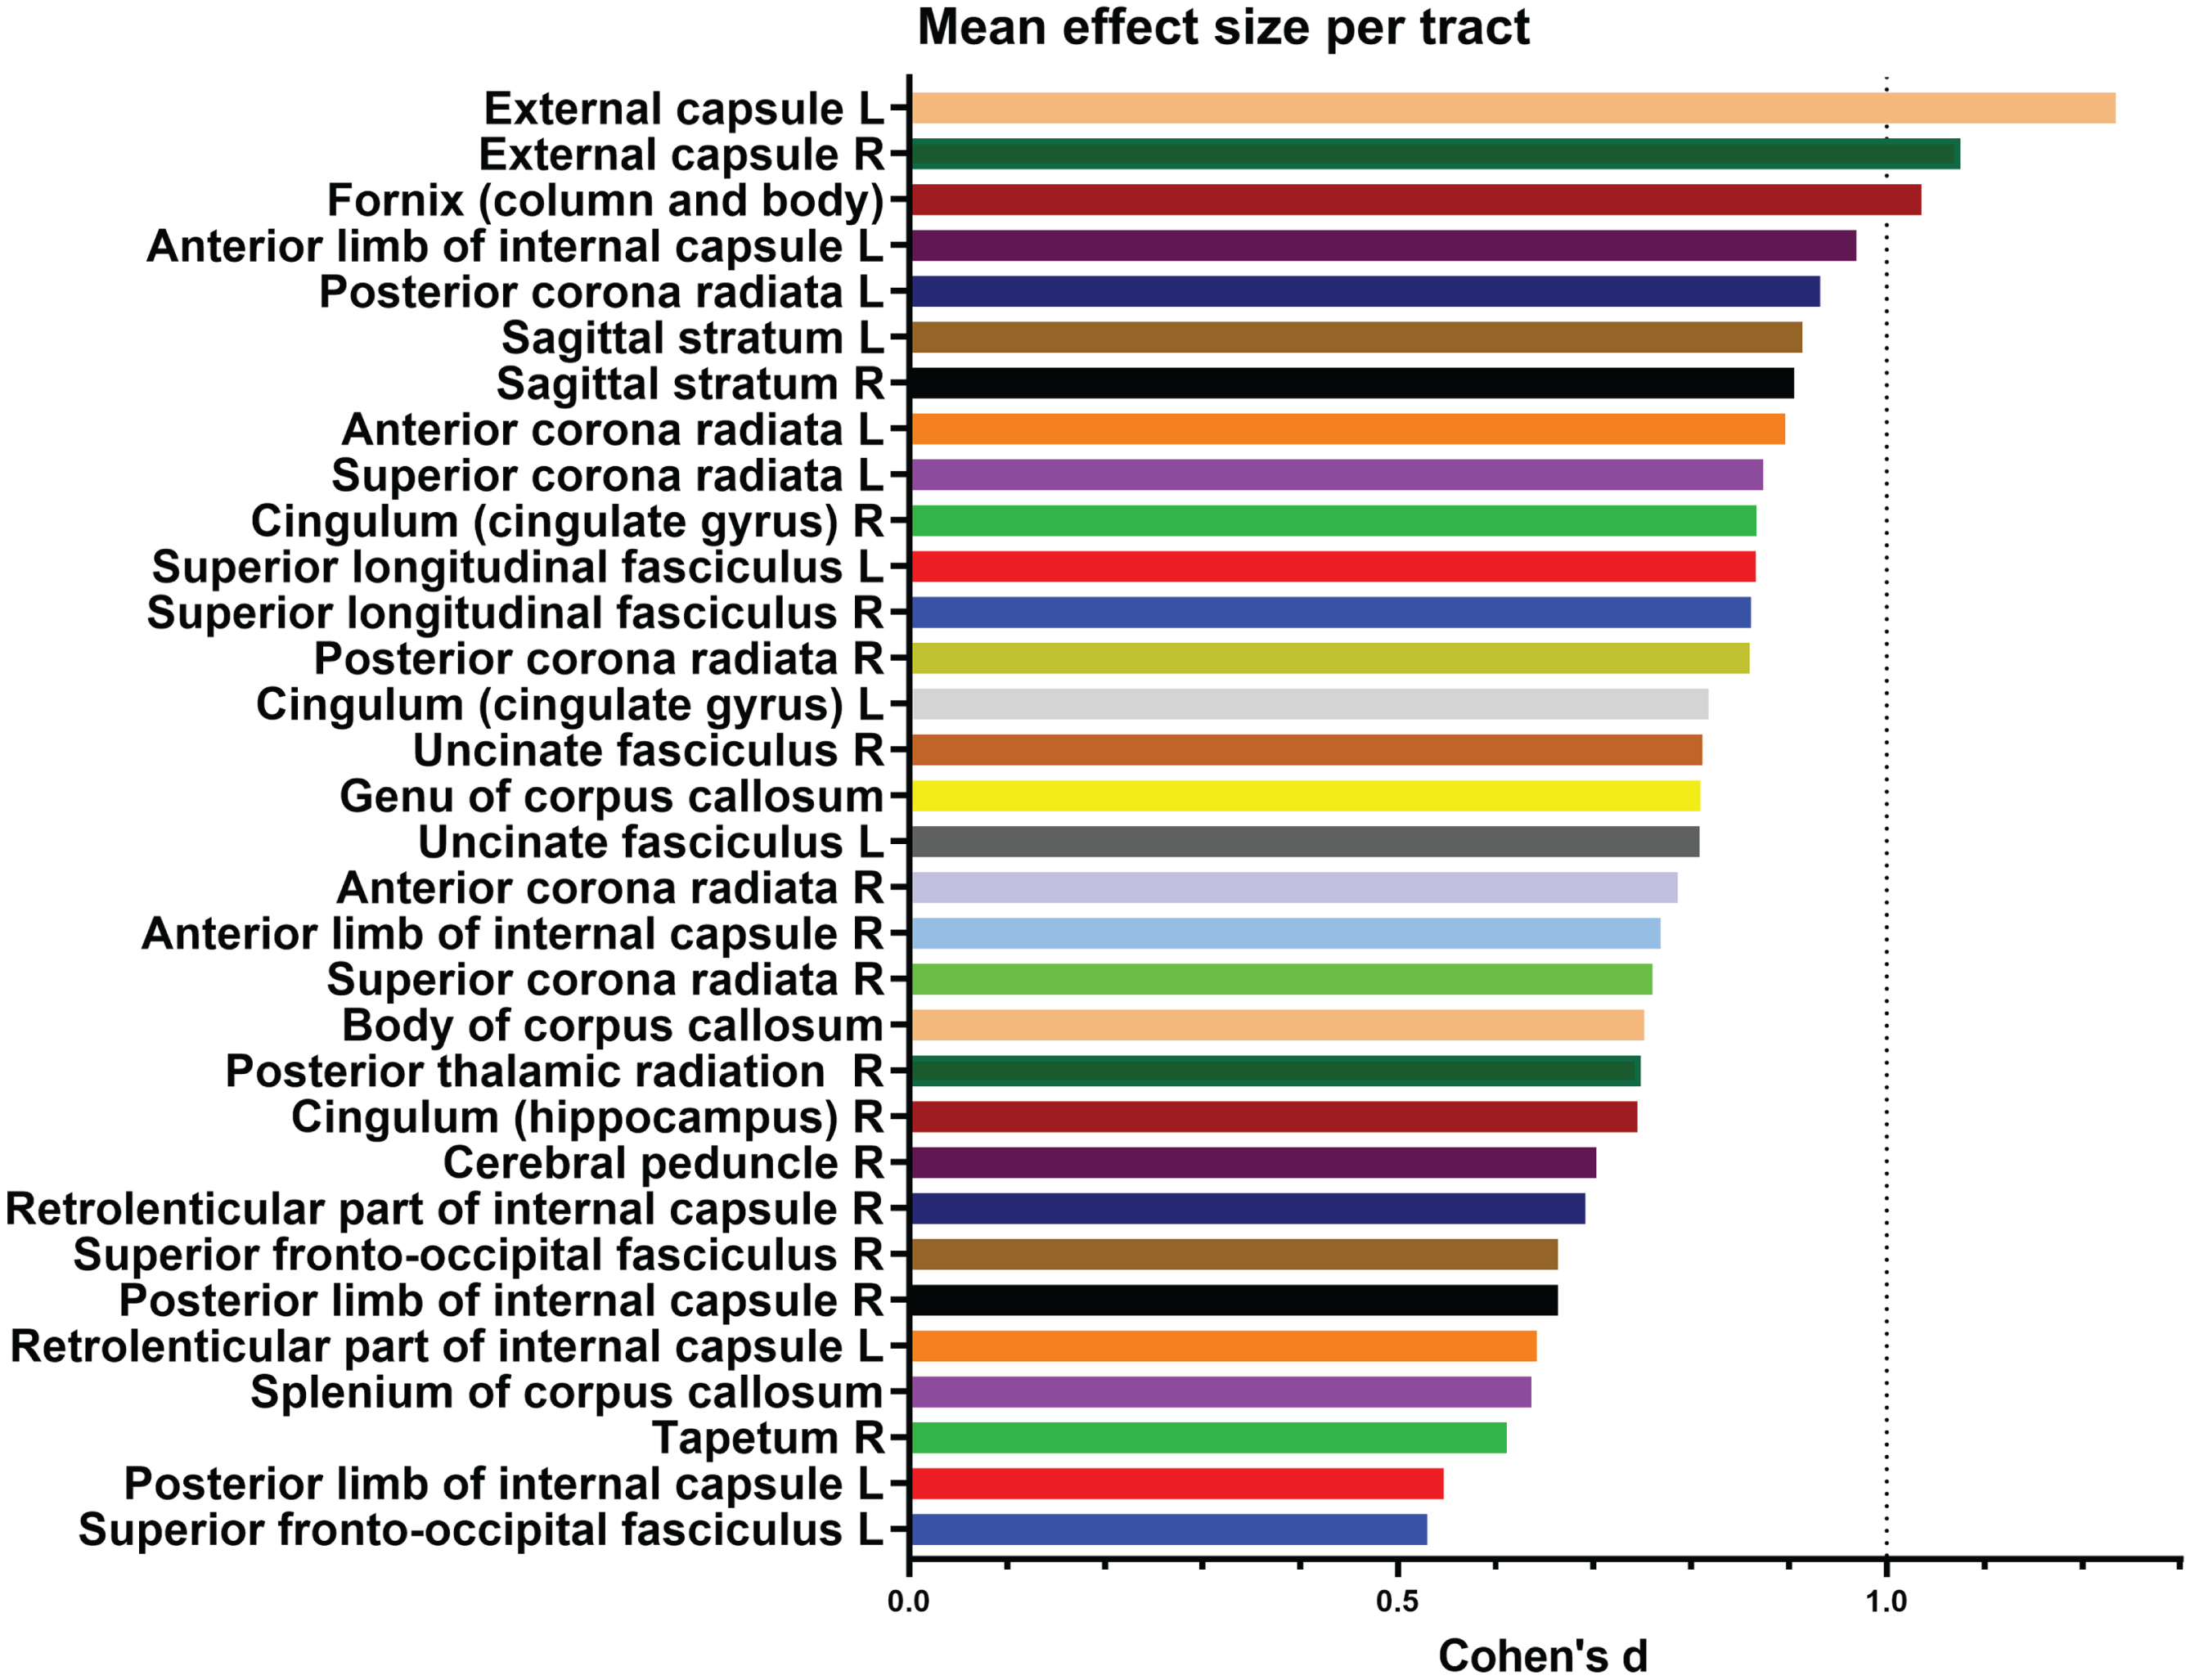
To better characterize the association of rs9638616 to FA within this large cluster, we performed post-hoc extraction of absolute effect sizes within each of 48 tracts from the JHU ICBM-DTI-81 white matter labels [49] (Fig. 2). The largest effects were found for the left and right external capsules (Cohen’s d = 1.23 and d = 1.08, respectively), followed by fornix (d = 1.04), and anterior limb of left internal capsule (d = 0.97), although the effects were not strongly focused.
Fig. 2
Breakdown of effect sizes (Cohen’s d) for each tract in the significant cluster representing association to white matter fractional anisotropy. Tracts not shown had no data, i.e., did not overlap with the significant cluster.
In our analysis of resting-state networks, we found significant association between rs9638616 and functional connectivity (Table 2). This was found for the resting-state network belonging to the occipital lobe (Fig. 1B). Specifically, rs9638616 was associated with decreased connectivity of a single cluster in the right supplementary motor area (SMA) with the resting-state network comprising the whole occipital lobe (peak t = –5.05; peak p = 0.001).
We detected no significant associations of rs9638616 with grey matter volume.
Brain phenotype mediates the relationship between rs9638616 and PD symptoms
First, the individual associations shown in Fig. 3 between the mediator and outcome can be interpreted independently of the genotype or mediation effect, to show the imaging-clinical association. The FA in the identified WM clusters was significantly positively associated with digit span forward (β= 0.33, p = 0.002), suggesting that higher FA (indicating in-tact WM) related to longer digits spans (indicating better working memory performance). The functional connectivity of the SMA in the occipital network was marginally non-significantly associated with the MDS-UPDRS-III (β= –0.29, p = 0.056), in a negative association where reduced functional connectivity (poorer synchronicity of the SMA with the rest of the network) related to higher MDS-UPDRS-III scores (indicating more severe motor impairments).
Fig. 3
Results of the mediation analysis showing significant mediation of rs9638616 on clinical outcomes by brain phenotypes. All β coefficients are standardized. SMA, supplementary motor area; MDS-UPDRS-III, Movement Disorders Society Unified PD Rating Scale Motor Part III; WM, white matter.
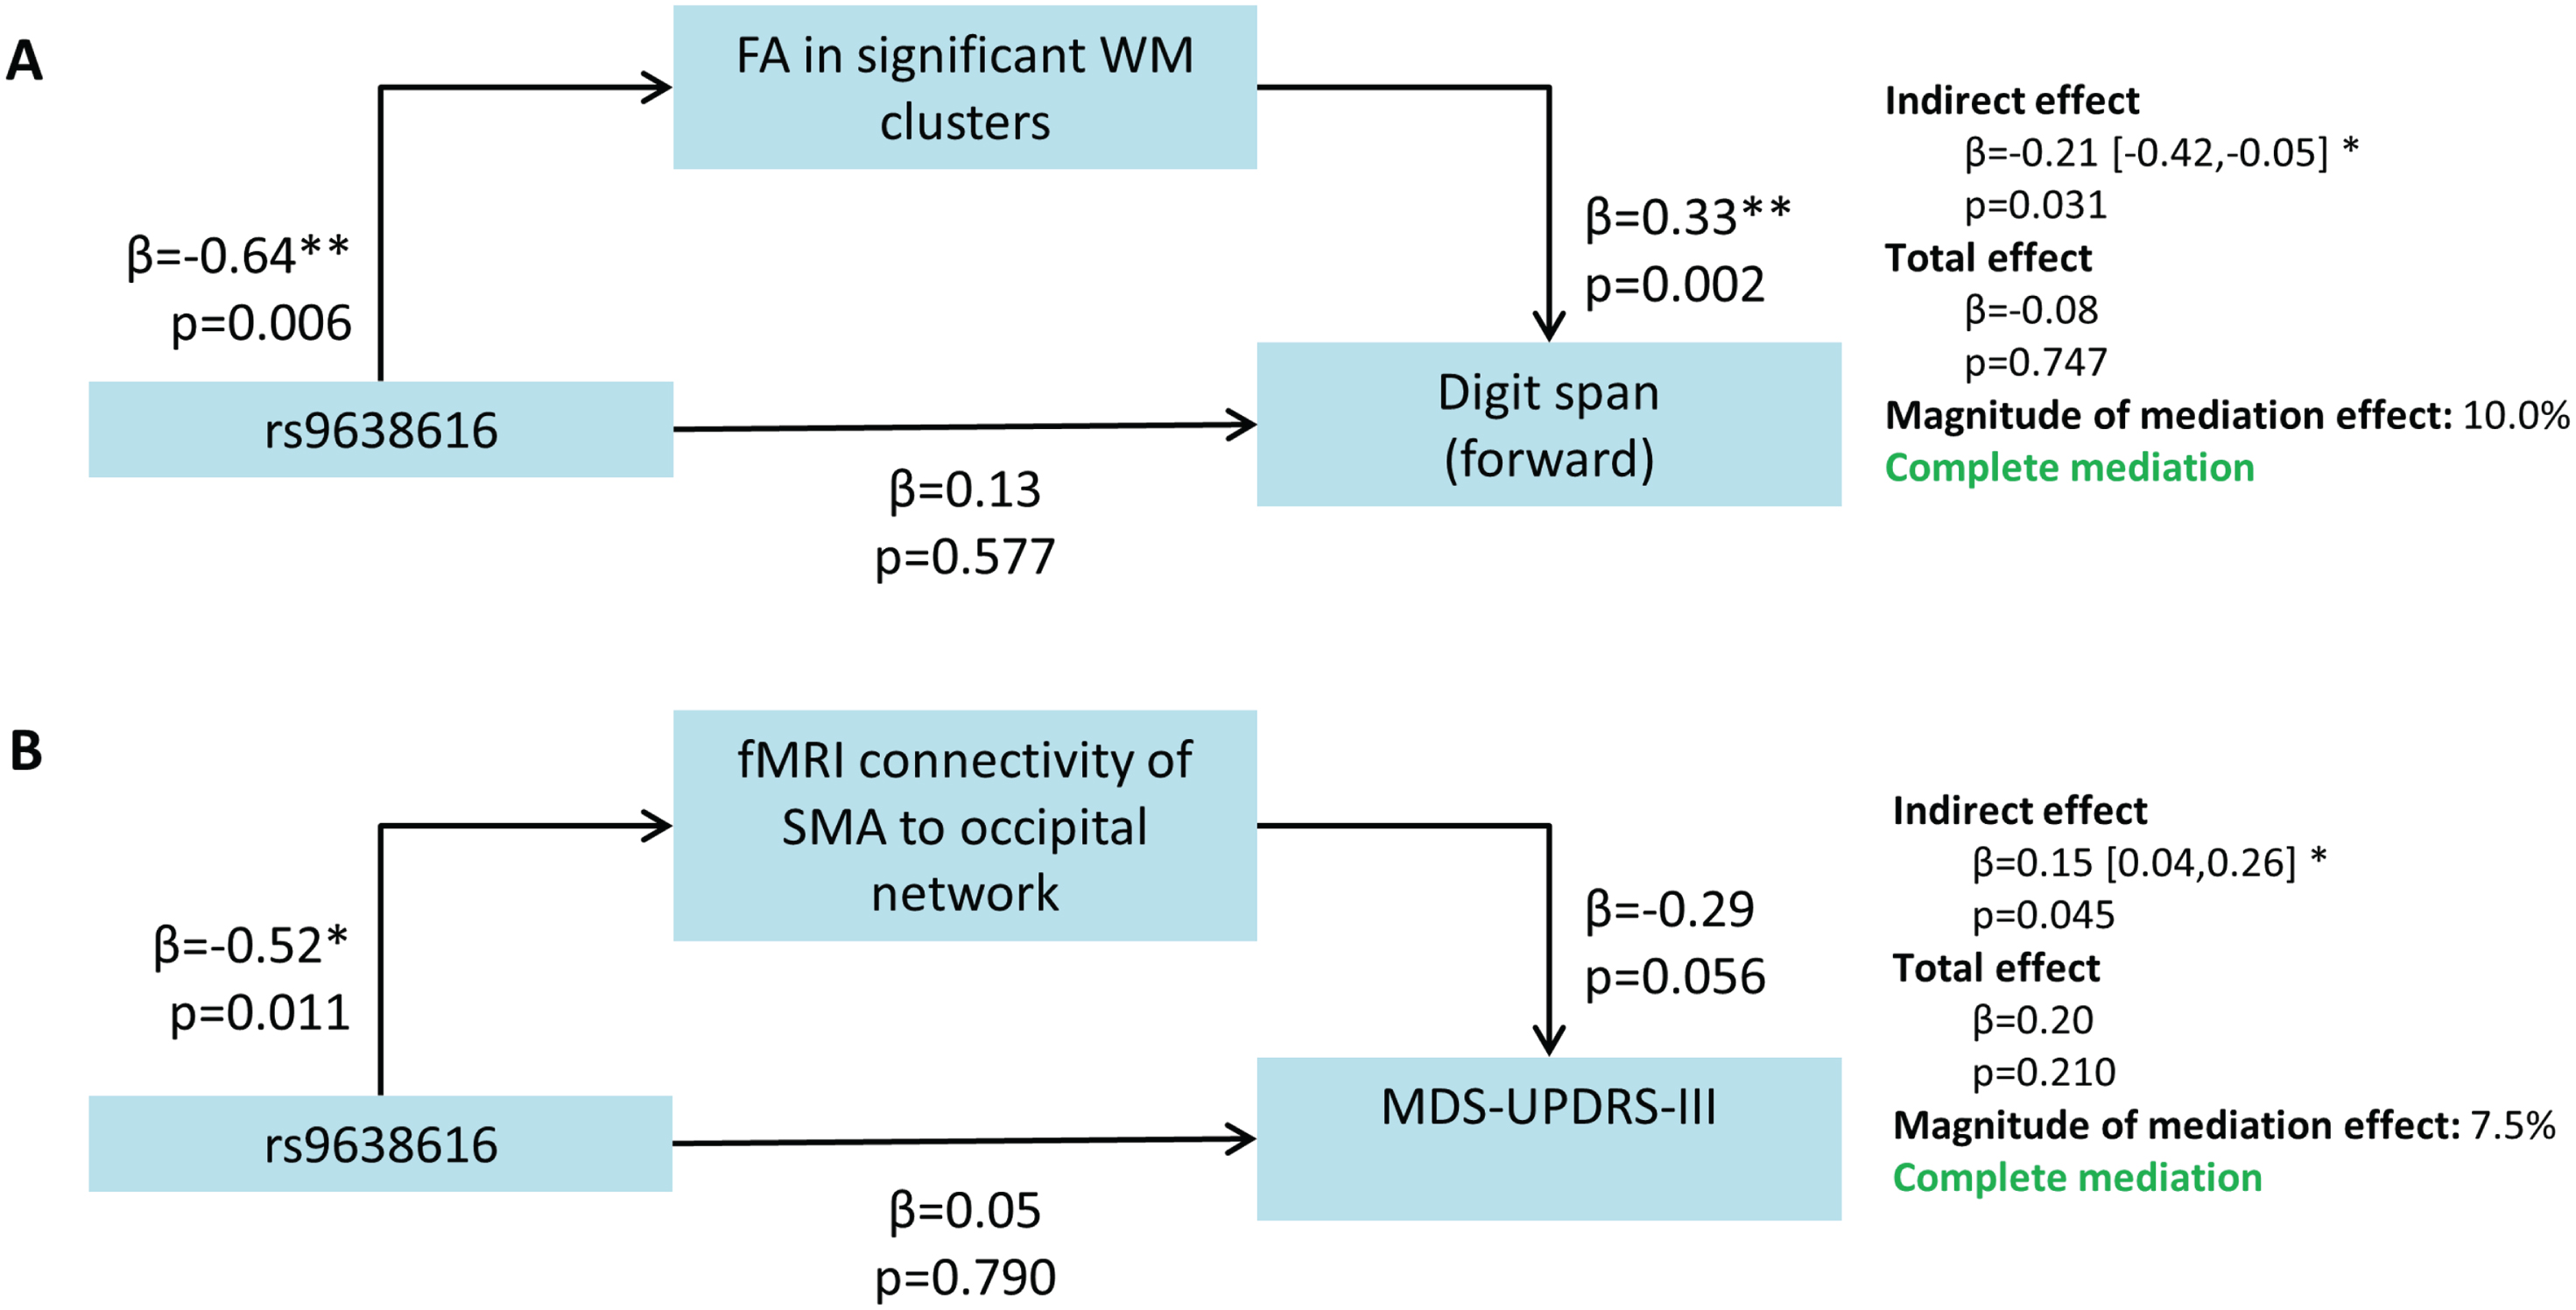
The effect of rs9638616 genotype on digit span was mediated by the FA in the significant white matter clusters from our voxelwise tract WM analysis (Fig. 3A). The direct effect of genotype on digit span was non-significant (β= 0.13, p = 0.577). The indirect effect, determined by a bootstrapping procedure using 5,000 samples, was significant (β= –0.21, 95% CI = [–0.42,–0.05], p = 0.031).
Finally, the effect of rs9638616 genotype on MDS-UPDRS-III was mediated by the functional connectivity of the SMA with the occipital resting-state network (Fig. 3B). The direct effect of genotype on MDS-UPDRS-III was non-significant (β= 0.05, p = 0.790). The indirect effect was significant (β= 0.15, 95% CI = [0.04,0.26], p = 0.045).
Mediation analyses of MDS-UPDRS-III for white matter FA and digit span for SMA connectivity were non-significant for an indirect effect.
DISCUSSION
Characterizing the effects of PD genetic risk on the brain is a current research priority [2]. We focused on Asian PD, analyzing association of the synaptic transmission-related PD GWAS SNV, rs9638616, to brain phenotypes in our Asian cohort of early PD patients and controls. We identified brain phenotypes significantly associated with rs9638616 in the combined PD and control group, including widespread reduced white matter FA and reduced connectivity of the SMA. These phenotypes mediated the relationship of rs9638616 to cognitive and motor functioning (digit span and MDS-UPRDS-III). While these results were not PD-specific, they may provide a clue to the pathophysiologic mechanism linking this variant to PD risk in a previous GWAS [5]. Relating Asian PD genetic risk to brain imaging phenotypes could, in future, help to stratify patients or to identify individuals at-risk in an underrepresented population. Practical clinical benefit of these findings could be achieved in future, in combination with further imaging-genetic studies linking PD risk variants to putative pathophysiologic mechanisms, by forming more advanced risk models and by improving our understanding of disease mechanisms to yield new treatment targets.
First, we identified significant imaging-genetic associations between rs9638616 and two types of voxelwise brain imaging measure. Specifically, rs9638616 was associated with a widespread pattern of lower white matter tract FA as well as reduced functional connectivity of the SMA. Both reduced white matter FA [50] and reduced connectivity of the SMA [14] have previously been noted in studies of PD. The distribution of white matter changes appears to be concordant with data showing brain-wide expression of WBSCR17/GALNT17 (GTEx v8), rather than preferential expression in PD-associated regions such as the dopaminergic pathway. Functional connectivity changes may be secondary to white matter diffusion changes [51]. The detected functional connectivity changes were specific to the SMA, despite evidence of widespread white matter microstructure changes, which suggests that such fMRI changes may be masked by greater noise and that our analysis may be underpowered to detect such effects.
These imaging-genetic associations were present when combining PD and control groups, and did not differ between groups, as shown by the non-significant interaction effect for each of our three voxelwise analyses. Instead of lessening the importance of our results, this suggests that our observed significant findings may reflect susceptibility, rather than subclinical PD pathological processes. Previous imaging-genetic studies have also found associations between PD risk variants and brain phenotypes in the general European population (i.e., not in PD) [52, 53], and suggested that such imaging-genetic effects might be related to PD susceptibility. In support of the relevance of these findings to PD, we note that this variant has only been identified in PD GWAS (and no other GWASs), that we found significant mediation of the MDS-UPDRS-III, a PD-specific clinical scale, and that our identified imaging phenotypes are in agreement with previous PD studies. Nonetheless, we acknowledge that our results are not PD-specific and, as such, performed our follow-up analyses in the combined group of PD and control participants. Given this approach, it is possible that our imaging-genetic associations could also be relevant for other neurological diseases.
rs9638616 was not directly associated with working memory or motor function in our data; however, when mediated by the significant brain imaging measures we had identified, rs9638616 was significantly— but indirectly— associated with these outcomes. This may support a causal chain hypothesis in which neurodevelopmental effects of rs9638616 confer downstream cognitive and/or motor deficits. Association of tract FA and other diffusivity changes with digit span [47, 54], and SMA activation and connectivity with PD and MDS-UPDRS-III [55, 56] score have previously been reported. The “intermediate phenotype” concept is frequently applied in psychiatric disorders, where the use of measures of brain morphology and function as intermediate phenotypes has enhanced studies of complex polygenic disease susceptibility [57, 58]. In PD, this concept has been applied in a single instance to identify genes and brain imaging phenotypes related to depression [27]. Our significant mediation finding highlights mediation analysis as a potentially important yet unexplored approach for prioritizing future PD GWAS results [59]. MDS-UPDRS-III and digit span were selected for this analysis based on their association in the literature to our observed voxelwise imaging phenotypes [41–48, 54–56].
rs9638616 increases PD risk in Asian [5], but not European, populations [60]. As such, our findings may be specific to the Asian population, which recapitulates the need to account for ethnic variance in studies of genetic risk. Indeed, in Europeans, no associations of rs9638616 with white matter tract FA are present, and associations with fMRI connectivity changes are located solely in the frontal lobe (brain imaging phenome-wide association analysis of the UK Biobank; Supplementary Figure 1; n = 33,224; https://open.win.ox.ac.uk/ukbiobank/big40/pheweb33k/variant/7:70750493-G-T) [61]. This may indicate that the functional impact of rs9638616 differs between these two populations, corroborating the Asian-specificity of our imaging correlates for rs9638616. Nevertheless, further studies are needed in underrepresented PD populations to achieve better equity in healthcare provision, and a better understanding of the genetic basis for the disease.
Our study was limited in several ways. Our analysis was underpowered for the association of rs9638616 and PD diagnosis because brain function and structure are regulated by multiple complex processes. This may be reflected in our non-significant interaction effects. On the other hand, the association of rs9638616 and brain imaging measures has not previously been investigated, and studies of similar or smaller sample sizes have shown significant associations for SNVs with brain phenotype [16–18, 21–27]. Based on comparable imaging genetic studies of individual risk variants and PD brain phenotypes, our study is sufficiently powered for similar-sized effects (Supplementary Material 1). Secondly, a wider range of disease durations and severities in our sample may have provided greater power to detect significant effects. While idiopathic PD has a heritable genetic component, it is estimated at only 22%, with the remainder being attributable to environmental and epigenetic factors [1], which we could not fully account for. Another limitation is the study population. While rs9638616 was identified as an Asian PD risk variant in a large sample (n > 31,000), rs9638616 had a higher frequency in controls than PD patients in our data. However, our comparatively smaller sample is less representative of the Asian PD population than that of the GWAS study, and we have not made statistical inferences based on the frequency of the SNV. Our study was not powered for, and does not attempt to test the comparative SNV frequencies between PD and control groups.
The novel GWAS variant, rs9638616, which is biologically linked to synaptic transmission, was associated in our data with altered brain characteristics which can be detected through imaging, including reduction of white matter FA and changes to functional connectivity of motor areas. This may be caused by a regulatory effect of rs9638616 on WBSCR17/GALNT17, which affects neuronal differentiation, axonal pathfinding, and synaptic signaling. These effects were present only when PD and healthy individuals were combined, and were associated with reduced cognitive and motor functioning, supporting their clinical relevance. These results may provide pathophysiologic clues linking the rs9638616 variant to PD risk and, with further imaging-genetic studies, might be used in future to improve PD stratification or identification of at-risk individuals.
ACKNOWLEDGMENTS
This study was supported by the Singapore Ministry of Health’s National Medical Research Council (NMRC) under its Open Fund Large Collaborative Grant (MOH-OFLCG18May-0002). TW acknowledges the support of the Singapore National Medical Research Council (OFYIRG20nov-0032, CNIG23jan-0008). We would like to thank all participants and their families for their support of the PALS study, and also neurologists from the National Neuroscience Institute, Singapore for referring their patients for the study.
FUNDING
This study was supported by the Singapore Ministry of Health’s National Medical Research Council under its Open Fund Large Collaborative Grant (MOH-OFLCG18May-0002; PI: LCST).
CONFLICT OF INTEREST
Eng-King Tan is an Editorial Board Member of this journal, but was not involved in the peer-review process nor had access to any information regarding its peer-review. The other authors have no conflicts of interest to declare.
DATA AVAILABILITY
The datasets used and/or analyzed during the current study available from the corresponding author on reasonable request.
SUPPLEMENTARY MATERIAL
[1] The supplementary material is available in the electronic version of this article: https://dx.doi.org/10.3233/JPD-230455.
REFERENCES
[1] | Nalls MA , Blauwendraat C , Vallerga CL , Heilbron K , Bandres-Ciga S , Chang D , Tan M , Kia DA , Noyce AJ , Xue A , Bras J , Young E , von Coelln R , Simón-Sánchez J , Schulte C , Sharma M , Krohn L , Pihlstrøm L , Siitonen A , Iwaki H , Leonard H , Faghri F , Gibbs JR , Hernandez DG , Scholz SW , Botia JA , Martinez M , Corvol J-C , Lesage S , Jankovic J , Shulman LM , Sutherland M , Tienari P , Majamaa K , Toft M , Andreassen OA , Bangale T , Brice A , Yang J , Gan-Or Z , Gasser T , Heutink P , Shulman JM , Wood NW , Hinds DA , Hardy JA , Morris HR , Gratten J , Visscher PM , Graham RR , Singleton AB ((2019) ) Identification of novel risk loci, causal insights, and heritable risk for Parkinson’s disease: A meta-analysis of genome-wide association studies. Lancet Neurol 18: , 1091–1102. |
[2] | Blauwendraat C , Nalls MA , Singleton AB ((2020) ) The genetic architecture of Parkinson’s disease. Lancet Neurol 19: , 170–178. |
[3] | Mestre TA , Fereshtehnejad S-M , Berg D , Bohnen NI , Dujardin K , Erro R , Espay AJ , Halliday G , Van Hilten JJ , Hu MT ((2021) ) Parkinson’s disease subtypes: Critical appraisal and recommendations. J Parkinsons Dis 11: , 395. |
[4] | Li G , Ma J , Cui S , He Y , Xiao Q , Liu J , Chen S ((2019) ) Parkinson’s disease in China: A forty-year growing track of bedside work. Transl Neurodegener 8: , 22. |
[5] | Foo JN , Chew EGY , Chung SJ , Peng R , Blauwendraat C , Nalls MA , Mok KY , Satake W , Toda T , Chao Y , Tan LCS , Tandiono M , Lian MM , Ng EY , Prakash K-M , Au W-L , Meah W-Y , Mok SQ , Annuar AA , Chan AYY , Chen L , Chen Y , Jeon BS , Jiang L , Lim JL , Lin J-J , Liu C , Mao C , Mok V , Pei Z , Shang H-F , Shi C-H , Song K , Tan AH , Wu Y-R , Xu Y-M , Xu R , Yan Y , Yang J , Zhang B , Koh W-P , Lim S-Y , Khor CC , Liu J , Tan E-K ((2020) ) Identification of risk loci for Parkinson disease in Asians and comparison of risk between Asians and Europeans: A genome-wide association study. JAMA Neurol 77: , 746–754. |
[6] | Nakayama Y , Nakamura N , Oki S , Wakabayashi M , Ishihama Y , Miyake A , Itoh N , Kurosaka A ((2012) ) A putative polypeptide N-acetylgalactosaminyltransferase/Williams-Beuren syndrome chromosome region 17 (WBSCR17) regulates lamellipodium formation and macropinocytosis. J Biol Chem 287: , 32222–32235. |
[7] | vonHoldt BM , Ji SS , Aardema ML , Stahler DR , Udell MAR , Sinsheimer JS ((2018) ) Activity of genes with functions in human Williams-Beuren Syndrome is impacted by mobile element insertions in the Gray Wolf Genome. Genome Biol Evol 10: , 1546–1553. |
[8] | Chen C-Y , Seward CH , Song Y , Inamdar M , Leddy AM , Zhang H , Yoo J , Kao W-C , Pawlowski H , Stubbs LJ ((2022) ) Galnt17 loss-of-function leads to developmental delay and abnormal coordination, activity, and social interactions with cerebellar vermis pathology. Dev Biol 490: , 155–171. |
[9] | Zhang Y , Burock MA ((2020) ) Diffusion tensor imaging in Parkinson’s disease and parkinsonian syndrome: A systematic review. Front Neurol 11: , 531993. |
[10] | Ibarretxe-Bilbao N , Junque C , Marti M-J , Valldeoriola F , Vendrell P , Bargallo N , Zarei M , Tolosa E ((2010) ) Olfactory impairment in Parkinson’s disease and white matter abnormalities in central olfactory areas: A voxel-based diffusion tensor imaging study. Mov Disord 25: , 1888–1894. |
[11] | Kotian RP , Koteshwar P (2022) Evidence of fractional anisotropy in Parkinson–s disease. In Diffusion Tensor Imaging and Fractional Anisotropy: Imaging Biomarkers in Early Parkinson–s Disease, Kotian RP, Koteshwar P, eds. Springer Nature Singapore, Singapore, pp. 113-130. |
[12] | Guimarães RP , Campos BM , de Rezende TJ , Piovesana L , Azevedo PC , Amato-Filho AC , Cendes F , D’Abreu A ((2018) ) Is diffusion tensor imaging a good biomarker for early Parkinson’s disease? Front Neurol 9: , 626. |
[13] | Wei X , Yan R , Chen Z , Weng R , Liu X , Gao H , Xu X , Kang Z , Liu Z , Guo Y , Liu Z , Larsen JP , Wang J , Tang B , Hallett M , Wang Q ((2016) ) Combined diffusion tensor imaging and arterial spin labeling as markers of early Parkinson’s disease. Sci Rep 6: , 33762. |
[14] | Tessitore A , Cirillo M , De Micco R ((2019) ) Functional connectivity signatures of Parkinson’s disease. J Parkinsons Dis 9: , 637–652. |
[15] | Tessitore A , Esposito F , Vitale C , Santangelo G , Amboni M , Russo A , Corbo D , Cirillo G , Barone P , Tedeschi G ((2012) ) Default-mode network connectivity in cognitively unimpaired patients with Parkinson disease. Neurology 79: , 2226–2232. |
[16] | Burciu RG , Seidler RD , Shukla P , Nalls MA , Singleton AB , Okun MS , Vaillancourt DE ((2018) ) Multimodal neuroimaging and behavioral assessment of α-synuclein polymorphism rs356219 in older adults. Neurobiol Aging 66: , 32–39. |
[17] | Zhang K , Tang Y , Meng L , Zhu L , Zhou X , Zhao Y , Yan X , Tang B , Guo J ((2019) ) The effects of SNCA rs894278 on resting-state brain activity in Parkinson’s disease. Front Neurosci 13: , 47. |
[18] | Bi X , Hu X , Xie Y , Wu H ((2021) ) A novel CERNNE approach for predicting Parkinson’s Disease-associated genes and brain regions based on multimodal imaging genetics data. Med Image Anal 67: , 101830. |
[19] | Filippi M , Sarasso E , Piramide N , Stojkovic T , Stankovic I , Basaia S , Fontana A , Tomic A , Markovic V , Stefanova E , Kostic VS , Agosta F ((2020) ) Progressive brain atrophy and clinical evolution in Parkinson’s disease. Neuroimage Clin 28: , 102374. |
[20] | Mak E , Su L , Williams GB , Firbank MJ , Lawson RA , Yarnall AJ , Duncan GW , Owen AM , Khoo TK , Brooks DJ , Rowe JB , Barker RA , Burn DJ , O’Brien JT ((2015) ) Baseline and longitudinal grey matter changes in newly diagnosed Parkinson’s disease: ICICLE-PD study. Brain 138: , 2974–2986. |
[21] | Ghatti S , Yoon E , Lopez G , Ehrlich D , Horovitz SG ((2022) ) Imaging and genetics in Parkinson’s disease: Assessment of the GBA1 mutation. J Neurol 269: , 5347–5355. |
[22] | Gu L , Dai S , Zhou C , Gao T , Wu J , Fang Y , Guan X , Guo T , Zheng R , Jin C , Xu X , Song Z , Tian J , Yin X , Zhang M , Zhang B , Yan Y , Pu J ((2021) ) The effect of the PARK16 rs11240572 variant on brain structure in Parkinson’s disease. Brain Struct Funct 226: , 2665–2673. |
[23] | Kim M , Kim J , Lee S-H , Park H ((2017) ) Imaging genetics approach to Parkinson’s disease and its correlation with clinical score. Sci Rep 7: , 46700. |
[24] | Cerri G , Tognon M , Altmann A , Giugno R (2021) Mining genetic, transcriptomic and imaging data in Parkinson’s disease. In 2021 IEEE 9th International Conference on Healthcare Informatics (ICHI), pp. 556-557. |
[25] | Cerri G , Tognon M , Avesani S , Oxtoby NP , Altmann A , Giugno R (2021) Multi view based imaging genetics analysis on Parkinson disease. bioRxiv, doi: https://doi.org/10.1101/2021.08.19.456943 [Preprint]. Posted August 19, 2021. |
[26] | Kim M , Won JH , Hong J , Kwon J , Park H , Shen L (2020) Deep network-based feature selection for imaging genetics: Application to identifying biomarkers for Parkinson–s disease. In 2020 IEEE 17th International Symposium on Biomedical Imaging (ISBI), pp. 1920-1923. |
[27] | Won JH , Kim M , Park B , Youn J , Park H ((2019) ) Effectiveness of imaging genetics analysis to explain degree of depression in Parkinson’s disease. PLoS One 14: , e0211699. |
[28] | Lutz S , Hokanson J ((2015) ) Mediation analysis in genome-wide association studies: Current perspectives. Open Access Bioinformatics 7: , 1–5. |
[29] | Gelb DJ , Oliver E , Gilman S ((1999) ) Diagnostic criteria for Parkinson disease. Arch Neurol 56: , 33–39. |
[30] | Hoehn MM , Yahr MD ((1967) ) Parkinsonism: Onset, progression and mortality. Neurology 17: , 427–442. |
[31] | Goetz CG , Tilley BC , Shaftman SR , Stebbins GT , Fahn S , Martinez-Martin P , Poewe W , Sampaio C , Stern MB , Dodel R , Dubois B , Holloway R , Jankovic J , Kulisevsky J , Lang AE , Lees A , Leurgans S , LeWitt PA , Nyenhuis D , Olanow CW , Rascol O , Schrag A , Teresi JA , van Hilten JJ , LaPelle N ((2008) ) Movement Disorder Society-sponsored revision of the Unified Parkinson’s Disease Rating Scale (MDS-UPDRS): Scale presentation and clinimetric testing results. Mov Disord 23: , 2129–2170. |
[32] | Arevalo-Rodriguez I , Smailagic N , Roqué Figuls IM , Ciapponi A , Sanchez-Perez E , Giannakou A , Pedraza OL , Bonfill Cosp nbi X. , Cullum S ((2015) ) Mini-Mental State Examination (MMSE) for the detection of Alzheimer’s disease and other dementias in people with mild cognitive impairment (MCI). Cochrane Database Syst Rev 2015: , CD010783. |
[33] | Nasreddine ZS , Phillips NA , Bédirian V , Charbonneau S , Whitehead V , Collin I , Cummings JL , Chertkow H ((2005) ) The Montreal Cognitive Assessment, MoCA: A brief screening tool for mild cognitive impairment. J Am Geriatr Soc 53: , 695–699. |
[34] | Beckmann CF , Smith SM ((2004) ) Probabilistic independent component analysis for functional magnetic resonance imaging. IEEE Trans Med Imaging 23: , 137–152. |
[35] | Salimi-Khorshidi G , Douaud G , Beckmann CF , Glasser MF , Griffanti L , Smith SM ((2014) ) Automatic denoising of functional MRI data: Combining independent component analysis and hierarchical fusion of classifiers. Neuroimage 90: , 449–468. |
[36] | Grabner G , Janke AL , Budge MM , Smith D , Pruessner J , Collins DL ((2006) ) Symmetric atlasing and model based segmentation: An application to the hippocampus in older adults. Med image Comput Comput Interv 9: , 58–66. |
[37] | Beckmann CF , Mackay CE , Filippini N , Smith SM ((2009) ) Group comparison of resting-state FMRI data using multi-subject ICA and dual regression.S. Neuroimage 47: , 148. |
[38] | Smith SM , Jenkinson M , Johansen-Berg H , Rueckert D , Nichols TE , Mackay CE , Watkins KE , Ciccarelli O , Cader MZ , Matthews PM , Behrens TEJ ((2006) ) Tract-based spatial statistics: Voxelwise analysis of multi-subject diffusion data. Neuroimage 31: , 1487–1505. |
[39] | Good CD , Johnsrude IS , Ashburner J , Henson RN , Friston KJ , Frackowiak RS ((2001) ) A voxel-based morphometric study of ageing in 465 normal adult human brains. Neuroimage 14: , 21–36. |
[40] | MacKinnon DP , Fairchild AJ , Fritz MS ((2006) ) Mediation analysis. Annu Rev Psychol 58: , 593–614. |
[41] | Li X , Xiong Y , Liu S , Zhou R , Hu Z , Tong Y , He L , Niu Z , Ma Y , Guo H ((2019) ) Predicting the post-therapy severity level (UPDRS-III) of patients with Parkinson’s disease after drug therapy by using the dynamic connectivity efficiency of fMRI. Front Neurol 10: , 668. |
[42] | Palmer W , Cholerton B , Zabetian C , Montine T , Grabowski T , Rane S ((2021) ) Resting-state cerebello-cortical dysfunction in Parkinson’s disease. Front Neurol 11: , 594213. |
[43] | Li M , Liu Y , Chen H , Hu G , Yu S , Ruan X , Luo Z , Wei X , Xie Y ((2019) ) Altered global synchronizations in patients with Parkinson’s disease: A resting-state fMRI study. Front Aging Neurosci 11: , 139. |
[44] | Lenfeldt N , Hansson W , Larsson A , Nyberg L , Birgander R , Forsgren L ((2013) ) Diffusion tensor imaging and correlations to Parkinson rating scales. J Neurol 260: , 2823–2830. |
[45] | Li X , Xing Y , Martin-Bastida A , Piccini P , Auer DP ((2018) ) Patterns of grey matter loss associated with motor subscores in early Parkinson’s disease. Neuroimage Clin 17: , 498–504. |
[46] | Krogsrud S , Mowinckel A , Sederevicius D , Vidal-Piñeiro D , Amlien I , Wang Y , Sørensen Ø , Walhovd K , Fjell A ((2021) ) Relationships between apparent cortical thickness and working memory across the lifespan - Effects of genetics and socioeconomic status. Dev Cogn Neurosci 51: , 100997. |
[47] | Chung S , Fieremans E , Kucukboyaci NE , Wang X , Morton CJ , Novikov DS , Rath JF , Lui YW ((2018) ) Working memory and brain tissue microstructure: White matter tract integrity based on multi-shell diffusion MRI. Sci Rep 8: , 3175. |
[48] | Li R , Qin W , Zhang Y , Jiang T , Yu C ((2012) ) The neuronal correlates of digits backward are revealed by voxel-based morphometry and resting-state functional connectivity analyses. PLoS One 7: , e31877. |
[49] | Hua K , Zhang J , Wakana S , Jiang H , Li X , Reich DS , Calabresi PA , Pekar JJ , van Zijl PCM , Mori S ((2008) ) Tract probability maps in stereotaxic spaces: Analyses of white matter anatomy and tract-specific quantification. Neuroimage 39: , 336–347. |
[50] | Wei X , Luo C , Li Q , Hu N , Xiao Y , Liu N , Lui S , Gong Q ((2020) ) White matter abnormalities in patients with Parkinson’s disease: A meta-analysis of diffusion tensor imaging using tract-based spatial statistics. Front Aging Neurosci 12: , 610962. |
[51] | Honey CJ , Sporns O , Cammoun L , Gigandet X , Thiran JP , Meuli R , Hagmann P ((2009) ) Predicting human resting-state functional connectivity from structural connectivity. Proc Natl Acad Sci U S A 106: , 2035–2040. |
[52] | Waters S , Kim J , Watson C , Jacobs B , Foote I , Dey S , Blauwendraat C , Noyce A , Marshall C ((2021) ) Neuroanatomical signatures of genetic risk for Parkinson’s Disease in healthy adults [abstract]. Mov Disord 36: (Suppl 1), 882. |
[53] | Abbasi N , Tremblay C , Rajimehr R , Yu E , Markello RD , Shafiei G , Khatibi N , study TE-P , Jahanshad N , Thompson PM , Gan-Or Z , Misic B , Dagher A (2022) Neuroanatomical correlates of polygenic risk for Parkinson–s Disease. medRxiv, doi: https://doi.org/10.1101/2022. |
[54] | Krogsrud SK , Fjell AM , Tamnes CK , Grydeland H , Due-Tønnessen P , Bjørnerud A , Sampaio-Baptista C , Andersson J , Johansen-Berg H , Walhovd KB ((2018) ) Development of white matter microstructure in relation to verbal and visuospatial working memory-A longitudinal study. PLoS One 13: , e0195540. |
[55] | Rahimpour S , Rajkumar S , Hallett M ((2022) ) The supplementary motor complex in Parkinson’s disease. J Mov Disord 15: , 21–32. |
[56] | Bhat P , Kumaran SS , Goyal V , Srivastava AK , Behari M ((2023) ) Effect of rTMS at SMA on task-based connectivity in PD. Behav Brain Res 452: , 114602. |
[57] | Preston GA , Weinberger DR ((2005) ) Intermediate phenotypes in schizophrenia: A selective review. Dialogues Clin Neurosci 7: , 165–179. |
[58] | Rasetti R , Weinberger DR ((2011) ) Intermediate phenotypes in psychiatric disorders. Curr Opin Genet Dev 21: , 340–348. |
[59] | Zeng P , Shao Z , Zhou X ((2021) ) Statistical methods for mediation analysis in the era of high-throughput genomics: Current successes and future challenges. Comput Struct Biotechnol J 19: , 3209–3224. |
[60] | Grover S , Kumar-Sreelatha AA , Bobbili DR , May P , Domenighetti C , Sugier P-E , Schulte C , Elbaz A , Krüger R , Gasser T , Sharma M ((2021) ) Replication of a novel Parkinson’s locus in a European Ancestry Population. Mov Disord 36: , 1689–1695. |
[61] | Smith SM , Douaud G , Chen W , Hanayik T , Alfaro-Almagro F , Sharp K , Elliott LT ((2021) ) An expanded set of genome-wide association studies of brain imaging phenotypes in UK Biobank. Nat Neurosci 24: , 737–745. |


