
Association of Misfolded α-Synuclein Derived from Neuronal Exosomes in Blood with Parkinson’s Disease Diagnosis and Duration
Abstract
Background:
Misfolded α-synuclein can be detected in blood samples of Parkinson’s disease (PD) patients by a seed amplification assay (SAA), but the association with disease duration is not clear, yet.
Objective:
In the present study we aimed to elucidate whether seeding activity of misfolded α-synuclein derived from neuronal exosomes in blood is associated with PD diagnosis and disease duration.
Methods:
Cross-sectional samples of PD patients were analyzed and compared to samples of age- and gender-matched healthy controls using a blood-based SAA. Presence of α-synuclein seeding activity and differences in seeding parameters, including fluorescence response (in arbitrary units) at the end of the amplification assay (F60) were analyzed. Additionally, available PD samples collected longitudinally over 5–9 years were included.
Results:
In the cross-sectional dataset, 79 of 80 PD patients (mean age 69 years, SD = 8; 56% male) and none of the healthy controls (n = 20, mean age 70 years, SD = 10; 55% male) showed seeding activity (sensitivity 98.8%). When comparing subgroups divided by disease duration, longer disease duration was associated with lower α-synuclein seeding activity (F60: p < 0.001). In the longitudinal analysis 10/11 patients showed a gradual decrease of α-synuclein seeding activity over time.
Conclusions:
This study confirms the high sensitivity of the blood-based α-synuclein SAA applied here. The negative association of α-synuclein seeding activity in blood with disease duration makes this parameter potentially interesting as biomarker for future studies on the pathophysiology of disease progression in PD, and for biologically oriented trials in this field.
INTRODUCTION
The possibility to detect misfolded α-synuclein (α-syn) in different tissues and body fluids is currently revolutionizing the diagnosis of Parkinson’s disease (PD) and it is hoped that a more secure and much earlier diagnosis will soon be possible. In this context one of the most promising advances is the use of α-syn seed amplification assays (SAA), utilizing the seeding activity of pathological α-syn conformers to introduce aggregation of recombinant α-syn [1]. Protein misfolding cyclic amplification and real-time quaking induced conversion (RT-QuIC) assays have been intensively investigated to detect pathological α-syn conformers in the skin, olfactory mucosa, saliva or cerebrospinal fluid (CSF) as a potential diagnostic and prognostic biomarker [2–26]. CSF studies, in particular, yielded high sensitivity and specificity in individuals with PD and REM sleep behavior disorder compared to healthy controls [2–10, 16–22].
We recently demonstrated that a SAA for the detection of pathological α-syn in neuronal-derived extracellular vesicles (NEs) purified from blood, distinguishes PD patients from healthy controls with high sensitivity [27]. However, so far it remains unclear, whether and if so how α-syn seeding activity changes in the natural course of the disease, although this aspect is of particular interest considering the upcoming disease-modifying therapies targeting α-syn. This study was thus set out to 1) confirm the previously reported high sensitivity of this blood-based SAA in a larger cohort of individuals with PD and 2) additionally explore changes of α-synuclein seeding in blood in the course of PD.
MATERIALS AND METHODS
Participants and biobanking
Between 2008 and 2022 individuals with PD visiting the outpatient clinic or ward of the Department for Neurodegeneration at the University Hospital Tuebingen were asked to contribute to research by providing clinical data and biosamples. Those who agreed gave their written informed consent, underwent a clinical assessment, and donated blood samples. Spouses and volunteers without neurodegenerative diseases served as controls.
For the cross-sectional analysis individuals diagnosed with PD were selected from the Tuebinger Biobank. Inclusion criteria for the PD cohort were (i) PD diagnosis based on the United Kingdom Brain Bank Criteria before 2015 and on the Movement Disorder Society clinical diagnostic criteria for Parkinson’s disease [28] after 2015, (ii) no diagnosis of dementia, and (iii) sufficient blood sample material to perform the SAA. Additionally, the PD cohort was selected based on disease duration (years after first motor symptom manifestation) and divided into four age- and gender-matched groups: disease duration of (I) 1 to 4 years, (II) 5 to 9 years, (III) 10 to 14 years, (IV) 15-24 years. For the longitudinal analyses, all available longitudinal samples drawn at three different time points during a period of 5-9 years after first motor symptom manifestation were used. Inclusion criteria for the control cohort were: (i) no known central nervous system disease, (ii) no diagnosis of dementia, and (iii) sufficient blood sample material to perform the SAA. The control cohort was selected to be age and gender matched to the PD cohort.
The current analysis comprises basic demographic and clinical data, collected in a standardized way within a regular clinical visit: age at diagnosis, levodopa equivalent daily dosage (LEDD), and cognitive function assessed by Montreal Cognitive Assessment (MoCA) and/or Mini Mental Status Examination (MMSE) [29, 30]. If only a MMSE assessment had been performed, MMSE scores were converted to MoCA scores [31]. The clinical examination was performed by an experienced physicians and included an assessment of motor function using the Unified Parkinson’s Disease rating scale part III (UPDRS-III [32]) or since 2011 the revised Movement Disorder Society (MDS)-UPDRS-III [33]. For comparison UPDRS-III values were converted to MDS-UPDRS III values [34].
Standard protocol approvals, registrations, and patient consents
Biobanking and data analysis were conducted in accordance with the Declaration of Helsinki and approved by the local ethical committee (University of Tuebingen). All participants gave their written informed consent.
Amplification of pathological neuron-derived α-synuclein
The isolation protocol of NEs and the detailed SAA protocol is described in Kluge et al. [27]. Briefly, the following steps were performed to isolate NEs and amplify pathological α-syn.
1) Isolation of NEs: As described in our previous protocol, plasma samples and the corresponding EV precipitation reagent (Thermo Fisher, #4484450) were used. After an incubation of 10 min at room temperature Plasma tubes were centrifuged at 2,500 x g for 10 min at 22°C (Eppendorf Centrifuge, 5417 R). Supernatants were transferred to low binding tubes (Sarstedt, #72.706.600) and subsequently centrifuged (2,000 x g, 20 min, 22°C) to remove cells and debris. Supernatants were again transferred to new low binding tubes and centrifugated at 10,000 x g for 20 min (22°C). Phosphate–buffered saline (PBS) was added in equal parts to clarified plasma aliquots (500μL). 150μL of the EV precipitation reagent (Thermo fisher, #4478360) was added to each sample (500μL plasma + 500μL PBS). Afterwards, samples were incubated for 10 min at room temperature, before a next centrifugation step (10,000 x g, 5 min, 22°C). EV–containing pellets were resuspended in 300μL PBS and incubated at 4°C rotation overnight with 2μg anti-neuronal cell adhesion molecule L1 (NCAM-L1) antibody (Santa Cruz, #sc-514360). For each sample 30μL beads (Protein A/G PLUS–Agarose, Santa Cruz, #sc-2003, lot nr. J0920) were blocked in 2% bovine serum albumin (BSA) and incubated at 4°C rotation overnight. Blocked beads were then washed three times using 500μL mild lysis buffer (40 mM HEPES, 7.4 pH, 120 mM NaCl, 1 mM EDTA, 0.3% CHAPS, 10% glycerol). Afterwards 30μL mild lysis buffer/sample were added to the beads before 30μL of these beads were added to each EV-resuspension for 4 h at 4°C with rotation. After centrifugation (1,000 x g, 5 min, 4°C) pellets were washed three times using 500μL mild lysis buffer. After the last centrifugation step pellets were resuspended in Triton buffer (1% Triton-X100, 10% glycerol, 150 mM NaCl, 25 mM HEPES at pH 7.4, 1 mM EDTA, 1.5 mM MgCl2) containing 1% protease inhibitor cocktail (cOmplete Protease Inhibitor Cocktail, Roche, #11836145001), 50 mM NaF, 2 mM NaVO4 and 1 mM PMSF. Subsequently, samples were incubated for 30 min on ice before ultracentrifugation was followed (100,000 x g, 30 min, 4°C (Beckman OptimaTM TLX Ultracentrifuge, Instrument-Typ CO-TLX 120)). Supernatants were used for seed amplification assay. Protein concentrations were measured by BCA (Pierce, #23227).
2) Amplification of α-syn: for the α-syn SAA 10μg total protein of NEs were incubated with 500 ng of recombinant monomeric α-syn in a total volume of 100μl PBS in a non-binding dark 96-well plate (Thermo Fisher Scientific, #437111, 96 well black plate, non-treated surfaces, non-sterile). Differences to our previous publication included: 1) use of commercially available recombinant monomeric α-syn (rPeptide, #S-1001-2), 2) utilization of monomeric α-syn in a higher concentration (500 ng vs. 100 ng) to avoid six rounds of SAA. These optimized conditions were validated in several re-analyses before, in which we could show that markedly increased ThT signals can be achieved in only one seeding round with a concentration of 500 ng compared to the previously needed 6 rounds with 100 ng (Supplementary Figure 1). First, the plates were covered with silicon lids (Thermo Fisher Scientific, #AB0566), incubated at 37°C and agitated at 1,000 rpm using a plate shaker. 1μL Thioflavin T (ThT) was added before each measurement point, while the plates were shaken continuously. For all samples and experiments the same amount of ThT was used and the same number of measurement timepoints were collected (ThT starting concentration after first measurement 0.01 mM, ending concentration after last measurement 0.02 mM). ThT fluorescence was monitored over time at an excitation of 410 nm and emission of 475 nm using a microplate reader (Infinite® 200 PRO, Tecan), measurements were stopped when ThT fluorescence signals plateaued. Recombined prepared α-syn fibrils (10μL of 0.68 ng/μL) and the presence of 500 ng monomeric α-syn were used as positive controls. As negative controls 500 ng monomeric α–syn and pre-formed fibrils (10μL of 0.68 ng/μL; without monomeric α-syn) were measured separately. Moreover, the effect of pre-formed fibrils on control blood samples can be seen in Supplementary Figure 2. For all samples the α-syn-SAA was performed in duplicates and mean values of both rounds were calculated. The threshold defining a positive seeding was calculated as the average of ThT signal raw values of the first 10 h of recording of all control samples plus 5 standard deviations. The area under the curve (AUC), the peak of the fluorescence response (Fmax), the ThT value measured at the end of SAA (F60), the time to reach 50% of Fmax (T50) and the lag phase (time required to reach the threshold) were determined on a linear interpolated data using the ThT values per patient as inputs. Analyses were performed with custom scripts using a Python 3.10.11 environment. The key Python packages used numpy v1.24.3 for numerical computations, pandas v2.0.2 for data manipulation and analysis, and scipy v1.10.1 for scientific computations. Values of α-syn seeding are displayed in arbitrary units (AU) and hours (h). Isolation of NEs and the SAAs were performed blinded to all demographic and clinical data.
Fig. 1
α-Synuclein seeding in Parkinson’s disease cohorts (n = 79). A) α-Synuclein seeding in Parkinson’s disease cohorts with different disease duration (n = 79). The boxplots indicate the median (range) Thioflavin T signal intensity after 60 hours (in arbitrary units) of the four different Parkinson’s disease duration groups. B) Scatter diagram showing the correlation of α-synuclein seeding (Thioflavin T signal intensity after 60 hours) and disease duration in all analyzed individuals with Parkinson’s disease (n = 79). F60, Thioflavin T signal intensity after 60 hours; PD, Parkinson’s disease.
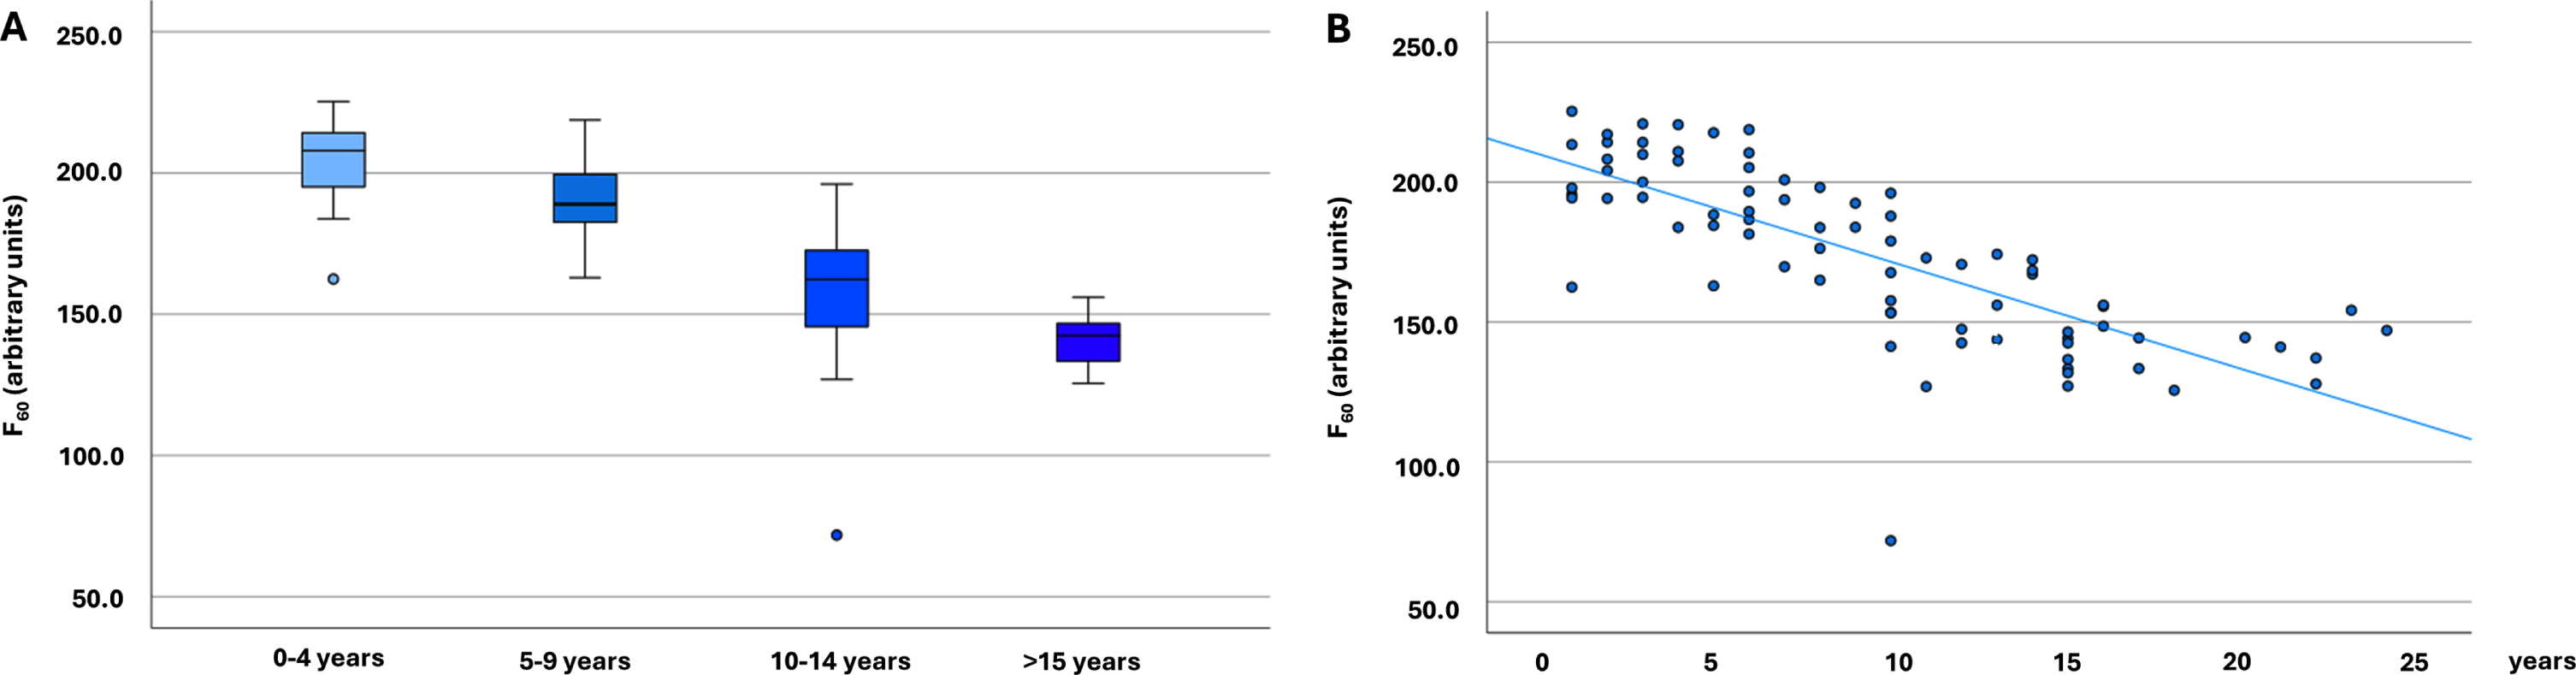
Fig. 2
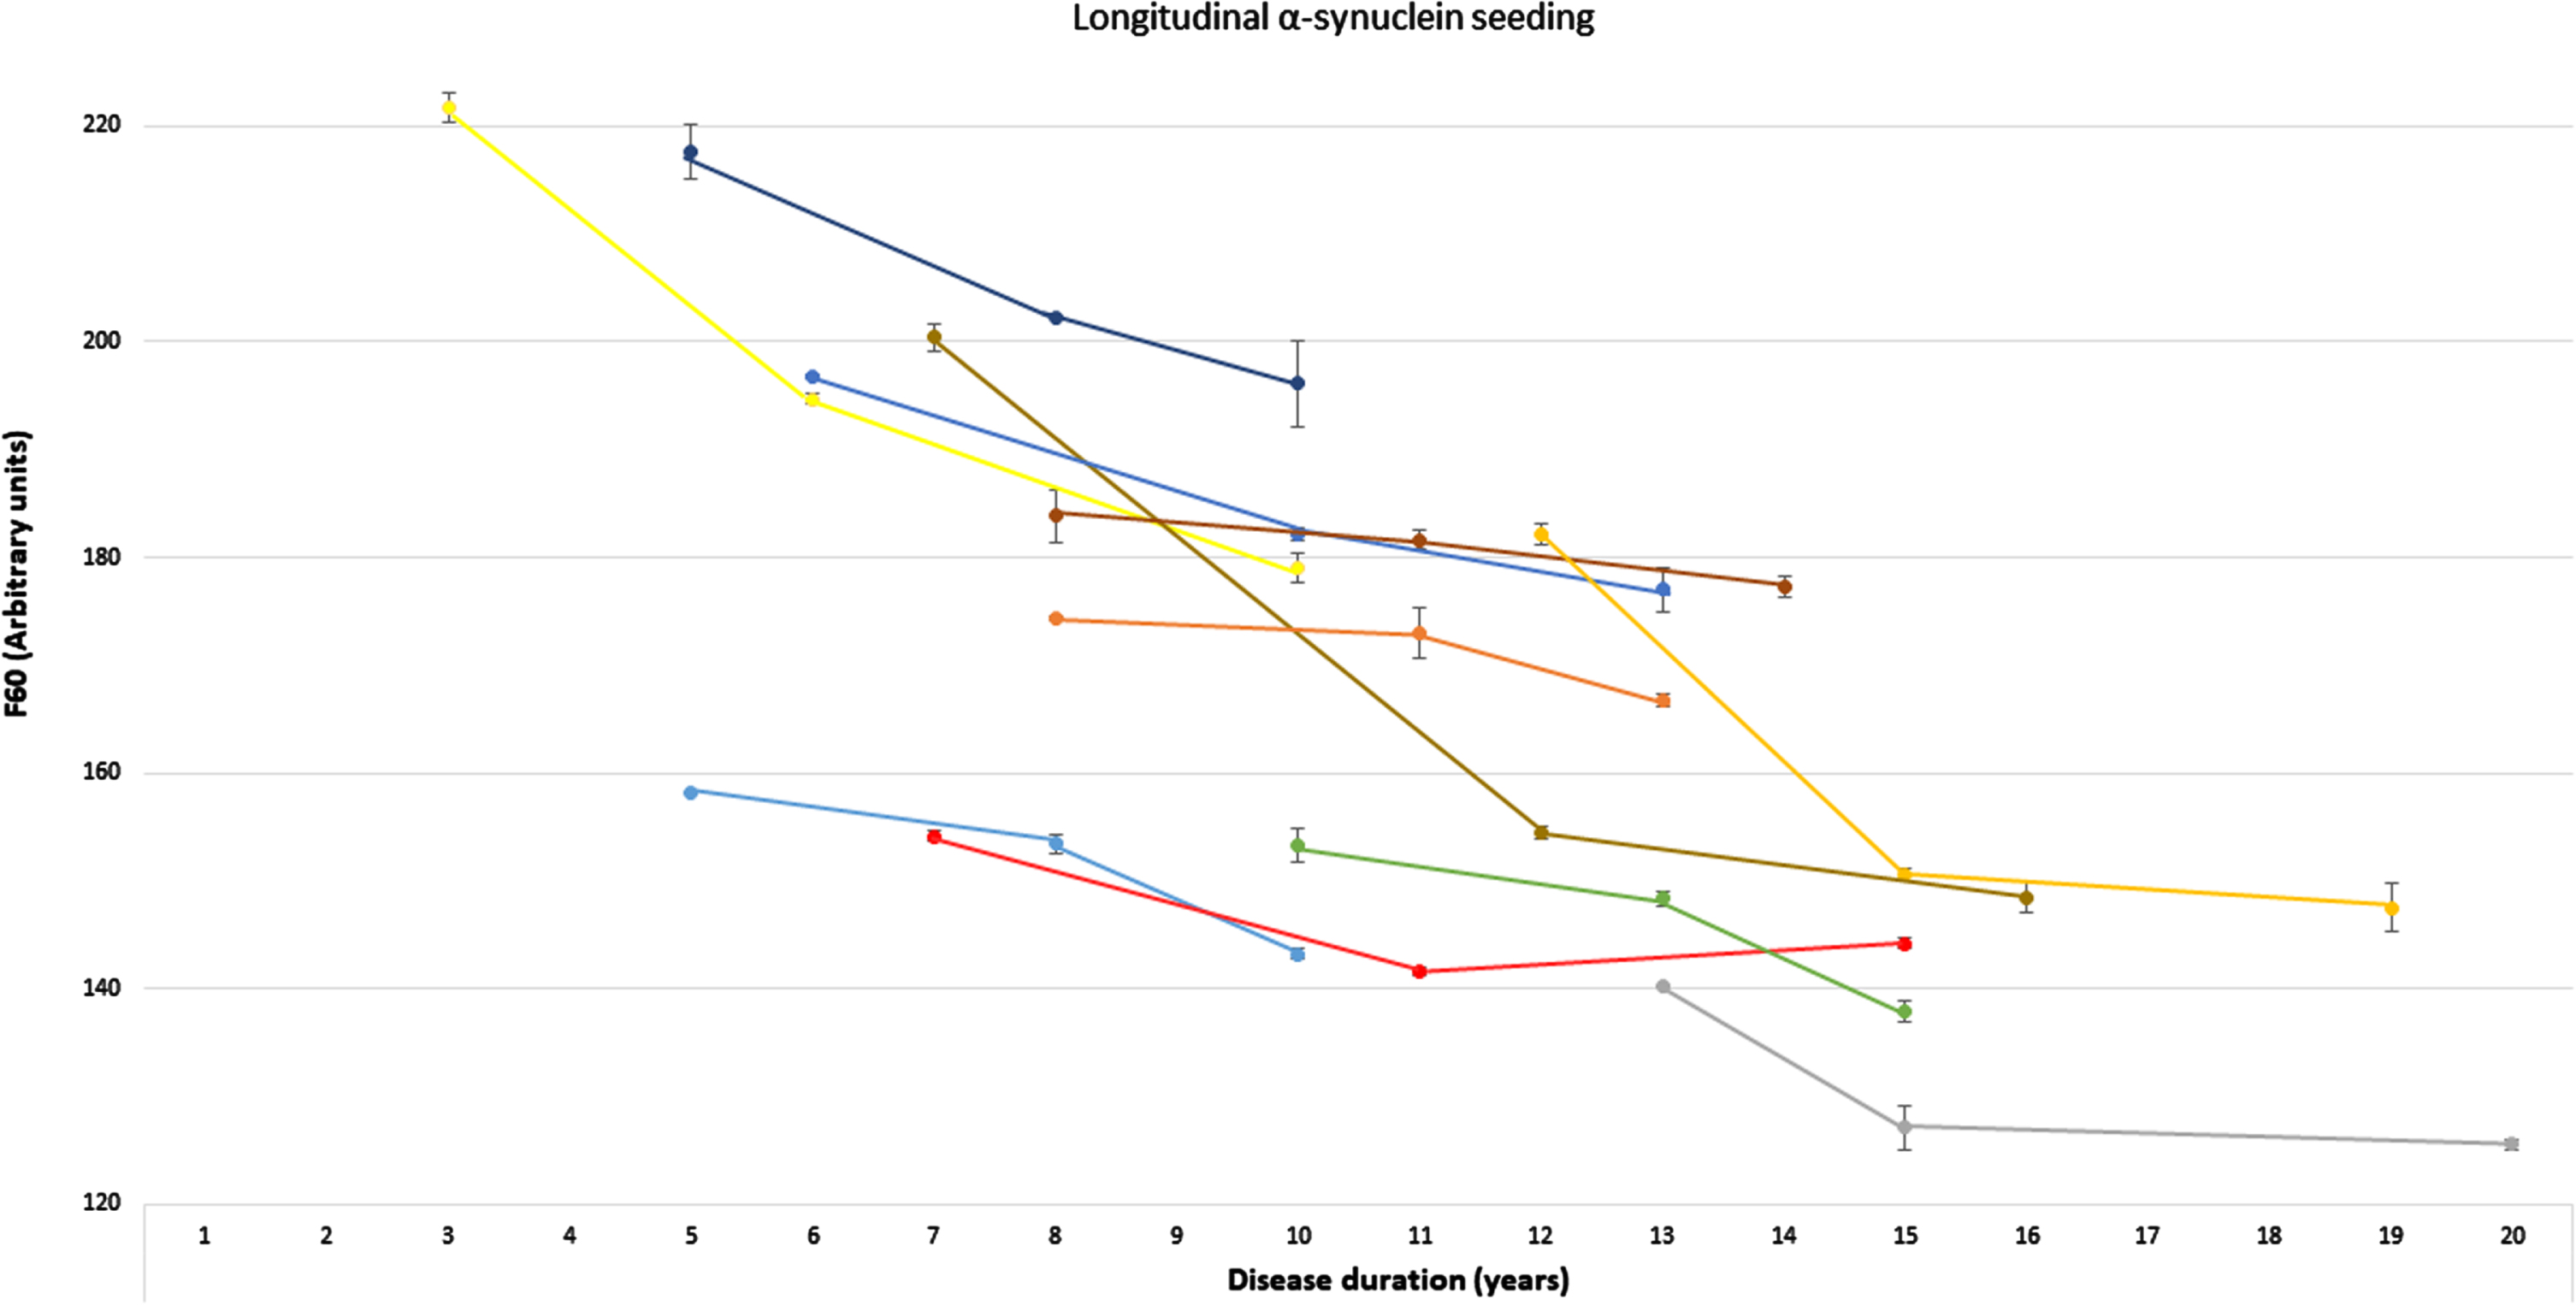
Longitudinal α-synuclein seeding of individuals with Parkinson’s disease. Presentation of longitudinal values of the α-synuclein seed amplification assay in n = 11 individuals with Parkinson’s disease at three timepoints. α-Synucleins seeding is displayed as Thioflavin T signal intensity after 60 hours (F60). Each colored line represents longitudinal values of one individual with Parkinson’s disease (mean of both replicates, error bars indicate the standard deviation of both replicates). F60, Thioflavin T signal intensity after 60 hours.
Statistical analysis
Statistical analysis was done using SPSS 27.0 (SPSS Inc., IBM). Variables were tested for normal distribution using the Kolmogorov–Smirnov test. Normally distributed variables are presented as mean (standard deviation), non-normally distributed variables as median (range). Differences between groups were calculated using the student’s t-test/ANOVA for normally distributed variables and Mann-Whitney-U/Kruskal-Wallis-H-test for non-normally distributed variables. Dichotomous variables were compared using the Fisher’s Exact test. A p-level of p < 0.05 was accepted for two-group comparisons, multiple group comparisons were Bonferroni-corrected. Spearman’s correlation (two-handed) was applied for correlations.
RESULTS
Clinical characteristics
The PD cohort comprised n = 80 individuals who fulfilled the inclusion criteria, consisting of n = 20 individuals for each disease duration group. Following the α-syn seeding analysis, one PD individual with a disease duration > 15 years was excluded from further analysis (see below). After exclusion of this patient, the four PD disease duration groups included n = 79 individuals (mean age 69 years, standard deviation = 8; 56% male). These PD groups differed significantly regarding age at onset of first motor symptoms, motor function and LEDD, with individuals with longer disease duration having a younger age at the time of diagnosis, higher UPDRS-III scores and higher medication dosages. Cognitive performance was comparable in the four groups (Table 1). For the healthy control cohort n = 20 age- and gender-matched controls were identified (mean age 70 years, standard deviation = 10, 55% male).
Table 1
Clinical characteristics
| [I] PD 0-4 y | [II] PD 5-9 y | [III] PD 10-14 y | [IV] PD > 15 y | Controls | pa | pb | |
| n = 20 | n = 20 | n = 20 | n = 19 | n = 20 | PD vs. controls | PD cohorts | |
| Age (y) | 70 (7) | 70 (8) | 70 (6) | 68 (9) | 70 (10) | 0.94 | 0.83 |
| Male sex | 11 (55%) | 11 (55%) | 11 (55%) | 11 (58%) | 11 (55%) | 0.99 | 0.99 |
| Age at onset (y) | 68 (47-80) | 65 (49-76) | 58 (49-72) | 53 (31-64) | n/a | n/a | <0.001 |
| UPDRS-III (pts) | 24 (4-41) | 35 (11-68) | 37 (10-60) | 35 (17-53) | n/a | n/a | 0.004 |
| LEDD (mg) | 139 (0-660) | 611 (0-1889) | 851 (0-2079) | 1150 (385-2427) | n/a | n/a | <0.001 |
| MoCA (pts) | 26.8 (2.6) | 26.0 (2.0) | 25.8 (2.8) | 25.4 (3.1) | n/a | n/a | 0.43 |
| ThT Intensity | |||||||
| - F60 (AU) | 207.9 | 189.0* | 162.4**†† | 142.5**††‡‡ | 2.6 | <0.001 | <0.001 |
| (162.5-225.4) | (162.9-218.8) | (71.9-196.1) | (125.6-156.1) | (1.4-4.6) | |||
| 95% CI 197.6-211.4 | 95% CI 183.0-197.6 | 95% CI 145.2-169.9 | 95% CI 136.4-145.5 | 95% CI 2.2-3.0 | |||
| - Fmax (AU) | 207.9 | 189.0* | 162.6**†† | 143.0**††‡ | 2.8 | <0.001 | <0.001 |
| (162.9-225.4) | (163.8-218.8) | (73.1-196.8) | (125.9-157.1) | (1.7-4.6) | |||
| 95% CI 205.9-207.9 | 95% CI 183.2-197.8 | 95% CI 145.6-170.1 | 95% CI 136.9-146.3 | 95% CI 2.5-3.2 | |||
| - AUC (AU) | 5536.3 | 4577.0** | 4151.5**† | 3871.8** | 134.2 | <0.001 | <0.001 |
| (4279.3-6162.7) | (3457.7-5652.5) | (2137.2-5746.9) | (3381.7-4245.8) | (78.2-212.4) | |||
| 95% CI 5145.5-5607.4 | 95% CI 4378.7-4958.3 | 95% CI 3694.6-4356.6 | 95% CI 3696.4-3960.4 | 95% CI 125.6-158.0 | |||
| T50 (h) | 34.2 | 36.4 | 35.2 | 33.3‡‡ | 33.9 | 0.67 | <0.001 |
| (31.5-37.0) | (33.3-39.4) | (32.1-37.6) | (31.5-35.8) | (0.0-60) | |||
| 95% CI 33.7-35.1 | 95% CI 35.1-37.0 | 95% CI 34.3-35.7 | 95% CI 32.8-33.9 | 95% CI 22.0-39.7 | |||
| Lag phase (h) | 5.2 | 10.9** | 11.8* | 12.1* | — | — | 0.001 |
| (1.2-11.5) | (4.2-23.0) | (0.0-21.2) | (2.4-22.4) | ||||
| 95% CI 4.3-7.3 | 95% CI 9.5-15.5 | 95% CI 8.2-13.5 | 95% CI 9.7-16.4 |
aComparison of all individuals with PD (n = 79) vs. Healthy Controls (n = 19). bComparison of individuals with PD and different disease duration (I-IV). *p≤0.005, **p≤0.001 compared to (I) PD 0-4 years; †p < 0.005, ††p≤0.001 compared to (II) PD 5–9 years; ‡p≤0.001, ‡‡p≤0.001 compared to (III) PD 10–14 years. Data are mean (SD), median (range) or number of individuals (%). 95% CI, 95% confidence interval; AU, arbitrary units; AUC, area under the curve; F60, Thioflavin T signal intensity after 60 hours; Fmax, Maximum Thioflavin T signal intensity; h, hours; MoCA, Montreal Cognitive Assessment; UPDRS, Unified Parkinson’s Disease Rating Scale Part III; Lag phase, time required to reach the threshold; LEDD, Levodopa equivalent daily dosage; PD, Parkinson’s disease; pts, points; T50, time required to reach 50% of Fmax; ThT, Thioflavin T; y, years.
Cross-sectional α-synuclein seeding
All except one individual with PD had a positive α-syn-SAA. In all patients with positive seeding both replicates were positive. The individual with a negative α-syn-SAA (in both replicates) was in her 50 s, with a disease duration of 17 years, UPDRS-III 8 points and a LEDD of 440 mg. We excluded this individual from further analyses to not increase the effect of disease duration on the analysis. None of the healthy controls showed a positive α-syn seeding (Table 1). In controls, sporadic auto-aggregation of recombinant monomeric α-syn was seen after five to six days, which is well known for α-syn-SAAs and clearly distinct from the seeding of pathological α-syn (Supplementary Figure 3).
Fig. 3
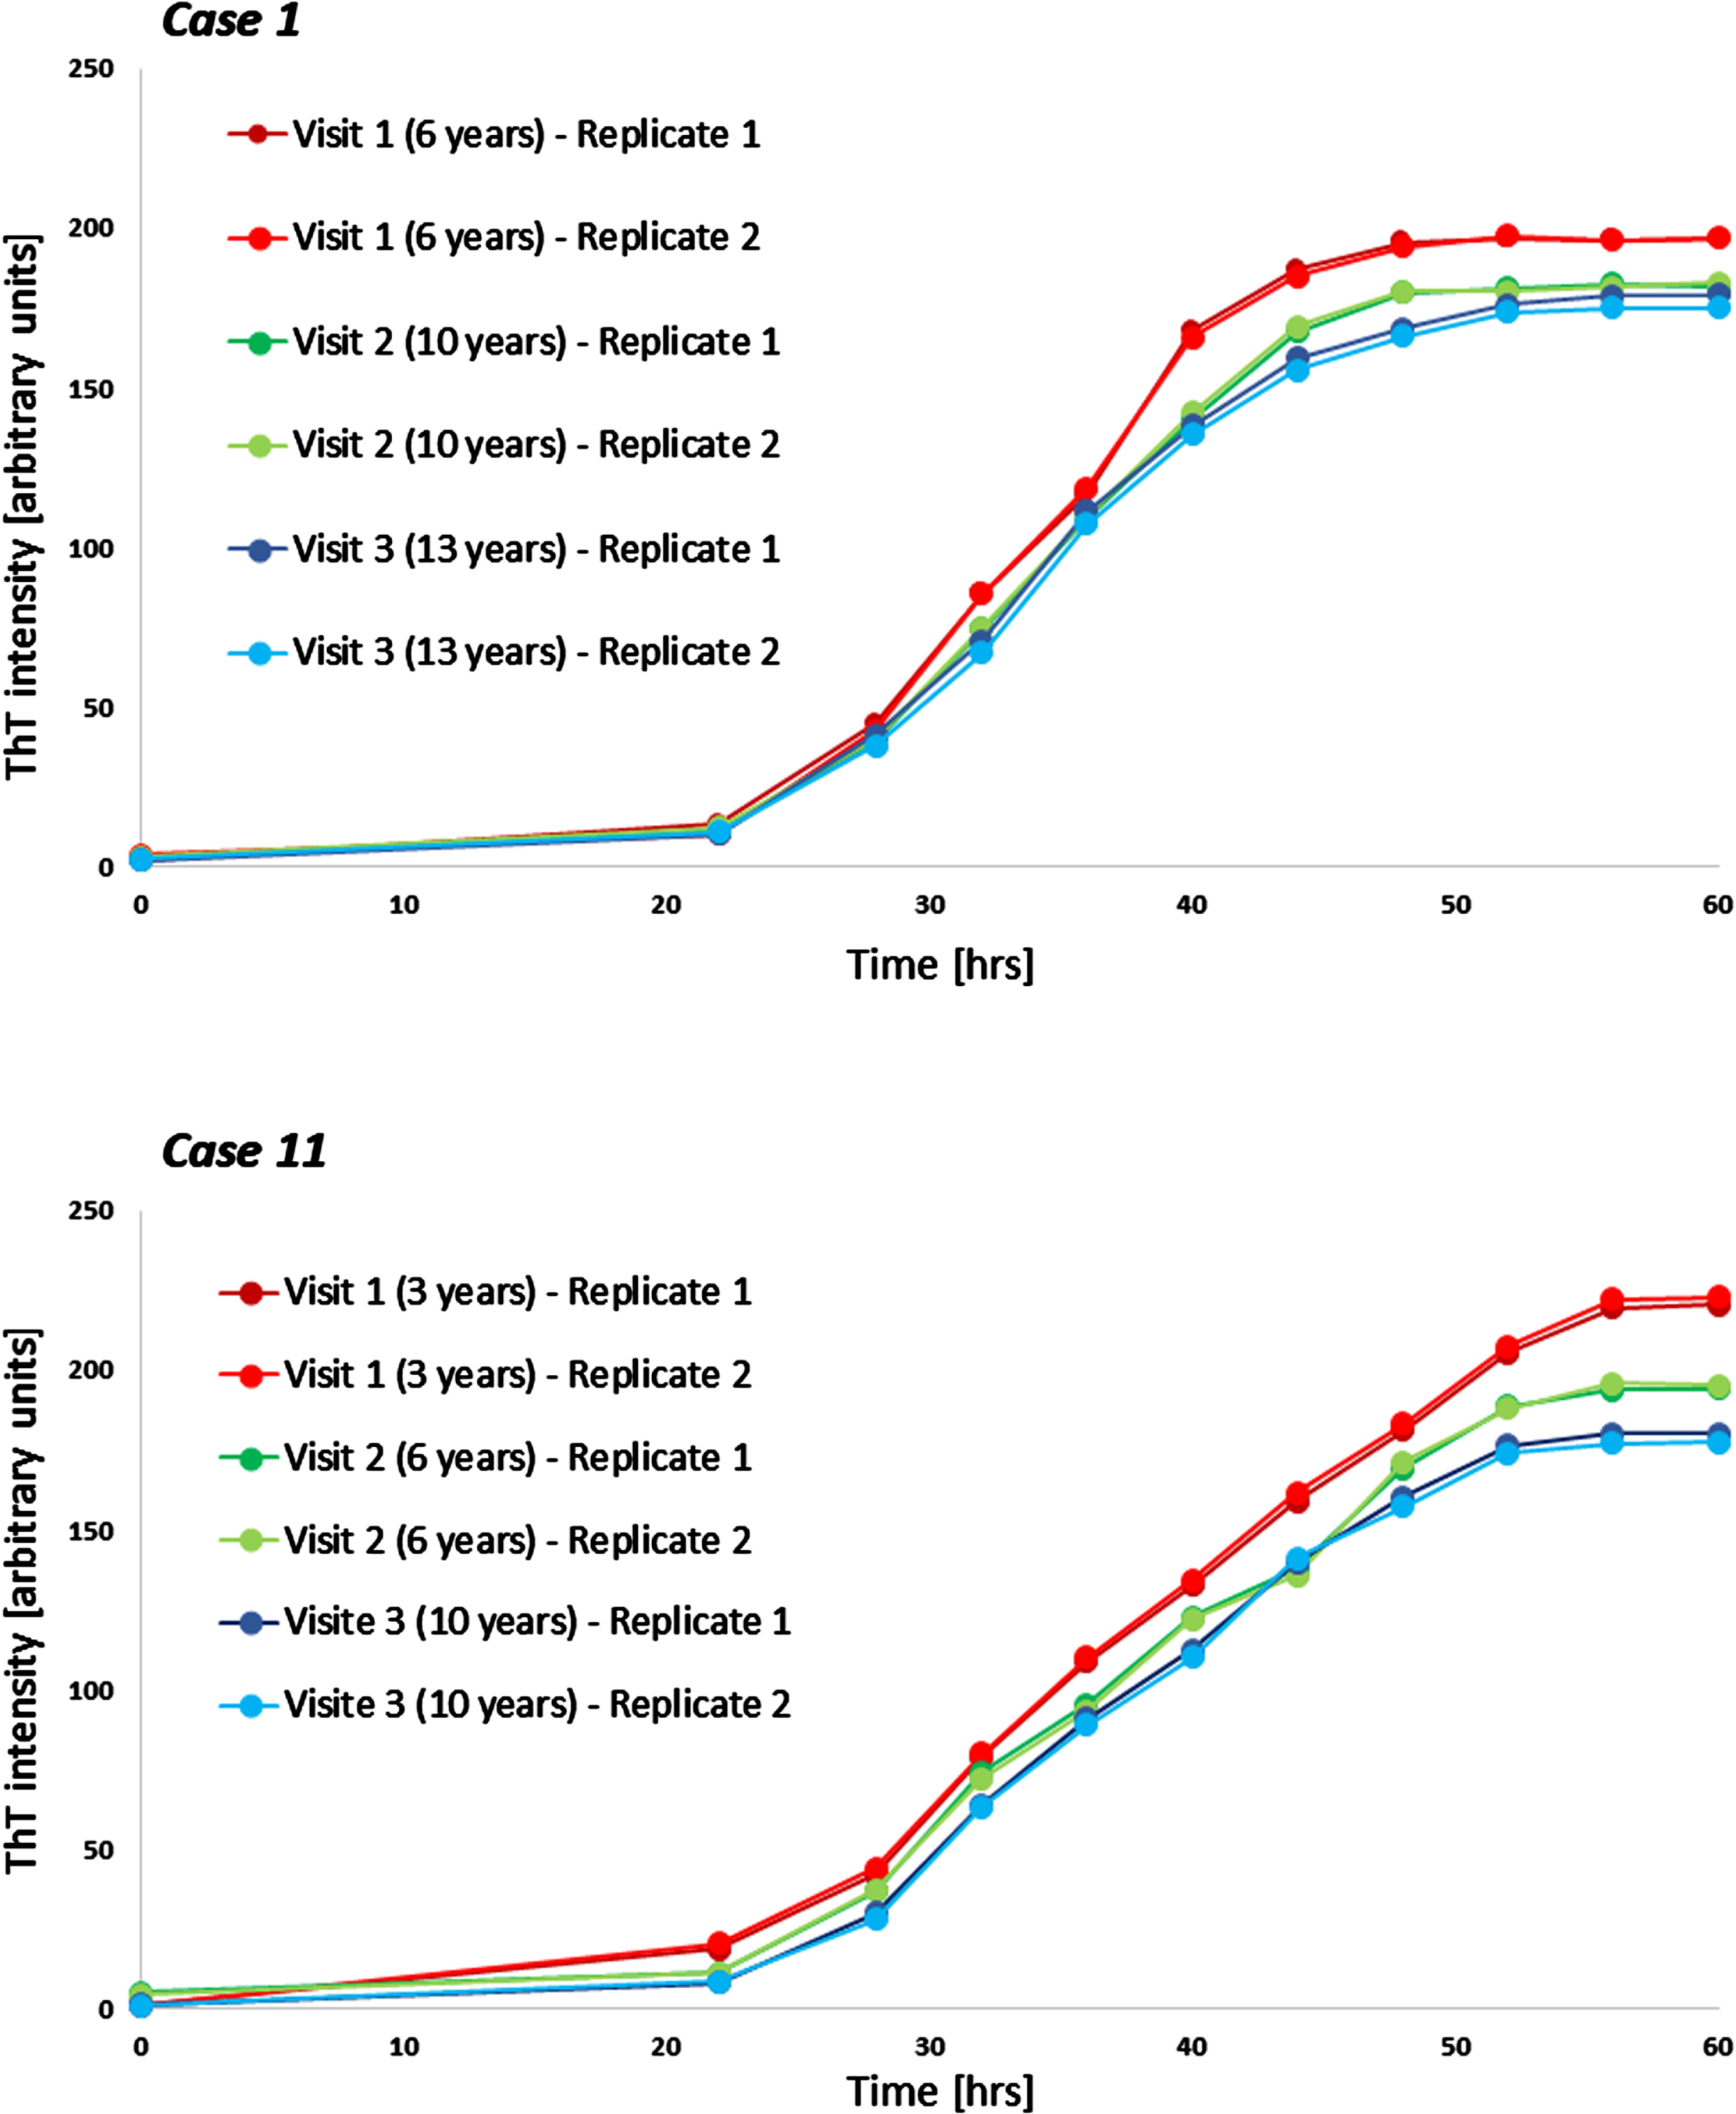
Examples of longitudinal seeding in Parkinson’s disease. Both boxes show individual seeding curves of one individual with Parkinson’s disease measured at three different timepoints (shown are both replicates). The x-axis displays the hours of the α-synuclein seed amplification assay, the y-axis displays the increasing Thioflavin T signal intensity. hrs, hours; ThT, Thioflavin T.
Comparing the PD groups with different disease durations highly significant statistical differences were found between the groups regarding F60, Fmax, AUC, and lag phase, with individuals with the shortest disease duration showing the highest and individuals with the longest disease duration the lowest ThT-intensities and the longest lag phase (Table 1, Fig. 1). Comparisons of T50 showed significant group differences, but without a gradual decrease. F60 of both replicates of all PD patients can be seen in Supplementary Table 1.
Disease duration correlated inversely with α-syn seeding in PD patients, which was highly significant (Spearman correlation F60: –0.817, p < 0.001; Fmax: –0.814, p < 0.001; AUC: –0.756; p < 0.001, Lag phase: 0.340; p = 0.002) (Fig. 1). An inverse correlation was also seen between motor function (UPDRS-III) and α-syn seeding (F60: –0.315, p = 0.005; Fmax: –0.320, p = 0.004; AUC: –0.361, p = 0.001; lag phase 0.244, p = 0.030). No correlation was seen between T50 and disease duration or UPDRS-III.
Longitudinal α-synuclein seeding
Longitudinal blood samples were available for n = 11 of the cross-sectional analyzed PD patients, covering time periods of 5–9 years after first onset of motor symptoms. Of these n = 10 PD patients showed a gradual decrease of α-syn seeding (F60) in the course of the disease. In one person, F60 ThT-intensity decreased from visit 1 to visit 2 (seven to eleven years after first onset of motor symptoms) but increased again in visit 3 (after 15 years) (Table 2, Fig. 2). Examples of longitudinal SAAs are shown in Fig. 3.
Table 2
Longitudinal α-synuclein seeding
| Visit 1 | Visit 2 | Visit 3 | |
| Case 1 Disease duration | 6 | 10 | 13 |
| F60 (AU) | 196.8 (SD 0.2) | 182.2 (SD 0.6) | 177.0 (SD 2.0) |
| Case 2 Disease duration | 8 | 11 | 13 |
| F60 (AU) | 174.4 (SD 0.2) | 173.0 (SD 2.3) | 166.8 (SD 0.6) |
| Case 3 Disease duration | 13 | 15 | 20 |
| F60 (AU) | 140.2 (SD 0.0) | 127.1 (SD 2.0) | 125.6 (SD 0.5) |
| Case 4 Disease duration | 12 | 15 | 19 |
| F60 (AU) | 182.2 (SD 1.0) | 150.6 (SD 0.6) | 147.5 (SD 2.2) |
| Case 5 Disease duration | 5 | 8 | 10 |
| F60 (AU) | 158.2 (SD 0.0) | 153.5 (SD 0.8) | 143.2 (SD 0.5) |
| Case 6 Disease duration | 10 | 13 | 15 |
| F60 (AU) | 153.3 (SD 1.6) | 148.4 (SD 0.7) | 137.9 (SD 1.0) |
| Case 7 Disease duration | 5 | 8 | 10 |
| F60 (AU) | 217.6 (SD 2.5) | 202.2 (SD 0.0) | 196.1 (SD 4.0) |
| Case 8 Disease duration | 8 | 11 | 14 |
| F60 (AU) | 183.8 (SD 2.4) | 181.6 (SD 0.9) | 177.3 (SD 1.0) |
| Case 9 Disease duration | 7 | 11 | 15 |
| F60 (AU) | 154.1 (SD 0.5) | 141.6 (SD 0.4) | 144.2 (SD 0.5) |
| Case 10 Disease duration | 7 | 12 | 16 |
| F60 (AU) | 200.4 (SD1.3) | 154.4 (SD 0.6) | 148.5 (SD 1.5) |
| Case 11 Disease duration | 3 | 6 | 10 |
| F60 (AU) | 221.7 (SD1.3) | 194.7 (SD 0.5) | 179.0 (SD 1.4) |
AU, arbitrary units; F60, Thioflavin T signal intensity after 60 hours; SD, standard deviation of both replicates.
DISCUSSION
We here confirm the already reported [27] very high sensitivity of this blood-based α-syn-SAA in an independent larger cohort, with 79 of 80 PD patients and none of the healthy controls showing seeding activity (sensitivity 98.8%). Moreover, this study demonstrates, to the best of our knowledge for the first time, that α-syn seeding can be detected in the blood up to 24 years after diagnosis and that the signal is strongly and negatively associated with disease duration.
4.1High accuracy of the blood-based α-syn-SAA for PD diagnosis
There is still a major need for an easy to obtain, quantifiable marker reflecting the ongoing neurodegenerative process in PD. So far, SAAs of the CSF and skin yielded a high sensitivity for PD diagnosis, making them promising candidates for a diagnostic and prognostic biomarker in PD [2–12, 14, 16–23, 26].
However, skin biopsies and lumbar punctures are often viewed with reluctance by patients because of the associated invasiveness or possible complications, and these methods involve more effort for the person taking the sample than taking a blood sample. A blood-based biomarker would therefore be particularly attractive. Okuzumi et al. recently published results of a serum-based SAA, using a combined RT-QuiC/immunoprecipitation technique, which reached a similar very high sensitivity for PD vs. healthy controls of 94.6% [15]. Other studies have—similar to our approach—focused on NEs, which can cross the blood brain barrier. Several of these studies showed that α-syn can be detected in plasma-derived NEs and that this technique can distinguish PD from healthy controls, however, so far with lower sensitivity and specificity compared to the here presented blood-based marker [35–40]. In fact, these techniques, that enabled detection of α-syn without amplification of the misfolded protein, allowed the differentiation of patient groups, but so far, a clear separation of single patients or control individuals has not been possible. The here presented technique combines the advantages of α-syn detection in plasma-derived NEs and the use of a SAA to yield a high sensitivity on an individual level. Taken together the here presented blood-based SAA using NEs showed, similar to the blood-based SAA protocol of Okuzumi et al. [15], a higher sensitivity compared to other blood-based approaches. These results are comparable to previously reported sensitivities of CSF SAAs ranging from 86 to 96% [7, 10, 16, 17, 19, 20, 22], with the additional advantage that the sensitivities are reached with a blood-based and thus less invasive approach.
Positive α-syn-SAA up to 24 years after onset of first motor symptoms
Another strength of this study is the evaluation of the SAA in PD patients with very long disease duration. Most of the above-mentioned SAA studies examined individuals in early disease stages, partially following the purpose to validate the value of a SAA as an early diagnostic and discrimination biomarker. Brockmann et al. also included three individuals with bi-allelic recessive genetic mutations and over 20 years disease duration in a CSF-SAA study. However, these individuals (belonging to a specific subtype of PD often not associated with nigrostriatal Lewy bodies) did not show positive a-syn seeding. Hall et al. compared individuals with Parkinson’s Disease Dementia (PDD) and a mean disease duration of 16.8 years and found positive CSF seeding in 100% of PDD and in 94% of PD individuals without dementia [8]. Taken together, the here presented finding of a positive SAA even in late stages of the disease adds important knowledge on the potential use of a blood-based SAA, as one of the individuals with long disease duration did not show positive seeding. This person had, despite a disease duration of 17 years, a fairly low UPDRS-III (8 points) and LEDD (440 mg), implying that the diagnosis of idiopathic PD may not have been correct. Thus, the blood-based SAA might in the future be helpful to reevaluate correct diagnoses in clinical practice even years after diagnosis.
α-syn seeding activity decreases with disease duration
Several of the previous SAA studies investigated a possible correlation between CSF α-syn seeding activity and clinical symptoms or disease duration, yet, with inconclusive results. While three cross-sectional SAA studies found no or only a weak association of α-syn seeding with disease duration or UPDRS scores [10, 16, 17], two other cross-sectional studies found a positive correlation between α-syn seeding activity and Hoehn & Yahr score [21] or UPDRS-III score [3], respectively. Russo et al. compared different SAA techniques at baseline and at a 3 years follow-up and found in only 1/3 SAAs a significant positive correlation between seeding activity and disease duration or UPDRS-III score at baseline [20]. With respect to peripheral tissue/body-fluid studies, two cross-sectional studies found a positive correlation to measures of disease progression with SAA parameters, including a skin biopsy study (positive correlation with disease duration/Hoehn & Yahr scores [12]) and a saliva study (positive correlation with UPDRS-III scores [25]), whereas another skin biopsy study could not confirm a significant association [11]. Taken together, studies from CSF and skin showed inconclusive results on changes in SAAs in the course of the disease. If a change was found, it was primarily a positive correlation. In contrast, the measurement of neurofilament light chain (NfL) showed promising results regarding a correlation with disease duration and severity. Several studies confirmed that higher CSF or serum NfL levels at baseline predicted a faster deterioration of motor and non-motor symptoms as well as a greater reduction of the dopamine transporter binding ratio assessed with DaTscan over time. Moreover, NfL levels correlated positively with a higher disease severity and increased longitudinally in PD patients [41–48]. Thus, the quantification of serum or CSF NfL levels seems to be the most meaningful progression or predictive marker for PD, so far. However, the main limitation of NfL as biomarker for PD is its’ missing specificity for PD, as it is a nonspecific biomarker for neuroaxonal damage in neurodegenerative diseases [49]. Moreover, as many pharmacological studies target α-syn, it would be particularly valuable to assess and potentially predict longitudinal changes of α-syn during the course of the disease.
We here show that measures of α-syn seeding activity in the blood decrease in the course of the disease in both the cross-sectional analysis of four groups of PD patients with different lengths of disease duration and in the longitudinal SAA analysis in individual patients, with follow-up data of 5-9 years. So far, this study cannot explain the pathophysiological processes behind this observation. However, several hypotheses can be drawn: assuming that the here presented SAA data shows changes in arbitrary units of SAA activity, it can be hypothesized that spreading of α-syn is more pronounced in the early stages of the disease, with many neuronal cells being affected and pinching off NEs that contain peripherally measurable α-syn. In later stages of the disease, characterized by an already extensive loss of neurons, less NEs may be secreted and less α-syn seeding may be detected. It is also conceivable that changes in α-syn structure during the spreading process alters seeding activity when isolated from NEs [50]. Another explanation was discussed by Stuendl et al., who found a similar inverse correlation between α-syn in plasma-derived NEs concentration and motor function. They concluded that the decrease of peripheral α-syn might reflect a breakdown of central clearance pathways, which use NEs to eliminate intracellular α-syn to compensate for impaired other pathways of intracellular homeostasis [37]. This might explain the contrasting results to some of the above-mentioned CSF-SAA studies, which found no correlation or even an increase of α-syn seeding activity to clinical markers of disease progression, reflecting the consistent high or increasing load of α-syn in the CNS, while the secretion of NEs decreases. However, as mentioned above, most of the SAA studies performed so far have not included individuals with long disease duration, limiting direct comparisons.
Importantly, it needs to be acknowledged that the here presented SAA technique uses the same amount of recombinant monomer substrate for each individual analysis, assuming that, once an SAA curve reaches a plateau, all monomer substrates have been fully consumed in the reaction. Thus, it remains unclear how different plateaus (Thioflavin T intensities) can be reached with the same amount of monomer substrate. There is a possibility that other mechanisms, such as different strains of α-syn seeds occurring during the course of the disease, may explain the observed differences of seeding plateaus (and different Fmax/F60 values). To explore this question future studies should investigate in detail the end products of the SAA to clarify whether soluble monomers remain after the reaction (in correlation to lower plateaus of the SAA curve and potential differences in ThT intensity values) and compare potential differences of structures or strains of α-syn using electron microscopy.
Regarding the different measures of seeding activity, the strongest correlation between disease duration and SAA values were seen for Fmax, F60 and AUC, while a weaker correlation was found for lag phase and no correlation for T50, indicating that the latter variables might be less relevant to describe changes of seeding activity during the course of the disease.
Limitations
There was only sufficient sequential longitudinal plasma available of 11 of the cross-sectionally analyzed patients. Thus, future studies will need to expand the group of longitudinally assessed PD patients. Due to the limited amount of available plasma material, we only performed duplicate analysis of the SAA, while many previously published (CSF) SAAs performed quadruplicates. However, so far our previous analyses showed no significant test-retest-variability when we performed quadruplicates and there have been several other SAA publications using only two or three replicates [6, 10, 15, 22]. Thus, the use of duplicates can be considered sufficient, but more replicates would be preferable. In this respect, an additional important approach for quantitation of seeding activity would be the performance of serial end-point dilution assays of several replicates. We also did not have other material like CSF to compare with our findings in blood, these comparisons will also be essential in the future. Moreover, further studies should particularly include PDD individuals. Regarding the one PD individual with a negative SAA and a disease duration of 17 years, but only very mild motor impairment and low dopaminergic medication dose, one may speculate that the patient had not idiopathic PD, but instead, e.g., secondary parkinsonism or a benign genetic form of PD. It should be noted that—because of the long disease duration of this individual—an inclusion would have even strengthened the results of our statistical analyses. Finally, it is surprising that none of the healthy controls examined showed positive seeding, which is exceptional compared to other published data on various α-synuclein SAAs. Validation in larger cohorts and comparison with CSF-SAA results are needed to further evaluate these differences in specificity.
We conclude that the here presented α-syn-SAA provides an easy to obtain blood-based biomarker, which can identify individuals with PD with high sensitivity and can be applied even in very late stages of the disease. Moreover, we could demonstrate a highly significant inverse association of α-syn seeding activity and disease duration, which might reflect the ongoing neurodegenerative process in the natural course of PD, including an extensive loss of neurons and/or breakdown of clearance pathways in later stages of the disease. Although findings of different α-syn-SAA protocols in the course of the disease are not conclusive, yet, we believe that the strong finding of our cross-sectional and longitudinal analyses deserves validation and further considerations. If the decline in seeding activity in blood was confirmed, it may influence further studies and our understanding of disease progression. Moreover, impact on clinical studies need to be considered especially regarding antibody-based targeted treatments for PD.
ACKNOWLEDGMENTS
Samples were obtained from the Neuro-Biobank of the University of Tuebingen, Germany (https://www.hih-tuebingen.de/en/about-us/core-facilities/biobank/). This biobank is supported by the local University, the Hertie Institute and the DZNE. We thank all patients for contributing to the biobank.
FUNDING
The authors have no funding to report.
CONFLICT OF INTEREST
ES received grants from the University of Kiel (intramural research funding) and Germany society for Parkinson’s Disease (DPG e.V.), and speaker honoraria from Bayer Vital GmbH, Novartis Pharma GmbH, BIAL GmbH and the Movement Disorder Society outside the submitted work. AK has received research grants from the Michael J. Fox Foundation outside the submitted work. CS, CD, JB, and JW have nothing to report. WM has served on advisory boards of AbbVie, Biogen, Lundbeck, Market Access & Pricing Strategy GmbH, Orion Corporation, Techspert.io and Critical Path for Parkinson's Consortium and has received speaker’s honoraria from AbbVie, Bayer, GlaxoSmithKline, Licher MT, Neuro-Kolleg Online-Live, Rölke Pharma, Takeda, UCB Pharma GmbH, Kyowa Kirin International, and Ology Medical Education outside the submitted work. He was reimbursed consulting fees from EMEA Medical Education Steering Committee for Parkinson’s disease and received grants from Lundbeck, Neuroalliance, European Union, German Federal Ministry of Education of Research, Michael J Fox Foundation, Robert Bosch Foundation, and Sivantos outside the submitted work. DB has received grants or contracts from the German Research Society (DFG), German Parkinson’s Disease Association (dPV), Michael J. Fox Foundation, BMBF, Parkinson Fonds Deutschland gGmbH, UCB Pharma GmbH, Novartis Pharma GmbH, Damp Foundation, and Lundbeck and has received speaker’s honoraria from AbbVie, Biogen, BIAL, UCB Pharma GmbH, Novartis Pharma GmbH, and Desitin outside the submitted work. She has served on advisory boards of Biogen, BIAL, UCB Pharma GmbH and AC Immune SA outside the submitted work. The TREND-Study is being and was supported by University Hospital Tübingen, German Center for Neurodegenerative Diseases (DZNE), Hertie Institute for Clinical Brain Research (HIH), Christian-Albrechts-University of Kiel, and University Hospital Schleswig-Holstein. Until 2017, subprojects were co-funded by Centre for Integrative Neuroscience (CIN), TEVA Pharmaceutical Industries Ltd, UCb, Janssen Pharmaceuticals, Inc. and International Parkinson Fonds. DB is an Editorial Board Member of this journal but was not involved in the peer-review process nor had access to any information regarding its peer-review.
DATA AVAILABILITY
The data supporting the findings of this study are available on reasonable request from the corresponding author. The data are not publicly available due to privacy or ethical restrictions.
SUPPLEMENTARY MATERIAL
[1] The supplementary material is available in the electronic version of this article: https://dx.doi.org/10.3233/JPD-230390.
REFERENCES
[1] | Srivastava A , Alam P , Caughey B ((2022) ) RT-QuIC and related assays for detecting and quantifying prion-like pathological seeds of α-synuclein. Biomolecules 12: , 576. |
[2] | Bargar C , Wang W , Gunzler SA , LeFevre A , Wang Z , Lerner AJ , Singh N , Tatsuoka C , Appleby B , Zhu X , Xu R , Haroutunian V , Zou W-Q , Ma J , Chen SG ((2021) ) Streamlined alpha-synuclein RT-QuIC assay for various biospecimens in Parkinson’s disease and dementia with Lewy bodies. Acta Neuropathol Commun 9: , 62. |
[3] | Brockmann K , Quadalti C , Lerche S , Rossi M , Wurster I , Baiardi S , Roeben B , Mammana A , Zimmermann M , Hauser A-K , Deuschle C , Schulte C , Waniek K , Lachmann I , Sjödin S , Brinkmalm A , Blennow K , Zetterberg H , Gasser T , Parchi P ((2021) ) Association between CSF alpha-synuclein seeding activity and genetic status in Parkinson’s disease and dementia with Lewy bodies. Acta Neuropathol Commun 9: , 175. |
[4] | Compta Y , Painous C , Soto M , Pulido-Salgado M , Fernández M , Camara A , Sánchez V , Bargalló N , Caballol N , Pont-Sunyer C , Buongiorno M , Martin N , Basora M , Tio M , Giraldo DM , Pérez-Soriano A , Zaro I , Muñoz E , Martí MJ , Valldeoriola F ((2022) ) Combined CSF α-SYNRT-QuIC, CSF NFL and midbrain-pons planimetry in degenerativeparkinsonisms: From bedside to bench, and back again. Parkinsonism Relat Disord 99: , 33–41. |
[5] | Donadio V , Wang Z , Incensi A , Rizzo G , Fileccia E , Vacchiano V , Capellari S , Magnani M , Scaglione C , Stanzani Maserati M , Avoni P , Liguori R , Zou W ((2021) ) In vivo diagnosis of synucleinopathies. Neurology 96: , e2513–e2524. |
[6] | Fairfoul G , McGuire LI , Pal S , Ironside JW , Neumann J , Christie S , Joachim C , Esiri M , Evetts SG , Rolinski M , Baig F , Ruffmann C , Wade-Martins R , Hu MTM , Parkkinen L , Green AJE ((2016) ) Alpha-synuclein RT-QuIC in the CSF of patients with alpha-synucleinopathies. Ann Clin Transl Neurol 3: , 812–818. |
[7] | Groveman BR , Orrù CD , Hughson AG , Raymond LD , Zanusso G , Ghetti B , Campbell KJ , Safar J , Galasko D , Caughey B ((2018) ) Rapid andultra-sensitive quantitation of disease-associatedα-synuclein seeds in brain and cerebrospinal fluid byαSyn RT-QuIC. Acta Neuropathol Commun 6: , 7. |
[8] | Hall S , Orrù CD , Serrano GE , Galasko D , Hughson AG , Groveman BR , Adler CH , Beach TG , Caughey B , Hansson O ((2022) ) Performance ofαSynuclein RT-QuIC in relation to neuropathological stagingof Lewy body disease. Acta Neuropathol Commun 10: , 90. |
[9] | Iranzo A , Fairfoul G , Ayudhaya ACN , Serradell M , Gelpi E , Vilaseca I , Sanchez-Valle R , Gaig C , Santamaria J , Tolosa E , Riha RL , Green AJE ((2021) ) Detection of α-synuclein in CSF by RT-QuIC in patients with isolated rapid-eye-movement sleep behaviour disorder: A longitudinal observational study. Lancet Neurol 20: , 203–212. |
[10] | Kang UJ , Boehme AK , Fairfoul G , Shahnawaz M , Ma TC , Hutten SJ , Green A , Soto C ((2019) ) Comparative study of cerebrospinal fluid α-synuclein seeding aggregation assays for diagnosis of Parkinson’s disease. Mov Disord 34: , 536–544. |
[11] | Kuzkina A , Panzer C , Seger A , Schmitt D , Rößle J , Schreglmann SR , Knacke H , Salabasidou E , Kohl A , Sittig E , Barbe M , Berg D , Volkmann J , Sommer C , Oertel WH , Schaeffer E , Sommerauer M , Janzen A , Doppler K ((2023) ) Dermal real-time quaking-induced conversion is a sensitive marker to confirm isolated rapid eye movement sleep behavior disorder as an early α-synucleinopathy. Mov Disord 38: , 1077–1082. |
[12] | Kuzkina A , Bargar C , Schmitt D , Rößle J , Wang W , Schubert A-L , Tatsuoka C , Gunzler SA , Zou W-Q , Volkmann J , Sommer C , Doppler K , Chen SG ((2021) ) Diagnostic value of skin RT-QuIC in Parkinson’s disease: A two-laboratory study. NPJ Parkinsons Dis 7: , 99. |
[13] | Luan M , Sun Y , Chen J , Jiang Y , Li F , Wei L , Sun W , Ma J , Song L , Liu J , Liu B , Pei Y , Wang Z , Zhu L , Deng J ((2022) ) Diagnostic value of salivary real-time quaking-induced conversion in Parkinson’s disease and multiple system atrophy. Mov Disord 37: , 1059–1063. |
[14] | Martinez-Valbuena I , Visanji NP , Olszewska DA , Sousa M , Bhakta P , Vasilevskaya A , Anastassiadis C , Tartaglia MC , Kovacs GG , Lang AE ((2022) ) Combining skin α-synuclein real-time quaking-induced conversion and circulating neurofilament light chain to distinguish multiple system atrophy and Parkinson’s disease. Mov Disord 37: , 648–650. |
[15] | Okuzumi A , Hatano T , Matsumoto G , Nojiri S , Ueno S , Imamichi-Tatano Y , Kimura H , Kakuta S , Kondo A , Fukuhara T , Li Y , Funayama M , Saiki S , Taniguchi D , Tsunemi T , McIntyre D , Gérardy J-J , Mittelbronn M , Kruger R , Uchiyama Y , Nukina N , Hattori N ((2023) ) Propagative α-synuclein seeds as serum biomarkers for synucleinopathies. Nat Med 29: , 1448–1455. |
[16] | Orrù CD , Ma TC , Hughson AG , Groveman BR , Srivastava A , Galasko D , Angers R , Downey P , Crawford K , Hutten SJ , Kang UJ , Caughey B ((2021) ) A rapid α-synuclein seed assay of Parkinson’sdisease CSF panel shows high diagnostic accuracy. Ann ClinTransl Neurol 8: , 374–384. |
[17] | Poggiolini I , Gupta V , Lawton M , Lee S , El-Turabi A , Querejeta-Coma A , Trenkwalder C , Sixel-Döring F , Foubert-Samier A , Pavy-Le Traon A , Plazzi G , Biscarini F , Montplaisir J , Gagnon J-F , Postuma RB , Antelmi E , Meissner WG , Mollenhauer B , Ben-Shlomo Y , Hu MT , Parkkinen L ((2021) ) Diagnostic value of cerebrospinal fluid alpha-synuclein seed quantification in synucleinopathies. Brain 145: , 584–595. |
[18] | Quadalti C , Calandra-Buonaura G , Baiardi S , Mastrangelo A , Rossi M , Zenesini C , Giannini G , Candelise N , Sambati L , Polischi B , Plazzi G , Capellari S , Cortelli P , Parchi P ((2021) ) Neurofilament light chain and α-synuclein RT-QuIC as differential diagnostic biomarkers in parkinsonisms and related syndromes. NPJ Parkinsons Dis 7: , 93. |
[19] | Rossi M , Candelise N , Baiardi S , Capellari S , Giannini G , Orrù CD , Antelmi E , Mammana A , Hughson AG , Calandra-Buonaura G , Ladogana A , Plazzi G , Cortelli P , Caughey B , Parchi P ((2020) ) UltrasensitiveRT-QuIC assay with high sensitivity and specificity for Lewybody-associated synucleinopathies. Acta Neuropathol 140: , 49–62. |
[20] | Russo MJ , Orru CD , Concha-Marambio L , Giaisi S , Groveman BR , Farris CM , Holguin B , Hughson AG , LaFontant D-E , Caspell-Garcia C , Coffey CS , Mollon J , Hutten SJ , Merchant K , Heym RG , Soto C , Caughey B , Kang UJ ((2021) ) High diagnostic performance of independent alpha-synuclein seed amplification assays for detection of early Parkinson’s disease. Acta Neuropathol Commun 9: , 179. |
[21] | Shahnawaz M , Tokuda T , Waragai M , Mendez N , Ishii R , Trenkwalder C , Mollenhauer B , Soto C ((2017) ) Development of a biochemical diagnosis of Parkinson disease by detection of α-synuclein misfolded aggregates in cerebrospinal fluid. JAMA Neurol 74: , 163–172. |
[22] | Siderowf A , Concha-Marambio L , Lafontant DE , Farris CM , Ma Y , Urenia PA , Nguyen H , Alcalay RN , Chahine LM , Foroud T , Galasko D , Kieburtz K , Merchant K , Mollenhauer B , Poston KL , Seibyl J , Simuni T , Tanner CM , Weintraub D , Videnovic A , Choi SH , Kurth R , Caspell-Garcia C , Coffey CS , Frasier M , Oliveira LMA , Hutten SJ , Sherer T , Marek K , Soto C; ; Parkinson’s Progression Markers Initiative ((2023) ) Assessment of heterogeneity among participants in the Parkinson’s Progression Markers Initiative cohort using α-synuclein seed amplification: A cross-sectional study. Lancet Neurol 22: , 407–417. |
[23] | Singer W , Schmeichel AM , Shahnawaz M , Schmelzer JD , Sletten DM , Gehrking TL , Gehrking JA , Olson AD , Suarez MD , Misra PP , Soto C , Low PA ((2021) ) Alpha-synuclein oligomers and neurofilament light chain predict phenoconversion of pure autonomic failure. Ann Neurol 89: , 1212–1220. |
[24] | Stefani A , Iranzo A , Holzknecht E , Perra D , Bongianni M , Gaig C , Heim B , Serradell M , Sacchetto L , Garrido A , Capaldi S , Sáanchez-Gómez A , Cecchini MP , Mariotto S , Ferrari S , Fiorini M , Schmutzhard J , Cocchiara P , Vilaseca I , Brozzetti L , Monaco S , Jose Marti M , Seppi K , Tolosa E , Santamaria J , Högl B , Poewe W , Zanusso G , SINBAR (Sleep Innsbruck Barcelona) group ((2021) ) Alpha-synuclein seeds in olfactory mucosa of patients with isolated REM sleep behaviour disorder. Brain 144: , 1118–1126. |
[25] | Vivacqua G , Mason M , De Bartolo MI , Węegrzynowicz M , Calò L , Belvisi D , Suppa A , Fabbrini G , Berardelli A , Spillantini M ((2023) ) Salivary α-synuclein RT-QuIC correlates with diseaseseverity in de novo Parkinson’s disease. Mov Disord 38: , 153–155. |
[26] | Wang Z , Becker K , Donadio V , Siedlak S , Yuan J , Rezaee M , Incensi A , Kuzkina A , Orrú CD , Tatsuoka C , Liguori R , Gunzler SA , Caughey B , Jimenez-Capdeville ME , Zhu X , Doppler K , Cui L , Chen SG , Ma J , Zou W-Q ((2021) ) Skin α-synuclein aggregation seedingactivity as a novel biomarker for Parkinson disease. JAMA Neurol 78: , 30–40. |
[27] | Kluge A , Bunk J , Schaeffer E , Drobny A , Xiang W , Knacke H , Bub S , Lückstädt W , Arnold P , Lucius R , Berg D , Zunke F ((2022) ) Detection of neuron-derived pathological α-synuclein in blood. Brain 145: , 3058–3071. |
[28] | Postuma RB , Berg D , Stern M , Poewe W , Olanow CW , Oertel W , Obeso J , Marek K , Litvan I , Lang AE , Halliday G , Goetz CG , Gasser T , Dubois B , Chan P , Bloem BR , Adler CH , Deuschl G ((2015) ) MDS clinical diagnostic criteria for Parkinson’s disease. Mov Disord 30: , 1591–1601. |
[29] | Nasreddine ZS , Phillips NA , Bédirian V , Charbonneau S , Whitehead V , Collin I , Cummings JL , Chertkow H ((2005) ) The Montreal Cognitive Assessment, MoCA: A brief screening tool for mild cognitive impairment. J Am Geriatr Soc 53: , 695–699. |
[30] | Rai GS ((1993) ) The Mini-Mental State Examination. J Am Geriatr Soc 41: , 346. |
[31] | Fasnacht JS , Wueest AS , Berres M , Thomann AE , Krumm S , Gutbrod K , Steiner LA , Goettel N , Monsch AU ((2023) ) Conversion between the Montreal Cognitive Assessment and the Mini-Mental Status Examination. J Am Geriatr Soc 71: , 869–879. |
[32] | Movement Disorder Society Task Force on Rating Scales for Parkinson’s Disease ((2003) ) The Unified Parkinson’s Disease Rating Scale (UPDRS): Status and recommendations. Mov Disord 18: , 738–750. |
[33] | Goetz CG , Tilley BC , Shaftman SR , Stebbins GT , Fahn S , Martinez-Martin P , Poewe W , Sampaio C , Stern MB , Dodel R , Dubois B , Holloway R , Jankovic J , Kulisevsky J , Lang AE , Lees A , Leurgans S , LeWitt PA , Nyenhuis D , Olanow CW , Rascol O , Schrag A , Teresi JA , van Hilten JJ , LaPelle N , Movement Disorder Society UPDRS Revision Task Force ((2008) ) Movement Disorder Society-sponsored revision of the Unified Parkinson’s Disease Rating Scale (MDS-UPDRS): Scale presentation and clinimetric testing results. Mov Disord 23: , 2129–2170. |
[34] | Hentz JG , Mehta SH , Shill HA , Driver-Dunckley E , Beach TG , Adler CH ((2015) ) Simplified conversion method for unified Parkinson’s disease rating scale motor examinations. Mov Disord 30: , 1967–1970. |
[35] | Zhao Z-H , Chen Z-T , Zhou R-L , Zhang X , Ye Q-Y , Wang Y-Z ((2019) ) Increased DJ-1 and α-synuclein in plasma neural-derived exosomes as potential markers for Parkinson’s disease. Front Aging Neurosci 10: , 438. |
[36] | Niu M , Li Y , Li G , Zhou L , Luo N , Yao M , Kang W , Liu J ((2020) ) A longitudinal study on α-synuclein in plasma neuronal exosomes as a biomarker for Parkinson’s disease development and progression. Eur J Neurol 27: , 967–974. |
[37] | Stuendl A , Kraus T , Chatterjee M , Zapke B , Sadowski B , Moebius W , Hobert MA , Deuschle C , Brockmann K , Maetzler W , Mollenhauer B , Schneider A ((2021) ) α-synuclein in plasma-derived extracellular vesicles is a potential biomarker of Parkinson’s disease. Mov Disord 36: , 2508–2518. |
[38] | Meloni M , Agliardi C , Guerini FR , Zanzottera M , Bolognesi E , Picciolini S , Marano M , Magliozzi A , Di Fonzo A , Arighi A , Fenoglio C , Franco G , Arienti F , Saibene FL , Navarro J , Clerici M ((2023) ) Oligomeric α-synuclein and tau aggregates in NDEVs differentiate Parkinson’s disease from atypical parkinsonisms. Neurobiol Dis 176: , 105947. |
[39] | Jiang C , Hopfner F , Katsikoudi A , Hein R , Catli C , Evetts S , Huang Y , Wang H , Ryder JW , Kuhlenbaeumer G , Deuschl G , Padovani A , Berg D , Borroni B , Hu MT , Davis JJ , Tofaris GK ((2020) ) Serum neuronal exosomes predict and differentiate Parkinson’s disease from atypical parkinsonism. J Neurol Neurosurg Psychiatry 91: , 720–729. |
[40] | Jiang C , Hopfner F , Berg D , Hu MT , Pilotto A , Borroni B , Davis JJ , Tofaris GK ((2021) ) Validation of α-synuclein in L1CAM-immunocaptured exosomes as a biomarker for the stratification of parkinsonian syndromes. Mov Disord 36: , 2663–2669. |
[41] | Lin C-H , Li C-H , Yang K-C , Lin F-J , Wu C-C , Chieh J-J , Chiu M-J ((2019) ) Blood NfL: A biomarker for disease severity and progression in Parkinson disease. Neurology 93: , e1104–e1111. |
[42] | Pilotto A , Imarisio A , Conforti F , Scalvini A , Masciocchi S , Nocivelli S , Turrone R , Gipponi S , Cottini E , Borroni B , Rizzetti MC , Pizzi M , Bonanni L , Sturchio A , Espay AJ , Zetterberg H , Ashton NJ , Hye A , Padovani A ((2021) ) Plasma NfL, clinical subtypes and motor progression in Parkinson’s disease. Parkinsonism Relat Disord 87: , 41–47. |
[43] | Liu Y , Dou K , Xue L , Li X , Xie A ((2022) ) Neurofilament light as a biomarker for motor decline in Parkinson’s disease. Front Neurosci 16: , 959261. |
[44] | Mollenhauer B , Dakna M , Kruse N , Galasko D , Foroud T , Zetterberg H , Schade S , Gera RG , Wang W , Gao F , Frasier M , Chahine LM , Coffey CS , Singleton AB , Simuni T , Weintraub D , Seibyl J , Toga AW , Tanner CM , Kieburtz K , Marek K , Siderowf A , Cedarbaum JM , Hutten SJ , Trenkwalder C , Graham D ((2020) ) Validation of serum neurofilament light chain as a biomarker of Parkinson’s disease progression. Mov Disord 35: , 1999–2008. |
[45] | Ye R , Locascio JJ , Goodheart AE , Quan M , Zhang B , Gomperts SN ((2021) ) Serum NFL levels predict progression of motor impairment and reduction in putamen dopamine transporter binding ratios in de novo Parkinson’s disease: An 8-year longitudinal study. Parkinsonism Relat Disord 85: , 11–16. |
[46] | Baek MS , Lee MJ , Kim H-K , Lyoo CH ((2021) ) Temporal trajectory of biofluid markers in Parkinson’s disease. Sci Rep 11: , 14820. |
[47] | Ygland Rödström E , Mattsson-Carlgren N , Janelidze S , Hansson O , Puschmann A ((2022) ) Serum neurofilament light chain as a marker of progression in Parkinson’s disease: Long-term observation and implications of clinical subtypes. J Parkinsons Dis 12: , 571–584. |
[48] | Ma L-Z , Zhang C , Wang H , Ma Y-H , Shen X-N , Wang J , Tan L , Dong Q , Yu J-T ((2021) ) Serum neurofilament dynamics predicts cognitive progression in de novo Parkinson’s disease. J Parkinsons Dis 11: , 1117–1127. |
[49] | Wang S-Y , Chen W , Xu W , Li J-Q , Hou X-H , Ou Y-N , Yu J-T , Tan L ((2019) ) Neurofilament light chain in cerebrospinal fluid and blood as a biomarker for neurodegenerative diseases: A systematic review and meta-analysis. J Alzheimers Dis 72: , 1353–1361. |
[50] | Maetzler W , Reimold M , Liepelt I , Solbach C , Leyhe T , Schweitzer K , Eschweiler GW , Mittelbronn M , Gaenslen A , Uebele M , Reischl G , Gasser T , Machulla H-J , Bares R , Berg D ((2008) ) [11C]PIB binding in Parkinson’s disease dementia. Neuroimage 39: , 1027–1033. |


